Abstract
Evidence for a major role of genetic factors in the determination of body mass index (BMI) comes from studies of related individuals. Despite consistent evidence for a heritable component of BMI, estimates of BMI heritability vary widely between studies and the reasons for this remain unclear. While some variation is natural due to differences between populations and settings, study design factors may also explain some of the heterogeneity. We performed a systematic review that identified 88 independent estimates of BMI heritability from twin studies (total 140,525 twins) and 27 estimates from family studies (42,968 family members). BMI heritability estimates from twin studies ranged from 0.47 to 0.90 (5th/50th/95th centiles: 0.58/0.75/0.87) and were generally higher than those from family studies (range: 0.24–0.81; 5th/50th/95th centiles: 0.25/0.46/0.68). Meta-regression of the results from twin studies showed that BMI heritability estimates were 0.07 (P = 0.001) higher in children than in adults; estimates increased with mean age among childhood studies (+0.012/year, P = 0.002), but decreased with mean age in adult studies (−0.002/year, P = 0.002). Heritability estimates derived from AE twin models (which assume no contribution of shared environment) were 0.12 higher than those from ACE models (P < 0.001), whilst lower estimates were associated with self reported versus DNA-based determination of zygosity (−0.04, P = 0.02), and with self reported versus measured BMI (−0.05, P = 0.03). Although the observed differences in heritability according to aspects of study design are relatively small, together, the above factors explained 47% of the heterogeneity in estimates of BMI heritability from twin studies. In summary, while some variation in BMI heritability is expected due to population-level differences, study design factors explained nearly half the heterogeneity reported in twin studies. The genetic contribution to BMI appears to vary with age and may have a greater influence during childhood than adult life.
Introduction
Studies of twins and families have quantified the contribution of genetic variation to inter-individual differences in body mass index (BMI). In the last comprehensive review of BMI heritability, Maes et al. (1997) reported that the proportion of phenotypic variance (VP) that can be attributed to genetic factors (h2) ranged from 0.40 to 0.90 in twin studies and 0.20 to 0.50 in family studies, demonstrating the wide variation in the magnitude of BMI heritability observed both within and between these study designs (Maes et al., 1997). Genome-wide association studies (GWAS) have so far identified 32 loci robustly associated with adult BMI (Frayling et al., 2007; Loos et al., 2008; Thorleifsson et al., 2009; Willer et al., 2009; Speliotes et al., 2010). Despite highly statistically significant associations, these 32 loci account for less than 2% of the total VP in BMI. Sub-genome-wide significant variants may be able to explain a substantial portion of the unexplained genetic variance of complex traits. However, even when considering such variants, the variance explained remains lower than estimates of heritability (Yang et al., 2011) and much attention has been focused on finding the so-called “missing heritability” (Manolio et al., 2009).
Twin studies are used to quantify genetic and environmental contributions to variation in BMI by comparing intra-pair concordance between monozygotic (MZ) twins and dizygotic (DZ) twins. Assignment of zygosity (MZ or DZ) to twin pairs is achieved either using questionnaires or more accurate DNA-based methods. Twin studies model the VP to be the composite of up to four components: (A) additive genetic factors; (D) non-additive or dominant genetic factors; (C) shared environmental factors; and (E) non-shared environmental factors (Neale and Cardon, 1992; Rijsdijk and Sham, 2002). Heritability is usually reported as the proportion of overall VP that can be attributed to additive genetic factors (h2 = A/Vp), as dominant genetic factors (D) are confounded with shared environmental factors (C) and cannot be estimated in the same model. The “best estimate” of heritability is calculated from the statistically best fitting and most parsimonious combination of the three remaining variance components (A, C, and E), determined by sequentially removing components from the model and testing for deterioration in fit in structural equation modeling (Rijsdijk and Sham, 2002; Figure A1 in Appendix).
Quantitative genetic analysis in family studies also allows variance in BMI to be partitioned into genetic and environmental components. Estimates of familiality indicate to what extent members of the same family share traits (representing the A, D, and C components of VP combined) to infer an inherited component. Heritability estimates can be estimated by maximum likelihood variance decomposition (Almasy and Blangero, 1998) or by regressing offspring phenotype onto mean parental phenotype (Lawlor and Mishra, 2009). However, it should be noted that family studies cannot explain to what extent this familial similarity arises from genetic relatedness as opposed to shared environmental factors.
We aimed to identify papers that have estimated the heritability of BMI, and to identify and quantify by meta-regression the effects of demographic and methodological factors that contribute to the heterogeneity between estimates.
Materials and Methods
Literature search
Papers that reported BMI heritability were identified on PubMed. A search was performed in February 2010 with the term “heritability,” combined with the MeSH term “body mass index,” limited to human studies reported in the English language, and this generated 209 papers. Titles and abstracts were assessed for their relevance; inclusion criteria were twin or family studies reporting a quantitative estimate for BMI heritability (h2) as a measure of additive genetic factors (N = 64 papers). Supplementary searches (for example, using the term “genetic contribution” rather than heritability) were performed together with cross-referencing to identify further studies that had not been captured by the original search. For papers duplicating estimates from the same populations, either the study reporting a secondary analysis or using a smaller subset of the dataset was excluded (N = 10). One study was excluded because it reported the heritability of maximal life-time BMI. To enable a quantitative meta-analysis, measures of uncertainty for the heritability estimates were required. For twin study papers not reporting SE or confidence intervals, heritability, and confidence intervals were calculated directly. This calculation was not possible if twin studies also did not report MZ/DZ correlations (N = 6), mean BMI by zygosity (N = 4), or SD of mean BMI by zygosity (N = 2). Family studies not reporting SE or confidence intervals for BMI heritability were also excluded (N = 6). In total, 31 papers reporting twin studies and 25 papers reporting family studies were eligible for inclusion (Figure A2 in Appendix); many of these papers reported estimates from more than one study.
Data extraction and classification
Estimates of BMI heritability as a measure of additive genetic components were extracted from each paper, where possible by independent subgroup based on sex, age group, ethnicity, or setting, the source study and, in twin studies, whether twins were raised apart or together. Information was also obtained on the location of the study, the study to which the twins or family members were recruited (where relevant) and the mean age, age range, and number of participants in each study. Twin studies were categorized according to: whether they were conducted in adults (>18 years) or children (≤18 years); the variance component model used to derive the best heritability estimates (ACE versus AE); the method used to assign zygosity (DNA or biological versus questionnaire); and whether BMI was calculated from objective measurements or self reported body size. Where studies had used mixed strategies to determine twin zygosity, for example if they DNA tested uncertain cases, they were categorized as using a DNA-based/biological strategy.
Statistical analysis
For studies that did not report measures of uncertainty around BMI heritability, heritability estimates, and their confidence intervals were re-calculated using OpenMx (Boker et al., 2011). Firstly, datasets were simulated based on the reported number of MZ and DZ twins in each study and the mean and SD of BMI in each class of twins. Structural equation modeling was then used to decompose the variance in BMI into additive genetic, shared environmental and unique environmental components based on intra-class correlations of BMI in MZ and DZ twin pairs. In studies that reported heritability from AE models, we also excluded the C component in our re-calculation. To make this analysis more robust, a bootstrapping approach was applied, whereby twin pairs were sampled 1,000 times for each heritability estimate. Re-calculated estimates were highly correlated with originally reported estimates (r = 0.91).
A meta-analysis of the reported or re-calculated estimates of heritability from each study was performed separately for twin and family studies using metan in Stata (Version 11.0). A random effects model was used which accounts for inter-study heterogeneity. Where possible, estimates from men and women were included separately in the twin study meta-analysis, and subgroup estimates by sex were calculated. In longitudinal studies, the baseline heritability or the estimate based on the measurement with largest number of twins was selected. To investigate potential explanations for heterogeneity in estimates across twin studies, random effects meta-regression analyses were conducted using the metareg (Sharp, 1998; Harbord and Steichen, 2004) command in Stata. In these analyses, weights are assigned according to the inverse of the total variance, comprising the individual study variance and the residual between study variance. The influence of sex, age, setting (populations of white compared with East Asian descent), publication year, sample size, choice of variance component model, method used to determine zygosity and method used to determine BMI were quantified. To test for effects of age on BMI heritability, twin study estimates from adults versus children were compared. Secondly, as we have observed biphasic patterns of age modification of genetic effects of FTO and MC4R on BMI and body weight (Hardy et al., 2010), a meta-regression of mean age (or, when this was not reported, the mid-point of the age range as a proxy) was performed in childhood and adulthood studies separately. A similar meta-regression was performed on family study estimates to test for any detectable effects of sample size, mean, or mid age of participants, publication year, and setting of the study (US or European versus East Asian).
The overall heterogeneity in BMI estimates explained by all significant factors was calculated as the proportion of the τ2 statistic, which measures between study variance (Thompson and Sharp, 1999), that is accounted for when including these covariates in a meta-regression model. This analysis was based on 70 heritability estimates which could be categorized into adulthood or childhood, AE or ACE models, biological or questionnaire-based zygosity determination and self report or objective BMI assessment.
Results
Twin studies
A total of 88 independent estimates of BMI heritability from twin studies were identified from 31 papers (Stunkard et al., 1986, 1990; Hewitt et al., 1991; Korkeila et al., 1991; Neale and Cardon, 1992; Carmichael and McGue, 1995; Forbes et al., 1995; Harris et al., 1995; Herskind et al., 1996; Austin et al., 1997; Faith et al., 1999; Knoblauch et al., 1999; Narkiewicz et al., 1999; Pietilainen et al., 1999; Vinck et al., 1999; Baird et al., 2001; Poulsen et al., 2001; Schousboe et al., 2003, 2004; Nelson et al., 2006; Cornes et al., 2007; Hur, 2007; Ordonana et al., 2007; Silventoinen et al., 2007a,b; Souren et al., 2007; Hur et al., 2008; Liu et al., 2008; Wardle et al., 2008; Lajunen et al., 2009; Watson et al., 2010; Table 1; Figure A2 in Appendix). Reported estimates ranged from 0.47 to 0.90 (5th/50th/95th centiles: 0.58/0.75/0.87; Figure 1). In some papers, estimates were reported separately by sex, age subgroup, or geographical location. The overall sample represented a total of 171,227 twins and, allowing for a maximum potential overlap of 30,702 twins between the study samples, the pooled analysis comprised at least 140,525 independent twins. Between study heterogeneity across these estimates was substantial (I2 = 86.1%, P < 0.001; Figure 2).
Table 1
| Reference | Location | Source | N | Mean age (range) | Zygosity determinant | BMI measure | Best fitting model | Heritability estimate | |
|---|---|---|---|---|---|---|---|---|---|
| Sex | 95% CI | ||||||||
| Watson et al. (2010) | USA | University of Washington Twin Registry | 1,224 | 36.9 (>18) | Questionnaire | Self report | ACE | 0.76 (m/f) | 0.54, 0.80 |
| Lajunen et al. (2009) | Finland | FinnTwin12 Study | 4,650 | 11.4 (11–12) | Questionnaire | Self report | ACE | 0.69 (m) 0.58 (f) | 0.56, 0.84 0.44, 0.74 |
| Hur et al. (2008)a | Australia (A), Finland (F), Netherlands (N), USA (U) | Study of melanoma risk factors, FinnTwin12, Netherlands Twin Registry, Minnesota Twin Family Study | 7,470 | 14.1 (13–15) | Questionnaire; DNA-based in uncertain cases/same sex pairs | Clinical (A, U, C, J); Self report (F, N, J, K, T) | ACE | 0.81 (m) 0.82 (f) | 0.70, 0.90 0.73, 0.90 |
| China (C), Japan (J), South Korea (K), Taiwan (T) | Guangzhou Twin Registry, Tokyo Twin Cohort, South Korean Twin Registry, Taiwan Adolescent Twin/Sibling Family Study | 3,168 | 14.0 (13–15) | DNA (C, T), Questionnaire (J, K; uncertain cases excluded) | Clinical (C, J); Self report (J, K, T) | ACE | 0.74 (m) 0.85 (f) | 0.56, 0.93 0.75, 0.94 | |
| Liu et al. (2008) | Taiwan | Twin/Sibling Study of Insulin Resistance | 396 | 14.1 (12–18) | DNA-based | Clinical | AE | 0.89 (m/f) | 0.85, 0.92 |
| Wardle et al. (2008) | UK | Twin’s Early Development Study | 10,184 | 9.9 (8–11) | Questionnaire; DNA-based in uncertain cases | Self report | ACE | 0.80 (m) 0.72 (f) | 0.72, 0.84 0.63, 0.81 |
| Cornes et al. (2007) | Australia | Schools in Brisbane area, media appeals | 1,812 | 12 | Questionnaire; DNA confirmation in DZ/same sex pairs | Clinical | ADE | 0.77 (m) 0.76 (f) | 0.52, 0.91 0.48, 0.90 |
| Hur (2007) | South Korea | South Korean Twin Registry (SKTR) | 1,776 | 15.6 (13–19) | Questionnaire | Self report | AE | 0.82 (m) 0.87 (f) | 0.72, 0.95 0.77, 0.99 |
| Ordonana et al. (2007) | Netherlands, Spain | Netherlands and Murcia Twin Registers | 1,324 | (41–67) | DNA-based | Self report | AE | 0.77 (m/f) | 0.72, 0.81 |
| Silventoinen et al. (2007a) | Netherlands | Netherlands Twin Register | 15,510 | 3 | Questionnaire | Self report | ACE | 0.70 (m) 0.68 (f) | 0.62, 0.77 0.60, 0.76 |
| Silventoinen et al. (2007b)a | Sweden | Swedish Young Male Twins Study | 678 | 18 | Questionnaire; DNA-based in uncertain cases | Clinical | AE | 0.84 (m) | 0.81, 0.88 |
| Souren et al. (2007) | Belgium | East Flanders Prospective Twin Survey | 756 | 25.3 (18–34) | DNA-based | Clinical | AE | 0.85 (m) 0.75 (f) | 0.79, 0.89 0.67, 0.81 |
| Nelson et al. (2006)a | USA | Carolina African American Twin Study of Aging | 434 | 47.0 (22–88) | Questionnaire | Clinical | AE | 0.74 (m) 0.74 (f) | 0.61, 0.88 0.63, 0.84 |
| Schousboe et al. (2004) | Denmark | GEMINAKAR Study | 1,248 | 37.8 (18–67) | DNA-based | Clinical | ACE | 0.63 (m) 0.58 (f) | 0.36, 0.90 0.34, 0.82 |
| Schousboe et al. (2003)a | Australia | Australian Twin Register | 5,000 2,832 | 20–29 30–39 | Questions; blood groups; DNA-based | Self report | AE | 0.69 (m) 0.74 (f) 0.77 (m) 0.75 (f) | 0.75, 0.64 0.71, 0.76 0.72, 0.82 0.72, 0.78 |
| Denmark | Danish Twin Registry | 11,096 8,094 | 20–29 30–39 | Questionnaire | Self report | AE | 0.78 (m) 0.73 (f) 0.63 (m) 0.74 (f) | 0.75, 0.80 0.71, 0.76 0.58, 0.67 0.71, 0.78 | |
| Finland | Finnish Twin Cohort Study and FinnTwin16 | 3,976 11,564 | 20–29 30–39 | Questionnaire | Self report | AE | 0.74 (m) 0.80 (f) 0.73 (m) 0.66 (f) | 0.69, 0.80 0.77, 0.84 0.71, 0.76 0.63, 0.70 | |
| Italy | National Twin Registry | 820 | 20–29 | Questionnaire | Self report | AE | 0.71 (m) 0.81 (f) | 0.60, 0.82 0.76, 0.87 | |
| Netherlands | Netherlands Twin Registry | 3,696 582 | 20–29 30–39 | Questionnaire; DNA in subset of 535 twins | Self report | AE | 0.68 (m) 0.81 (f) 0.79 (m) 0.67 (f) | 0.62, 0.74 0.78, 0.84 0.66, 0.92 0.58, 0.67 | |
| Norway | Norwegian Institute of Public Health Twin Study | 6,782 1,148 | 20–29 30–39 | Questionnaire | Self report | ACE AE AE | 0.53 (m) 0.73 (f) 0.78 (m) 0.83 (f) | 0.38, 0.67 0.70, 0.76 0.70, 0.87 0.78, 0.88 | |
| Sweden | Swedish Twin Registry | 9,518 7,300 | 20–29 30–39 | Questionnaire | Self report | AE | 0.75 (m) 0.74 (f) 0.72 (m) 0.75 (f) | 0.73, 0.78 0.72, 0.77 0.69, 0.75 0.72, 0.78 | |
| UK | St Thomas’ UK Adult Twin Registry | 328 622 | 20–29 30–39 | Questionnaire; DNA in 50% | Self report | AE | 0.73 (f) 0.81 (f) | 0.64, 0.81 0.77, 0.86 | |
| Baird et al. (2001) | UK | Birmingham birth registry | 396 | 43.7 | Questionnaire | Clinical | AE | 0.77 (m/f) | 0.67, 0.85 |
| Poulsen et al. (2001) | Denmark | Danish Twin Register | 606 | 67.0 (55–74) | Questionnaire | Clinical | Corrb | 0.58 (m) 0.90 (f) | 0.40, 0.76 0.59, 1.00 |
| Faith et al. (1999)a | USA | Ohio twin fair | 132 | 11.0 (3–17) | Questionnaire; blood testing | Clinical | AE | 0.88 (m/f) | 0.82, 0.95 |
| Knoblauch et al. (1999)a | Germany | Studies of cardiovascular phenotypes and blood pressure regulation | 444 | 34.0 | DNA-based | Clinical | AE | 0.86 (m/f) | 0.59, 1.00 |
| Narkiewicz et al. (1999)a | Poland | Twins reared together and apart | 66 | 20.9 (SD = 5) | DNA-based | Clinical | ACE | 0.76 (f) | 0.28, 1.00 |
| Pietilainen et al. (1999)a | Finland | FinnTwin16 | 4,884 | 16.2 | Questionnaire; photographs; DNA-based | Self report | AE | 0.82 (m) 0.88 (f) | 0.79, 0.86 0.86, 0.90 |
| Vinck et al. (1999) | Belgium | East Flanders Prospective Twin Survey, town registers | 182 | 22.0 (17–38) | Questionnaire | Clinical | AE | 0.85 (m) | 0.64, 1.00 |
| Austin et al. (1997)a | USA | Kaiser Permanente Women’s Twin Study | 630 | 18–85 | DNA-based | Clinical | AE | 0.83 (f) | 0.79, 0.87 |
| Herskind et al. (1996)a | Denmark | Danish Twin Register | 1,602 864 | 46–59 60–76 | Questionnaire; unknown cases excluded | Self report | AE | 0.47 (m) 0.75 (f) 0.51 (m) 0.78 (f) | 0.37, 0.57 0.70, 0.80 0.37, 0.64 0.71, 0.84 |
| Carmichael and McGue (1995) | USA | Minnesota Twin Registry and Twin Study of Adult Development | 1,475 | 31.8 (18–38) | Questionnaire | Self report | AE | 0.82 (m/f) | 0.78, 0.86 |
| Forbes et al. (1995) | USA | Newspaper advertisement | 174 | 7–68 | DNA-based | Clinical | Corrb | 0.75 (m/f) | 0.57, 0.93 |
| Harris et al. (1995)a | Norway | New Norwegian Twin Panel | 4,508 | 18–25 | Questionnaire | Self report | AE | 0.72 (m) 0.83 (f) | 0.67, 0.77 0.80, 0.85 |
| Korkeila et al. (1991)a | Finland | Finnish Twin Cohort | 4,988 4,606 2,858 2,038 | 18–24 25–34 35–44 45–54 | Questionnaire; unknown cases excluded | Self report | AE | 0.74 (m) 0.68 (f) 0.73 (m) 0.73 (f) 0.71 (m) 0.73 (f) 0.67 (m) 0.58 (f) | 0.70, 0.78 0.64, 0.72 0.69, 0.77 0.68, 0.77 0.65, 0.76 0.69, 0.79 0.59, 0.75 0.49, 0.67 |
| Neale and Cardon (1992)a | Australia | Australian NH and MRC study | 3,522 3,616 | 18–30 >31 | Questionnaire | Self report | ADEc AE | 0.76 (m) 0.79 (f) 0.75 (m) 0.70 (f) | 0.71, 0.81 0.76, 0.82 0.71, 0.80 0.66, 0.74 |
| Hewitt et al. (1991)a | UK | Birmingham Family Study Register | 160 | 19.3 (16–24) | Questionnaire | Clinical | AE | 0.84 (m) | 0.74, 0.93 |
| Stunkard et al. (1990)a | Sweden | Swedish Adoption/Twin Study of Aging (SATSA) | 1,346 | 58.6 | Questionnaire | Self report; clinical subset | ADEc | 0.70T (m) 0.50T (f) 0.66A (m) 0.59A (f) | 0.53, 0.88 0.24, 0.76 0.55, 0.77 0.48, 0.70 |
| Stunkard et al. (1986) | USA | National Academy of Sciences-National Research Council Twin Registry Panel | 8,142 | 20.0 (15–28) | Questions; blood groups; DNA-based | Clinical | Corrb | 0.77 (m) | 0.69, 0.84 |
Details of the 31 papers reporting BMI heritability from twin studies.
TTwins reared together; Atwins reared apart.
aHeritability and confidence intervals calculated directly (since papers did not report confidence intervals).
bStudies estimating heritability with equations based on correlations.
cHeritability calculated directly using OpenMx under AE model.
Figure 1
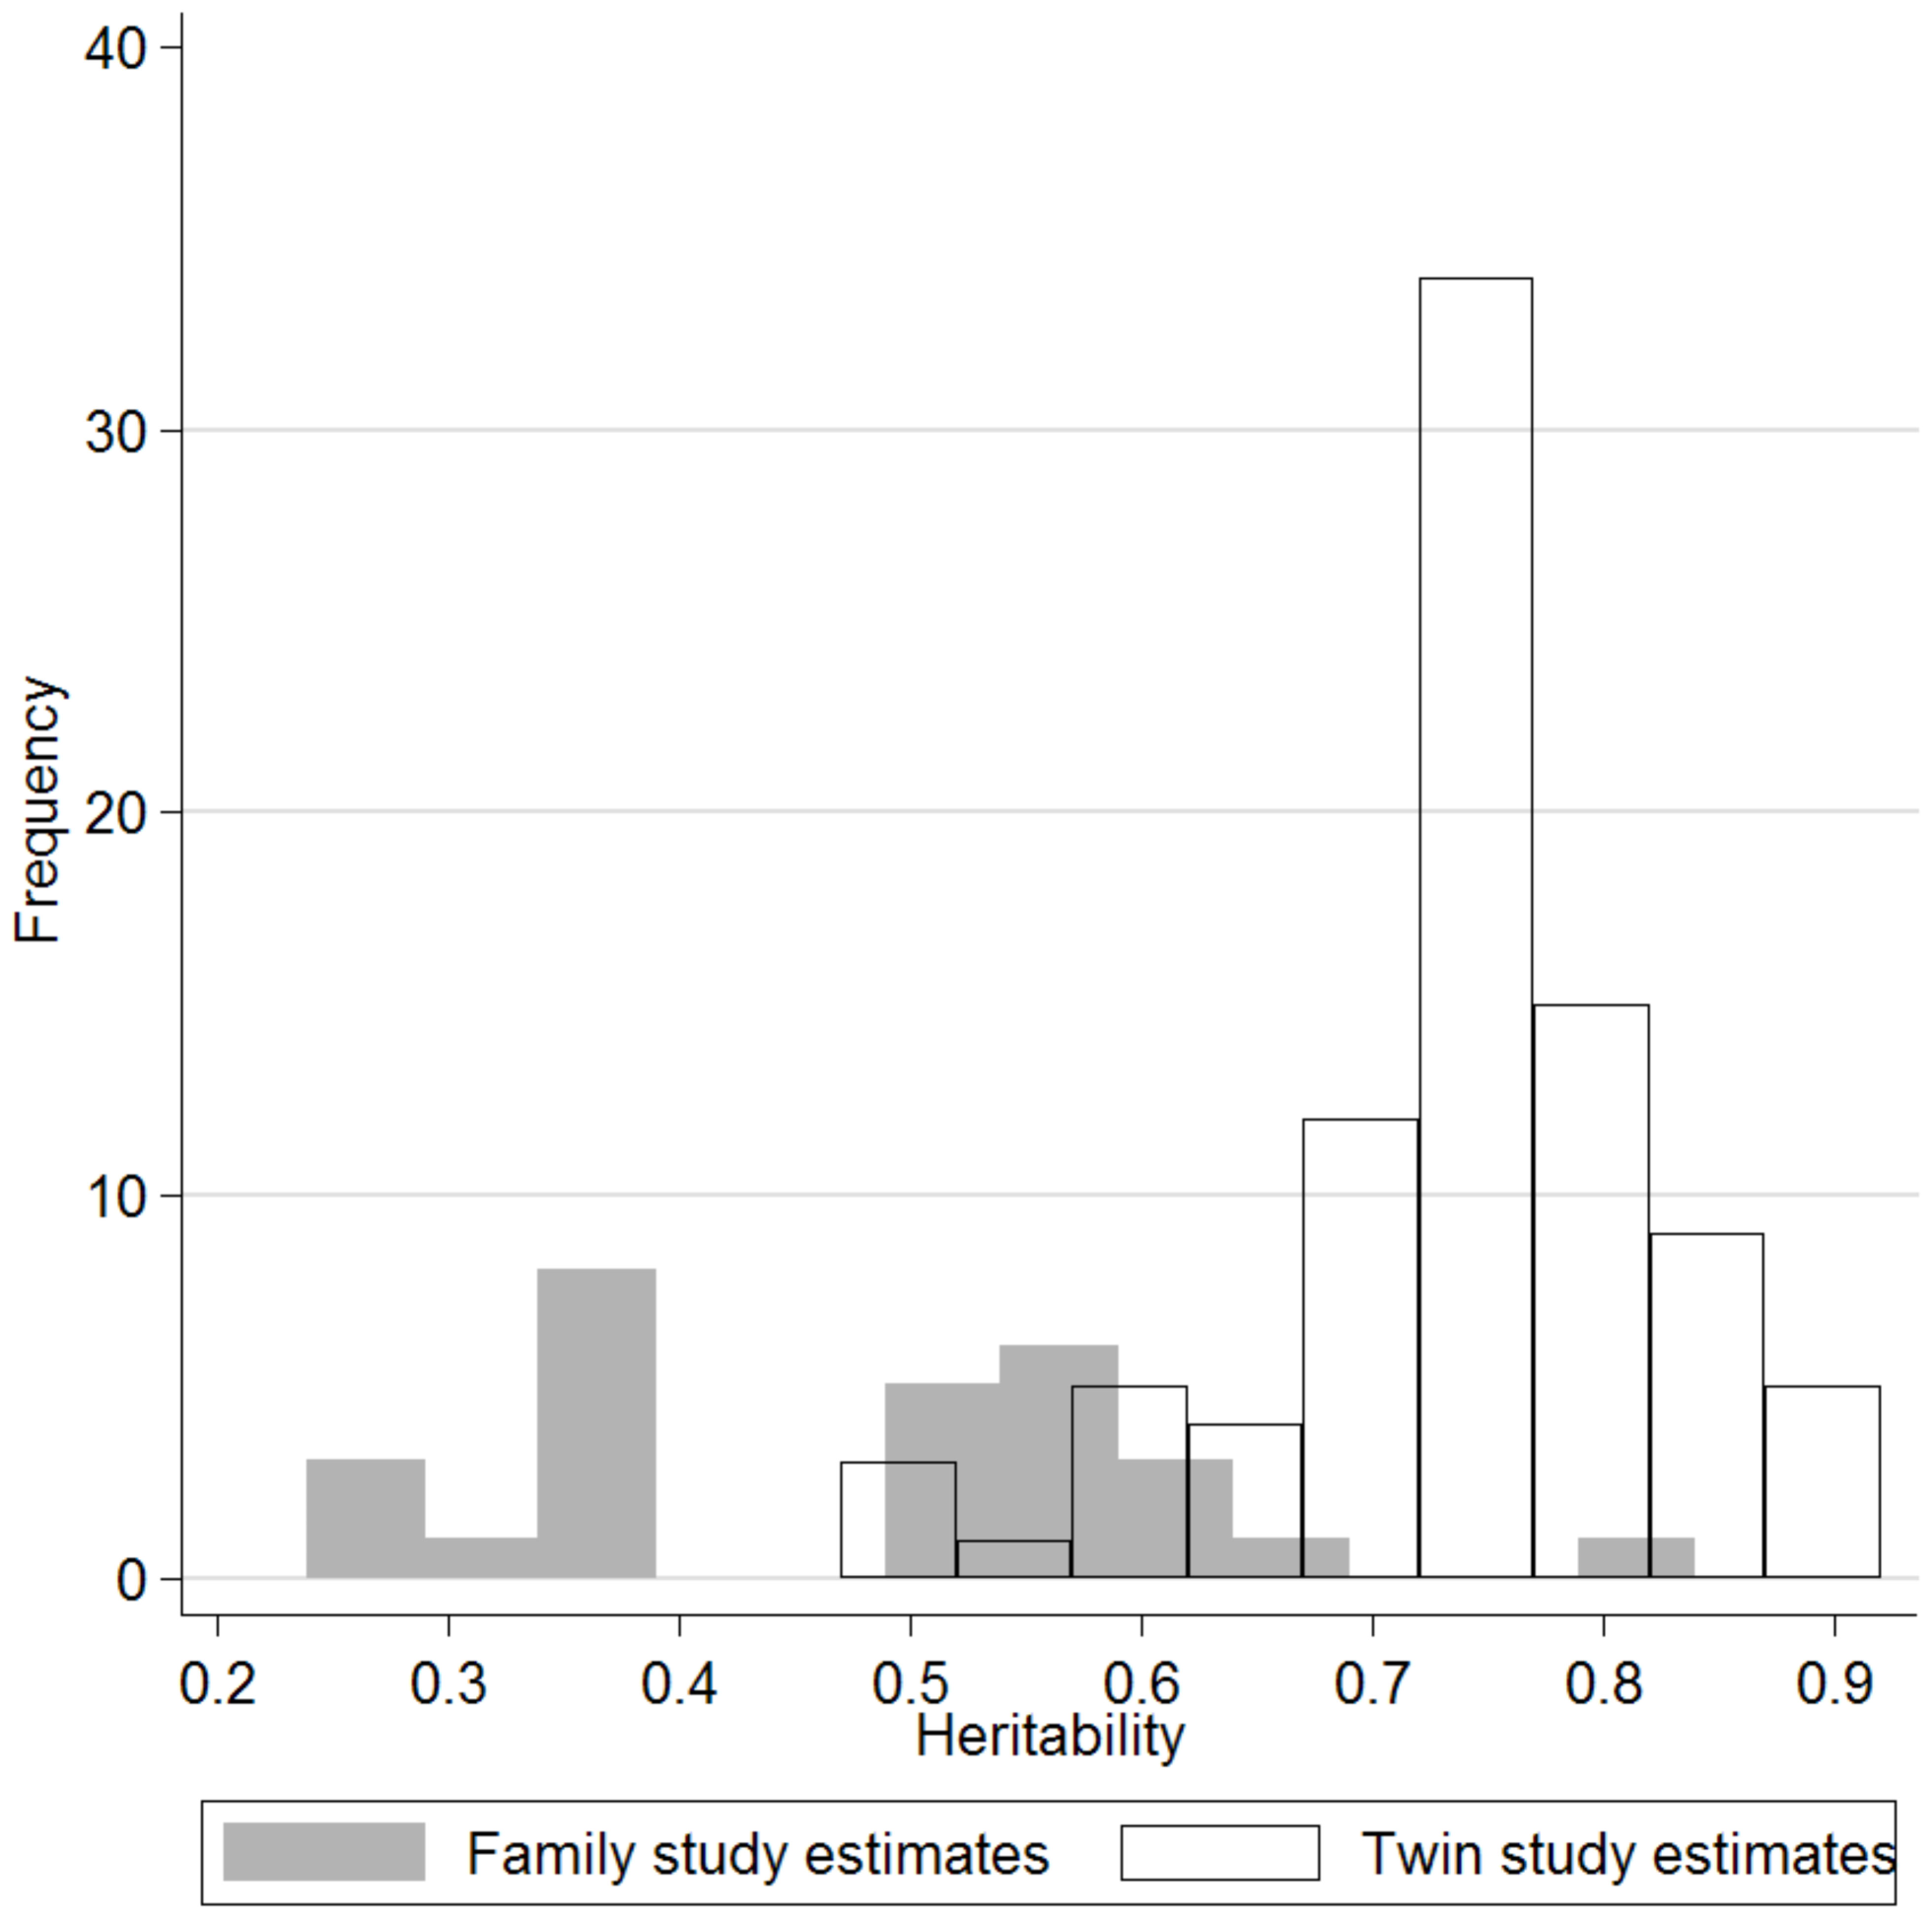
Histogram showing the wide distribution of reported estimates of BMI heritability from twin studies (white bars) and family studies (gray bars).
Figure 2
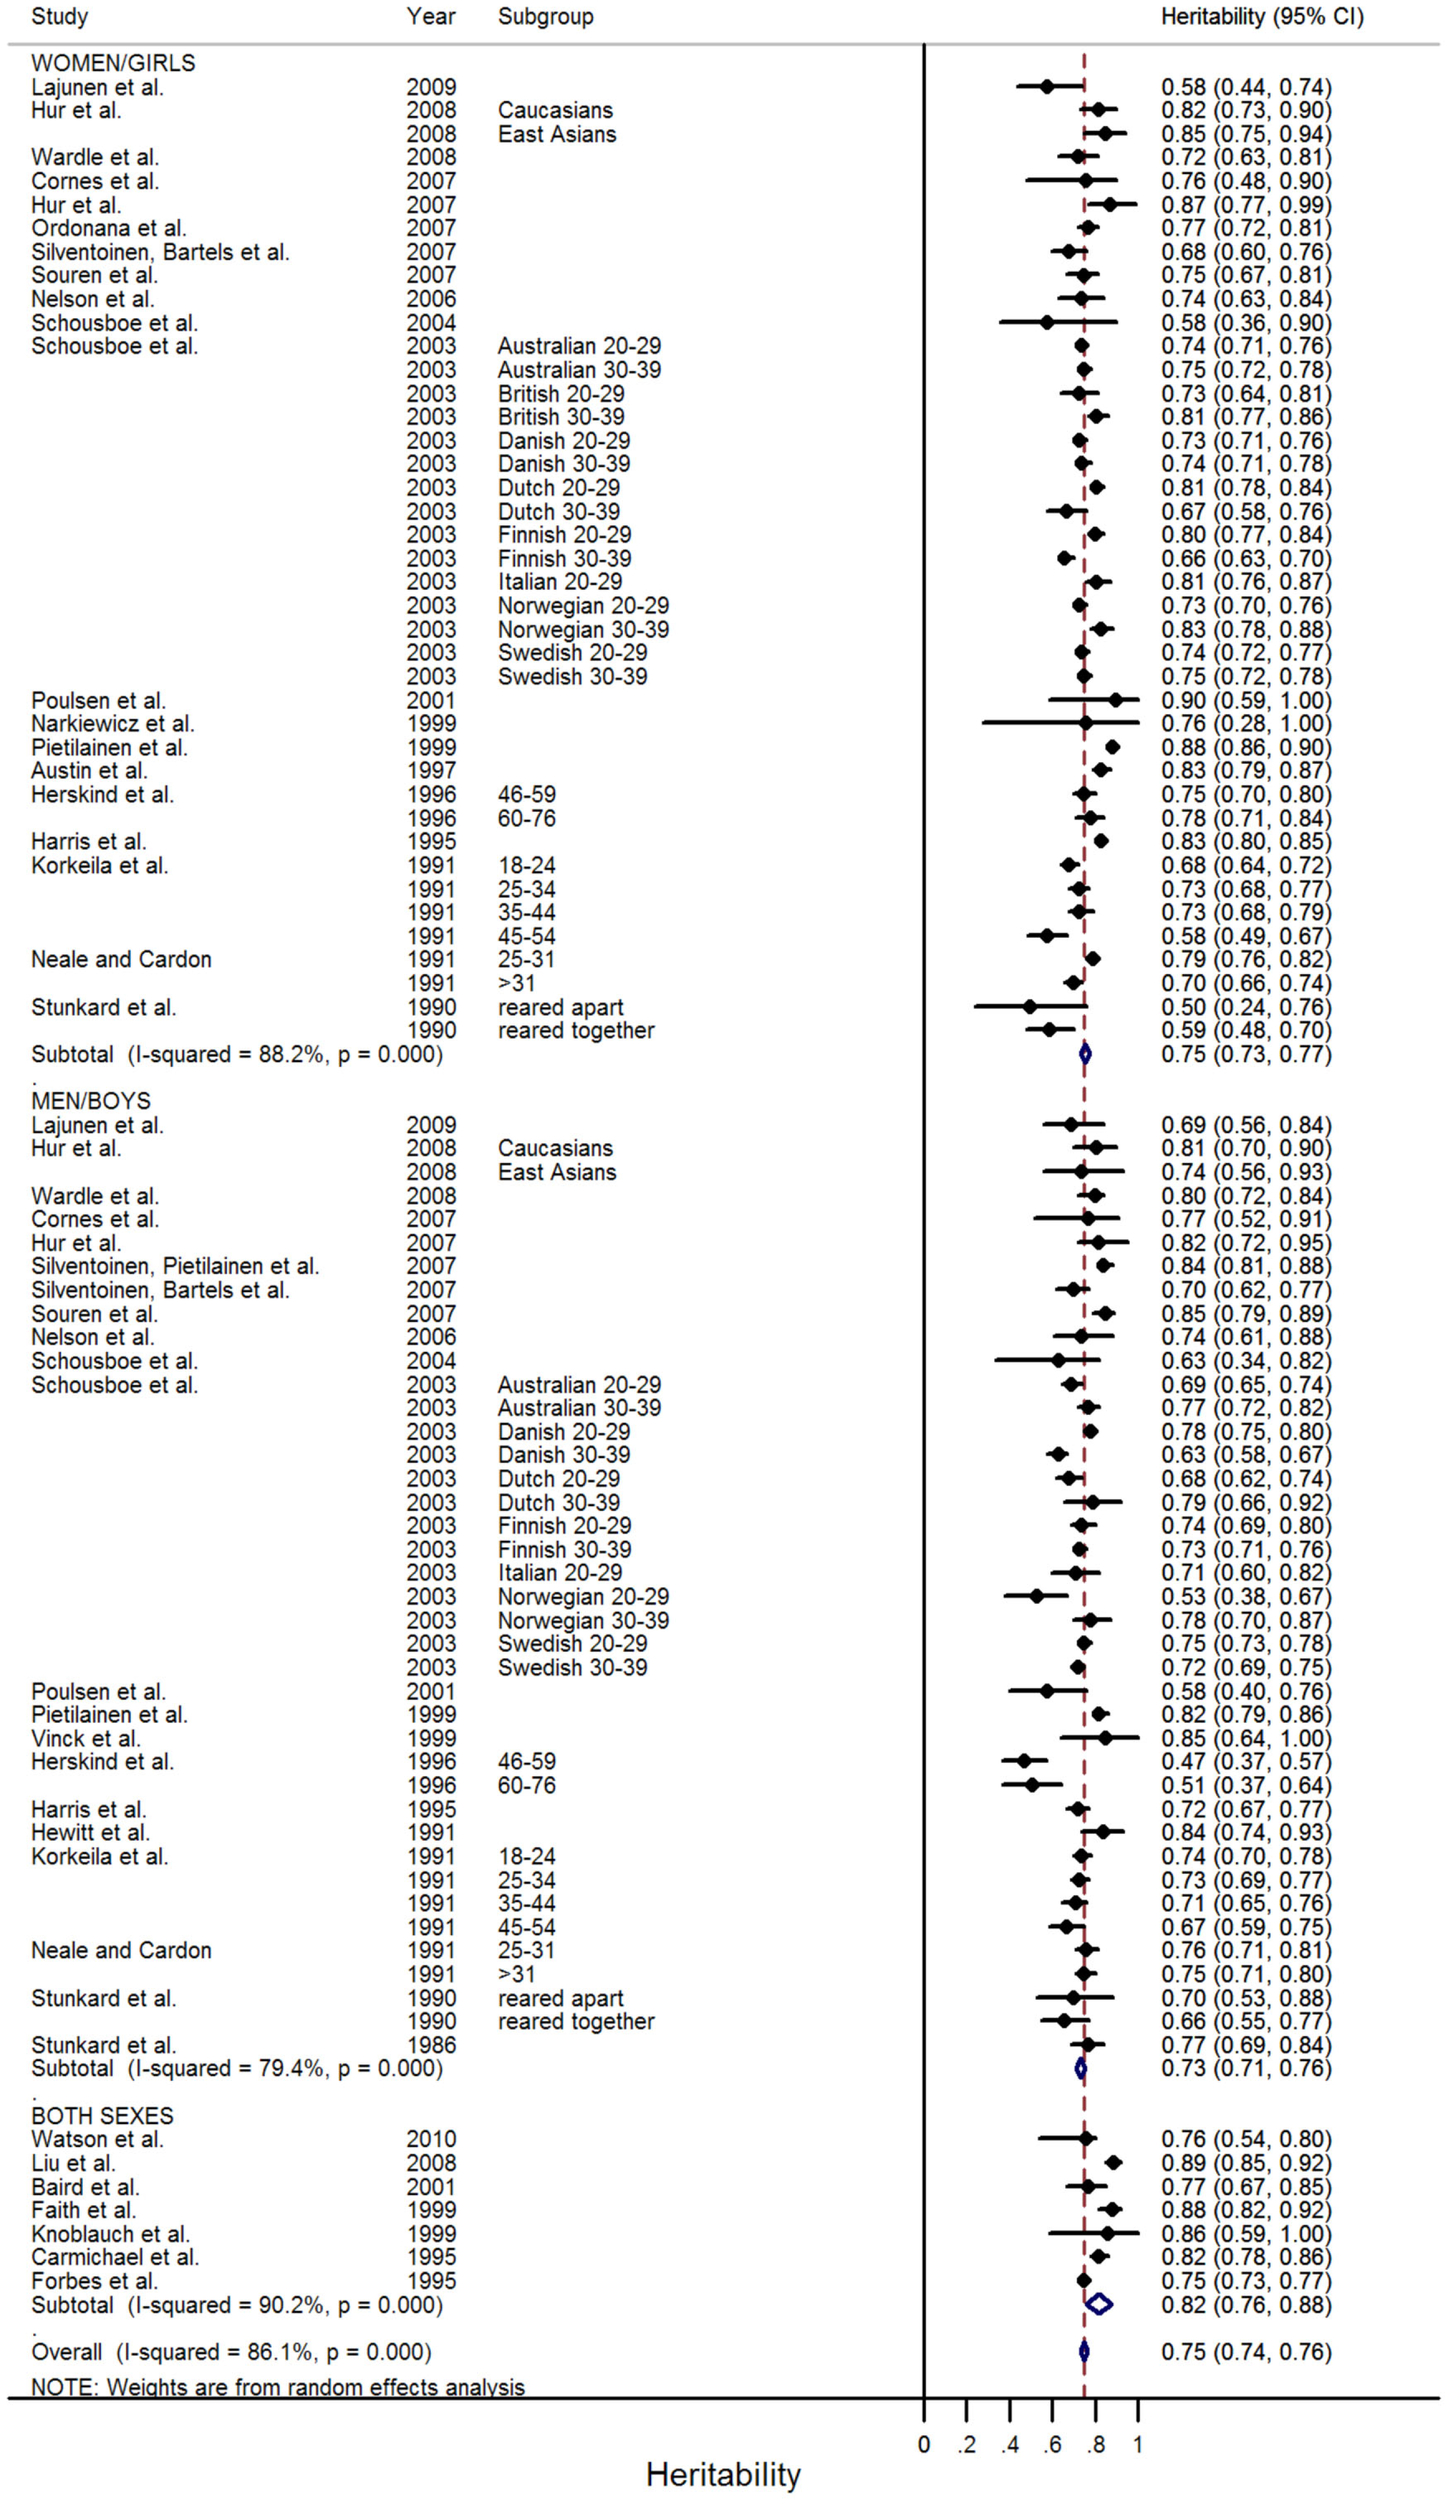
Meta-analysis of BMI heritability estimates in twin studies. The forest plot shows the results of a random effects meta-analysis of 88 independent BMI heritability estimates from 31 papers.
Demographic factors
In estimates from twin studies, there were similar overall heritability estimates for men (0.73; 95% CI: 0.71–0.76) and women (0.75; 95% CI: 0.73–0.77; Figure 2). This was confirmed by meta-regression, which found no effect of sex on the heritability estimate (Table 2). Nineteen of the 88 heritability estimates from twin studies were from children and adolescents (≤18 years), whilst 67 were in adulthood (two estimates were from populations that included participants spanning both childhood and adulthood). Meta-regression showed that, on average, BMI heritability in childhood was 0.07 higher (95% CI: 0.03–0.11, P = 0.001) than in adulthood (Table 2). Heritability estimates rose by 0.012/year throughout childhood (age ≤18 years; 95% CI: 0.005–0.019, P = 0.002), but decreased by −0.002/year in adulthood (95% CI: −0.004 to −0.001, P = 0.002; Figure 3). BMI heritability from East Asian populations (N = 5 populations) was 0.11 higher than that in populations of white European descent (95% CI: 0.03–0.18, P = 0.006), but this difference diminished after adjustment for age category (child versus adult studies; 0.06; 95% CI: −0.02–0.15, P = 0.125). The influence of birth cohort (year of birth of the twins) on heritability estimates was difficult to assess because some studies did not report the birth year of the participants and others reported large ranges, sometimes spanning multiple decades. More recent publication year was nominally associated with heritability in meta-regression analyses (0.003/+1 year, P = 0.055). However, this association was attenuated after adjustment for age category (child versus adult studies; P = 0.405).
Table 2
| Covariate | Co-efficient (SE) | P-value | Heritability estimate for reference group | 95% CI |
|---|---|---|---|---|
| Sex (male = 0, female = 1) | 0.019 (0.02) | 0.267 | 0.73 | 0.71, 0.76 |
| Age category (childhood = 0, adulthood = 1) | −0.07 (0.02) | 0.001 | 0.80 | 0.77, 0.84 |
| Age in childhoodb (per +1 year from age 10) | 0.012 (0.003) | 0.002 | 0.77 | 0.74, 0.81 |
| Age in adulthoodb (per +1 year) | −0.002 (0.001) | 0.002 | 0.77 | 0.74, 0.79 |
| Setting (Europe/USA = 0, East Asian = 1) | 0.105 (0.04) | 0.006a | 0.74 | 0.73, 0.76 |
| Publication year (per +1 year from 1986 to 2010) | 0.003 (0.001) | 0.055 | 0.71 | 0.67, 0.75 |
Results of meta-regression analyses to identify study-level demographic factors associated with reported BMI heritability estimates in twin studies.
Three estimates excluded from meta-regression for age as age range >20 years and no mean age reported.
Bold represents P < 0.05.
aBecomes non-significant when adjusting for age category (P = 0.12).
bAssessed as mean age where possible or mid-point of age range when age range <20 years.
Figure 3
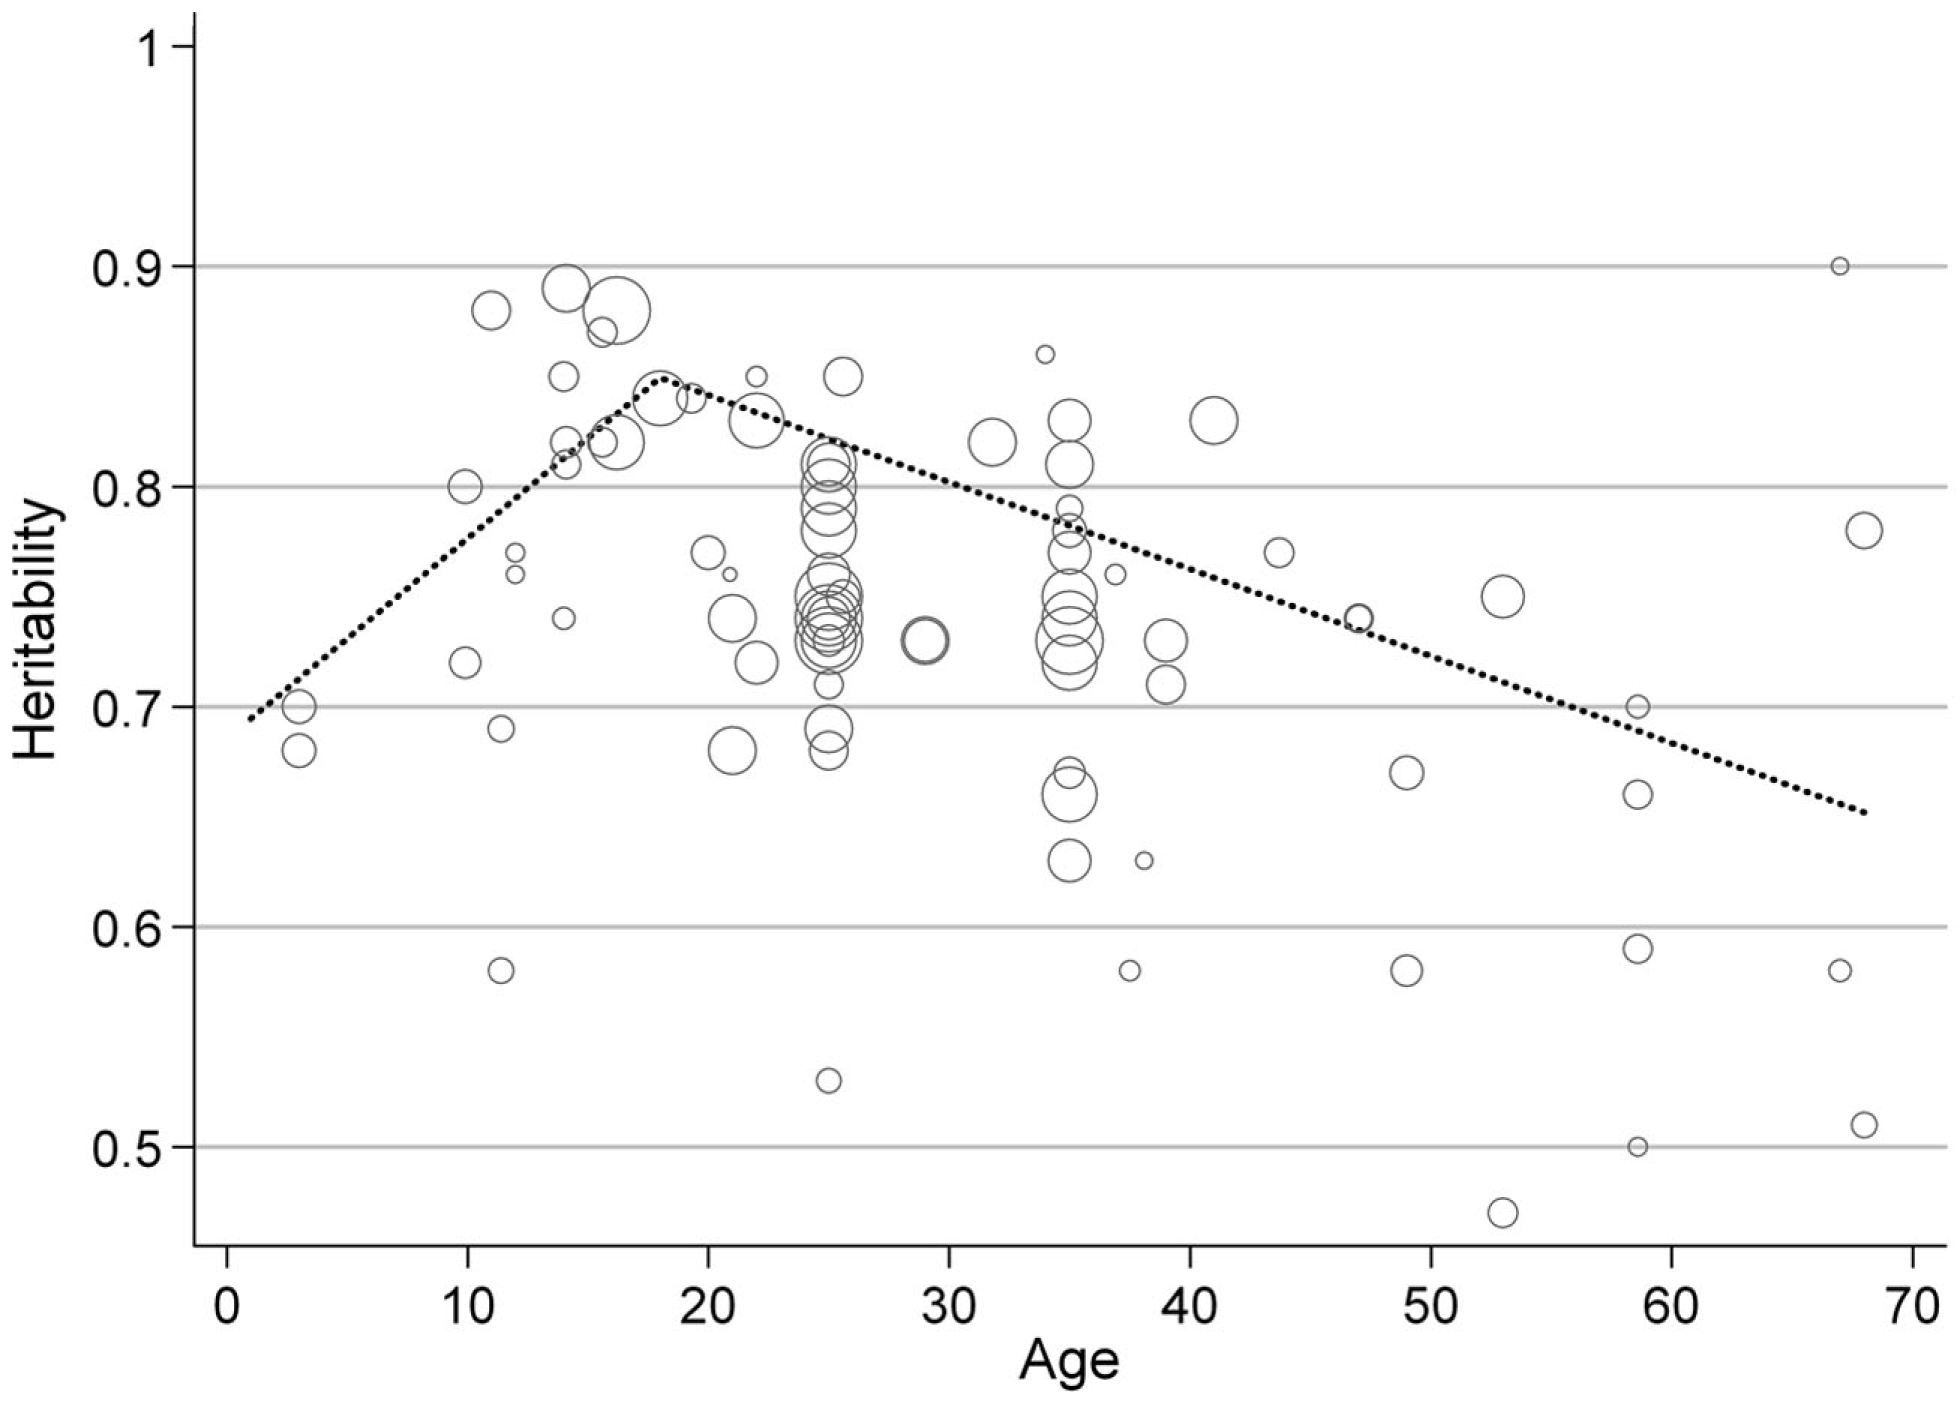
Predicted BMI heritability by age. The dotted line represents predicted BMI heritability by age, modeled using piecewise linear splines with a knot point at age 18 to separate childhood and adulthood. The figure shows that the relative contribution of genetic factors to variation in BMI increases over childhood before declining during adult life. Each circle represents an individual estimate of BMI heritability, and the size of the circle is proportional to the inverse of the SE of the heritability estimate. Age is based on the mean age of the study sample, or the mid-point of the age range where this was not reported.
Methodological factors
The number of twins included in each estimate of BMI heritability ranged from 66 to 8,142 individuals. In meta-regression models, sample size was unrelated to the BMI heritability estimates (P = 0.202, adjusted for age category). Fifteen of the best estimates of BMI heritability from twin studies were derived from the three-component ACE model, while the more parsimonious AE model was chosen as the best fitting model for 61 estimates. Eight estimates were derived from the ADE model and four estimates were obtained by direct comparisons of the within-pair correlations in monozygotic and dizygotic twins. Best estimates from AE variance component models were on average 0.12 higher than those from ACE models (P = 0.005), adjusted for age category (Table 3). When stratified into childhood or adult studies, this difference was of similar magnitude in children (0.11, 95% CI: 0.06–0.17, P = 0.001) and adults (0.13, 95% CI: 0.008–0.26, P = 0.038).
Table 3
| Covariate(s) Added | Co-efficient (SE) | P-value | Heritability estimate for reference group | 95% CI | Percentage of between study variance explained* |
|---|---|---|---|---|---|
| Sample size (per participant) | −0.000 (0.00) | 0.202 | 0.82 | 0.77, 0.86 | 4.13 |
| Twin model used (ACE = 0, AE = 1) | 0.118 (0.03) | <0.001 | 0.74 | 0.70, 0.79 | 21.89 |
| Zygosity determinant (DNA-based/biological = 0, Questionnaire-based = 1) | −0.04 (0.02) | 0.021 | 0.81 | 0.78, 0.85 | 8.65 |
| BMI measurement method (clinical = 0, self report = 1) | −0.048 (0.02) | 0.027 | 0.83 | 0.78, 0.88 | 9.91 |
Results of meta-regression analyses to identify study-level methodological factors associated with reported BMI heritability estimates in twin studies.
All meta-regression analyses adjusted for age category.
Bold represents P < 0.05.
* τ2 explained in a model containing significant covariates and age category, compared with a model containing age category alone.
A total of 33 of the 88 twin study estimates used DNA or biological (blood typing or fingerprints) assignment of zygosity; the remaining 55 relied completely on questionnaire-based methods. Reliance on questionnaires to determine zygosity (compared with DNA or other biological methods) was associated with a 0.04 lower heritability estimate (P = 0.02), when adjusted for age category. Similarly, the heritability was on average 0.05 lower (P = 0.03) in studies that calculated BMI based on self reported height and weight (N = 59 estimates) compared with studies (N = 21 estimates) that objectively assessed BMI. Eight study estimates based on a combination of both methods were excluded from this meta-regression analysis.
Together, age category, type of variance component model, method of zygosity assignment and BMI measurement, explained 46.7% of the between study heterogeneity in BMI heritability.
Family studies
A total of 28 independent estimates of BMI heritability were reported in 25 family study papers retrieved comprising 42,968 family members (Table 4; Longini et al., 1984; Hunt et al., 1989, 2002; Moll et al., 1991; Vogler et al., 1995; Bijkerk et al., 1999; Abney et al., 2001; Luke et al., 2001; Treuth et al., 2001; Arya et al., 2002; Coady et al., 2002; Jee et al., 2002; Henkin et al., 2003; Wu et al., 2003; Sale et al., 2005; Butte et al., 2006; Deng et al., 2006; Li et al., 2006; Bastarrachea et al., 2007; Bayoumi et al., 2007; Bogaert et al., 2008; de Oliveira et al., 2008; Patel et al., 2008; Friedlander et al., 2009; Zabaneh et al., 2009; Figure 1). Reported BMI heritability estimates ranged from 0.24 to 0.81 (5th/50th/95th centiles: 0.25/0.46/0.68), with substantial heterogeneity across estimates (I2 = 90.4%, P < 0.001; Figure 4). Meta-regression found no significant effect of sample size, age, setting, or publication year on heritability estimates in family studies (Table 5).
Table 4
| References | Location | Study | N | Mean age (range) | BMI heritability | 95% CI |
|---|---|---|---|---|---|---|
| Friedlander et al. (2009) | Israel | Kibbutzim Family Study, Israel | 476 | NS | 0.64 | 0.42, 0.86 |
| Zabaneh et al. (2009) | UK | Asian Indian families living in UK | 1,634 | 39.4 (25–50) | 0.30 | 0.24, 0.36 |
| de Oliveira et al. (2008) | Brazil | Baependi Heart Study | 1,666 | 44.0 | 0.51 | 0.42, 0.60 |
| Bogaert et al. (2008) | Belgium | Semi-rural communities in Ghent | 674 | 25–45 | 0.81 | 0.61, 1.00 |
| Patel et al. (2008) | USA | Cleveland Family Study | 1,802 | 35.3 | 0.55 | 0.47, 0.63 |
| Bastarrachea et al. (2007) | Mexico | Genetics of Metabolic Diseases Family Study (GEMM) | 375 | 40.3 (12–90) | 0.36 | 0.16, 0.56 |
| Bayoumi et al. (2007) | Saudi Arabia | Oman Family Study | 1,198 | 33.8 (16–80) | 0.68 | 0.58, 0.78 |
| Butte et al. (2006) | USA | Viva La Familia Study (Hispanic Population, overweight proband) | 1,030 | 4–19 | 0.39 | 0.23, 0.55 |
| Deng et al. (2006) | China | Local Shanghai population (Chinese Han ethnic group) | 1,031 | (20–45, offspring) | 0.49 | 0.35, 0.63 |
| Li et al. (2006) | USA | Mexican-American Coronary Artery Disease (MACAD) project | 478 | 34.4 | 0.59 | 0.35, 0.83 |
| Sale et al. (2005) | USA | African American families with T2D affected members | 580 | 58.0 > 18 | 0.64 | 0.44, 0.84 |
| Henkin et al. (2003) | USA | Insulin Resistance and Atherosclerosis Study (IRAS) | 1,032 | 43.1 | 0.54 | 0.38, 0.70 |
| Wu et al. (2003) | Taiwan | Follow up of Mei-Jo Health Screening Programme | 1,724 | 9–81 | 0.39 | 0.31, 0.47 |
| Arya et al. (2002) | India | Nutrition and Growth of Certain Population Groups of Visakhapatnam (NAG Project) | 1,903 | 21.5 (6–72) | 0.25 | 0.15, 0.35 |
| Coady et al. (2002) | USA | Framingham Heart Study Families | 1,051 | 35.3* (35–55) | 0.37 | 0.21, 0.53 |
| Hunt et al. (2002) | Canada | Canada Fitness Survey | 1,315 | 29.6 (7–69) | 0.39 | 0.27, 0.51 |
| Jee et al. (2002) | Korea | Korea Medical Insurance Corporation (KMIC) family study | 7,589 | 59.8 (40–85) | 0.26 | 0.24, 0.28 |
| Abney et al. (2001) | USA | Hutterites of South Dakota | 666 | >5 | 0.54 | 0.40, 0.68 |
| Luke et al. (2001) | Nigeria | International Collaborative Study on Hypertension in Blacks | 1,815 | 38.8 (0–100) | 0.49 | 0.39, 0.59 |
| Jamaica | 614 | 39.5 (0–100) | 0.53 | 0.35, 0.71 | ||
| USA | 2,097 | 37.5 (0–100) | 0.57 | 0.47, 0.67 | ||
| Treuth et al. (2001) | USA | Houston area | 303 | 28.7 (8–9, offspring) | 0.35 | 0.02, 0.68 |
| Bijkerk et al. (1999) | Netherlands | Rotterdam Study | 1,583 | 63.1 (55–70) | 0.53 | 0.34, 0.75 |
| Vogler et al. (1995) | Denmark | Danish Adoption Register | 2,476 | 42.0 | 0.34 | 0.28, 0.40 |
| Moll et al. (1991) | USA | The Muscatine Ponderosity Study | 1,580 | 29.4 (4–67) | 0.58 | 0.46, 0.70 |
| Hunt et al. (1989) | USA | Utah pedigrees | 1,102 | 35.5 | 0.24 | 0.14, 0.34 |
| Longini et al. (1984) | USA | Tecumseh population | 5,174 | 6–74 | 0.35 | 0.23, 0.47 |
Details of the 25 papers reporting BMI heritability from family studies.
N, number of study participants; NS, not stated; **at entry to study.
Figure 4
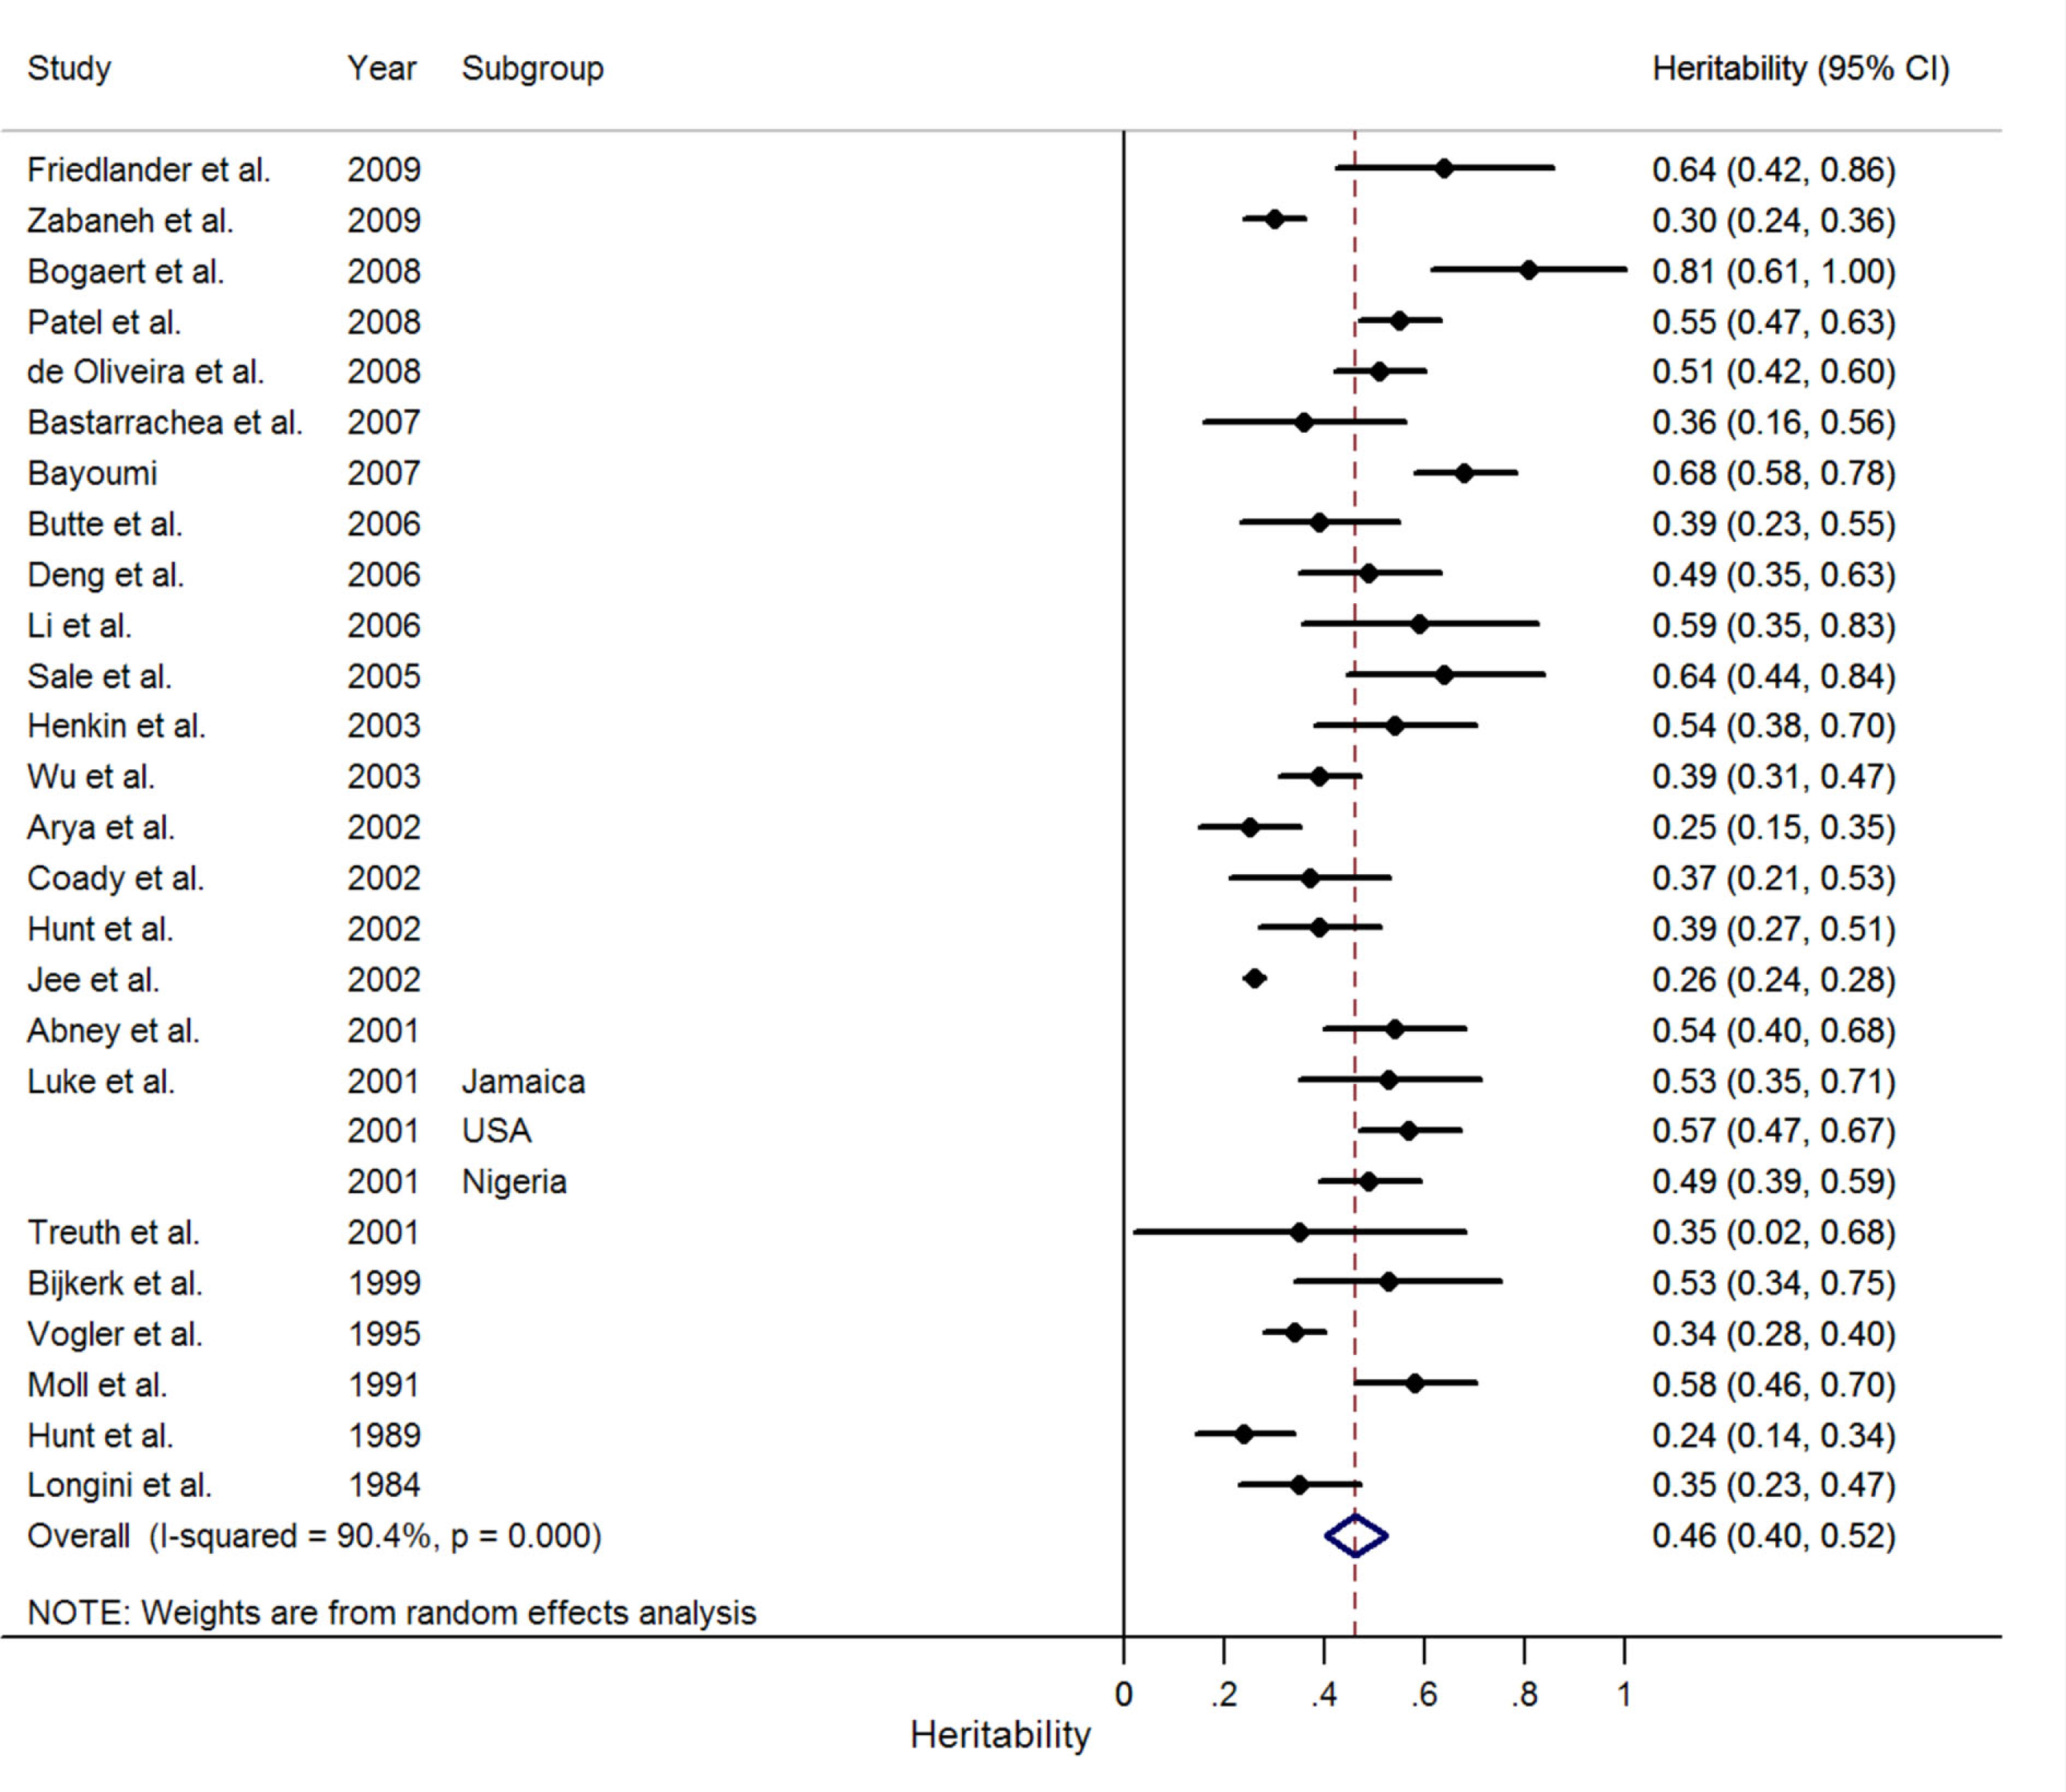
Meta-analysis of BMI heritability estimates in family studies. The forest plot shows the results of a random effects meta-analysis of 27 independent BMI heritability estimates from 25 papers.
Table 5
| Covariate(s) added | Co-efficient (SE) | P-value | Heritability estimate for reference group | 95% CI |
|---|---|---|---|---|
| Sample size (per participant) | −0.000 (0.00) | 0.132 | 0.60 | 0.42, 0.78 |
| Age* (per +1 year) | 0.005 (0.005) | 0.358 | 0.28 | 0.00,0.71 |
| Setting (Europe/USA = 0, East Asian = 1) | −0.048 (0.11) | 0.68 | 0.48 | 0.39, 0.58 |
| Publication year (per +1 year from 1984 to 2010) | 0.009 (0.006) | 0.184 | 0.30 | 0.03, 0.57 |
Results of meta-regression analyses to identify study-level demographic or methodological factors associated with reported BMI heritability estimates in family studies.
*Assessed as mean age where possible (n = 20) or mid-point of age range (n = 3).
Four estimates excluded from meta-regression for age as mean age or full age range of parents and children were not reported.
Discussion
In a large meta-analysis of more than 140,525 twins and 42,968 family members, we observed that estimates of BMI heritability remain broadly in line with results from the earlier review by Maes et al. (1997). A substantial amount of the variation between estimates from twin studies could be explained by considering demographic and methodological factors. Estimates from twin studies suggest that the influence of genetic factors on BMI is relatively higher in children than in adults. In addition, we have identified and quantified the likely effects of three potential methodological biases in twin studies; these are the choice of final variance component model, and the use of subjective methods to assess both zygosity and BMI. Together these factors explained nearly half of the wide heterogeneity in BMI heritability estimates between studies.
Our finding of a biphasic change in the heritability of BMI with age, increasing with age in children and adolescents and decreasing with age adults, is entirely consistent with studies using specific genetic variants. Hardy et al. (2010) reported that the effect size of the rs9939609 single nucleotide polymorphism (SNP) in FTO on BMI rises until around age 20 years, before gradually attenuating into adulthood. We acknowledge limitations in our analysis including the lack of longitudinal information and reliance on the mean or mid-point of age used in meta-regression analyses. However, in support of our findings, the heritability of BMI has previously been shown to increase over childhood (Haworth et al., 2008) and decrease with age in adults (Korkeila et al., 1991) in twin studies with longitudinal data.
We found no difference in BMI heritability estimates between men and women. Individual studies have been inconsistent; some have reported higher BMI heritability estimates in women (Allison et al., 1994; Harris et al., 1995; Estourgie-van Burk et al., 2006), whilst others have reported the opposite finding (Stunkard et al., 1990; Korkeila et al., 1991). Other studies have found no difference or reported a pooled heritability estimate for men and women combined. BMI heritability does not differentiate fat and fat free mass heritability, and given the differences in body composition between sexes, it is plausible that genetic contributions to the variation in BMI may operate differently in men and women.
Hur et al. (2008) reported that heritability estimates for weight, height, and BMI were consistently higher in Caucasian compared with East Asian populations. However, in that study the observed differences were small and confidence intervals were overlapping. In this study, no significant difference was found in the magnitude of BMI heritability from European and East Asian settings after accounting for whether the studies were in childhood or adulthood; however there were only a few studies in East Asians.
The majority of studies reported estimates of BMI heritability from the more parsimonious AE variance component model, rather than from the more complete ACE model. Not surprisingly, heritability (variance attributed to the A component) was higher in studies reporting the AE model, presumably because the variance that would have been attributed to C is re-allocated to components A and E in these analyses. Silventoinen et al. (2010) reported that the C component was relevant to BMI variation only in children up to age 13 years old. However, we found that exclusion of the C component had a similar magnitude of effect on higher heritability estimates in both children and adults. While omission of the C component is statistically best fitting in some analyses, smaller twin studies are often underpowered to identify a significant contribution of this component (Visscher et al., 2008a). These findings suggest that it may be inappropriate to simply ignore any contribution relating to common environmental factors.
The twin study design relies on the accurate identification of MZ and DZ twin pairs. The “gold standard” method is by DNA typing of all twins but, before genotyping technologies became widespread and cost–effective, questionnaire-based methods were common and were used to generate more than half of the BMI heritability estimates that we identified. Such questionnaires are based on subjective assessment of physical resemblance and, although some have been validated against genetic and biological methods (Sarna et al., 1978; Ooki et al., 1993), any non-differential misclassification error would inflate the E component and reduce the additive genetic component. Similarly, non-differential errors in self reported height and weight to calculate BMI would also inflate the unique environment component. These findings are consistent with those of Macgregor et al. (2006), who showed that heritability estimates for self reported height were lower than for objectively measured height.
Heritability estimates from twin studies are considerably higher than estimates from family studies. Twin studies are generally thought to provide a more robust discrimination between environmental and genetic contributions due to the more precise estimation of shared genetic factors and the automatic matching for age, prenatal environment, and birth cohort. However, it is suggested that the twin study design overestimates heritability because of its over-reliance on critical assumptions (Kyvik, 2000). The most commonly highlighted assumption is that of equal common environments in identical and non-identical twin pairs. In reality, MZ twin pairs may share a common environment to a larger extent than DZ pairs, which would lead to an overestimation of heritability (Hettema et al., 1995; Guo, 2001). This can be overcome by studying twin pairs who were separated at birth (Stunkard et al., 1990), a natural experiment whereby individuals are genetically identical but environmentally different. However, such twins are rare and difficult to study, as adoption data is not easy to obtain. Family studies do not invoke some of the problems of the twin study design. For example, questions of equal environments and accurate zygosity recording are eliminated and singletons are more representative of the general population than twins (Estourgie-van Burk et al., 2006). However, the family study design does not permit the differentiation of familial similarity arising from genetics as opposed to shared environmental conditions. In addition, in family studies, parents and children are usually measured at very different ages, often across generations, and lack of consideration of age–genotype interactions will lead to under-estimation of heritability. This might explain why heritability estimates are generally lower in family studies despite the fact that they do not distinguish between genetic and shared environmental variance components.
A limitation of this study was the inability to distinguish effects of demographic and methodological factors from other correlated study characteristics. For example, studies on children are likely to be over-representative of individuals from more recent birth years, making it difficult to separate effects of age and era. Genetic factors may have been relatively more important before the onset of the obesogenic environment, but others have suggested that these conditions may amplify the effects of obesity susceptibility loci (Andreasen et al., 2008). Era effects were difficult to assess in this study and the separation of birth cohort and age effects on BMI heritability requires confirmation by longitudinal data from large twin cohort studies spanning wide eras.
It should be noted that the models used to calculate heritability are often based on the unlikely assumption that there is no synergistic interaction between genes. Although the study designs discussed here do not usually permit their determination because of confounding with effects of the common environment, non-additive genetic factors may also play an important role (Segal and Allison, 2002). Furthermore, gene–environment interaction is not accounted for in these studies, and any such contribution is allocated to the A component (Visscher et al., 2008b).
It is important to emphasize that there is no single true value for heritability, as the balance between genetic and environmental contributions will naturally vary with the environmental setting and genetic lineage. However, we now show that issues relating to study design also explain a substantial part of the differences in the reported estimates of BMI heritability. In family studies we were unable to explain any of the heterogeneity across estimates. However, it is likely that other unmeasured factors, for example more precise measurement of geographical and population-level environmental factors such as urban versus rural setting, recreational facilities, nutritional availability, affluence, and also cultural factors and ethnicity, might contribute to the remaining variability in BMI heritability estimates in both twin and family studies.
Conclusion
In conclusion, while many studies in the current GWAS era report estimates from heritability studies as a rationale to look for specific genetic factors for complex traits, it should be emphasized that “missing” heritability is difficult to quantify given the wide heterogeneity in these estimates due to both natural variation and differences in study design. Given the higher heritability estimates in childhood and adolescence, focusing on periods of growth and development to study the genetic etiology of obesity risk is justified.
Statements
Acknowledgments
The authors would like to thank all authors of the papers included in this study, as well as participants in the contributing studies. This work was supported by the Medical Research Council.
Conflict of interest
The authors declare that the research was conducted in the absence of any commercial or financial relationships that could be construed as a potential conflict of interest.
Abbreviations
BMI, body mass index; DZ, dizygotic; MZ, monozygotic.
References
1
AbneyM.McpeekM. S.OberC. (2001). Broad and narrow heritabilities of quantitative traits in a founder population. Am. J. Hum. Genet.68, 1302–1307.10.1086/320112
2
AllisonD. B.HeshkaS.NealeM. C.LykkenD. T.HeymsfieldS. B. (1994). A genetic analysis of relative weight among 4,020 twin pairs, with an emphasis on sex effects. Health Psychol.13, 362–365.10.1037/0278-6133.13.4.362
3
AlmasyL.BlangeroJ. (1998). Multipoint quantitative-trait linkage analysis in general pedigrees. Am. J. Hum. Genet.62, 1198–1211.10.1086/301844
4
AndreasenC. H.Stender-PetersenK. L.MogensenM. S.TorekovS. S.WegnerL.AndersenG.NielsenA. L.AlbrechtsenA.Borch-JohnsenK.RasmussenS. S.ClausenJ. O.SandbaekA.LauritzenT.HansenL.JorgensenT.PedersenO.HansenT. (2008). Low physical activity accentuates the effect of the FTO rs9939609 polymorphism on body fat accumulation. Diabetes57, 95–101.10.2337/db07-0910
5
AryaR.DuggiralaR.ComuzzieA. G.PuppalaS.ModemS.BusiB. R.CrawfordM. H. (2002). Heritability of anthropometric phenotypes in caste populations of Visakhapatnam, India. Hum. Biol.74, 325–344.10.1353/hub.2002.0026
6
AustinM. A.FriedlanderY.NewmanB.EdwardsK.Mayer-DavisE. J.KingM. C. (1997). Genetic influences on changes in body mass index: a longitudinal analysis of women twins. Obes. Res.5, 326–331.
7
BairdJ.OsmondC.MacgregorA.SniederH.HalesC. N.PhillipsD. I. (2001). Testing the fetal origins hypothesis in twins: the Birmingham twin study. Diabetologia44, 33–39.10.1007/s001250051577
8
BastarracheaR. A.KentJ. W.Jr.RozadaG.ColeS. A.Lopez-AlvarengaJ. C.AradillasC.Brito-ZuritaO.Cerda-FloresR. M.Ibarra-CostillaE.GallegosE.Laviada-MolinaH.Hernandez-EscalanteV.RosasJ.MachadoA.VadilloF.RamosM.LazaldeB.Santa-OlallaJ.MaccluerJ. W.ComuzzieA. G. (2007). Heritability and genetic correlations of metabolic disease-related phenotypes in Mexico: preliminary report from the GEMM family study. Hum. Biol.79, 121–129.10.1353/hub.2007.0021
9
BayoumiR. A.Al-YahyaeeS. A.AlbarwaniS. A.RizviS. G.Al-HadabiS.Al-UbaidiF. F.Al-HinaiA. T.Al-KindiM. N.AdnanH. T.Al-BarwanyH. S.ComuzzieA. G.CaiG.Lopez-AlvarengaJ. C.HassanM. O. (2007). Heritability of determinants of the metabolic syndrome among healthy Arabs of the Oman family study. Obesity (Silver Spring)15, 551–556.10.1038/oby.2007.555
10
BijkerkC.Houwing-DuistermaatJ. J.ValkenburgH. A.MeulenbeltI.HofmanA.BreedveldF. C.PolsH. A.Van DuijnC. M.SlagboomP. E. (1999). Heritabilities of radiologic osteoarthritis in peripheral joints and of disc degeneration of the spine. Arthritis Rheum.42, 1729–1735.10.1002/1529-0131(199908)42:8<1729::AID-ANR23>3.0.CO;2-H
11
BogaertV.TaesY.KoningsP.Van SteenK.De BacquerD.GoemaereS.ZmierczakH.CrabbeP.KaufmanJ. M. (2008). Heritability of blood concentrations of sex-steroids in relation to body composition in young adult male siblings. Clin. Endocrinol. (Oxf.)69, 129–135.10.1111/j.1365-2265.2008.03173.x
12
BokerS.NealeM. C.MaesM.WildeM.SpiegelM.BrickT. R.SpiesJ.EstabrookR.KennyS.BatesT.MehtaP.FoxJ. (2011). OpenMx: an open source extended structural equation modeling framework. Psychometrika76, 306–31710.1007/s11336-010-9200-6
13
ButteN. F.CaiG.ColeS. A.ComuzzieA. G. (2006). Viva la Familia Study: genetic and environmental contributions to childhood obesity and its comorbidities in the Hispanic population. Am. J. Clin. Nutr.84, 646–654; quiz 673–644.
14
CarmichaelC. M.McGueM. (1995). A cross-sectional examination of height, weight, and body mass index in adult twins. J. Gerontol. A Biol. Sci. Med. Sci.50, B237–B244.10.1093/gerona/50A.4.B237
15
CoadyS. A.JaquishC. E.FabsitzR. R.LarsonM. G.CupplesL. A.MyersR. H. (2002). Genetic variability of adult body mass index: a longitudinal assessment in Framingham families. Obes. Res.10, 675–681.10.1038/oby.2002.91
16
CornesB. K.ZhuG.MartinN. G. (2007). Sex differences in genetic variation in weight: a longitudinal study of body mass index in adolescent twins. Behav. Genet.37, 648–660.10.1007/s10519-007-9165-0
17
de OliveiraC. M.PereiraA. C.De AndradeM.SolerJ. M.KriegerJ. E. (2008). Heritability of cardiovascular risk factors in a Brazilian population: Baependi Heart Study. BMC Med. Genet.9, 32.10.1186/1471-2156-9-32
18
DengF. Y.LeiS. F.LiM. X.JiangC.DvornykV.DengH. W. (2006). Genetic determination and correlation of body mass index and bone mineral density at the spine and hip in Chinese Han ethnicity. Osteoporos. Int.17, 119–124.10.1007/s00198-005-1930-4
19
Estourgie-van BurkG. F.BartelsM.Van BeijsterveldtT. C.Delemarre-Van De WaalH. A.BoomsmaD. I. (2006). Body size in five-year-old twins: heritability and comparison to singleton standards. Twin Res. Hum. Genet.9, 646–655.10.1375/twin.9.5.646
20
FaithM. S.PietrobelliA.NunezC.HeoM.HeymsfieldS. B.AllisonD. B. (1999). Evidence for independent genetic influences on fat mass and body mass index in a pediatric twin sample. Pediatrics104, 61–67.10.1542/peds.104.1.61
21
ForbesG. B.SauerE. P.WeitkampL. R. (1995). Lean body mass in twins. Metab. Clin. Exp.44, 1442–1446.10.1016/0026-0495(95)90144-2
22
FraylingT. M.TimpsonN. J.WeedonM. N.ZegginiE.FreathyR. M.LindgrenC. M.PerryJ. R.ElliottK. S.LangoH.RaynerN. W.ShieldsB.HarriesL. W.BarrettJ. C.EllardS.GrovesC. J.KnightB.PatchA. M.NessA. R.EbrahimS.LawlorD. A.RingS. M.Ben-ShlomoY.JarvelinM. R.SovioU.BennettA. J.MelzerD.FerrucciL.LoosR. J.BarrosoI.WarehamN. J.KarpeF.OwenK. R.CardonL. R.WalkerM.HitmanG. A.PalmerC. N.DoneyA. S.MorrisA. D.SmithG. D.HattersleyA. T.MccarthyM. I. (2007). A common variant in the FTO gene is associated with body mass index and predisposes to childhood and adult obesity. Science316, 889–894.10.1126/science.1141634
23
FriedlanderY.MeinerV.SharonN.SiscovickD. S.MiserezA. R. (2009). Leptin, insulin, and obesity-related phenotypes: genetic influences on levels and longitudinal changes. Obesity (Silver Spring)17, 1458–1460.
24
GuoS. W. (2001). Does higher concordance in monozygotic twins than in dizygotic twins suggest a genetic component?Hum. Hered.51, 121–132.10.1159/000053333
25
HarbordR.SteichenS. (2004). METAREG: Stata Module to Perform Meta-Analysis Regression. Statistical Software Components S446201. Boston: Boston College Department of Economics.
26
HardyR.WillsA. K.WongA.ElksC. E.WarehamN. J.LoosR. J.KuhD.OngK. K. (2010). Life course variations in the associations between FTO and MC4R gene variants and body size. Hum. Mol. Genet.19, 545–552.10.1093/hmg/ddp504
27
HarrisJ. R.TambsK.MagnusP. (1995). Sex-specific effects for body mass index in the new Norwegian twin panel. Genet. Epidemiol.12, 251–265.10.1002/gepi.1370120303
28
HaworthC. M.CarnellS.MeaburnE. L.DavisO. S.PlominR.WardleJ. (2008). Increasing heritability of BMI and stronger associations with the FTO gene over childhood. Obesity (Silver Spring)16, 2663–2668.10.1038/oby.2008.434
29
HenkinL.BergmanR. N.BowdenD. W.EllsworthD. L.HaffnerS. M.LangefeldC. D.MitchellB. D.NorrisJ. M.RewersM.SaadM. F.StammE.WagenknechtL. E.RichS. S. (2003). Genetic epidemiology of insulin resistance and visceral adiposity. The IRAS family study design and methods. Ann. Epidemiol.13, 211–217.10.1016/S1047-2797(02)00412-X
30
HerskindA. M.McgueM.SorensenT. I.HarvaldB. (1996). Sex and age specific assessment of genetic and environmental influences on body mass index in twins. Int. J. Obes. Relat. Metab. Disord.20, 106–113.
31
HettemaJ. M.NealeM. C.KendlerK. S. (1995). Physical similarity and the equal-environment assumption in twin studies of psychiatric disorders. Behav. Genet.25, 327–335.10.1007/BF02197281
32
HewittJ. K.StunkardA. J.CarrollD.SimsJ.TurnerJ. R. (1991). A twin study approach towards understanding genetic contributions to body size and metabolic rate. Acta Genet. Med. Gemellol. (Roma)40, 133–146.
33
HuntM. S.KatzmarzykP. T.PerusseL.RiceT.RaoD. C.BouchardC. (2002). Familial resemblance of 7-year changes in body mass and adiposity. Obes. Res.10, 507–517.10.1038/oby.2002.69
34
HuntS. C.HasstedtS. J.KuidaH.StultsB. M.HopkinsP. N.WilliamsR. R. (1989). Genetic heritability and common environmental components of resting and stressed blood pressures, lipids, and body mass index in Utah pedigrees and twins. Am. J. Epidemiol.129, 625–638.
35
HurY. M. (2007). Sex difference in heritability of BMI in South Korean adolescent twins. Obesity (Silver Spring)15, 2908–2911.10.1038/oby.2007.346
36
HurY. M.KaprioJ.IaconoW. G.BoomsmaD. I.McgueM.SilventoinenK.MartinN. G.LucianoM.VisscherP. M.RoseR. J.HeM.AndoJ.OokiS.NonakaK.LinC. C.LajunenH. R.CornesB. K.BartelsM.Van BeijsterveldtC. E.ChernyS. S.MitchellK. (2008). Genetic influences on the difference in variability of height, weight and body mass index between Caucasian and East Asian adolescent twins. Int. J. Obes. (Lond.)32, 1455–1467.10.1038/ijo.2008.144
37
JeeS. H.SuhI.WonS. Y.KimM. Y. (2002). Familial correlation and heritability for cardiovascular risk factors. Yonsei Med. J.43, 160–164.
38
KnoblauchH.BusjahnA.Muller-MyhsokB.FaulhaberH. D.SchusterH.UhlmannR.LuftF. C. (1999). Peroxisome proliferator-activated receptor gamma gene locus is related to body mass index and lipid values in healthy nonobese subjects. Arterioscler. Thromb. Vasc. Biol.19, 2940–2944.10.1161/01.ATV.19.12.2940
39
KorkeilaM.KaprioJ.RissanenA.KoskenvuoM. (1991). Effects of gender and age on the heritability of body mass index. Int. J. Obes.15, 647–654.
40
KyvikK. (2000). “Generalisability and assumptions of twin studies,” in Advances in Twin and Sib-Pair Analysis, eds SpectorT.SneiderH.MacgregorA. (London: Greenwich Medical Media Ltd.), 67–78.
41
LajunenH. R.KaprioJ.Keski-RahkonenA.RoseR. J.PulkkinenL.RissanenA.SilventoinenK. (2009). Genetic and environmental effects on body mass index during adolescence: a prospective study among Finnish twins. Int. J. Obes. (Lond.)33, 559–567.10.1038/ijo.2009.51
42
LawlorD. A.MishraG. D. (2009). Family Matters. Designing, Analysing and Understanding Family Based Studies in Life Course Epidemiology. Oxford: Oxford University Press.
43
LiX.QuinonesM. J.WangD.Bulnes-EnriquezI.JimenezX.De La RosaR.AureaG. L.TaylorK. D.HsuehW. A.RotterJ. I.YangH. (2006). Genetic effects on obesity assessed by bivariate genome scan: the Mexican-American coronary artery disease study. Obesity (Silver Spring)14, 1192–1200.10.1038/oby.2006.136
44
LiuP. H.JiangY. D.ChenW. J.ChangC. C.LeeT. C.SunH. S.ChuangL. M. (2008). Genetic and environmental influences on adiponectin, leptin, and BMI among adolescents in Taiwan: a multivariate twin/sibling analysis. Twin Res. Hum. Genet.11, 495–504.10.1375/twin.11.5.495
45
LonginiI. M.Jr.HigginsM. W.HintonP. C.MollP. P.KellerJ. B. (1984). Genetic and environmental sources of familial aggregation of body mass in Tecumseh, Michigan. Hum. Biol.56, 733–757.
46
LoosR. J.LindgrenC. M.LiS.WheelerE.ZhaoJ. H.ProkopenkoI.InouyeM.FreathyR. M.AttwoodA. P.BeckmannJ. S.BerndtS. I.JacobsK. B.ChanockS. J.HayesR. B.BergmannS.BennettA. J.BinghamS. A.BochudM.BrownM.CauchiS.ConnellJ. M.CooperC.SmithG. D.DayI.DinaC.DeS.DermitzakisE. T.DoneyA. S.ElliottK. S.ElliottP.EvansD. M.Sadaf FarooqiI.FroguelP.GhoriJ.GrovesC. J.GwilliamR.HadleyD.HallA. S.HattersleyA. T.HebebrandJ.HeidI. M.LaminaC.GiegerC.IlligT.MeitingerT.WichmannH. E.HerreraB.HinneyA.HuntS. E.JarvelinM. R.JohnsonT.JolleyJ. D.KarpeF.KeniryA.KhawK. T.LubenR. N.ManginoM.MarchiniJ.McardleW. L.McginnisR.MeyreD.MunroeP. B.MorrisA. D.NessA. R.NevilleM. J.NicaA. C.OngK. K.O’RahillyS.OwenK. R.PalmerC. N.PapadakisK.PotterS.PoutaA.QiL.RandallJ. C.RaynerN. W.RingS. M.SandhuM. S.ScheragA.SimsM. A.SongK.SoranzoN.SpeliotesE. K.SyddallH. E.TeichmannS. A.TimpsonN. J.TobiasJ. H.UdaM.VogelC. I.WallaceC.WaterworthD. M.WeedonM. N.WillerC. J.Wraight YuanX.ZegginiE.HirschhornJ. N.StrachanD. P.OuwehandW. H.CaulfieldM. J.SamaniN. J.FraylingT. M.VollenweiderP.WaeberG.MooserV.DeloukasP.McCarthyM. I.WarehamN. J.BarrosoI.JacobsK. B.ChanockS. J.HayesR. B.LaminaC.GiegerC.IlligT.MeitingerT.WichmannH. E.KraftP.HankinsonS. E.HunterD. J.HuF. B.LyonH. N.VoightB. F.RidderstraleM.GroopL.ScheetP.SannaS.AbecasisG. R.AlbaiG.NagarajaR.SchlessingerD.JacksonA. U.TuomilehtoJ.CollinsF. S.BoehnkeM.MohlkeK. L. (2008). Common variants near MC4R are associated with fat mass, weight and risk of obesity. Nat. Genet.40, 768–775.10.1038/ng.140
47
LukeA.GuoX.AdeyemoA. A.WilksR.ForresterT.LoweW.Jr.ComuzzieA. G.MartinL. J.ZhuX.RotimiC. N.CooperR. S. (2001). Heritability of obesity-related traits among Nigerians, Jamaicans and US black people. Int. J. Obes. Relat. Metab. Disord.25, 1034–1041.10.1038/sj.ijo.0801650
48
MacgregorS.CornesB. K.MartinN. G.VisscherP. M. (2006). Bias, precision and heritability of self-reported and clinically measured height in Australian twins. Hum. Genet.120, 571–580.10.1007/s00439-006-0240-z
49
MaesH. H.NealeM. C.EavesL. J. (1997). Genetic and environmental factors in relative body weight and human adiposity. Behav. Genet.27, 325–351.10.1023/A:1025635913927
50
ManolioT. A.CollinsF. S.CoxN. J.GoldsteinD. B.HindorffL. A.HunterD. J.MccarthyM. I.RamosE. M.CardonL. R.ChakravartiA.ChoJ. H.GuttmacherA. E.KongA.KruglyakL.MardisE.RotimiC. N.SlatkinM.ValleD.WhittemoreA. S.BoehnkeM.ClarkA. G.EichlerE. E.GibsonG.HainesJ. L.MackayT. F.MccarrollS. A.VisscherP. M. (2009). Finding the missing heritability of complex diseases. Nature461, 747–753.10.1038/nature08494
51
MollP. P.BurnsT. L.LauerR. M. (1991). The genetic and environmental sources of body mass index variability: the Muscatine Ponderosity Family Study. Am. J. Hum. Genet.49, 1243–1255.
52
NarkiewiczK.SzczechR.WinnickiM.ChrostowskaM.PawlowskiR.Lysiak-SzydlowskaW.ChoeI.KatoM.SivitzW. I.Krupa-WojciechowskaB.SomersV. K. (1999). Heritability of plasma leptin levels: a twin study. J. Hypertens.17, 27–31.10.1097/00004872-199917020-00009
53
NealeM. C.CardonL. R. (1992). Methodology for Genetic Studies of Twins and Families. Norwell, MA: Kluwer Academic.
54
NelsonT. L.BrandonD. T.WigginsS. A.WhitfieldK. E. (2006). Genetic and environmental influences on body fat and blood pressure in African-American adult twins. Int. J. Obes. (Lond.)30, 243–250.10.1038/sj.ijo.0803121
55
OokiS.YamadaK.AsakaA. (1993). Zygosity diagnosis of twins by questionnaire for twins’ mothers. Acta Genet. Med. Gemellol. (Roma)42, 17–22.
56
OrdonanaJ. R.Rebollo-MesaI.Gonzalez-JavierF.Perez-RiquelmeF.Martinez-SelvaJ. M.WillemsenG.BoomsmaD. I. (2007). Heritability of body mass index: a comparison between the Netherlands and Spain. Twin Res. Hum. Genet.10, 749–756.10.1375/twin.10.5.749
57
PatelS. R.LarkinE. K.RedlineS. (2008). Shared genetic basis for obstructive sleep apnea and adiposity measures. Int. J. Obes. (Lond.)32, 795–800.10.1038/ijo.2008.198
58
PietilainenK. H.KaprioJ.RissanenA.WinterT.RimpelaA.VikenR. J.RoseR. J. (1999). Distribution and heritability of BMI in Finnish adolescents aged 16y and 17y: a study of 4884 twins and 2509 singletons. Int. J. Obes. Relat. Metab. Disord.23, 107–115.10.1038/sj.ijo.0800767
59
PoulsenP.VaagA.KyvikK.Beck-NielsenH. (2001). Genetic versus environmental aetiology of the metabolic syndrome among male and female twins. Diabetologia44, 537–543.10.1007/s001250051659
60
RijsdijkF. V.ShamP. C. (2002). Analytic approaches to twin data using structural equation models. Brief. Bioinformatics3, 119–133.10.1093/bib/3.2.119
61
SaleM. M.FreedmanB. I.HicksP. J.WilliamsA. H.LangefeldC. D.GallagherC. J.BowdenD. W.RichS. S. (2005). Loci contributing to adult height and body mass index in African American families ascertained for type 2 diabetes. Ann. Hum. Genet.69, 517–527.10.1046/j.1529-8817.2005.00176.x
62
SarnaS.KaprioJ.SistonenP.KoskenvuoM. (1978). Diagnosis of twin zygosity by mailed questionnaire. Hum. Hered.28, 241–254.10.1159/000152964
63
SchousboeK.VisscherP. M.ErbasB.KyvikK. O.HopperJ. L.HenriksenJ. E.HeitmannB. L.SorensenT. I. (2004). Twin study of genetic and environmental influences on adult body size, shape, and composition. Int. J. Obes. Relat. Metab. Disord.28, 39–48.10.1038/sj.ijo.0802524
64
SchousboeK.WillemsenG.KyvikK. O.MortensenJ.BoomsmaD. I.CornesB. K.DavisC. J.FagnaniC.HjelmborgJ.KaprioJ.De LangeM.LucianoM.MartinN. G.PedersenN.PietilainenK. H.RissanenA.SaarniS.SorensenT. I.Van BaalG. C.HarrisJ. R. (2003). Sex differences in heritability of BMI: a comparative study of results from twin studies in eight countries. Twin Res.6, 409–421.10.1375/136905203770326411
65
SegalN. L.AllisonD. B. (2002). Twins and virtual twins: bases of relative body weight revisited. Int. J. Obes. Relat. Metab. Disord.26, 437–441.10.1038/sj.ijo.0801941
66
SharpS. (1998). Meta-Analysis Regression. Stata Technical Bulletin. Texas: StataCorp LP, 7.
67
SilventoinenK.BartelsM.PosthumaD.Estourgie-Van BurkG. F.WillemsenG.Van BeijsterveldtT. C.BoomsmaD. I. (2007a). Genetic regulation of growth in height and weight from 3 to 12 years of age: a longitudinal study of Dutch twin children. Twin Res. Hum. Genet.10, 354–363.10.1375/twin.10.2.354
68
SilventoinenK.PietilainenK. H.TyneliusP.SorensenT. I.KaprioJ.RasmussenF. (2007b). Genetic and environmental factors in relative weight from birth to age 18: the Swedish young male twins study. Int. J. Obes. (Lond.)31, 615–621.10.1038/sj.ijo.0803577
69
SilventoinenK.RokholmB.KaprioJ.SorensenT. I. (2010). The genetic and environmental influences on childhood obesity: a systematic review of twin and adoption studies. Int. J. Obes. (Lond.)34, 29–40.10.1038/ijo.2009.177
70
SourenN. Y.PaulussenA. D.LoosR. J.GielenM.BeunenG.FagardR.DeromC.VlietinckR.ZeegersM. P. (2007). Anthropometry, carbohydrate and lipid metabolism in the East Flanders Prospective Twin Survey: heritabilities. Diabetologia50, 2107–2116.10.1007/s00125-007-0784-z
71
SpeliotesE. K.WillerC. J.BerndtS. I.MondaK. L.ThorleifssonG.JacksonA. U.AllenH. L.LindgrenC. M.LuanJ.MagiR.RandallJ. C.VedantamS.WinklerT. W.QiL.WorkalemahuT.HeidI. M.SteinthorsdottirV.StringhamH. M.WeedonM. N.WheelerE.WoodA. R.FerreiraT.WeyantR. J.SegreA. V.EstradaK.LiangL.NemeshJ.ParkJ. H.GustafssonS.KilpelainenT. O.YangJ.Bouatia-NajiN.EskoT.FeitosaM. F.KutalikZ.ManginoM.RaychaudhuriS.ScheragA.SmithA. V.WelchR.ZhaoJ. H.AbenK. K.AbsherD. M.AminN.DixonA. L.FisherE.GlazerN. L.GoddardM. E.Heard-CostaN. L.HoeselV.HottengaJ. J.JohanssonA.JohnsonT.KetkarS.LaminaC.LiS.MoffattM. F.MyersR. H.NarisuN.PerryJ. R.PetersM. J.PreussM.RipattiS.RivadeneiraF.SandholtC.ScottL. J.TimpsonN. J.TyrerJ. P.Van WingerdenS.WatanabeR. M.WhiteC. C.WiklundF.BarlassinaC.ChasmanD. I.CooperM. N.JanssonJ. O.LawrenceR. W.PellikkaN.ProkopenkoI.ShiJ.ThieringE.AlavereH.AlibrandiM. T.AlmgrenP.ArnoldA. M.AspelundT.AtwoodL. D.BalkauB.BalmforthA. J.BennettA. J.Ben-ShlomoY.BergmanR. N.BergmannS.BiebermannH.BlakemoreA. I.BoesT.BonnycastleL. L.BornsteinS. R.BrownM. J.BuchananT. A.BusoneroF.CampbellH.CappuccioF. P.Cavalcanti-ProençaC.ChenY. D.ChenC. M.ChinesP. S.ClarkeR.CoinL.ConnellJ.DayI. N.den HeijerM.DuanJ.EbrahimS.ElliottP.ElosuaR.EiriksdottirG.ErdosM. R.ErikssonJ. G.FacherisM. F.FelixS. B.Fischer-PosovszkyP.FolsomA. R.FriedrichN.FreimerN. B.FuM.GagetS.GejmanP. V.GeusE. J.GiegerC.GjesingA. P.GoelA.GoyetteP.GrallertH.GrässlerJ.GreenawaltD. M.GrovesC. J.GudnasonV.GuiducciC.HartikainenA. L.HassanaliN.HallA. S.HavulinnaA. S.HaywardC.HeathA. C.HengstenbergC.HicksA. A.HinneyA.HofmanA.HomuthG.HuiJ.IglW.IribarrenC.IsomaaB.JacobsK. B.JarickI.JewellE.JohnU.JørgensenT.JousilahtiP.JulaA.KaakinenM.KajantieE.KaplanL. M.KathiresanS.KettunenJ.KinnunenL.KnowlesJ. W.KolcicI.KönigI. R.KoskinenS.KovacsP.KuusistoJ.KraftP.KvaløyK.LaitinenJ.LantieriO.LanzaniC.LaunerL. J.LecoeurC.LehtimäkiT.LettreG.LiuJ.LokkiM. L.LorentzonM.LubenR. N.LudwigB.MAGICManuntaP.MarekD.MarreM.MartinN. G.McArdleW. L.McCarthyA.McKnightB.MeitingerT.MelanderO.MeyreD.MidthjellK.MontgomeryG. W.MorkenM. A.MorrisA. P.MulicR.NgwaJ. S.NelisM.NevilleM. J.NyholtD. R.O’DonnellC. J.O’RahillyS.OngK. K.OostraB.ParéG.ParkerA. N.PerolaM.PichlerI.PietiläinenK. H.PlatouC. G.PolasekO.PoutaA.RafeltS.RaitakariO.RaynerN. W.RidderstråleM.RiefW.RuokonenA.RobertsonN. R.RzehakP.SalomaaV.SandersA. R.SandhuM. S.SannaS.SaramiesJ.SavolainenM. J.ScheragS.SchipfS.SchreiberS.SchunkertH.SilanderK.SinisaloJ.SiscovickD. S.SmitJ. H.SoranzoN.SovioU.StephensJ.SurakkaI.SwiftA. J.TammesooM. L.TardifJ. C.Teder-LavingM.TeslovichT. M.ThompsonJ. R.ThomsonB.TönjesA.TuomiT.van MeursJ. B.van OmmenG. J.VatinV.ViikariJ.Visvikis-SiestS.VitartV.VogelC. I.VoightB. F.WaiteL. L.WallaschofskiH.WaltersG. B.WidenE.WiegandS.WildS. H.WillemsenG.WitteD. R.WittemanJ. C.XuJ.ZhangQ.ZgagaL.ZieglerA.ZittingP.BeilbyJ. P.FarooqiI. S.HebebrandJ.HuikuriH. V.JamesA. L.KähönenM.LevinsonD. F.MacciardiF.NieminenM. S.OhlssonC.PalmerL. J.RidkerP. M.StumvollM.BeckmannJ. S.BoeingH.BoerwinkleE.BoomsmaD. I.CaulfieldM. J.ChanockS. J.CollinsF. S.CupplesL. A.SmithG. D.ErdmannJ.FroguelP.GrönbergH.GyllenstenU.HallP.HansenT.HarrisT. B.HattersleyA. T.HayesR. B.HeinrichJ.HuF. B.HveemK.IlligT.JarvelinM. R.KaprioJ.KarpeF.KhawK. T.KiemeneyL. A.KrudeH.LaaksoM.LawlorD. A.MetspaluA.MunroeP. B.OuwehandW. H.PedersenO.PenninxB. W.PetersA.PramstallerP. P.QuertermousT.ReinehrT.RissanenA.RudanI.SamaniN. J.SchwarzP. E.ShuldinerA. R.SpectorT. D.TuomilehtoJ.UdaM.UitterlindenA.ValleT. T.WabitschM.WaeberG.WarehamN. J.WatkinsH.Procardis ConsortiumWilsonJ. F.WrightA. F.ZillikensM. C.ChatterjeeN.McCarrollS. A.PurcellS.SchadtE. E.VisscherP. M.AssimesT. L.BoreckiI. B.DeloukasP.FoxC. S.GroopL. C.HarituniansT.HunterD. J.KaplanR. C.MohlkeK. L.O’ConnellJ. R.PeltonenL.SchlessingerD.StrachanD. P.van DuijnC. M.WichmannH. E.FraylingT. M.ThorsteinsdottirU.AbecasisG. R.BarrosoI.BoehnkeM.StefanssonK.NorthK. E.McCarthyM. I.HirschhornJ. N.IngelssonE.LoosR. J. (2010). Association analyses of 249,796 individuals reveal 18 new loci associated with body mass index. Nat. Genet.42, 937–948.10.1038/ng.686
72
StunkardA. J.FochT. T.HrubecZ. (1986). A twin study of human obesity. JAMA256, 51–54.10.1001/jama.256.1.51
73
StunkardA. J.HarrisJ. R.PedersenN. L.McclearnG. E. (1990). The body-mass index of twins who have been reared apart. N. Engl. J. Med.322, 1483–1487.10.1056/NEJM199005243222102
74
ThompsonS. G.SharpS. J. (1999). Explaining heterogeneity in meta-analysis: a comparison of methods. Stat. Med.18, 2693–2708.10.1002/(SICI)1097-0258(19991030)18:20<2693::AID-SIM235>3.0.CO;2-V
75
ThorleifssonG.WaltersG. B.GudbjartssonD. F.SteinthorsdottirV.SulemP.HelgadottirA.StyrkarsdottirU.GretarsdottirS.ThorlaciusS.JonsdottirI.JonsdottirT.OlafsdottirE. J.OlafsdottirG. H.JonssonT.JonssonF.Borch-JohnsenK.HansenT.AndersenG.JorgensenT.LauritzenT.AbenK. K.VerbeekA. L.RoeleveldN.KampmanE.YanekL. R.BeckerL. C.TryggvadottirL.RafnarT.BeckerD. M.GulcherJ.KiemeneyL. A.PedersenO.KongA.ThorsteinsdottirU.StefanssonK. (2009). Genome-wide association yields new sequence variants at seven loci that associate with measures of obesity. Nat. Genet.41, 18–24.10.1038/ng.274
76
TreuthM. S.ButteN. F.EllisK. J.MartinL. J.ComuzzieA. G. (2001). Familial resemblance of body composition in prepubertal girls and their biological parents. Am. J. Clin. Nutr.74, 529–533.
77
VinckW. J.VlietinckR.FagardR. H. (1999). The contribution of genes, environment and of body mass to blood pressure variance in young adult males. J. Hum. Hypertens.13, 191–197.10.1038/sj.jhh.1000784
78
VisscherP. M.GordonS.NealeM. C. (2008a). Power of the classical twin design revisited: II detection of common environmental variance. Twin Res. Hum. Genet.11, 48–54.10.1375/twin.11.1.48
79
VisscherP. M.HillW. G.WrayN. R. (2008b). Heritability in the genomics era – concepts and misconceptions. Nat. Rev. Genet.9, 255–266.10.1038/nrg2322
80
VoglerG. P.SorensenT. I.StunkardA. J.SrinivasanM. R.RaoD. C. (1995). Influences of genes and shared family environment on adult body mass index assessed in an adoption study by a comprehensive path model. Int. J. Obes. Relat. Metab. Disord.19, 40–45.
81
WardleJ.CarnellS.HaworthC. M.PlominR. (2008). Evidence for a strong genetic influence on childhood adiposity despite the force of the obesogenic environment. Am. J. Clin. Nutr.87, 398–404.
82
WatsonN. F.BuchwaldD.VitielloM. V.NoonanC.GoldbergJ. (2010). A twin study of sleep duration and body mass index. J. Clin. Sleep. Med.6, 11–17.
83
WillerC. J.SpeliotesE. K.LoosR. J.LiS.LindgrenC. M.HeidI. M.BerndtS. I.ElliottA. L.JacksonA. U.LaminaC.LettreG.LimN.LyonH. N.MccarrollS. A.PapadakisK.QiL.RandallJ. C.RoccaseccaR. M.SannaS.ScheetP.WeedonM. N.WheelerE.ZhaoJ. H.JacobsL. C.ProkopenkoI.SoranzoN.TanakaT.TimpsonN. J.AlmgrenP.BennettA.BergmanR. N.BinghamS. A.BonnycastleL. L.BrownM.BurttN. P.ChinesP.CoinL.CollinsF. S.ConnellJ. M.CooperC.SmithG. D.DennisonE. M.DeodharP.ElliottP.ErdosM. R.EstradaK.EvansD. M.GianninyL.GiegerC.GillsonC. J.GuiducciC.HackettR.HadleyD.HallA. S.HavulinnaA. S.HebebrandJ.HofmanA.IsomaaB.JacobsK. B.JohnsonT.JousilahtiP.JovanovicZ.KhawK. T.KraftP.KuokkanenM.KuusistoJ.LaitinenJ.LakattaE. G.LuanJ.LubenR. N.ManginoM.McardleW. L.MeitingerT.MulasA.MunroeP. B.NarisuN.NessA. R.NorthstoneK.O’RahillyS.PurmannC.ReesM. G.RidderstraleM.RingS. M.RivadeneiraF.RuokonenA.SandhuM. S.SaramiesJ.ScottL. J.ScuteriA.SilanderK.SimsM. A.SongK.StephensJ.StevensS.StringhamH. M.TungY. C.ValleT. T.Van DuijnC. M.VimaleswaranK. S.VollenweiderP.WaeberG.WallaceC.WatanabeR. M.WaterworthD. M.WatkinsN.Wellcome Trust Case Control ConsortiumWittemanJ. C.ZegginiE.ZhaiG.ZillikensM. C.AltshulerD.CaulfieldM. J.ChanockS. J.FarooqiI. S.FerrucciL.GuralnikJ. M.HattersleyA. T.HuF. B.JarvelinM. R.LaaksoM.MooserV.OngK. K.OuwehandW. H.SalomaaV.SamaniN. J.SpectorT. D.TuomiT.TuomilehtoJ.UdaM.UitterlindenA. G.WarehamN. J.DeloukasP.FraylingT. M.GroopL. C.HayesR. B.HunterD. J.MohlkeK. L.PeltonenL.SchlessingerD.StrachanD. P.WichmannH. E.McCarthyM. I.BoehnkeM.BarrosoI.AbecasisG. R.HirschhornJ. N.Genetic Investigation of ANthropometric Traits Consortium. (2009). Six new loci associated with body mass index highlight a neuronal influence on body weight regulation. Nat. Genet.41, 25–34.10.1038/ng.287
84
WuD. M.HongY.SunC. A.SungP. K.RaoD. C.ChuN. F. (2003). Familial resemblance of adiposity-related parameters: results from a health check-up population in Taiwan. Eur. J. Epidemiol.18, 221–226.10.1023/A:1023337917377
85
YangJ.BenyaminB.McevoyB. P.GordonS.HendersA. K.NyholtD. R.MaddenP. A.HeathA. C.MartinN. G.MontgomeryG. W.GoddardM. E.VisscherP. M. (2011). Common SNPs explain a large proportion of the heritability for human height. Nat. Genet.42, 565–569.10.1038/ng.608
86
ZabanehD.ChambersJ. C.ElliottP.ScottJ.BaldingD. J.KoonerJ. S. (2009). Heritability and genetic correlations of insulin resistance and component phenotypes in Asian Indian families using a multivariate analysis. Diabetologia52, 2585–2589.10.1007/s00125-009-1504-7
Appendix
Figure A1
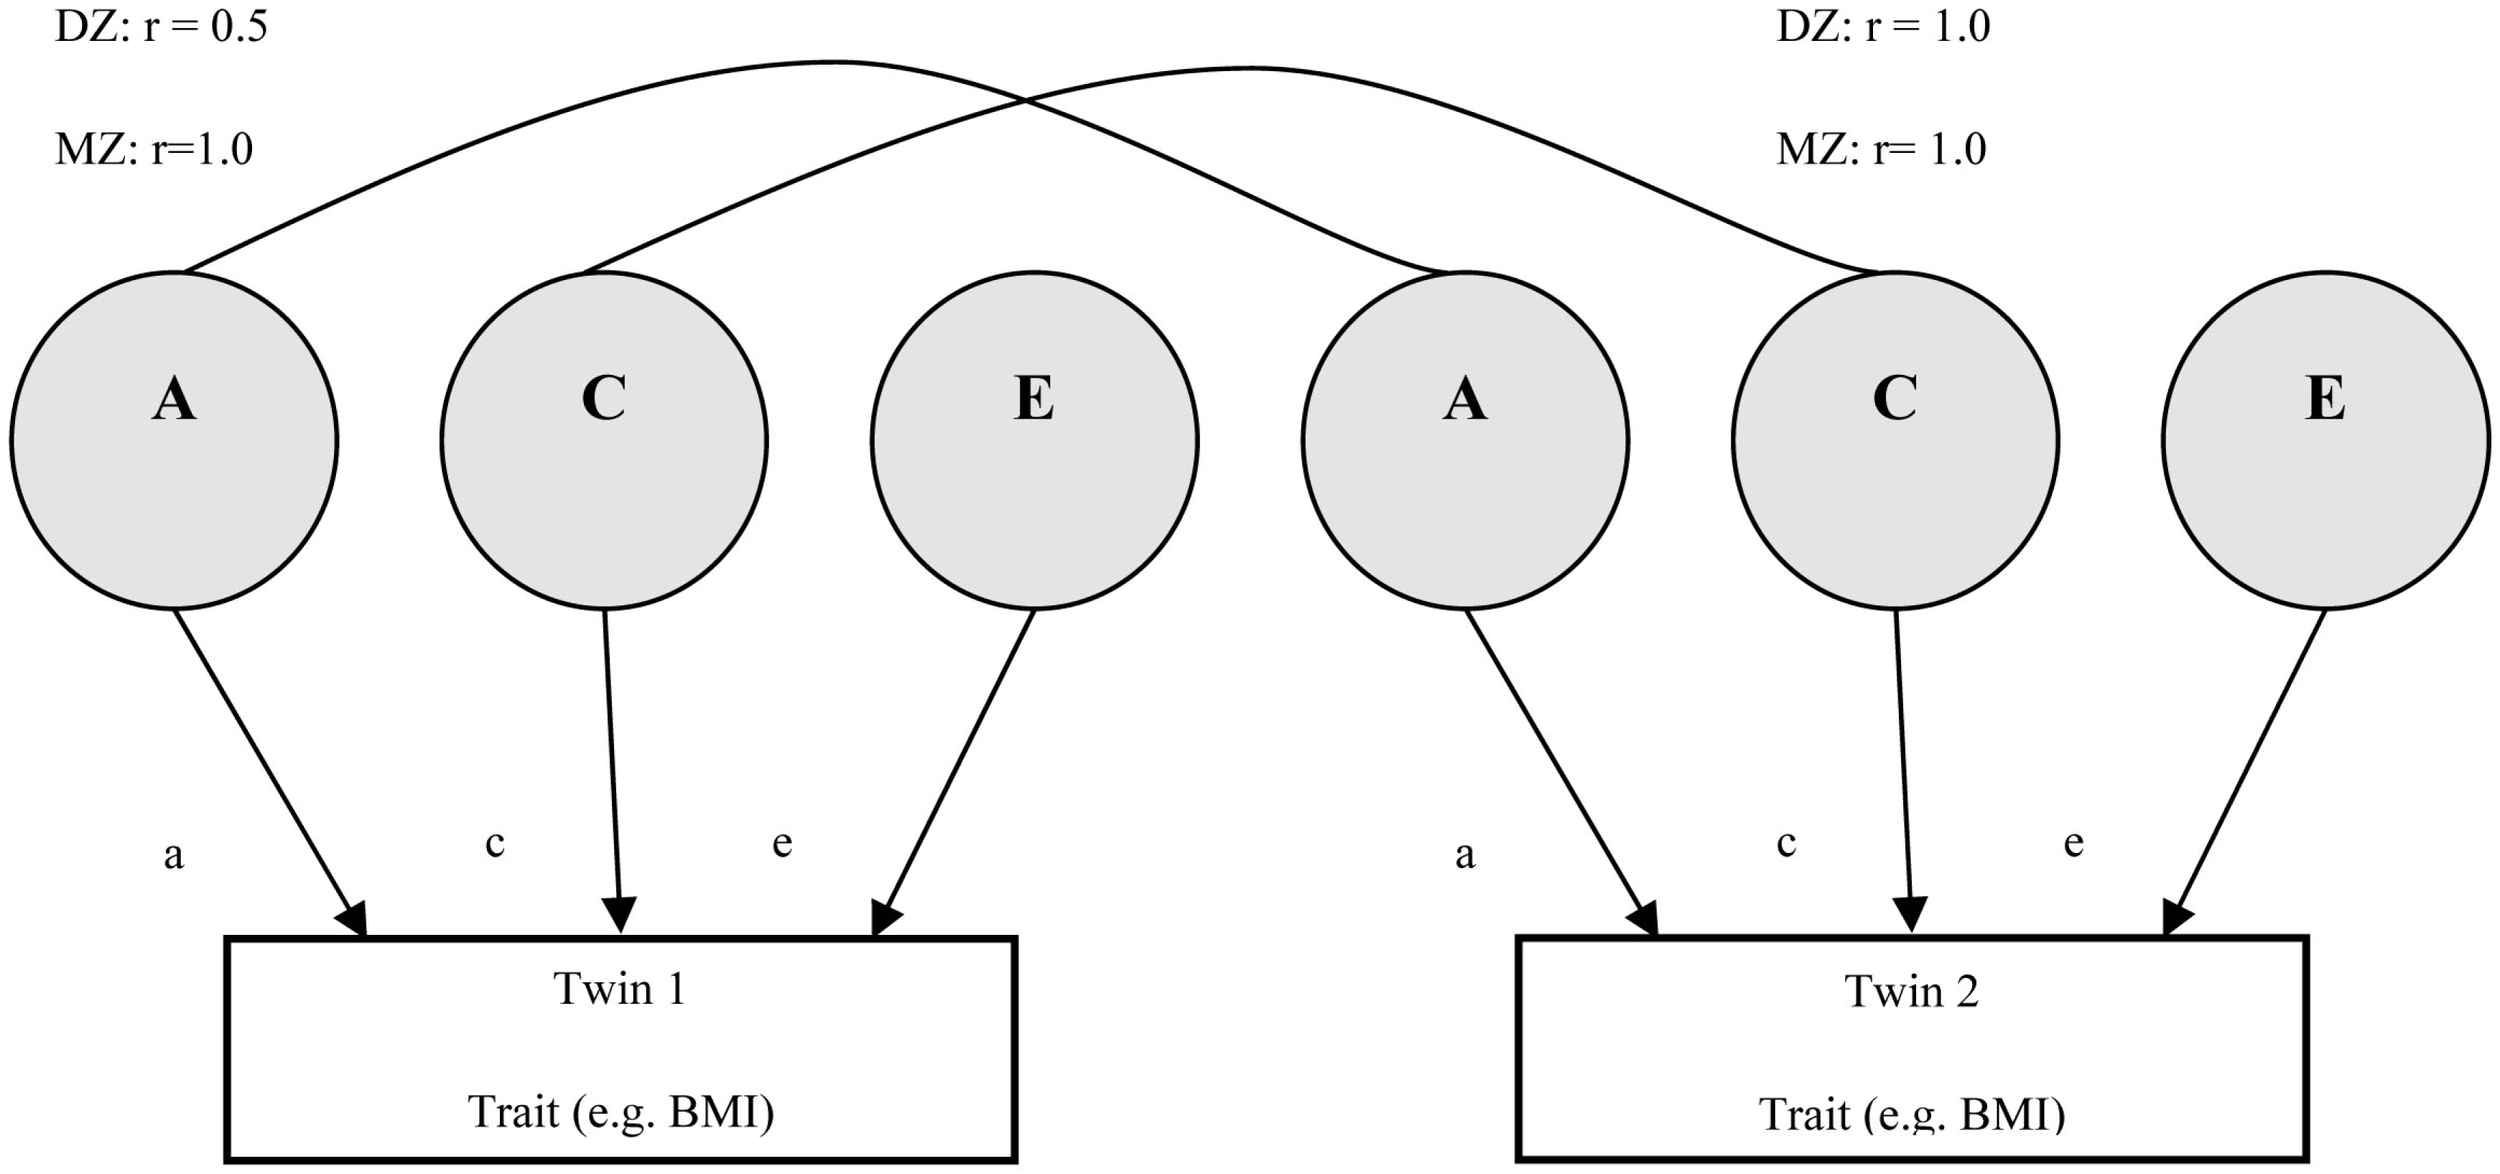
Modeling heritability in twin studies. This diagram shows how twin studies can model variance components, based on the path diagram proposed by Neale and Cardon (1992). The lines adjoining variance components indicate the degree of correlation (r), shown for both monozygotic (MZ) and dizygotic (DZ) twins. Additive genetic variance (A) is 100% correlated for MZ twin pairs and 50% correlated for DZ twin pairs. Common environment is shared (C) 100% by both types of twin. E represents a unique environmental component, and hence there is no correlation. Statistical modeling allows phenotypic variance to be quantitatively decomposed into A, C, and E subcomponents (the ACE model). The estimate of A gives a measure of the heritability of the trait. In a more parsimonious AE model, the C component would be missing from this diagram.
Figure A2
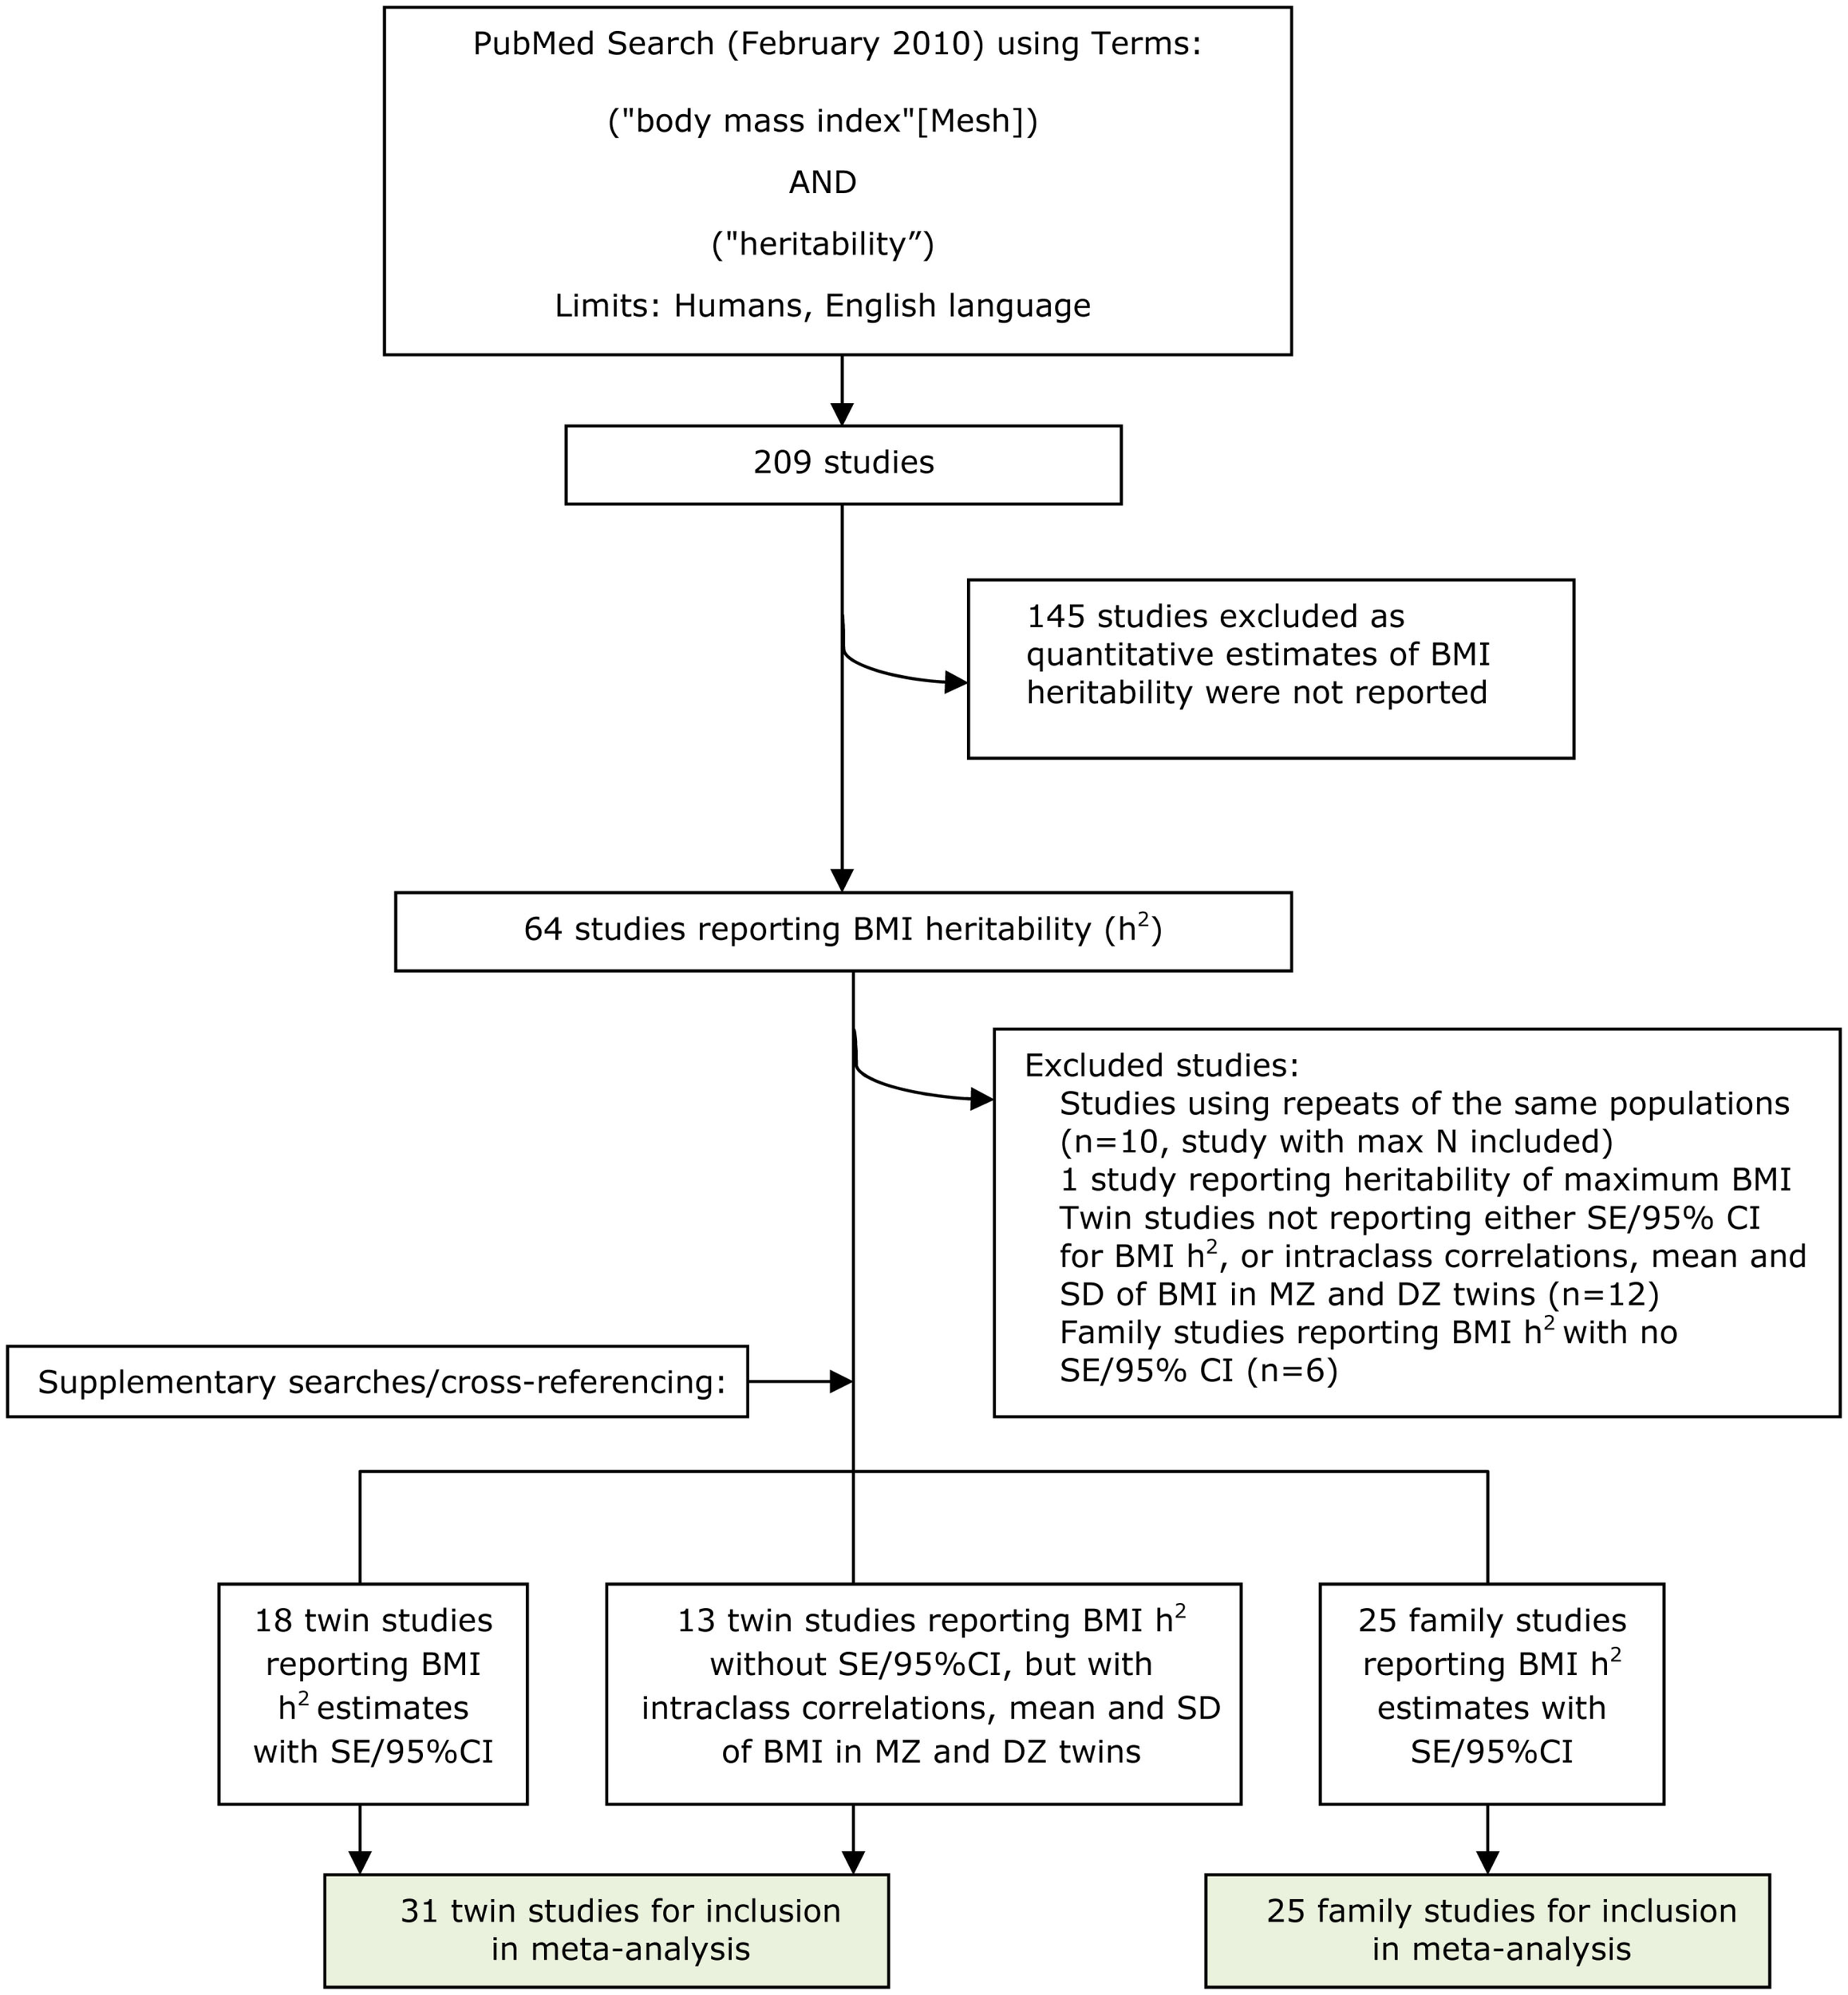
Flow chart of identification of relevant literature.
Summary
Keywords
body mass index, twin study, family study, heritability
Citation
Elks CE, den Hoed M, Zhao JH, Sharp SJ, Wareham NJ, Loos RJF and Ong KK (2012) Variability in the Heritability of Body Mass Index: A Systematic Review and Meta-Regression. Front. Endocrin. 3:29. doi: 10.3389/fendo.2012.00029
Received
20 October 2011
Accepted
07 February 2012
Published
28 February 2012
Volume
3 - 2012
Edited by
David Meyre, McMaster University, Canada
Reviewed by
Claire M. A. Haworth, King’s College London, UK; Christian Dina, CNRS, France; Jane Wardle, University College London, UK
Copyright
© 2012 Elks, den Hoed, Zhao, Sharp, Wareham, Loos and Ong.
This is an open-access article distributed under the terms of the Creative Commons Attribution Non Commercial License, which permits non-commercial use, distribution, and reproduction in other forums, provided the original authors and source are credited.
*Correspondence: Ken K. Ong, Medical Research Council Epidemiology Unit, Institute of Metabolic Science, Addenbrooke’s Hospital Box 285, Cambridge CB2 0QQ, UK. e-mail: ken.ong@mrc-epid.cam.ac.uk
This article was submitted to Frontiers in Genomic Endocrinology, a specialty of Frontiers in Endocrinology.
Disclaimer
All claims expressed in this article are solely those of the authors and do not necessarily represent those of their affiliated organizations, or those of the publisher, the editors and the reviewers. Any product that may be evaluated in this article or claim that may be made by its manufacturer is not guaranteed or endorsed by the publisher.