 Jae Min Lee1
 J. Joe Hull2*
 Takeshi Kawai3
 Kazuhide Tsuneizumi1
 Masaaki Kurihara1
 Masaru Tanokura3
 Koji Nagata3
 Hiromichi Nagasawa3
 Shogo Matsumoto1*
- 1 Molecular Entomology Laboratory, RIKEN Advanced Science Institute, Wako, Japan
- 2 USDA-ARS Arid Land Agricultural Research Center, Maricopa, AZ, USA
- 3 Department of Applied Biological Chemistry, Graduate School of Agricultural and Life Sciences, The University of Tokyo, Tokyo, Japan
To facilitate further evaluation of pheromone biosynthesis activating neuropeptide receptor (PBANR) functionality and regulation, we generated cultured insect cell lines constitutively expressing green fluorescent protein chimeras of the recently identified Bombyx mori PBANR (BommoPBANR) and Pseudaletia separata PBANR (PsesePBANR) variants. Fluorescent chimeras included the BommoPBANR-A, -B, and -C variants and the PsesePBANR-B and -C variants. Cell lines expressing non-chimeric BommoPBANR-B and -C variants were also generated. Functional evaluation of these transformed cell lines using confocal laser microscopy revealed that a Rhodamine Red-labeled PBAN derivative (RR-C10PBANR2K) specifically co-localized with all of the respective PBANR variants at the plasma membrane. Near complete internalization of the fluorescent RR-C10PBANR2K ligand 30 min after binding was observed in all cell lines except those expressing the BommoPBANR-A variant, in which the ligand/receptor complex remained at the plasma membrane. Fluorescent Ca2+ imaging further showed that the BommoPBANR-A cell line exhibited drastically different Ca2+ mobilization kinetics at a number of RR-C10PBANR2K concentrations including 10 μM. These observations demonstrate a clear functional difference between the BommoPBANR-A variant and the BommoPBANR-B and -C variants in terms of receptor regulation and activation of downstream effector molecules. We also found that, contrary to previous reports, ligand-induced internalization of BommoPBANR-B and BommoPBANR-C in cell lines stably expressing these variants occurred in the absence of extracellular Ca2+.
Introduction
Since mating in insects is often limited to a specific phase of the photoperiod, the biochemical processes that comprise sex pheromone biosynthesis must be precisely regulated. In most moth species, sex pheromone production in pheromone gland (PG) cells is initiated following the activation of a G protein-coupled receptor (GPCR) by a neurohormone termed pheromone biosynthesis activating neuropeptide (PBAN; Raina et al., 1989; Rafaeli, 2009). In the silkmoth, Bombyx mori, activation of the PBAN receptor (PBANR) triggers an intracellular signal transduction cascade that comprises a canonical store-operated channel (SOC) pathway in which Gq-mediated phospholipase C (PLC) activation triggers the coupling of endoplasmic reticulum-resident STIM with cell surface-localized Orai channels. The influx of extracellular Ca2+ that follows STIM-Orai coupling drives the species-specific enzymatic reactions that culminate in sex pheromone production and release (Matsumoto et al., 2010). Consequently, PBANR plays a critical role in turning the extracellular PBAN signal into the biological response of sex pheromone production.
Based on predicted structural similarities with the mammalian neuromedin U receptor (Park et al., 2002), PBANRs were cloned from PGs of the corn earworm, Helicoverpa zea, and B. mori (Choi et al., 2003; Hull et al., 2004). Both PBANRs were characterized as rhodopsin-like GPCRs that belong to the neuromedin U receptor family and exhibit significant sequence similarities (76%). The B. mori PBANR (BommoPBANR), though, is structurally differentiated by a 67-aa C-terminal extension absent in HelzePBANR that is essential for ligand-induced receptor regulation (Hull et al., 2004, 2005). Until recently, a majority of the PBANRs identified in other moths were of a single isoform that exhibited a truncated C-terminal tail similar to the HelzePBANR, suggesting a potential correlation with species-specific signal transduction pathways (Rafaeli, 2009). Multiple PBANR variants (identified as A, B, and C) that arise from alternative splicing at the 3′-end of the PBANR gene, however, were identified in the tobacco budworm Heliothis virescens (Kim et al., 2008). The HelviPBANR-A variant is homologous to HelzePBANR, while the HelviPBANR-C variant has an extended C-terminal intracellular loop that shares considerable sequence similarity with BommoPBANR. Intriguingly, despite H. virescens and H. zea being derived from the same Heliothinae sub-family, HelviPBANR-C, and not HelviPBANR-A, was preferentially amplified from H. virescens PGs (Kim et al., 2008). The expression of multiple PBANR variants (As, A, B, and C) that arise from alternative splicing of the 3′-end of the PBANR gene was recently confirmed in PGs of several moth species including B. mori, Pseudaletia separata (the Oriental armyworm), Helicoverpa armigera (the cotton bollworm), as well as H. zea (Lee et al., 2012). The unusually high GC-content of the C-terminal tail coding region of the PBANR gene is thought to have contributed to the previous “preferential” amplification of the PBANR-A variant.
Transient expression of enhanced green fluorescent protein (EGFP) chimeras of the PBANR variants in cultured insect Sf9 cells revealed that regardless of moth species the PBANR-B and -C variants localized to the plasma membrane and internalized upon ligand binding. PBANR-A variants likewise localized to the cell surface, but failed to undergo ligand-induced internalization (Lee et al., 2012). While these transient expression studies afforded the opportunity for fast analysis of gene function, their effectiveness in studies that require more reproducible gene expression levels is limited. In the current study, we sought to expand on our previous studies and establish a more advantageous system for evaluating receptor functionality by generating transformed Sf9 cells that constitutively express the BommoPBANR and P. separata PBANR (PsesePBANR) variants.
Materials and Methods
Construction of Expression Plasmids
Chimeric EGFP-fused expression plasmids for the BommoPBANR variants (A, B, and C) and PsesePBANR variants (B and C) were prepared as described (Lee et al., 2012). Non-chimeric expression plasmids for the BommoPBANR variants (B and C) were amplified using a gene specific BommoPBANR sense primer (5′-ATGATGGCAGATGAAACCGTCAAC-3′) with either a BommoPBAR-B antisense primer (5′-TCAGGTAAGTCCTTCTATATTACAG-3′) or a BommoPBANR-C antisense primer (5′-CTATGGAGAGATCGCGATTTTGG-3′) from plasmids containing full-length BommoPBANR-B and BommoPBANR-C, respectively. PCR was performed using thermacylcer conditions consisting of 25 cycles at 94°C for 30 s, 60°C for 30 s, and 72°C for 2 min, and a final extension at 72°C for 7 min. PCR products were sub-cloned using a pIB/V5-His-TOPO TA expression kit (Invitrogen Co., Ltd., Tokyo, Japan) and sequenced to confirm the presence and orientation of the inserts.
Cell Culture and Transfection
Lepidopteran Sf9 insect cells derived from Spodoptera frugiperda (Smith et al., 1985) were cultured in IPL-41 insect medium (Invitrogen) at 27°C. Cells were transfected using 1 μg plasmid DNA and 8 μl Cellfectin II (Invitrogen) according to the manufacturer’s instruction. Forty-eight hours post-transfection, the transfection medium was replaced with fresh IPL-41 insect medium supplemented with 10% fetal bovine serum. Transfected cells were further incubated for 3 weeks in selective medium containing 80 μg/ml (final concentration) blasticidin S (Invitrogen) at 27°C. The selective medium was replaced every 3–4 days until foci formation. To establish clonal cell lines, individual colonies were isolated 3 weeks after transfection and the clonal cells were further cultured for 6–24 months in IPL-41 insect medium containing 10 μg/ml (final concentration) blasticidin S at 27°C.
Southern Blot Analysis
Genomic DNAs were isolated from cell lines constitutively expressing the PBANR variants as well as untransformed Sf9 cells using a NucleoSpin Tissue kit (TaKaRa Bio Inc., Tokyo, Japan) according to the manufacturer’s instruction. Genomic DNAs (10 μg) were digested with BamHI, separated by 0.8% agarose gel electrophoresis and then transferred to a nylon membrane (Hybond N+, Amersham Biosciences, Piscataway, NJ, USA) by capillary blotting. The full-length EGFP sequence (720 base-pair) was used as probe. Labeling of the probe, hybridization and signal detection were done using a DIG DNA Labeling and Detection Kit and DIG Easy Hyb (Roche Applied Sciences, Indianapolis, IN, USA) according to the manufacturer’s instruction. Probe hybridization was performed at 45°C for 18 h at which point the blot was washed twice in an initial solution of 0.1% SDS/2× SSC for 5 min at 22°C and then transferred to 0.1% SDS/0.1× SSC for two 15 min washes at 65°C. Signal was detected using NBT/BCIP (nitro-blue tetrazolium chloride/5-bromo-4-chloro-3′-indolphosphate p-toluidine salt).
Preparation of a Fluorescent PBAN Analog
To facilitate preparation of a fluorescent analog of a synthetic 10-aa peptide corresponding to the C-terminal part of B. mori PBAN (SRTRYFSPRLamide), the Arg at position two was changed to Lys to generate C10PBANR2K (SKTRYFSPRLamide). Lys2 was then labeled with Rhodamine Red succinimidyl ester (Molecular Probes, Eugene, OR, USA) by overnight incubation in 0.1 M sodium bicarbonate (pH 8.2). The conjugated peptide, designated RR-C10PBANR2K, was purified by reversed-phase high-performance liquid chromatography on a Senshu Pak PEGASIL ODS column (10 mm × 150 mm; Senshu Scientific Co., Ltd., Tokyo, Japan) with absorbance monitored at 225 nm. RR-C10PBANR2K was stored at 4°C until used.
Confocal Microscopy
For imaging of ligand-induced internalization of the fluorescent chimera PBANR, Sf9 cells were washed with fresh IPL-41 insect media and incubated in the presence of 50 nM RR-C10PBANR2K for 1 h at 4°C. Cells were then washed twice with cold phosphate-buffered saline (PBS) to remove unbound label and incubated for 30 min at 27°C in 2 ml IPL-41. At the end of the incubation, cells were fixed for 30 min with 4% paraformalin at 4°C, washed twice with cold PBS, and then imaged. For imaging of Ca2+ influx, Sf9 cells stably expressing PBANR variants were incubated in IPL-41 containing 3 μM Fluo4-AM (Molecular Probes) and 0.03% pluronic F-127 (Molecular Probes) for 60 min at 27°C in the dark. Cells were then washed twice with 500 μl IPL-41, incubated in 900 μl insect Ringer’s buffer [RB; 35 mM NaCl, 36 mM KCl, 12 mM CaCl2, 16 mM MgCl2, 274 mM glucose, and 5 mM Tris (pH 7.5)] for 30 min at room temperature in the dark, and imaged for basal Ca2+ levels. For experiments, cells were further incubated for 2–30 min following addition of 100 μl of a 50-nM RR-C10PBANR2K solution and then imaged. Fluorescence images were obtained with a Leica TCS NT or Olympus FV1000D confocal system as described previously (Hull et al., 2004). Images were processed using Photoshop 6.0 (Adobe Systems Inc., San Jose, CA, USA). Statistical analyses were performed in GraphPad Prism 4.0 (Graphpad Software Inc., San Diego, CA, USA) and calculated using one-way analysis of variance with Tukey’s post hoc test for multiple comparisons.
Confocal microscopy-based Ca2+ imaging
Cell lines constitutively expressing the PBANR variants were harvested and incubated in a 24 well glass bottom plate (AGC, Tokyo, Japan) at 27°C for 2 days with 10% FBS in IPL-41. On the day of the experiment, cells were washed three times with IPL-41 and incubated in 250 μl IPL-41 with 0.75 μl F-127 and 1 mM Fura Red AM (Invitrogen) for 30 min in the dark. After incubation, the cells were washed three times with IPL-41, and 300 μl IPL-41 was added to each well. The plate was left in the dark for 20 min to allow hydrolysis of the Fura Red AM ester bond. EGFP and Fura Red fluorescence were obtained on a FV1000D confocal laser microscope (Olympus, Tokyo, Japan) using 488 and 548 nm laser lines, respectively. To measure receptor activation, fluorescence was monitored for 40 scans (1.08 s/scan) and a 100 μl peptide solution, prepared at concentrations of 1, 10, 100, 1000, and 10000 nM, was added to the well after 10 scans. The Fura Red fluorescence was analyzed using the FV1000D software “Fluoview” (Olympus, Tokyo, Japan).
Results
Establishment of Sf9 Transformants that Constitutively Express PBANR Variants
We recently demonstrated that multiple PBANR variants (i.e., PBANR-As, -A, -B, and -C) differentiated only by alternative splicing at the 3′ end of the PBANR gene are expressed in multiple moth species (Lee et al., 2012). Transient expression assays in Sf9 cells revealed that, unlike the other variants, PBANR-As, which lacks an intact seventh transmembrane domain, failed to localize to the plasma membrane and that PBANR-A failed to undergo ligand-induced internalization. Based on these results, we sought to establish a more advantageous system for characterizing the function and regulation of the PBANR-A, -B, and -C variants by generating transformants of each in Sf9 insect cells.
Cultured Sf9 cells were transfected with plasmid DNAs coding for fluorescent chimeras of the BommoPBANR variants (A, B, and C) and then cultured under selective medium containing blasticidin S (final concentration 80 μg/ml) for 3 weeks. We visually selected 24 colonies for expression of the respective EGFP-fused BommoPBANR variants and separately cultured the colonies for more than 6 months in selective medium to confirm transgene integration. We similarly generated Sf9 cell lines constitutively expressing EGFP-fused PsesePBANR-B and -C. Using this approach, multiple transformed lines for the BommoPBANR variants (four lines for A, six lines for B, and five lines for C) and for the PsesePBANR variants (two lines for B and three lines for C) were generated. There were no noticeable differences in cell morphology and growth time amongst the variant cell lines or compared to the non-transformed parent line. Confocal laser microscopy revealed that both the B. mori and P. separata derived PBANR variants were predominantly localized to the plasma membrane (Figures 1Aa–e). In contrast, transiently expressed EGFP localized only to the cytosol and nucleus (Figures 1Af). Southern blot analysis using a probe designed to the EGFP coding sequence confirmed integration of the chimeric transgenes with single to multiple copies present in the genomes of the transformed cell lines but not in the untransformed parental Sf9 cell line (Figure 1B).
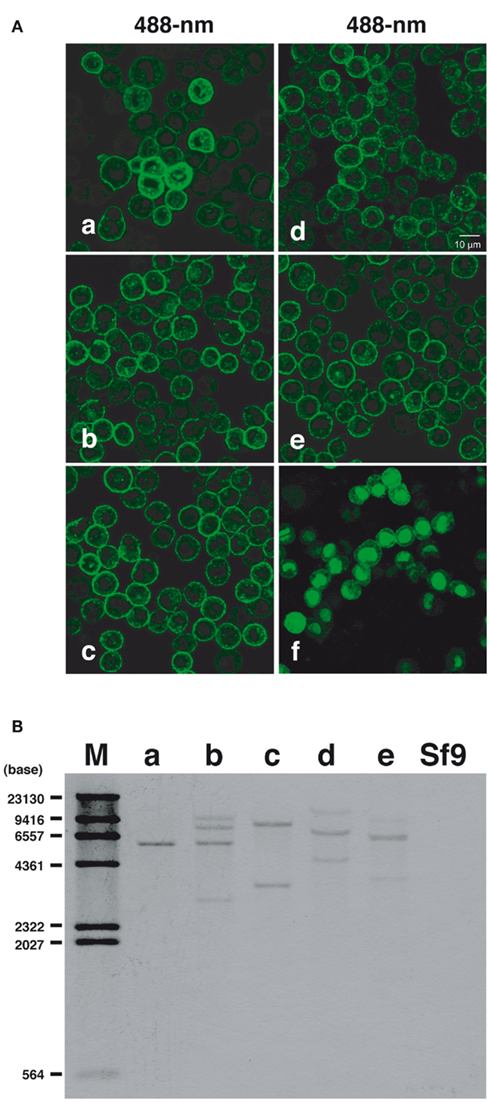
Figure 1. Constitutive expression and genomic integration of PBANR variants in cultured Sf9 cells. (A) Stable cell lines expressing the following: (a) BommoPBANR-A-EGFP, (b) BommoPBANR-B–EGFP, (c) BommoPBANR-C–EGFP, (d) PsesePBANR-B–EGFP, and (e) PsesePBANR-C–EGFP. Sf9 cells transiently expressing EGFP (f). (B) Southern blot analysis using a full-length EGFP cDNA fragment as a probe. Genomic DNAs from stably transformed and non-transformed Sf9 cell lines were digested with BamHI (single site in the pIB/V5-His-TOPO expression vector). One to four bands are detected in the (a) BommoPBANR-A–EGFP, (b) BommoPBANR-B–EGFP, (c) BommoPBANR-C–EGFFP, (d) PsesePBANR-B–EGFP and (e) PsesePBANR-C–EGFP cell lines. No band is seen in the parental Sf9 cell. The positions of DIG labeled DNA size markers are indicated on the left.
Functional Characterization of Stably Expressed PBANR–EGFP Variants
We next sought to confirm the functionality of the PBANR variants by assaying for the influx of extracellular Ca2+ that occurs in response to PBAN binding, an event that has been well documented in various moth species including B. mori (Hull et al., 2007). Using scanning laser confocal microscopy in conjunction with the fluorescent Ca2+ indicator Fluo4-AM, we observed a robust increase (within 2 min) in the intracellular fluorescence of cells expressing BommoPBANR-B–EGFP and BommoPBANR-C–EGFP following the addition of 50 nM of a Rhodamine Red-labeled PBAN derivative (RR-C10PBANR2K; Figure 2A). This Ca2+-associated intracellular fluorescence persisted for 30 min (Figure 2A). No increase was observed in the absence of extracellular Ca2+. These results are consistent with PBAN triggering an influx of extracellular Ca2+ in response to binding and indicate that BommoPBANR-B–EGFP and BommoPBANR-C–EGFP are fully functional in our stable cell lines. Surprisingly, despite clear cell surface localization, all four BommoPBANR-A–EGFP cell lines exhibited significantly different Ca2+mobilization kinetics (Figure 2A) with no indications of an increase in intracellular Ca2+ levels apparent at 2 and 30 min after ligand application. Because no analyses were done at other time points we are unable to rule out the possibilities that: (1) BommoPBANR-A may mediate a more transient Ca2+ signal that dissipates before the 2 min or (2) that the BommoPBANR-A Ca2+ signal is transient within the time frame between our two assay points. Regardless, it is readily apparent that the BommoPBANR-A cell line exhibits a significantly different Ca2+ mobilization profile. Quantitative analyses comparing the levels of fluorescence prior to ligand application and 2 min after ligand application support the results of the imaging experiments (Figure 2B). There was no statistical difference in the fluorescence intensity among the three cell lines after 2 min in the presence of the Ca2+ chelator EGTA, suggesting that any release of intracellular Ca2+ in response to PBAN binding within the first 2 min is below the threshold of detection. In the presence of media replete with Ca2+ both the BommoPBANR-B–EGFP and BommoPBANR-C–EGFP cell lines exhibited a dramatic (∼2.7-fold) increase in intracellular fluorescence (Figure 2B). There, however, was no statistically significant difference between the two lines. As before, there was no PBAN-mediated Ca2+ influx in the BommoPBANR-A–EGFP cell line at this time point (Figure 2B). This functional difference is not the result of impaired ligand binding as RR-C10PBANR2K clearly co-localized with BommoPBANR-A–EGFP at the cell surface (Figure 2C). To examine the possibility that BommoPBANR-A may be functioning as a low affinity receptor, we measured the relative fluorescence intensities of the respective cell lines (normalized to BommoPBANR-C–EGFP activation with 100 nM C10PBANR2K) using a different Ca2+ indicator, Fura Red, following the addition of varying concentrations (1 nM–10 μM) of C10PBANR2K (Figure 2D). No increase in fluorescence was observed in the BommoPBANR-A–EGFP cell line at the time point assayed even at the 10-μM concentration. The BommoPBANR-B cell lines, both with and without the EGFP tag, exhibited decreased response profiles when challenged with ligand concentrations below 100 nM. In contrast, there was no significant difference in the response profiles amongst the BommoPBANR-C cell lines at any of the concentrations tested, suggesting that the BommoPBANR-C variant is the more responsive variant.
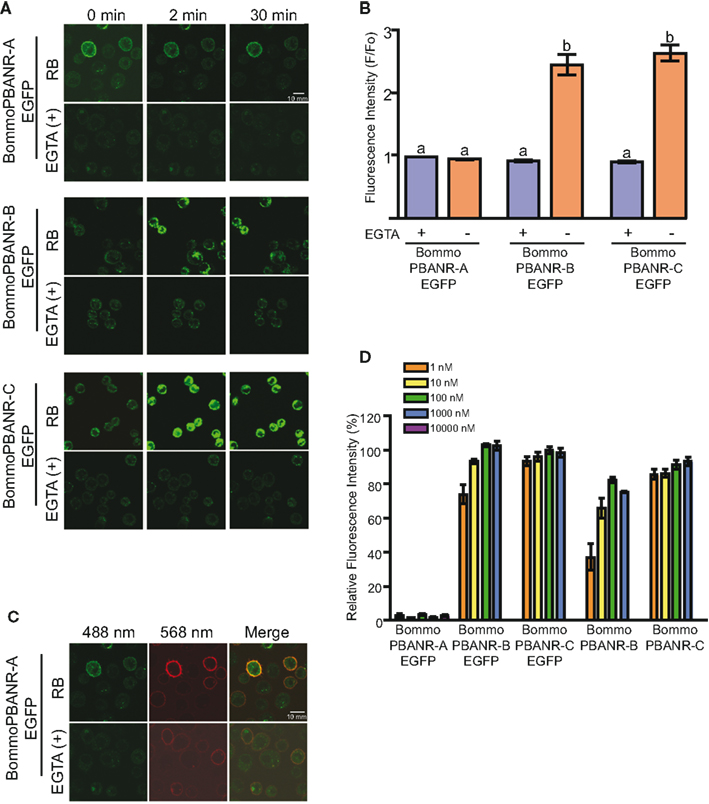
Figure 2. Ligand-induced influx of extracellular Ca2+ in stable Sf9 cell lines. (A). RR-C10PBANR2K (50 nM) induced influx of extracellular Ca2+ in Sf9 cell lines stably transformed with BommoPBANR–EGFP fluorescent chimeras. Cells were incubated in insect Ringer’s buffer (RB) or Ca2+-free RB buffer supplemented with 3 mM EGTA [EGTA(+)]. Cells were imaged before and after (2 and 30 min) addition of RR-C10PBANR2K solution. (B). The fluorescence intensity profile of BommoPBANR–EGFP Sf9 cell lines calculated as F/Fo (i.e., fluorescence prior to ligand application and 2 min after ligand application) in response to RR-C10PBANR2K (50 nM). Bars represent mean values + SEM from independent cells (n = > 8). (C). Confocal imaging of BommoPBANR-A–EGFP cells incubated with RR-C10PBANR2K (50 nM) in the presence and absence of extracellular Ca2+. Co-localization is indicated by yellow in the merged images. (D). Dose–response profile of BommoPBANR cell lines to increasing concentrations (1 nM–10 μM) of C10PBANR2K. Fluorescence intensity was measured on a FV1000D confocal laser scanning microscope using Fura Red as the Ca2+ indicator. The fluorescence intensity is presented relative to BommoPBANR-C–EGFP activation with 100 nM C10PBANR2K. Bars represent mean values + SEM of five replicates per peptide concentration. Different letters denote a statistically significant difference for each sample (one-way ANOVA, p < 0.001).
To further examine the utility of the stably transformed lines, we sought to confirm that the pathway underlying PBANR regulation remained functional. We have previously shown that the PBAN-mediated influx of extracellular Ca2+ activates a regulatory pathway that promotes endocytosis of PBAN-bound PBANR from the cell surface (Hull et al., 2004, 2005, 2011). Consequently, we used RR-C10PBANR2K to examine ligand-induced internalization of the fluorescent chimera PBANR variants (Figure 3). Consistent with previous results obtained in transient expression assays, we found that all of the expressed PBANR variants specifically bound RR-C10PBANR2K (Figures 3Aa–e), but only the PBANR-B and -C variants underwent RR-C10PBAN-induced internalization, as evidenced by the intracellular accumulation of red fluorescent vesicles that co-localized with the EGFP-derived green fluorescent signals (Figures 3Bb–e). RR-C10PBANR2K binding failed to induce internalization in cells expressing BommoPBANR-A as the ligand/receptor complex remained at the plasma membrane even 30 min after RR-C10PBANR2K binding (Figures 3Ba). Unexpectedly, we also observed ligand-induced internalization of BommoPBANR-B and BommoPBANR-C in the presence of EGTA (Figures 3Bg–h).
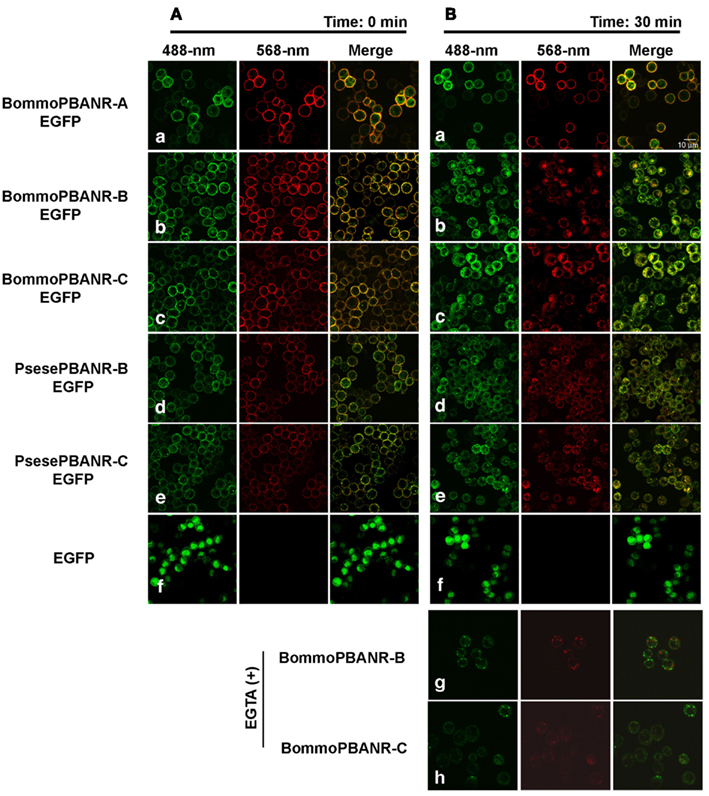
Figure 3. Dynamics of EGFP-tagged PBANR variants stably expressed in Sf9 cells following binding with RR-C10PBANR2K. (A) Confocal imaging immediately after application of 50 nM RR-C10PBANR2K. (B) Confocal imaging 30 min after application of 50 nM RR-C10PBANR2K. For control purposes, Sf9 cells were transfected with an expression plasmid containing EGFP. Co-localization is indicated by yellow in the merged images.
Functional characterization of stably expressed non-fluorescent PBANR variants
To establish Sf9 stable transformants expressing unlabeled (fluorescence-free) PBANR variants, cultured Sf9 cells were transfected with the expression plasmids encoding intact BommoPBANR-B or -C variants and cultured in selective medium containing blasticidin S (final concentration 80 μg/ml) for 3 weeks as described above. To select for the unlabeled BommoPBANR lines, we chose 24 blasticidin-resistant foci and examined ligand-induced PBANR internalization using the RR-C10PBANR2K fluorescent ligand. This approach allowed us to perform precise selection of unlabeled BommoPBANR lines. As a result, we were able to establish three unlabeled BommoPBANR-B lines and two unlabeled BommoPBANR-C lines. Scanning laser confocal microscopy-based Ca2+ influx assays demonstrated that the non-chimeric BommoPBANR-B and BommoPBANR-C lines mobilized extracellular Ca2+ in response to RR-C10PBANR2K stimulation (Figure 4A). The cell lines also underwent ligand-induced internalization as evidenced by the accumulation of numerous intracellular red fluorescent red vesicles (Figure 4B).
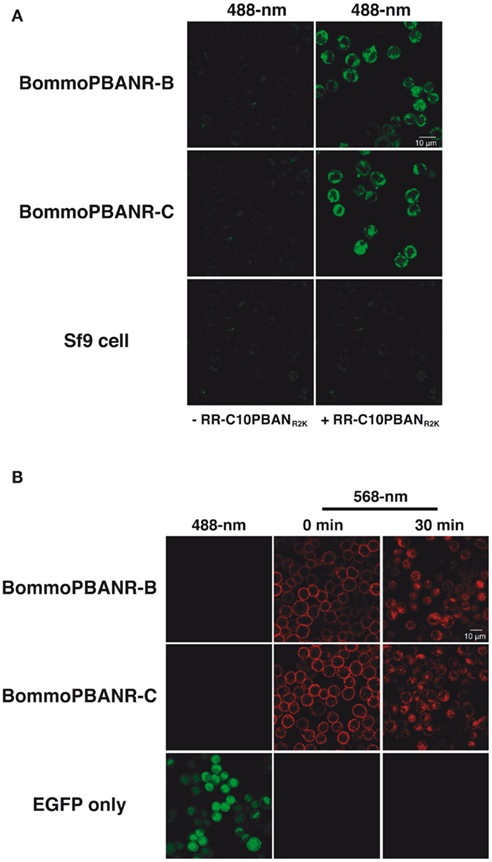
Figure 4. Confocal imaging of Sf9 cell lines stably transformed with non-chimeric BommoPBANR-B and BommoPBANR-C. (A) Dynamics of non-chimeric PBANR variants stably expressed in Sf9 cells upon RR-C10PBANR2K. (B) Influx of extracellular Ca2+ upon RR-C10PBANR2K binding to the intact PBANR variants stably expressed in Sf9 cells. Both receptor internalization and the influx of extracellular Ca2+ were triggered with 50 nM RR-C10PBANR2K.
Discussion
Molecular identification of PBANR in moths was initially attained in H. zea (Choi et al., 2003) and B. mori (Hull et al., 2004). Surprisingly, the respective PBANRs exhibited a striking structural difference at the C-terminus, a 67 amino acid extension in BommoPBANR that is critical for ligand-induced internalization (Hull et al., 2004, 2005). The functional significance of the two receptor subtypes was initially ascribed to differences in signal transduction cascades activated (cAMP dependent/no C-terminal extension vs. cAMP independent/with the C-terminal extension). However, given the significance of GPCR endocytotic trafficking in signal termination, the absence of this domain in HelzePBANR (and many of the other PBANRs identified to date) raises questions regarding receptor regulation. Furthermore, the recent determination that multiple PBANR variants, two of which have C-terminal extensions, are concurrently expressed complicates our understanding of PBANR regulation.
The expression of multiple alternatively spliced PBANR variants (PBANR-As, -A, -B, and -C) appears to be a conserved phenomenon in moths as it has been observed now in six species representing three families (Noctuidae, Sphingidae, and Bombycidae; Lee et al., 2012). Using a transient expression system in cultured insect cells, we initially characterized the functionality of the BommoPBANR variants (Lee et al., 2012). However, while this system provided a rapid means of assessing gene function, we sought a more advantageous system that would offer the opportunity for more complex studies and which could help unravel the current conundrum of PBANR regulation. Consequently, in the current study, our goal was to establish a stable expression system using insect Sf9 cells to constitutively express three of the B. mori PBANR variants and two of the P. separata variants. The shortest variant, PBANR-As, which lacks a complete seventh transmembrane domain, was omitted because it fails to localize to the plasma membrane (Lee et al., 2012).
After establishing the respective cell lines, we sought to confirm that the expressed receptors remained capable of mediating the characteristic influx of extracellular Ca2+ that occurs in response to PBAN binding. Using the fluorescent Ca2+ indicator Fluo4-AM, we observed the robust increase in intracellular fluorescence characteristic of extracellular Ca2+ influx in cells expressing BommoPBANR-B or BommoPBANR-C following RR-C10PBANR2K binding (Figure 2B). Surprisingly, despite clear indications of RR-C10PBANR2K binding, no increase in fluorescence was observed in cells expressing BommoPBANR-A at the time points assayed (Figures 2A,B). The dramatic difference in extracellular Ca2+ mobilization at high concentrations (10 μM) of ligand suggests that the BommoPBANR-A variant most likely does not function as a low affinity receptor. It is, however, possible that the BommoPBANR-A variant may mediate a more transient Ca2+ signal that dissipated prior to our analysis. Because different Ca2+ mobilization kinetics were present in all four BommoPBANR-A cell lines, we concluded that the difference is not the result of a deleterious positional effect following gene insertion during generation of the stable lines. These results in conjunction with the finding that the RR-C10PBANR2K–BommoPBANR-A complex does not undergo endocytotic internalization (Figures 3Ba) suggest that the BommoPBANR-A variant is functionally differentiated from the BommoPBANR-B and -C variants in terms of receptor regulation and activation of downstream effector molecules. Similar differentiation in signaling pathways activated downstream of ligand binding has been reported for the HelviPBANR variants with only the C variant generating a strong Ca2+ signal when expressed in mammalian CHO–WTA11 cells (Kim et al., 2008). The presence of multiple receptor variants such as BommoPBANR-A have been hypothesized to represent a means of fine-tuning responsiveness to extracellular signals with non-responsive receptors potentially functioning to decrease overall cellular sensitivity. Alternatively, the BommoPBANR-A variant may couple to different downstream effector pathways. This latter hypothesis is especially intriguing given the pleiotropic nature of PBAN (Rafaeli, 2009).
Our results have also implicated a role for the BommoPBANR-C-terminus in PBANR signal transduction in addition to signal termination as previously reported (Hull et al., 2004, 2005, 2011). G protein interaction sites have been linked to all three intracellular loops as well as the C-terminal tail of GPCRs (Kristiansen, 2004). The BommoPBANR-A sequence is identical to the B and C variants up to Lys341 (i.e., the cytoplasmic edge of the seventh transmembrane domain) but diverges over its terminal four residues via non-conserved mutations (M342V, T343R, A344N) and C-terminal deletions of 130 and 68 amino acids respectively. Basic residues in the membrane proximal C-terminal tail of the human β1-adrenergic receptor and rat melanin-concentrating hormone receptor 1 have been implicated in G protein coupling (Tetsuka et al., 2004; Delos Santos et al., 2006). Intriguingly, basic residues (Arg350Arg351) near this region are present in both the BommoPBANR-B and C variants but absent in BommoPBANR-A. What specific role the BommoPBANR-C-terminus plays in mediating G protein coupling remains to be determined; however, it is clear that the absence of this region contributes to the different functionality in BommoPBANR-A. Perpelxingly, HelzePBANR, which has been shown to mediate PBAN-induced Ca2+ influx (Choi et al., 2003), also lacks this region. While the first 16 residues of the severely truncated BommoPBANR-A and HelzePBANR C-terminal tails are identical, the terminal 4–5 residues differ (BommoPBANR-A: VRLN vs. HelzePBANR: FKTTA) with HelzePBANR possessing two threonine residues, the hydroxyl groups of which potentially could function via hydrogen bonds to stabilize G protein coupling. Alternatively, a four residue span in the third intracellular loop (BommoPBANR-A:AHTP vs. HelzePBANR:QMQ) could potentially account for the differences in G protein activation. How these residues affect PBANR-G protein coupling and/or activation, however, remains to be determined. Regardless, our findings strongly suggest that the molecular basis of PBANR activation may be species dependent.
We unexpectedly found that ligand-induced internalization in the BommoPBANR-B and C cell lines proceeded even in the presence of EGTA, which limits the availability of extracellular Ca2+. This observation suggests that PBANR internalization may be under the control of intracellular PBAN signaling prior to the influx of extracellular Ca2+. While these findings deviate from our previous report regarding the necessity of extracellular Ca2+ (Hull et al., 2005), they do not necessarily change our model of the mechanisms underlying PBANR function. We have proposed that PBAN signaling comprises a canonical SOC activation pathway utilizing Gq-mediated PLC activation, followed by a molecular interaction between the SOC-linked proteins STIM and Orai, and a subsequent calcium-signaling pathway associated with an influx of extracellular Ca2+ (Matsumoto et al., 2010). A possible explanation for the differing results in the absence of extracellular Ca2+ could be related to the levels of the expressed PBANR. Stable cell lines generally have higher expression levels than transient expression systems. It is possible that the efflux of Ca2+ from the ER following PLC activation is sufficient to trigger the internalization mechanism via heterologous desensitization, a pathway that has been associated with second messenger dependent kinases (Kristiansen, 2004). Previous studies using pharmacological inhibitors of second messenger kinsases, mutation of consensus protein kinase C sites in BommoPBANR-C, and RNA interference-mediated knockdown of Sf9 protein kinase C are consistent with the involvement of the heterologous desensitization pathway (Hull et al., 2005, 2011).
In conclusion, we have established a series of Sf9 cell lines that constitutively express functional BommoPBANR and PsesePBANR variants. Our attempt to utilize these stable transformants for functional evaluation of the PBANR variants confirmed that the cell lines were fully functional and should prove to be viable models for further examining the molecular basis of PBANR activation and regulation. In addition, our current results have further highlighted the functional relevance of both the PBANR-B and PBANR-C variants and raised questions regarding the role of the shorter A variant. It is our expectation that the stable cell lines described will facilitate the development of a more clearly defined understanding of the molecular mechanisms underlying PBANR regulation and activation. This knowledge can then be used to provide greater insights into the broader physiological roles of PBAN and could potentially serve as the basis for defining key targets for novel agrochemical reagents.
Conflict of Interest Statement
The authors declare that the research was conducted in the absence of any commercial or financial relationships that could be construed as a potential conflict of interest.
Acknowledgments
This work was supported by the Lipid Dynamics Research Program from RIKEN and the Targeted Proteins Research Program (TPRP) from the Ministry of Education, Culture, Sports, Science and Technology of Japan.
References
Choi, M. Y., Fuerst, E. J., Rafaeli, A., and Jurenka, R. (2003). Identification of a G protein-coupled receptor for pheromone biosynthesis activating neuropeptide from pheromone glands of the moth Helicoverpa zea. Proc. Natl. Acad. Sci. U.S.A. 100, 9721–9726.
Delos Santos, N. M., Gardner, L. A., White, S. W., and Bahouth, S. W. (2006). Characterization of the residues in helix 8 of the human β1-adrenergic receptor that are involved in coupling the receptor to G proteins. J. Biol. Chem. 281, 12896–12907.
Hull, J. J., Kajigaya, R., Imai, K., and Matsumoto, S. (2007). Sex pheromone production in the silkworm, Bombyx mori, is mediated by store-operated Ca2+ channels. Biosci. Biotechnol. Biochem. 71, 1993–2001.
Hull, J. J., Lee, J. M., and Matsumoto, S. (2011). Identification of specific sites in the third intracellular loop and carboxyl terminus of the Bombyx mori pheromone biosynthesis activating neuropeptide receptor crucial for ligand-induced internalization. Insect Mol. Biol. 20, 801–811.
Hull, J. J., Ohnishi, A., and Matsumoto, S. (2005). Regulatory mechanisms underlying pheromone biosynthesis activating neuropeptide (PBAN) induced internalization of the Bombyx mori PBAN receptor. Biochem. Biophy. Res. Commun. 334, 69–78.
Hull, J. J., Ohnishi, A., Moto, K., Kawasaki, Y., Kurata, R., Suzuki, M. G., and Matsumoto, S. (2004). Cloning and characterization of the pheromone biosynthesis activating neuropeptide receptor from the Silkmoth, Bombyx mori: significance of the carboxyl terminus in receptor internalization. J. Biol. Chem. 279, 51500–51507.
Kim, Y. J., Nachman, R. J., Aimanova, K., Gill, S., and Adams, M. E. (2008). The pheromone biosynthesis activating neuropeptide (PBAN) receptor of Heliothis virescens: identification, functional expression, and structure-activity relationships of ligand analogs. Peptides 29, 268–275.
Kristiansen, K. (2004). Molecular mechanisms of ligand binding, signaling, and regulation within the superfamily of G-protein-coupled receptors: molecular modeling and mutagenesis approaches to receptor structure and function. Pharmacol. Ther. 103, 21–80.
Lee, J. M., Hull, J. J., Kawai, T., Goto, C., Kurihara, M., Tanokura, M., Nagata, K., Nagasawa, H., and Matsumoto, S. (2012). Re-evaluation of the PBANR receptor (PBANR) molecule: characterization of PBANR variants expressed in the pheromone glands of moths. Front. Endocrinol. 3:6.
Matsumoto, S., Ohnishi, A., Lee, J. M., and Hull, J. J. (2010). Unraveling the pheromone biosynthesis activating neuropeptide (PBAN) signal transduction cascade that regulates sex pheromone production in moths. Vitam. Horm. 83, 425–445.
Park, Y., Kim, Y. J., and Adams, M. E. (2002). Identification of G protein-coupled receptors for Drosophila PRXamide peptides, CCAP, corazonin, and AKH supports a theory of ligand-receptor coevolution. Proc. Natl. Acad. Sci. U.S.A. 99, 11423–11428.
Rafaeli, A. (2009). Pheromone biosynthesis activating neuropeptide (PBAN): regulatory role and mode of action. Gen. Comp. Endocrinol. 162, 69–78.
Raina, A. K., Jaffe, H., Kempe, T. G., Keim, P., Blacher, R. W., Fales, H. M., Riley, C. T., Klun, J. A., Ridgway, R. L., and Hayes, D. K. (1989). Identification of a neuropeptide hormone that regulates sex pheromone production in female moths. Science 244, 796–798.
Smith, G. E., Ju, G., Ericson, B. L., Moschera, J., Lahm, H. W., Chizzonite, R., and Summers, M. D. (1985). Modification and secretion of human interleukin 2 produced in insect cells by a baculovirus expression vector. Proc. Natl. Acad. Sci. U.S.A. 82, 8404–8408.
Keywords: PBAN receptor, GPCR, splice variants, ligand-induced internalization, stable transformation
Citation: Lee JM, Hull JJ, Kawai T, Tsuneizumi K, Kurihara M, Tanokura M, Nagata K, Nagasawa H and Matsumoto S (2012) Establishment of Sf9 transformants constitutively expressing PBAN receptor variants: application to functional evaluation. Front. Endocrin. 3:56. doi: 10.3389/fendo.2012.00056
Received: 22 December 2011; Accepted: 01 April 2012;
Published online: 18 April 2012.
Edited by:
Akiyoshi Takahashi, Kitasato University, JapanReviewed by:
Mitsuyo Kishida, Kumamoto University, JapanSho Kakizawa, Kyoto University, Japan
Yoonseong Park, Kansas State University, USA
Copyright: © 2012 Lee, Hull, Kawai, Tsuneizumi, Kurihara, Tanokura, Nagata, Nagasawa and Matsumoto. This is an open-access article distributed under the terms of the Creative Commons Attribution Non Commercial License, which permits non-commercial use, distribution, and reproduction in other forums, provided the original authors and source are credited.
*Correspondence: J. Joe Hull, USDA-ARS Arid Land Agricultural Research Center, 21881 North Cardon Lane, Maricopa, AZ 85138, USA. e-mail:am9lLmh1bGxAYXJzLnVzZGEuZ292; Shogo Matsumoto, RIKEN Advanced Science Institute, 2-1 Hirosawa, Wako, Saitama, 351-0198, Japan. e-mail:c21hdHN1QHJpa2VuLmpw