 Jonathan A. Sobel
 Patrice Waridel
 Ilaria Gori4
 Manfredo Quadroni
 Geraldine O. Canny
- 1The Institute of Bioengineering, School of Life Sciences, Ecole Polytechnique Fédérale de Lausanne, Lausanne, Switzerland
- 2Swiss Institute of Bioinformatics, School of Life Sciences, Ecole Polytechnique Fédérale de Lausanne, Lausanne, Switzerland
- 3Protein Analysis Facility, University of Lausanne, Lausanne, Switzerland
- 4The Francis Crick Institute, London, UK
- 5Ecole Polytechnique Fédérale de Lausanne, Lausanne, Switzerland
Endometriosis affects approximately 10% of women of reproductive age. This chronic, gynecological inflammatory disease results in a decreased quality of life for patients, with the main symptoms including chronic pelvic pain and infertility. The steroid hormone 17-β Estradiol (E2) plays a key role in the pathology. Our previous studies showed that the anti-inflammatory lipid Lipoxin A4 (LXA4) acts as an estrogen receptor-alpha agonist in endometrial epithelial cells, inhibiting certain E2-mediated effects. LXA4 also prevents the progression of endometriosis in a mouse model via anti-proliferative mechanisms and by impacting mediators downstream of ER signaling. The aim of the present study was therefore to examine global proteomic changes evoked by E2 and LXA4 in endometriotic epithelial cells. E2 impacted a greater number of proteins in endometriotic epithelial cells than LXA4. Interestingly, the combination of E2 and LXA4 resulted in a reduced number of regulated proteins, with LXA4 mediating a suppressive effect on E2-mediated signaling. These proteins are involved in diverse pathways of relevance to endometriosis pathology and metabolism, including mRNA translation, growth, proliferation, proteolysis, and immune responses. In summary, this study sheds light on novel pathways involved in endometriosis pathology and further understanding of signaling pathways activated by estrogenic molecules in endometriotic epithelial cells.
Introduction
Endometriosis affects approximately 176 million women worldwide (1). This estrogen-dependant, inflammatory disease is characterized by the presence of endometrial-like tissue outside the uterine cavity, mostly on the pelvic peritoneum and ovaries. Symptoms include severe dysmenorrhea, dyspareunia, dysuria, chronic pelvic pain, and infertility, resulting in a decreased quality of life and significant socioeconomic consequences for patients (2–4).
17-β Estradiol (E2), the most potent estrogen, plays a pivotal role in endometriosis development and progression and is produced in high quantities in endometriotic lesions (5). Lipoxin A4 (LXA4) is an anti-inflammatory and pro-resolving lipid mediator with several anti-inflammatory actions in vitro and in vivo (6, 7). We previously demonstrated that LXA4, which possesses a high degree of structural similarity with the weak estrogen estriol, is an estrogen receptor alpha agonist in endometrial epithelial cells (8). In these studies, LXA4 altered estrogen-regulated gene expression as well as functional parameters, notably proliferation, in human endometrial epithelial cells while also demonstrating antiestrogenic potential in a manner similar to that previously shown for estriol (9, 10). LXA4 also prevented the progression of endometriosis in a mouse model via anti-inflammatory and anti-proliferative mechanisms and by impacting mediators downstream of ER signaling, including epithelial-expressed molecules such as growth regulation by estrogen in breast cancer (11). As such, the proteomic changes induced by this eicosanoid in in vitro models of endometriosis warrants further study.
As the small size of peritoneal endometriotic lesions precludes the culture of sufficient numbers of endometriotic epithelial cells, we used the well-characterized, ER-positive 12Z endometriotic epithelial cell line, originally isolated from peritoneal lesions (12). These cells express inflammatory molecules and exhibit a migrating and invading potential and are therefore an ideal model to study molecular and cellular aspects of endometriosis (13–15).
In recent years, Mass spectrometry (MS) has become a powerful technology to carry out large-scale analyses of cellular proteomes, as it allows qualitative and quantitative analysis of complex mixtures. One widespread quantitative method is based on Isobaric Tags for Relative and Absolute Quantification (iTRAQ) (16), which allows the comparison of multiple combined samples by chemically labeling peptides after digestion of protein extracts. With this labeling, small amine-reactive isobaric mass tags are attached to the N-terminus and lysine residues of peptides. Quantification is then based on a reporter ion generated during peptide fragmentation within the mass spectrometer and specific to each treatment in the mixed sample. The intensities of the reporter ion fragments enable the measurement of relative peptide abundance, and thus of their corresponding proteins (17).
The combination of state-of-the-art experimental strategies and advances in computational methods enables the global study of cellular proteomes. Computer-aided data mining such as annotation enrichment analysis enables more efficient mapping of complex proteomics data to biological processes (18). Searching for precise Gene ontology (GO) terms allows comprehensive summary analysis of large data sets, and the recently developed Cytoscape software is an useful tool to visualize protein–protein or protein–annotation networks (19–21).
The goal of the present study was to perform proteomic profiling of endometriotic epithelial cells to compare and contrast responses to E2, LXA4, and both in combination. LC-MS/MS analyses were carried out for relative quantification of proteins between treatments based on an iTRAQ approach. Interactome data, GO terms and pathway annotations were used to create protein–protein and protein–annotation networks to generate new information on estrogen and lipoxin signaling.
Materials and Methods
Cell Culture
12Z endometriotic epithelial cells (from Dr. Michael Beste, Massachusetts Institute of Technology, Cambridge, MA, USA) were maintained at 37°C in humidified air containing 5% CO2 in phenol red-free DMEM F-12 (Sigma) supplemented with 10% charcoal stripped-fetal bovine serum (CSFBS) (Invitrogen), 1% penicillin/streptomycin, and 1% glutamine (Sigma, Switzerland).
Sample Preparation
6 × 10⁵ cells were seeded in 100-mm dish and treated with either vehicle (denoted control), 10 nM E2, 100 nM LXA4, or 10 nM E2 and 100 nM LXA4 in combination for 24 h. All treatments were carried out in duplicate. After the incubation time had elapsed, cells were rinsed with PBS and harvested by centrifugation. The pellet was washed twice with PBS and resuspended in 100 μl homogenization buffer (8M Urea containing Protease inhibitors). Samples were then sonicated three times for 15 s to solubilize the proteins. Samples were subsequently centrifuged for 15 min at 13,000 rpm and the supernatants were transferred into clean Eppendorf tubes and stored at −20°C. Proteins were quantified using a Bradford protein quantification kit (BioRad, Switzerland). Protein lysates were reduced with 5 mM DDT (Applichem, Switzerland) for 30 min at room temperature and then alkylated with 20 mM iodoacetamide (Sigma, Switzerland) for 30 min at room temperature protected from light. Proteins were precipitated with ethanol-acetate and resuspended in TEAB buffer (500 mM tetraethyl ammonium bicarbonate pH 8). For each sample, 220 μg of proteins was digested overnight at 37°C with 5 μg of trypsin. Thereafter, samples were aliquotted and stored at −80°C.
The samples were labeled with iTRAQ™ reagents (Applied Biosystems) as follows: 12Z non-treated sample 1, iTRAQ reagent 113; 12Z E2-treated sample 1, iTRAQ reagents 114; 12Z LXA4-treated sample 1, iTRAQ reagents 115; 12Z E2 + LXA4-treated sample 1, iTRAQ reagent 116; 12Z non-treated sample 2, iTRAQ reagent 117; 12Z E2-treated sample 2, iTRAQ reagents 118; 12Z LXA4-treated sample, iTRAQ reagents 119; 12Z E2 + LXA4-treated sample 1, iTRAQ reagent 121.
After sample clean-up with Proxeon SCX StageTips, labeling was controlled by LC-MS/MS separately for each sample before mixing of the eight digests. The mixed samples were redissolved in 4M Urea with 0.1% Ampholytes pH 3–10 (GE Healthcare, Switzerland) and fractionated by off-gel focusing as previously described (22). The 24 fractions obtained were desalted on a microC18 96-well plate (Waters Corp., Milford, MA, USA), dried, and resuspended in 0.1% (v/v) formic acid, 3% (v/v) acetonitrile for LC-MS/MS analyses.
LC-MS/MS Analyses
Extracted peptides were analyzed on a hybrid LTQ Orbitrap Velos mass spectrometer (Thermo Fisher Scientific, Bremen, Germany) interfaced to an Ultimate 3000 RSLC nano HPLC system (Dionex, Switzerland). Peptides were separated for 120 min on a reversed-phase nanocolumn Acclaim PepMap RSLC 100A (75 µm ID × 25 cm, 2 µm, Dionex) at a flow rate of 300 nl/min using a H2O: acetonitrile gradient method. Lock mass option was used for full MS scan recalibration with a polydimethylcyclosiloxane ion from ambient air (m/z 445.12003). In data-dependent acquisition controlled by Xcalibur 2.1 software (Thermo Fisher Scientific, Switzerland), the 15 most intense precursor ions detected in the full MS survey performed in the Orbitrap (range 300–1700 m/z, resolution 30,000 at m/z 400) were selected and fragmented. MS/MS was triggered by a minimum signal threshold of 3,000 counts, carried out with stepped relative collision energy between 40 and 50% with an isolation width of 2.1 amu. Only precursors with a charge higher than 1 were selected for HCD fragmentation, and fragment ions were analyzed in the Orbitrap at a resolution of 7,500. The m/z of fragmented precursors was then dynamically excluded, with a tolerance of 10 ppm, for 25 s. To identify peptides, MS/MS files were analyzed with Proteome Discoverer 1.3 (Thermo Fisher Scientific, Switzerland) using Mascot 2.3 (Matrix Science, UK) for database searching. Mascot was set up to search the SwissProt database1 restricted to human taxonomy (database release used was 2011_03, 20,234 sequences after taxonomy filter), using the decoy database search option. Trypsin (cleavage at K and R, not before P) was used as the enzyme definition. Mascot was searched with a fragment ion mass tolerance of 0.02 Da, a parent ion tolerance of 10 ppm, allowing one missed cleavage. Iodoacetamide derivative of cysteine and iTRAQ (eight-plex) modification of lysine and peptide N-terminal were specified as fixed modifications. Deamidation of asparagine and glutamine, oxidation of methionine, and acetylation of protein N-terminal were specified as variable modifications. A False discovery rate (FDR) filter of 1% was applied.
Statistical Analysis
Quantitative protein values were calculated as the median of peptide reporter ion intensities. Proteins with at least one identified peptide with a high confidence (FDR <0.01) in both replicates were considered for quantitative analyses. The protein quantification was normalized using the Lowess function (23). The log2 ratio of the treatment value divided by the control value was calculated for each protein and for each replicate.
The local pooled error test (LPE) was computed for each comparison (E2 versus control, LXA4 versus Control, and LXA4 + E2 versus control) as previously described (24). The FDR-adjusted p-value was computed using the Benjamini–Hochsberg (BH) correction. In our analysis, we defined two sets of proteins of interest, one with LPE p-values <0.05 and a subset group with FDR-adjusted p-values <0.1. Calculations were performed using R statistical software version 2.10.0.
Gene Ontology Analysis
Gene Ontology analysis was performed on significantly differentially expressed proteins for one or more treatments versus control. GO terms were analyzed using DAVID (18)2. Biological process annotations with a minimum set of two annotated proteins in our query and an enrichment p-value <0.05 were used. The results of this analysis were subsequently visualized in Cytoscape v3.2.03 to model the protein–annotation network.
Pathway Annotation Retrieval
KEGG Pathway annotations were retrieved using DAVID (18) with a minimum of two annotated proteins, which were significantly differentially expressed (LPE p-value <0.05) in E2 or LXA4/E2-treated cells. The results of this analysis were subsequently utilized in Cytoscape to model the protein–annotation network.
Protein Network Analysis
Cytoscape software for network visualization was employed to build a protein–protein interaction network (20, 21) using physical interactions, pathway interactions, and genetic regulation interactions from all available sources within GeneMANIA (25). A maximum of 20 proteins were automatically added to our query by GeneMANIA in order to fill potential gaps in our network, using the guilt by association principle.
Western Blotting
Cells were treated with indicated concentrations of E2, LXA4, and both in combination for 24 h in E2-free medium. After the incubation time had elapsed, cells were rinsed with PBS and harvested in 2× SDS sample buffer [125 mM Tris-HCl (pH 6.8), 4% SDS, 20% glycerol, 100 mM DTT, 0.01% bromophenol blue and protease inhibitors (Sigma-Aldrich, Switzerland)]. Thirty micrograms of total protein were loaded and separated on 10% sodium dodecyl sulfate (SDS)-polyacrylamide gels. Proteins were electrophoretically transferred onto nitrocellulose membrane (Biorad Laboratories, Switzerland). The membrane was blocked overnight at 4°C in a 5% fat-free dry milk solution in TBS-containing 0.05% Tween 20 (TBS-T) and subsequently incubated for 1 h at RT with a rabbit anti CSN5 antibody (Abcam, UK) diluted 1:2,000 in 5% fat-free dry milk solution in TBS-T or with a mouse anti β-actin antibody (Sigma Aldrich, Switzerland) diluted 1:8,000. After washing, the membrane was incubated for 1 h with HRP-conjugated anti-rabbit secondary antibody or anti-mouse secondary antibody at a 1:3000 dilution in 5% non-fat milk in TBS-T. Immunoreactive bands were visualized using chemiluminescence (PerkinElmer, Wellesley, MA, USA) and densitometric analysis was performed using ImageJ software.
Results
Our LC-MS/MS analyses (Figure 1A) resulted in the identification of 26,979 peptides (Table S1 in Supplementary Material). Proteins with at least one identified peptide in both replicates were considered for further quantification and analysis, culminating in 3,232 quantified proteins in Figure 1A. A representative spectrum of an iTRAQ quantitative analysis of CSN5 is represented in Figure 1B. CSN5 is a subunit of the COP9 signalosome implicated in diverse biological processes, such as signal transduction, development, and the cell cycle (26). CSN5 exhibited a log fold change of 0.3 between treatments versus control. To benchmark our quantitative approach, we carried out Western blotting for CSN5 (Figure 1D). The Western blot and MS data show a similar pattern (Figures 1C,E) and are highly correlated with a R2 linear regression value of 0.92. Densitometric analysis revealed that CSN5 levels were significantly increased in LXA4E2 conditions versus control (p < 0.05).
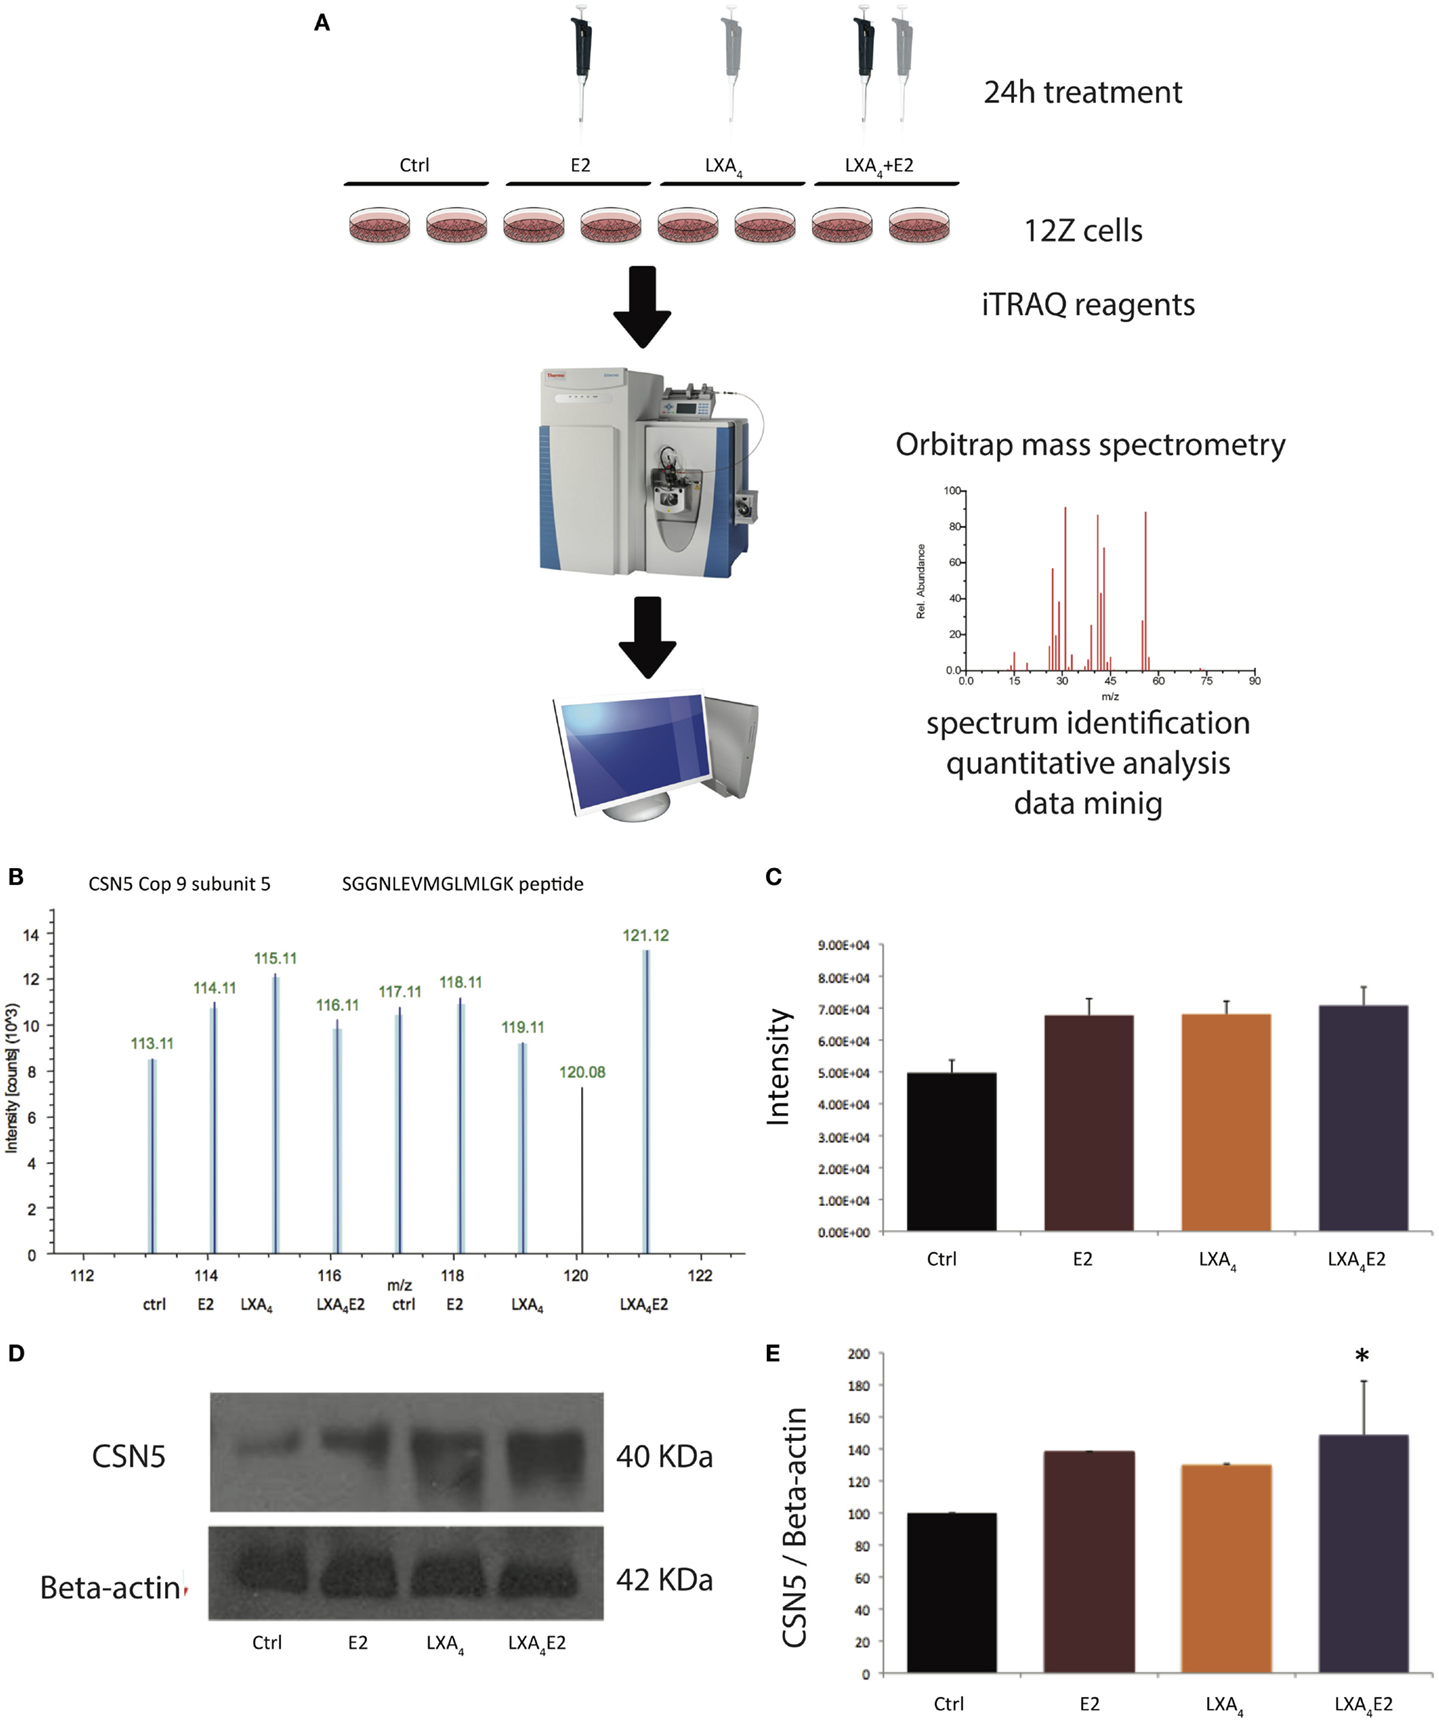
Figure 1. Validation of MS data for COP9 subunit-5 (CSN5) by Western blotting. (A) Schematic of the experimental procedure. (B) Representative reporter ion spectrum for CSN5 in 12Z cells, (C) mean intensity of reporter ions, (D) Western blot, and (E) resultant densitometric values. The bar graph of densitometric analysis shows the ratio of CSN5 to β-Actin protein expressed as a percentage. A representative blot from three independent experiments is shown. *p < 0.05 compared to vehicle-treated cells (ctrl). The reporter ion spectrum is derived from the detection of the SGGNLEVMGLMLGK peptide.
The variability of both replicates in each condition was checked using the logarithm of geometric mean intensity compared to the logarithm of the intensity ratio of the two replicates (Figure S1 in Supplementary Material). Approximately 95% of the protein log2 ratio values were between −0.5 and 0.5 in each condition, indicating a low variability between the two replicates.
Using the LPE test, 348 significantly differentially expressed proteins were identified for at least one treatment, with a p-value <0.05, while a high quality subset of 27 proteins was identified with a FDR-adjusted p-value <0.1, after correction for multiple testing with the BH method. The volcano plot (LPE p-value versus log fold change) representation of E2 versus control (Figure 2A), LXA4 versus control (Figure 2B), and LXA4 in combination with E2 (Figure 2C) provides a general overview of significantly differentially expressed proteins. Many significantly differentially expressed proteins, which passed the LPE test, had a low log2 ratio of approximately 0.3. Interestingly, our data suggest that the combination of both treatments exert a suppressive effect on proteins impacted by E2 alone (Figure 2D). The proteins modulated by both LXA4 and E2 in combination showed only an overlap of 59 proteins, and 148 proteins that were impacted by E2 alone were no longer significantly impacted in cells treated with the combination. The quantitative information for each significantly differentially expressed protein is shown in Table S2 in Supplementary Material.
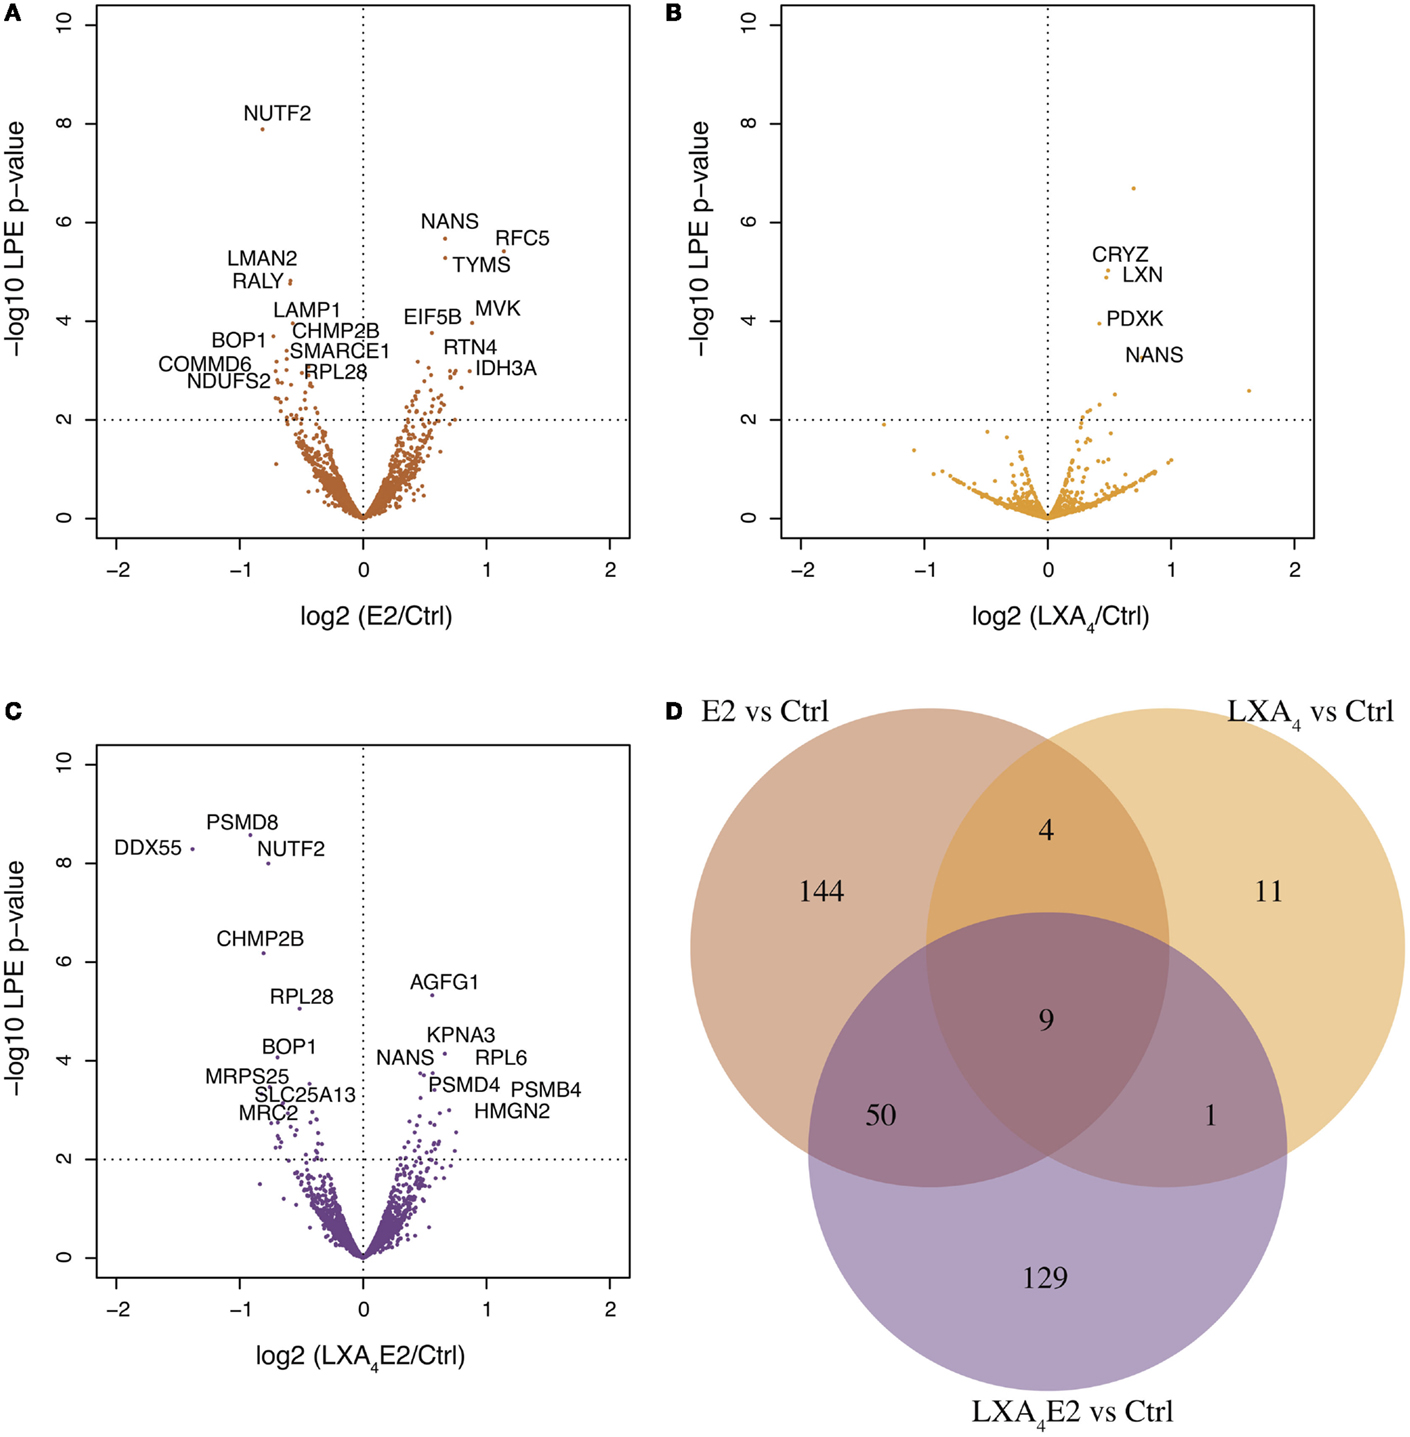
Figure 2. Volcano plots of proteomic changes induced in 12Z cells treated with (A) 10 nM 17-β-estradiol (E2) versus vehicle, denoted ctrl, (B) 100 nM lipoxin A4 (LXA4) versus control, and (C) E2/LXA4 combination versus control. The x-axis shows the log2 ratio of treated sample compared to control while the y-axis is (–1)*log10 (p-value) as calculated using the local pooled error (LPE) test. 348 and 25 significantly differentially expressed proteins were detected, respectively, using the LPE-test (p-value <0.05) and a subset with FDR-adjusted p-value <0.10 (Benjamini–Hochsberg correction), in one or more comparison (treatment versus control). (D) Venn diagram of the 348 significantly differentially expressed proteins in each treated sample versus control. E2 exerted a more marked effect on 12Z endometriotic epithelial cells than LXA4. Treatment with a combination of LXA4 and E2 resulted in a reduction in the number of proteins impacted.
The general GO terms for biological processes were retrieved with DAVID (18) for each significantly differentially expressed protein in each treatment condition versus control (Figure 3A, Table S3 in Supplementary Material). Proteins with GO terms linked to cell proliferation, cell death, growth, cell adhesion, and immune processes, as the most relevant to endometriosis pathology, were identified. This analysis demonstrates an antagonist effect of LXA4 on E2 signaling at the protein level (Figure 3A). Indeed, LXA4 in combination with E2 modulates the cellular macromolecular complex disassembly process, suggesting an inhibition in the growth and proliferation of endometriotic epithelial cells. LXA4 alone affects proteins annotated with a single biological process, the humoral immune response, which is perhaps unsurprising as only 25 proteins in total were detected (Figure 2D).
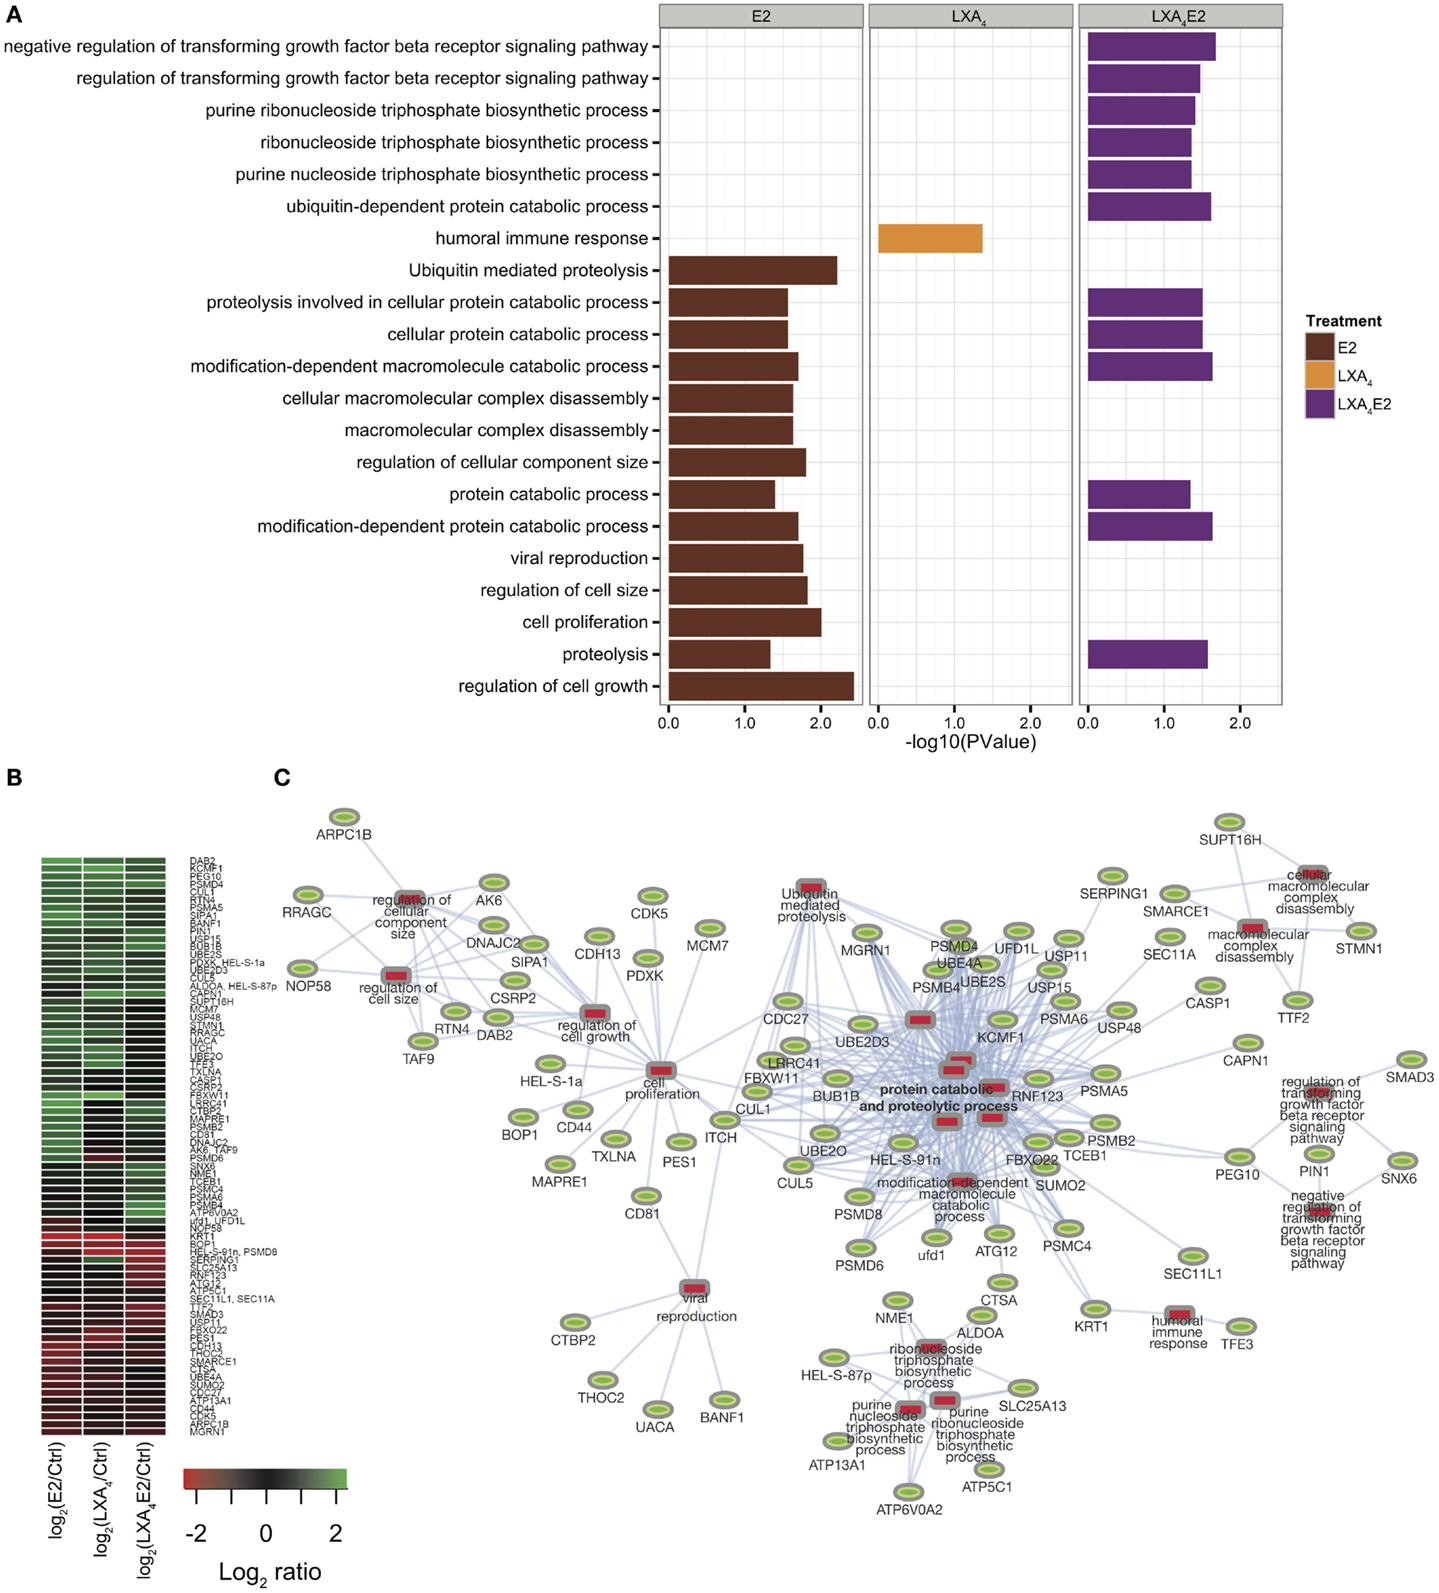
Figure 3. (A) Gene ontology analysis using DAVID for each condition versus control. (B) Heat map of significantly differentially expressed proteins, having at least one significant GO annotation. (C) Protein–annotation network constructed employing the DAVID functional analysis tool and Cytoscape. Significantly enriched GO terms are represented by red rectangles and proteins are represented by green ovals.
A subsequent quantitative analysis of the 348 protein subset annotated by these GO terms (80 proteins) was performed. The Z-score of log ratio of each treatment versus control in 12Z cells is depicted in heat maps using hierarchical clustering for differentially expressed proteins (Figure 3B). Using Cytoscape and GO biological process annotations, a protein–annotation network (in Figure 3C) was modeled, linking our quantitative analysis with protein function.
Next, we wished to delineate the contextual relevance using the most recently developed protein–protein interaction bioinformatics resources. The p-values of the LPE test as a function of the FDR are presented in Figure 4A. The 27 proteins that fell in the pink area on the graph were selected for network analysis. It can be seen from Figure 4A that a greater number of significantly differentially expressed proteins with a controlled FDR were detected in cells stimulated with LXA4E2 versus control and in cells stimulated with E2 versus control. In contrast, a smaller number of significantly differentially expressed proteins with a controlled FDR were detected in cells stimulated with LXA4 versus control. Accordingly, the FDR decreases in a steeper manner for cells stimulated with LXA4 versus control. The protein–protein interaction network of these 27 significantly differentially expressed proteins with a controlled FDR <0.1, listed in Table 1 (Figures 4A,B) was generated using GeneMANIA4 and interactome data from physical interactions, pathway interactions, and genetic interactions (Figure 4C).
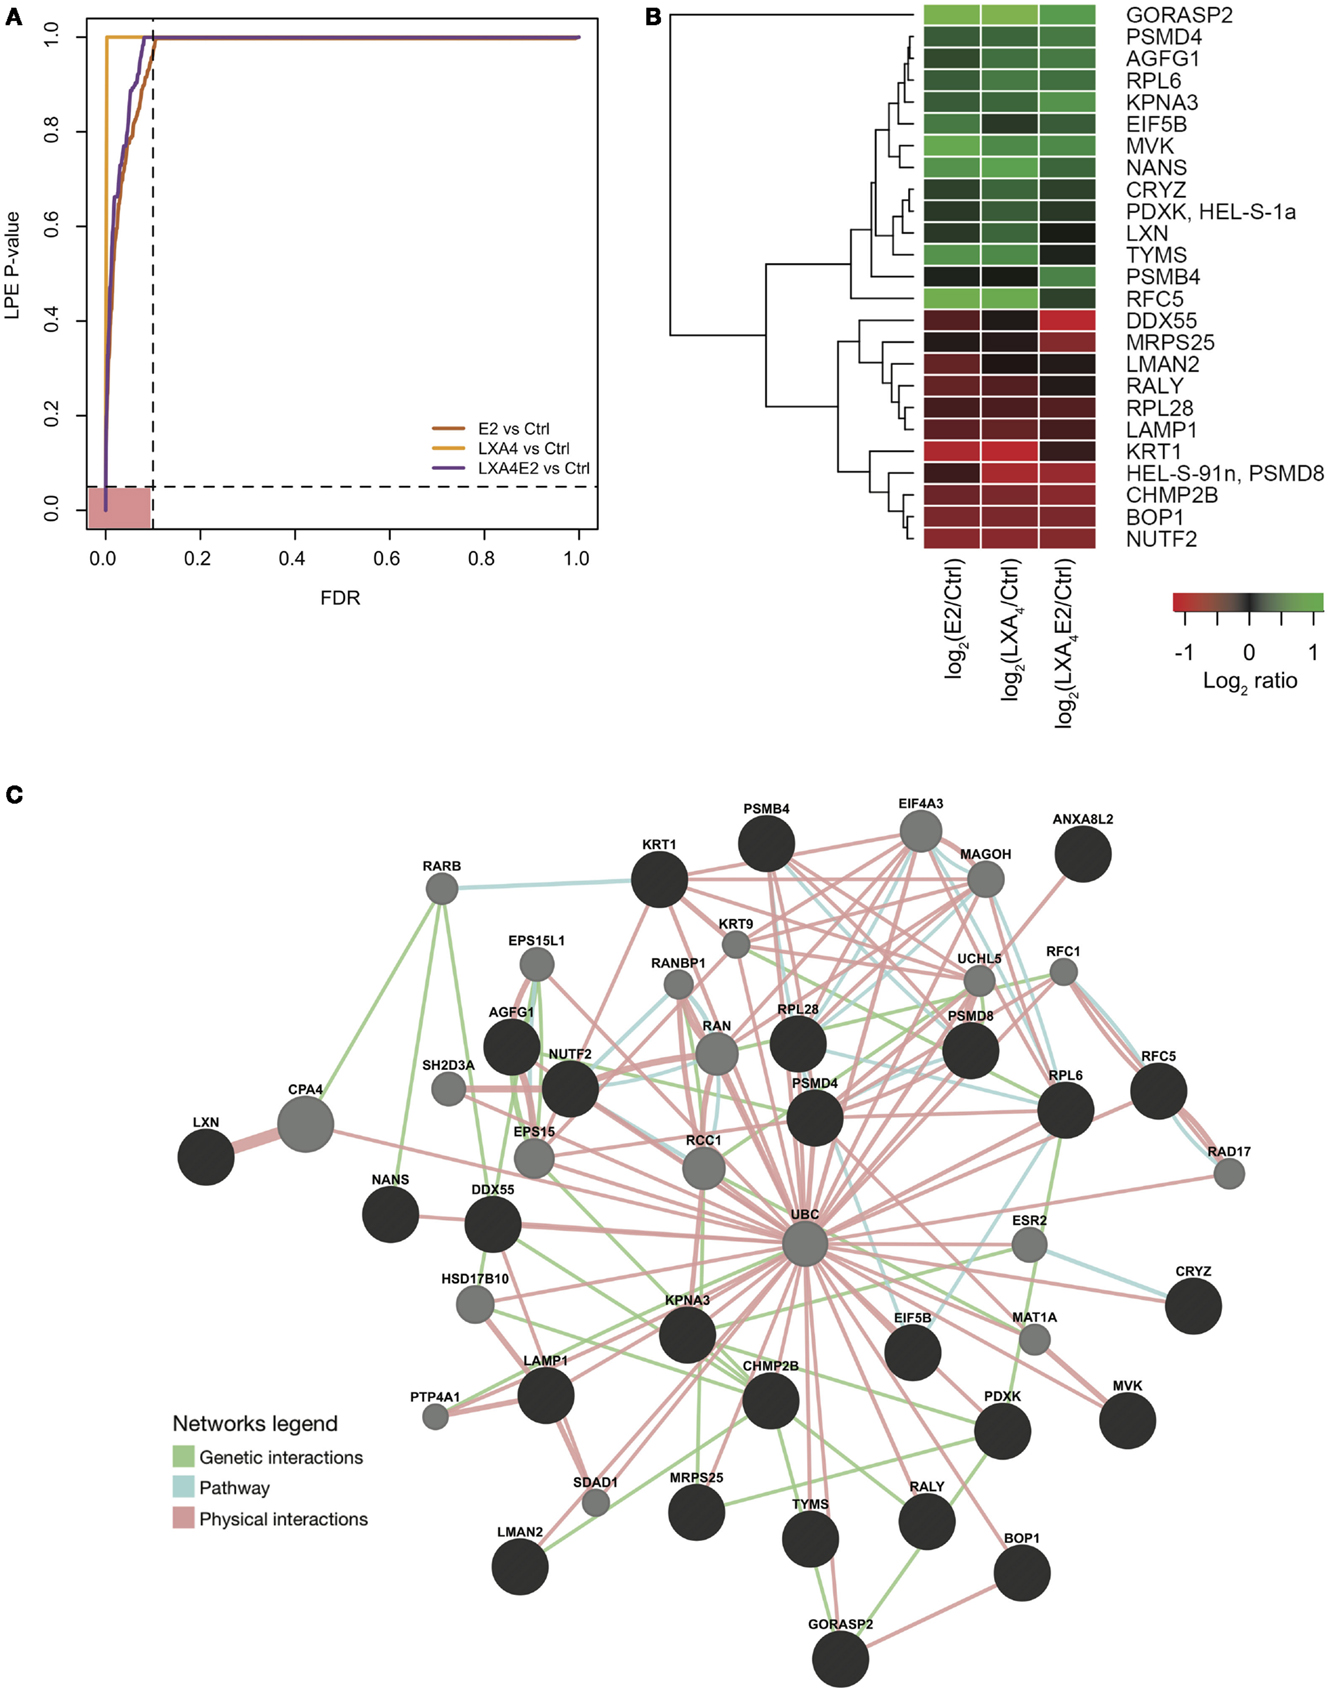
Figure 4. (A) FDR control of the LPE-test p-values. Significantly regulated proteins obtained from an analysis using a stringently controlled FDR are located in the pink area. (B) Heat map of log fold change (treatments versus control) of protein expression with a LPE p-value <0.05 and a FDR <0.1. (C) Protein–protein interaction network of the significantly differentially expressed proteins (in black), constructed using interactome data from GeneMANIA and Cytoscape. Intermediate nodes (in gray) were added to complete the network, using interactome data and the principle “guilt by association” in GeneMANIA. Genetic interactions (in green), physical interactions (in blue), and pathway interactions (in pink) are presented.
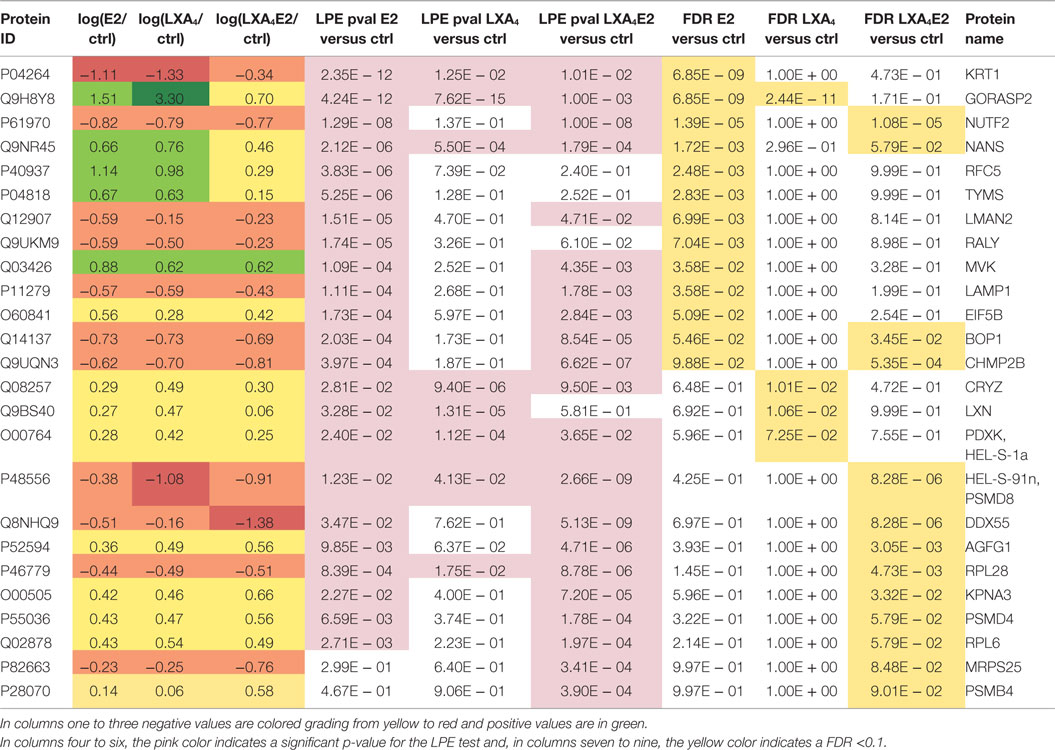
Table 1. Significantly differentially expressed proteins according to the LPE test with a FDR <0.1.
The functions of these proteins, as retrieved from Uniprot, are detailed in Table 2. Again, the log2 ratio of each treatment divided by control for differentially expressed proteins is depicted in heat maps using hierarchical clustering (Figure 4B).
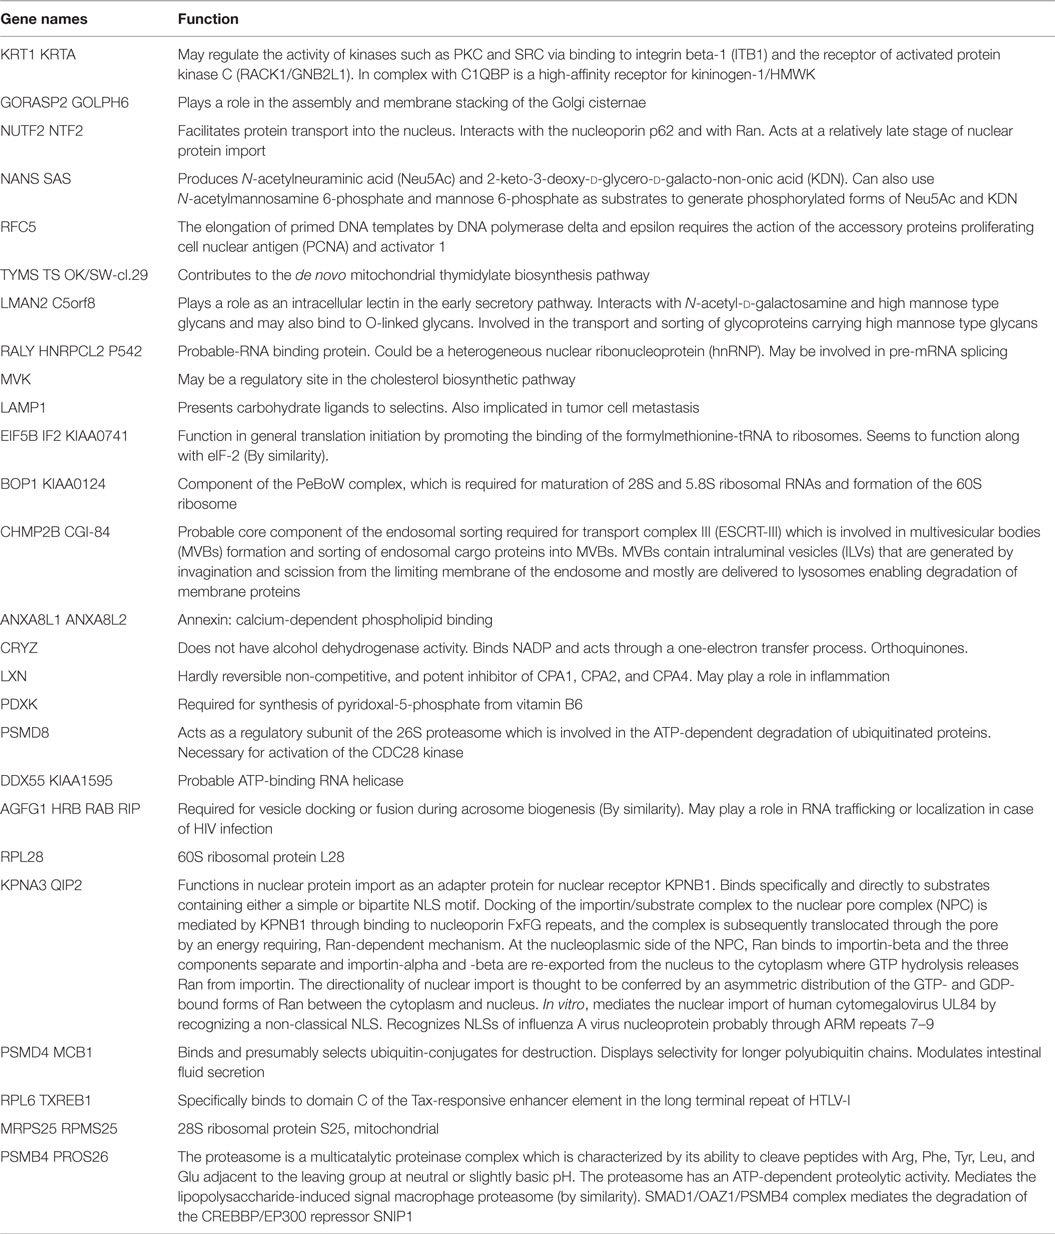
Table 2. Known functions of significantly differentially expressed proteins with a FDR <0.1 as retrieved from Uniprot.
These 27 proteins interact together to a high degree suggesting their implication in closely related biological processes. Using GeneMANIA, based on the guilt-by-association principle, we completed our query network with 20 interaction partner proteins, which were not detected by the mass spectrometer due to limitations in dynamic range detection but intricately associated with our high quality protein set. ERβ (ESR2) and 17-beta Hydroxysteroid dehydrogenase 10 (17HSDb10), implicated in estrogen metabolism, are among these interaction partner proteins depicted by gray circles in Figure 4C. Basal ERα and ERβ expression by 12Z cells was confirmed by Western blotting prior to performing experiments (data not shown), indicating that these are estrogen-responsive cells.
In this high quality protein subset, the antagonist effect of LXA4 on E2 signaling was also observed. LXA4 in combination with E2 decreased the expression of GORASP2, NANS, CRYZ, PDXK, LXN, TYMS, RFC5, DDX55, MRPS25, and CHMP2B compared to LXA4 or E2 alone. One of the most impacted proteins was Golgi reassembly stacking protein 2 (GORASP2), implicated in Golgi fragmentation and the subsequent entry into mitosis (27) and therefore cell-cycle progression. Similarly, Sialic acid synthase (NANS), which functions in sialic acid biosynthetic pathways (28) and Replication factor C subunit 5 (RFC5), implicated in proliferation, were less up-regulated by LXA4E2 than by either treatment alone, suggesting that treating 12Z cells with E2 and LXA4 in combination resulted in a decrease of cellular metabolic processes and proliferation.
Lipoxin A4 and E2 in combination increased PSMD4, AGFG1, KPNA3, PSMB4, RALY, LAMP1, KRT1, BOP1, and NUTF2 compared to LXA4 or E2 alone. LXA4 increased the expression of Keratin, type II cytoskeletal 1 (KRT1), which could however also be a contaminant in the lysates. The 26S proteasome non-ATPase regulatory subunit 4 (PSMD4) is involved in antigen processing and presentation of exogenous peptide antigen via MHC class I.
With the objective of confirming our observation that LXA4 antagonized E2-mediated effects, we compared 12Z cells treated by E2 and LXA4 in combination (LXA4E2) versus E2 alone. Employing the LPE test, the corresponding volcano plot (Figure 5A) was generated. 146 proteins were significantly differentially expressed in cells treated with the LXA4E2 combination versus cells treated with E2 alone (Table S4 in Supplementary Material). Among these proteins, 64 were significantly up-regulated whereas 82 proteins were significantly down-regulated, confirming our hypothesis. There was a 63% overlap between significantly differentially expressed proteins in any of the treatments versus control and LXA4E2 versus E2.
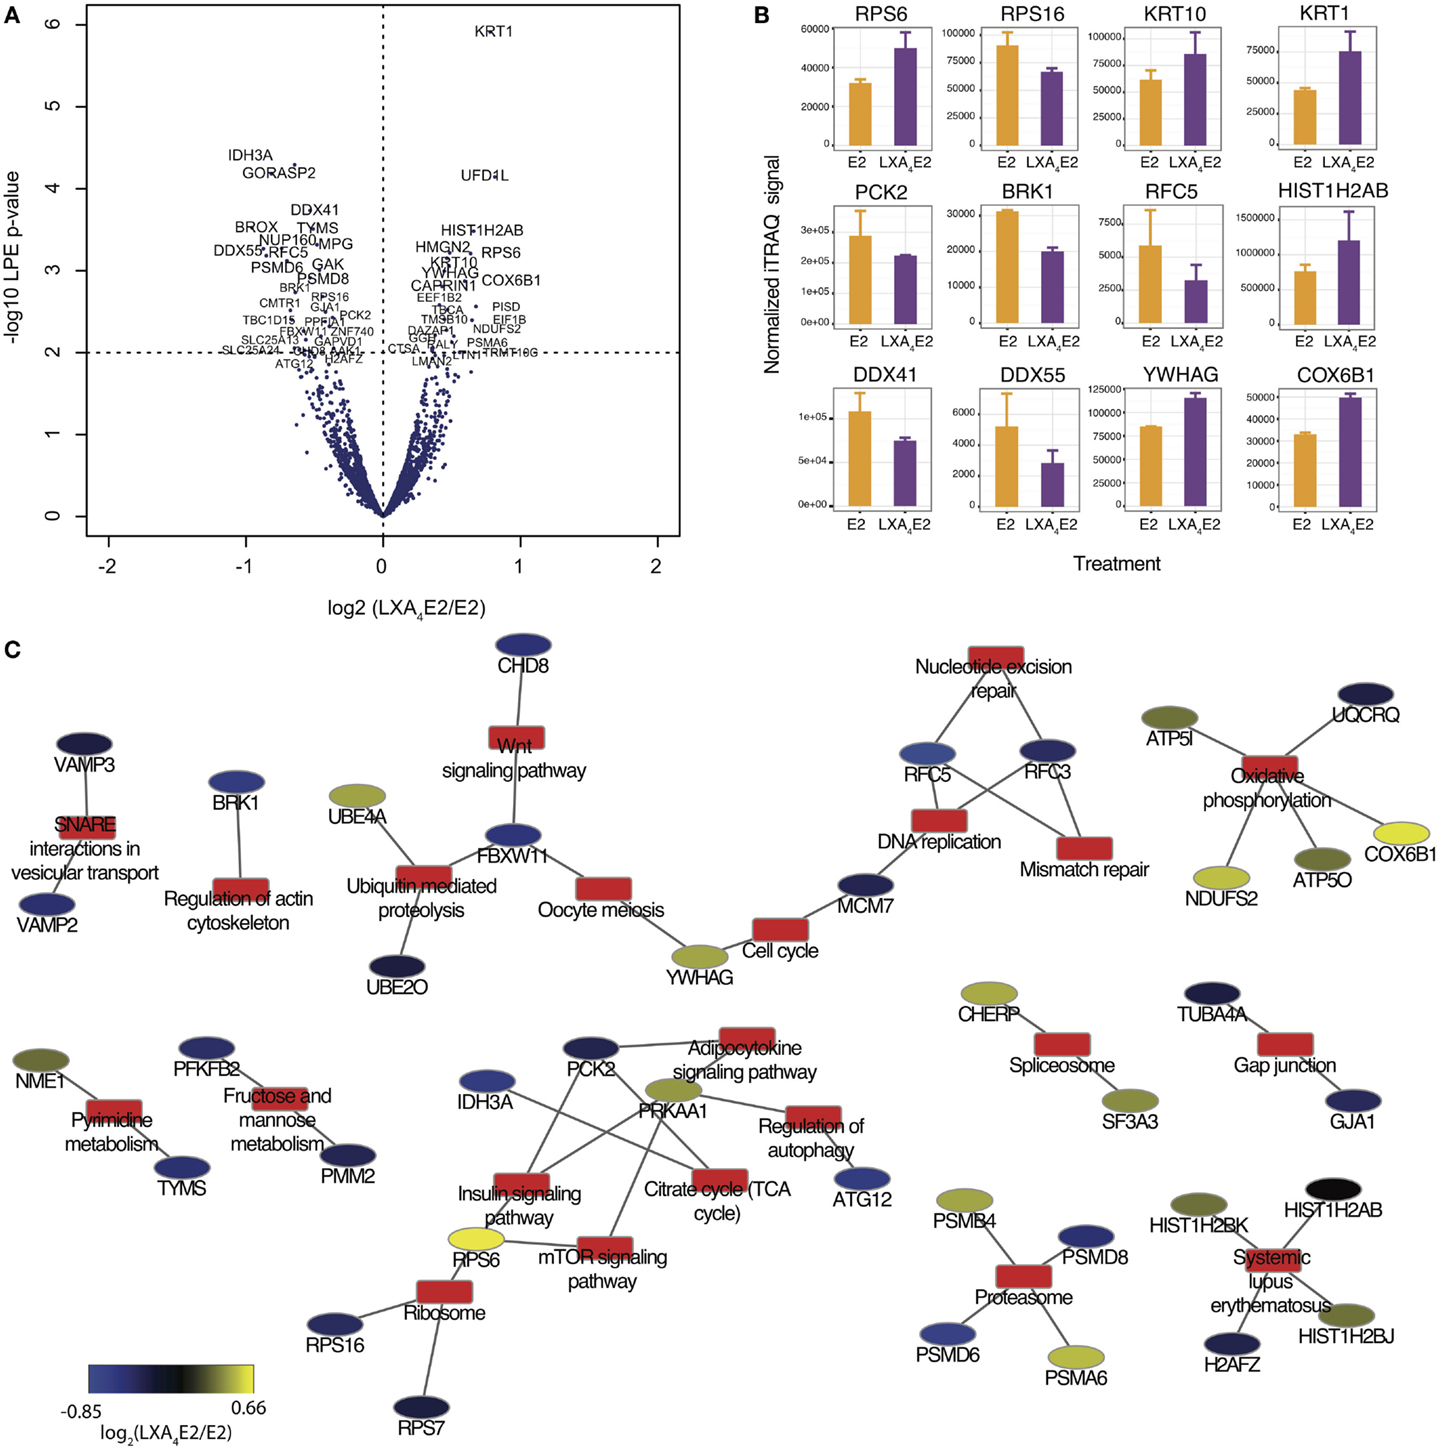
Figure 5. (A) Volcano plots of proteomic changes induced in 12Z cells treated with 10 nM E2 and 100 nM LXA4 in combination compared with 10 nM E2 alone. (B) Selection of significantly differentially expressed proteins with a LPE p-value <0.05 and a FDR <0.4. (C) Protein–annotation network generated using DAVID, employing KEGG Pathway annotations. Annotations are depicted by red rectangles and proteins are represented by elipses along a blue–yellow color scale of the log2 (LXA4E2/E2) iTRAQ signal.
Among these 146 proteins (Figure 5B), we found several protein families involved in E2-induced signaling that were impacted by LXA4. The DDX, RPS, and KRT families were among those most affected. DEAD box proteins (DDX) are multifunctional proteins, and putative RNA helicases are thought to be involved in cellular growth and division (29). Ribosomal protein S6 (RPS6), a component of the 40S ribosomal subunit, is implicated in mRNA translation. Krt1 and Krt10 are heterodimer partners and members of the type I (acidic) cytokeratin family. Phosphoenolpyruvate carboxykinase 2 (PCK2) expression was attenuated by the LXA4E2 combination compared to E2 alone, suggesting a decrease in insulin/glucose metabolism and the TCA cycle, as this enzyme mediates the rate-limiting step in the metabolic pathway that produces glucose from lactate and other precursors derived from the citric acid cycle. The alpha subunit of NAD(+)-specific Isocitrate dehydrogenase 3 (IDH3A) was also markedly affected by LXA4E2 compared to E2. These enzymes catalyze the oxidative decarboxylation of isocitrate to alpha-ketoglutarate, the rate-limiting step of the TCA cycle (30).
In order to study the role of these differentially expressed proteins, we subsequently retrieved all pathway annotations (with a minimum of two proteins annotated) using DAVID (Figure 5C). In summary, several pathways of relevance to endometriosis, such as metabolic pathways, notably pyrimidine, fructose, and mannose metabolism, as well as the cell cycle, oxidative phosphorylation, the proteasome, regulation of autophagy, mTOR signaling, and adipocytokines were affected, demonstrating that LXA4 modulates several cellular processes which are impacted by E2.
Discussion
Here, we report the first comprehensive proteomic analysis of changes induced by LXA4 and E2 in an endometriotic epithelial cell line. We have performed proteome-wide biomarker and therapeutic target discovery using the most recent bioinformatics tools and databases, coupled with standard statistical analysis.
In order to verify our method, we performed Western blots for CSN5/JAB1, a component of the COP9 signalosome, a complex which regulates several cellular and developmental processes (31), and observed that this protein were significantly increased in LXA4E2 conditions versus control. ERα was previously shown to co-immuno-precipitate with CSN5 and overexpression of CSN5 caused an increase in ligand-induced ERα degradation (32), indicating the functional relevance of this observation. There was a high degree of correlation between the Western blot and the MS data, confirming the robustness of our results.
Most proteins whose expression was induced by LXA4, were also induced by E2, as would be expected from our previous observations in endometrial epithelial cells where we characterized this eicosanoid as an estrogen receptor agonist which bound ER, activated canonical ER signaling and also inhibited E2-mediated responses including gene expression and cellular proliferation (8). As observed in that previous study where LXA4 exhibited less potent responses that E2, the natural ligand, in the present study, fewer proteins are regulated by LXA4 than by E2, and LXA4 also inhibited certain E2-mediated changes in protein expression.
Elevated local E2 levels and increased expression of estrogen-regulated molecules, which promote proliferation, are features of endometriotic lesions (33–36), and molecules that inhibit estrogen production and/signaling represent potential therapeutics. We and others have demonstrated that LXA4 and its analogs have decreased endometriosis progression in rodent models and may represent future therapies (11, 37, 38). The latter study reported attenuated expression of estrogen-regulated mediators implicated in cell proliferation in mice with endometriosis treated with LXA4 compared to vehicle-treated controls.
It is perhaps unsurprising that LXA4, as a molecule that acts via several known receptors notably ALX/FPR2 and ERα, also impacts diverse pathways as well as metabolism. For example, Mevalonate kinase (MVK), a key early enzyme in isoprenoid and sterol synthesis and therefore in cholesterol production via the generation of Squalene (39), exhibited a 25% reduced induction in cells stimulated with E2 and LXA4 in combination compared to cells treated with E2 alone. The Mevalonate pathway is a key metabolic pathway as its blockade has been linked to mitochondrial dysfunction and defective autophagy, possibly causing inflammasome activation and subsequent cell death (40). This antagonistic modulation of E2-driven responses by LXA4, also observed for several other proteins, is consistent with the notion that the regulation of these proteins is mediated via ER, or by another common receptor.
The LXA4E2 combination appeared to attenuate insulin/glucose metabolism and the TCA cycle by impacting IDH3A and PCK2, the latter enzyme was already previously studied in decidualized stromal endometrial cells (41) but its role in endometriotic epithelial cells remains unclear.
RPS6, another protein detected, is a component of the 40S ribosomal subunit and is therefore thought to be involved in regulating translation. While its precise function is currently under investigation, studies have shown that RPS6 is involved in the regulation of cell size, cell proliferation, and glucose homeostasis (42). RPS6 has been implicated in mTOR signaling in hormone responsive cells (43, 44). Of note, E2 has been shown to trigger protein synthesis in mouse uterine epithelial cells via the PKC-ERK1/2–mTOR pathway (45). Furthermore, the PI3K/mTOR/AKT pathway is activated in endometriosis, and inhibition of this pathway represents a potential therapeutic modality (46, 47). Consistent with our previous studies (8), both LXA4 and E2 appear to increase cellular proliferation individually but in combination, this effect appears to be blunted, which may be occurring via crosstalk between the ER and mTOR pathways. Indeed, it is recently appreciated that such crosstalk mechanisms exist in cancer cells (48).
Our study also provides novel insights into common intracellular signaling pathways activated by LXA4 and E2, for example those involved in protein synthesis. eIF5B, reported to be the most catalytically active of the translation initiation factors (49), was one of the top 25 proteins regulated. Interestingly, this protein was previously demonstrated to be increased by E2 in MCF-7 estrogen-responsive breast cancer cells via ER (50).
Though a cell line cannot reproduce complex tissue conditions, 12Z cells proved useful to optimize the technique, and the data generated will allow the study of potential new therapeutic targets or endometriosis biomarkers. However, proteomic methods are still characterized by some heterogeneity, and further standardization and optimization for clinical use is necessary, especially at the sample preparation level to extract proteins from urine, menstrual blood, or other body fluids (51, 52). Although the effects of the different treatments are modest and our experimental design includes only two replicates, which limits our statistical power, we found several relevant processes implicated in endometriosis physiopathology. The proteins identified in this study require further validation in order to be considered as potential therapeutic targets.
Emerging fractionation techniques to capture and concentrate low-abundance proteins, new non-gel-based proteomic technologies combined with protein labeling strategies and the ongoing development of advanced bioinformatics tools will hopefully allow the development of relatively non-invasive diagnostic methods for endometriosis. This is a major unmet medical need as it would facilitate earlier diagnosis of this common, chronic disease.
Author Contributions
JS: Study design, sample preparation, data analysis, bioinformatics, and manuscript writing. PW: Study design, mass spectrometry expertise, critical discussion, and manuscript corrections. IG: Western blot, cell culture, and manuscript corrections. MQ: study design, mass spectrometry expertise, critical discussion, and manuscript corrections. GC: study conception and design, data analysis, critical discussion, and manuscript writing.
Conflict of Interest Statement
The authors declare that the research was conducted in the absence of any commercial or financial relationships that could be construed as a potential conflict of interest.
Acknowledgments
We thank Jachen Barblan for advice regarding mass spectrometry, Alexandra Potts for sample preparation supervision, Chiara Pellegrini for assistance with cell culture, Yoima Rodriguez for helping with Western blotting and Frederic Schutz for statistical advice.
Funding
This study was funded by the Roche Research Foundation and by the Swiss National Science Foundation (grant number 310030-120761) (to GC) and by funding from the University of Lausanne to MQ.
Supplementary Material
The Supplementary Material for this article can be found online at http://journal.frontiersin.org/article/10.3389/fendo.2015.00192
Footnotes
References
2. Agarwal N, Subramanian A. Endometriosis – morphology, clinical presentations and molecular pathology. J Lab Physicians (2010) 2:1–9. doi:10.4103/0974-2727.66699
3. Nnoaham KE, Hummelshoj L, Webster P, d’Hooghe T, de Cicco Nardone F, de Cicco Nardone C, et al. Impact of endometriosis on quality of life and work productivity: a multicenter study across ten countries. Fertil Steril (2011) 96:366–373e8. doi:10.1016/j.fertnstert.2011.05.090
4. Fuldeore M, Yang H, Du EX, Soliman AM, Wu EQ, Winkel C. Healthcare utilization and costs in women diagnosed with endometriosis before and after diagnosis: a longitudinal analysis of claims databases. Fertil Steril (2015) 103:163–71. doi:10.1016/j.fertnstert.2014.10.011
6. Serhan CN. Pro-resolving lipid mediators are leads for resolution physiology. Nature (2014) 510:92–101. doi:10.1038/nature13479
7. Serhan CN, Chiang N, Van Dyke TE. Resolving inflammation: dual anti-inflammatory and pro-resolution lipid mediators. Nat Rev Immunol (2008) 8:349–61. doi:10.1038/nri2294
8. Russell R, Gori I, Pellegrini C, Kumar R, Achtari C, Canny GO. Lipoxin A4 is a novel estrogen receptor modulator. FASEB J (2011) 25:4326–37. doi:10.1096/fj.11-187658
9. Clark JH, Markaverich BM. The agonistic and antagonistic actions of estriol. J Steroid Biochem (1984) 20:1005–13. doi:10.1016/0022-4731(84)90011-6
10. Melamed M, Castano E, Notides AC, Sasson S. Molecular and kinetic basis for the mixed agonist/antagonist activity of estriol. Mol Endocrinol (1997) 11:1868–78. doi:10.1210/mend.11.12.0025
11. Kumar R, Clerc AC, Gori I, Russell R, Pellegrini C, Govender L, et al. Lipoxin A(4) prevents the progression of de novo and established endometriosis in a mouse model by attenuating prostaglandin E(2) production and estrogen signaling. PLoS One (2014) 9:e89742. doi:10.1371/journal.pone.0089742
12. Zeitvogel A, Baumann R, Starzinski-Powitz A. Identification of an invasive, N-cadherin-expressing epithelial cell type in endometriosis using a new cell culture model. Am J Pathol (2001) 159:1839–52. doi:10.1016/S0002-9440(10)63030-1
13. Grund EM, Kagan D, Tran CA, Zeitvogel A, Starzinski-Powitz A, Nataraja S, et al. Tumor necrosis factor-alpha regulates inflammatory and mesenchymal responses via mitogen-activated protein kinase kinase, p38, and nuclear factor kappaB in human endometriotic epithelial cells. Mol Pharmacol (2008) 73:1394–404. doi:10.1124/mol.107.042176
14. Banu SK, Lee J, Starzinski-Powitz A, Arosh JA. Gene expression profiles and functional characterization of human immortalized endometriotic epithelial and stromal cells. Fertil Steril (2008) 90:972–87. doi:10.1016/j.fertnstert.2007.07.1358
15. Lee J, Banu SK, Subbarao T, Starzinski-Powitz A, Arosh JA. Selective inhibition of prostaglandin E2 receptors EP2 and EP4 inhibits invasion of human immortalized endometriotic epithelial and stromal cells through suppression of metalloproteinases. Mol Cell Endocrinol (2011) 332:306–13. doi:10.1016/j.mce.2010.11.022
16. Pichler P, Kocher T, Holzmann J, Mazanek M, Taus T, Ammerer G, et al. Peptide labeling with isobaric tags yields higher identification rates using iTRAQ 4-plex compared to TMT 6-plex and iTRAQ 8-plex on LTQ Orbitrap. Anal Chem (2010) 82:6549–58. doi:10.1021/ac100890k
17. Unwin RD. Quantification of proteins by iTRAQ. Methods Mol Biol (2010) 658:205–15. doi:10.1007/978-1-60761-780-8_12
18. Huang da W, Sherman BT, Lempicki RA. Systematic and integrative analysis of large gene lists using DAVID bioinformatics resources. Nat Protoc (2009) 4:44–57. doi:10.1038/nprot.2008.211
19. Ashburner M, Ball CA, Blake JA, Botstein D, Butler H, Cherry JM, et al. Gene ontology: tool for the unification of biology. The Gene Ontology Consortium. Nat Genet (2000) 25:25–9. doi:10.1038/75556
20. Killcoyne S, Carter GW, Smith J, Boyle J. Cytoscape: a community-based framework for network modeling. Methods Mol Biol (2009) 563:219–39. doi:10.1007/978-1-60761-175-2_12
21. Shannon P, Markiel A, Ozier O, Baliga NS, Wang JT, Ramage D, et al. Cytoscape: a software environment for integrated models of biomolecular interaction networks. Genome Res (2003) 13:2498–504. doi:10.1101/gr.1239303
22. Geiser L, Dayon L, Vaezzadeh AR, Hochstrasser DF. Shotgun proteomics: a relative quantitative approach using Off-Gel electrophoresis and LC-MS/MS. Methods Mol Biol (2011) 681:459–72. doi:10.1007/978-1-60761-913-0_27
23. Ting L, Cowley MJ, Hoon SL, Guilhaus M, Raftery MJ, Cavicchioli R. Normalization and statistical analysis of quantitative proteomics data generated by metabolic labeling. Mol Cell Proteomics (2009) 8:2227–42. doi:10.1074/mcp.M800462-MCP200
24. Jain N, Thatte J, Braciale T, Ley K, O’Connell M, Lee JK. Local-pooled-error test for identifying differentially expressed genes with a small number of replicated microarrays. Bioinformatics (2003) 19:1945–51. doi:10.1093/bioinformatics/btg264
25. Mostafavi S, Ray D, Warde-Farley D, Grouios C, Morris Q. GeneMANIA: a real-time multiple association network integration algorithm for predicting gene function. Genome Biol (2008) 9(Suppl 1):S4. doi:10.1186/gb-2008-9-s1-s4
26. Kato JY, Yoneda-Kato N. Mammalian COP9 signalosome. Genes Cells (2009) 14:1209–25. doi:10.1111/j.1365-2443.2009.01349.x
27. Duran JM, Kinseth M, Bossard C, Rose DW, Polishchuk R, Wu CC, et al. The role of GRASP55 in Golgi fragmentation and entry of cells into mitosis. Mol Biol Cell (2008) 19:2579–87. doi:10.1091/mbc.E07-10-0998
28. Lawrence SM, Huddleston KA, Pitts LR, Nguyen N, Lee YC, Vann WF, et al. Cloning and expression of the human N-acetylneuraminic acid phosphate synthase gene with 2-keto-3-deoxy-D-glycero-D-galacto-nononic acid biosynthetic ability. J Biol Chem (2000) 275:17869–77. doi:10.1074/jbc.M000217200
29. Linder P, Jankowsky E. From unwinding to clamping – the DEAD box RNA helicase family. Nat Rev Mol Cell Biol (2011) 12:505–16. doi:10.1038/nrm3154
30. Sazanov LA, Jackson JB. Proton-translocating transhydrogenase and NAD- and NADP-linked isocitrate dehydrogenases operate in a substrate cycle which contributes to fine regulation of the tricarboxylic acid cycle activity in mitochondria. FEBS Lett (1994) 344:109–16. doi:10.1016/0014-5793(94)00370-X
31. Wei N, Serino G, Deng XW. The COP9 signalosome: more than a protease. Trends Biochem Sci (2008) 33:592–600. doi:10.1016/j.tibs.2008.09.004
32. Callige M, Kieffer I, Richard-Foy H. CSN5/Jab1 is involved in ligand-dependent degradation of estrogen receptor {alpha} by the proteasome. Mol Cell Biol (2005) 25:4349–58. doi:10.1128/MCB.25.11.4349-4358.2005
33. Noble LS, Simpson ER, Johns A, Bulun SE. Aromatase expression in endometriosis. J Clin Endocrinol Metab (1996) 81:174–9. doi:10.1210/jc.81.1.174
34. Bulun SE, Monsivais D, Kakinuma T, Furukawa Y, Bernardi L, Pavone ME, et al. Molecular biology of endometriosis: from aromatase to genomic abnormalities. Semin Reprod Med (2015) 33:220–4. doi:10.1055/s-0035-1554053
35. Canny GO, Lessey BA. The role of lipoxin A4 in endometrial biology and endometriosis. Mucosal Immunol (2013) 6:439–50. doi:10.1038/mi.2013.9
36. Pellegrini C, Gori I, Achtari C, Hornung D, Chardonnens E, Wunder D, et al. The expression of estrogen receptors as well as GREB1, c-MYC, and cyclin D1, estrogen-regulated genes implicated in proliferation, is increased in peritoneal endometriosis. Fertil Steril (2012) 98:1200–8. doi:10.1016/j.fertnstert.2012.06.056
37. Xu Z, Zhao F, Lin F, Chen J, Huang Y. Lipoxin A4 inhibits the development of endometriosis in mice: the role of anti-inflammation and anti-angiogenesis. Am J Reprod Immunol (2012) 67:491–7. doi:10.1111/j.1600-0897.2011.01101.x
38. Chen QH, Zhou WD, Pu DM, Huang QS, Li T, Chen QX. 15-Epi-lipoxin A(4) inhibits the progression of endometriosis in a murine model. Fertil Steril (2010) 93:1440–7. doi:10.1016/j.fertnstert.2009.01.107
39. Edwards PA, Ericsson J. Sterols and isoprenoids: signaling molecules derived from the cholesterol biosynthetic pathway. Annu Rev Biochem (1999) 68:157–85. doi:10.1146/annurev.biochem.68.1.157
40. Tricarico PM, Crovella S, Celsi F. Mevalonate pathway blockade, mitochondrial dysfunction and autophagy: a possible link. Int J Mol Sci (2015) 16:16067–84. doi:10.3390/ijms160716067
41. Bombail V, Gibson DA, Collins F, MacPherson S, Critchley HO, Saunders PT. A role for the orphan nuclear receptor estrogen-related receptor alpha in endometrial stromal cell decidualization and expression of genes implicated in energy metabolism. J Clin Endocrinol Metab (2010) 95:E224–8. doi:10.1210/jc.2010-0154
42. Ruvinsky I, Sharon N, Lerer T, Cohen H, Stolovich-Rain M, Nir T, et al. Ribosomal protein S6 phosphorylation is a determinant of cell size and glucose homeostasis. Genes Dev (2005) 19:2199–211. doi:10.1101/gad.351605
43. Volovelsky O, Cohen G, Kenig A, Wasserman G, Dreazen A, Meyuhas O, et al. Phosphorylation of ribosomal protein S6 mediates mammalian target of rapamycin complex 1-induced parathyroid cell proliferation in secondary hyperparathyroidism. J Am Soc Nephrol (2015). doi:10.1681/ASN.2015040339
44. Li G, Shan C, Liu L, Zhou T, Zhou J, Hu X, et al. Tanshinone IIA inhibits HIF-1alpha and VEGF expression in breast cancer cells via mTOR/p70S6K/RPS6/4E-BP1 signaling pathway. PLoS One (2015) 10:e0117440. doi:10.1371/journal.pone.0117440
45. Wang Y, Zhu L, Kuokkanen S, Pollard JW. Activation of protein synthesis in mouse uterine epithelial cells by estradiol-17beta is mediated by a PKC-ERK1/2-mTOR signaling pathway. Proc Natl Acad Sci U S A (2015) 112:E1382–91. doi:10.1073/pnas.1418973112
46. Makker A, Goel MM, Das V, Agarwal A. PI3K-Akt-mTOR and MAPK signaling pathways in polycystic ovarian syndrome, uterine leiomyomas and endometriosis: an update. Gynecol Endocrinol (2012) 28:175–81. doi:10.3109/09513590.2011.583955
47. Leconte M, Nicco C, Ngo C, Chereau C, Chouzenoux S, Marut W, et al. The mTOR/AKT inhibitor temsirolimus prevents deep infiltrating endometriosis in mice. Am J Pathol (2011) 179:880–9. doi:10.1016/j.ajpath.2011.04.020
48. Andruska ND, Zheng X, Yang X, Mao C, Cherian MM, Mahapatra L, et al. Estrogen receptor alpha inhibitor activates the unfolded protein response, blocks protein synthesis, and induces tumor regression. Proc Natl Acad Sci U S A (2015) 112:4737–42. doi:10.1073/pnas.1403685112
49. Merrick WC. Mechanism and regulation of eukaryotic protein synthesis. Microbiol Rev (1992) 56:291–315.
50. Garcia SA, Nagai MA. Transcriptional regulation of bidirectional gene pairs by 17-beta-estradiol in MCF-7 breast cancer cells. Braz J Med Biol Res (2011) 44:112–22. doi:10.1590/S0100-879X2010007500149
51. Yang H, Zhou B, Prinz M, Siegel D. Proteomic analysis of menstrual blood. Mol Cell Proteomics (2012) 11:1024–35. doi:10.1074/mcp.M112.018390
Keywords: endometriosis, endometriotic epithelial cells, mass spectrometry, lipoxin A4, 17-β-estradiol, proteomic analysis, protein–protein interaction network, gene ontologies
Citation: Sobel JA, Waridel P, Gori I, Quadroni M and Canny GO (2016) Proteome-Wide Effect of 17-β-Estradiol and Lipoxin A4 in an Endometriotic Epithelial Cell Line. Front. Endocrinol. 6:192. doi: 10.3389/fendo.2015.00192
Received: 09 October 2015; Accepted: 14 December 2015;
Published: 06 January 2016
Edited by:
Sandhya Srikant Visweswariah, Indian Institute of Science, IndiaReviewed by:
Deborah Schechtman, Universidade de São Paulo, BrazilGeula Gibori, University of Illinois at Chicago, USA
Copyright: © 2016 Sobel, Waridel, Gori, Quadroni and Canny. This is an open-access article distributed under the terms of the Creative Commons Attribution License (CC BY). The use, distribution or reproduction in other forums is permitted, provided the original author(s) or licensor are credited and that the original publication in this journal is cited, in accordance with accepted academic practice. No use, distribution or reproduction is permitted which does not comply with these terms.
*Correspondence: Geraldine O. Canny, Z2VyYWxkaW5lLmNhbm55QGdtYWlsLmNvbQ==
†Joint senior authors.