 Olfa Ghali
 Nathalie Al Rassy
 Pierre Hardouin
 Christophe Chauveau
- 1Laboratoire de Physiopathologie des Maladies Osseuses Inflammatoires, Université de Lille, Boulogne-sur-Mer, France
- 2Laboratoire de Physiopathologie des Maladies Osseuses Inflammatoires, Université du Littoral Côte d’Opale, Boulogne-sur-Mer, France
Elevated bone marrow adiposity (BMA) is defined as an increase in the proportion of the bone marrow (BM) cavity volume occupied by adipocytes. This can be caused by an increase in the size and/or number of adipocytes. BMA increases with age in a bone-site-specific manner. This increase may be linked to certain pathophysiological situations. Osteoporosis or compromised bone quality is frequently associated with high BMA. The involvement of BM adipocytes in bone loss may be due to commitment of mesenchymal stem cells to the adipogenic pathway rather than the osteogenic pathway. However, adipocytes may also act on their microenvironment by secreting factors with harmful effects for the bone health. Here, we review evidence that in a context of energy deficit (such as anorexia nervosa (AN) and restriction rodent models) bone alterations can occur in the absence of an increase in BMA. In severe cases, bone alterations are even associated with gelatinous BM transformation. The relationship between BMA and energy deficit and the potential regulators of this adiposity in this context are also discussed. On the basis of clinical studies and preliminary results on animal model, we propose that competition between differentiation into osteoblasts and differentiation into adipocytes might trigger bone loss at least in moderate-to-severe AN and in some calorie restriction models. Finally, some of the main questions resulting from this hypothesis are discussed.
Introduction
The bone marrow (BM) is predominantly composed of two fractions, namely the hematopoietic and stromal fractions. Mesenchymal progenitor cells reside in the stromal fraction of the BM and can differentiate primarily into osteoblasts and adipocytes (1).
Bone marrow adiposity (BMA) is defined as the proportion of the BM cavity volume occupied by adipocytes. A rise in the BMA can be caused by an increase in the size and/or number of adipocytes (2). BMA levels differ for males vs. females; they are usually higher in women than in men, and higher in female animal models than in males (3). It is also well known that BMA increases with age in a bone-site-specific manner. At birth, the BM is largely hematopoietic (red marrow) but is gradually converted to fatty (yellow) marrow over the lifespan (4–7). The age-related progression of BMA in the axial skeleton differs from that observed in the appendicular skeleton. The fat fraction in iliac crest biopsies is relatively low during childhood but increases gradually with age (8). In contrast, BMA in long bones of the limbs starts to rise during the first few years of life, with progressive colonization of the medullar cavity from the diaphysis. This process is complete at the age of 25 years or so (9).
These observations suggest that (i) the presence of adipocytes in the BM is a physiological, age-related phenomenon, and (ii) these adipocytes may have positive effects. In fact, adipocytes can supply energy for the high level of bone remodeling required during puberty (10, 11). Furthermore, BM adipocytes may be involved in thermogenesis and heat dissipation because they display some of the characteristic features of brown adipocytes (12). However, an increase in BMA may be linked to certain pathophysiological situations. In fact, osteoporosis or compromised bone quality related to mechanical unloading (13), aging (14), menopause (15), diabetes (16, 17), obesity (18, 19), or anorexia nervosa (AN) (20) is frequently associated with high BMA [for a review, see the article by Hardouin et al. (21) in this special issue].
Two hypotheses have been proposed to explain the bone alterations induced by BMA increase: (i) the elevated BMA observed in osteoporotic patients is caused by a shift in mesenchymal stem cell commitment from the osteogenic pathway to the adipogenic pathway at the expense of bone formation (22–24) and (ii) BM adipocytes can regulate the BM microenvironment and act negatively on the balance between bone formation and bone resorption (11, 25–27) and hematopoiesis (28–31).
A better understanding of the quantitative and/or qualitative changes in BM adipocytes during osteoporosis might enable the development of novel therapeutic strategies. Of the various pathologic contexts associated with osteoporosis, AN is of particular interest. Although osteoporosis in AN has been extensively described, the present article discusses changes in BMA and the regulation of this process in a context of energy deficit and, then, proposes some perspectives for research in this specific field.
BMA and Energy Deficit
Anorexia nervosa is a major public health concern; it is the psychiatric disease with the highest mortality rate. Given that AN often coincides with puberty, this condition markedly interferes with bone mass gain and has a long-term impact on bone quality (32). In particular, studying AN may reveal novel, hitherto unsuspected links between BMA and bone mass. First, secondary osteoporosis in AN is often associated with an increase in BMA that contrasts with a decrease in the adiposity of other fatty tissues (Table 1). Second, some studies (but not others) have found that levels of inflammation markers are not elevated in patients with AN (despite amenorrhea) (33, 34). Given that most patients with AN have a low bone mass, inflammation-independent mechanisms may be involved in this bone loss.
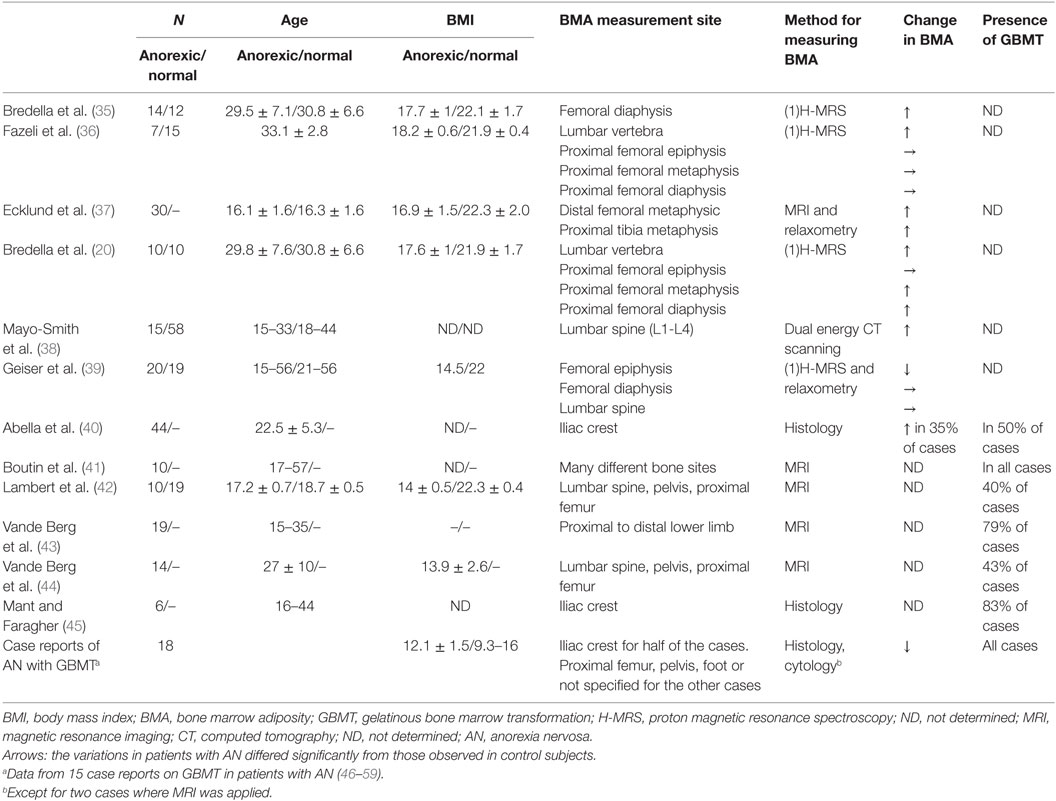
Table 1. Variations in BMA and the presence of gelatinous BM transformation in patients with AN, as reported in case–control studies and case reports.
However, the fact that a link between energy deficit and increased BMA is not always observed raises questions as to the relevance of BMA in AN. Indeed, several studies of osteoporotic patients with AN did not observe elevated BMA (Table 1). In fact, the studies having found an increase in BMA tended to feature patients with a higher body mass index (BMI) than those in studies that did not observe this increase. Moreover, a number of studies that categorized patients into BMI classes highlighted a relationship between the severity of body weight loss and changes in the BMA (40, 43, 44). Interestingly, Abella et al.’s histological study of patient biopsies described a hypoplastic BM in which an increase in both the fat fraction and adipocyte diameter was associated with moderate body weight loss (40). The researchers also observed areas of unaffected or hypoplastic BM and focal gelatinous degeneration in patients with intermediate levels of body weight losses (40). Last, the most severe cases featured a high microadipocyte count in a hyaluronic acid matrix. It is noteworthy that, in one of the patients in Abella et al.’s study, the BM’s appearance normalized after the resumption of food intake and the return to an appropriate bodyweight (40). Vande Berg et al. used magnetic resonance imaging to highlight the presence of serous-like BM at different skeletal sites in anorectic patients (44). They distinguished between two groups as a function of the presence (group A) or absence (group B) of a water-like pattern in the marrow spaces. The individual BMI values in the group A were all under 13.5 kg/m2, whereas six of the eight patients in group B had a BMI above 15 kg/m2. Abella et al. did not find an intergroup difference in disease duration, which suggests that body weight loss is a key factor in BM alterations (39–41, 46).
This short overview of the relationship between BMA alterations and the severity of the body weight loss highlights the complexity of the processes leading to these alterations and probably, thereafter, to bone loss. Studies of animal models should provide some clues to these processes. In rodent models of food restriction or calorie restriction, only four published studies have focused on BMA (Table 2). First, Hamrick et al. studied the effects of a 40% food restriction in 14-week-old male mice (60). The 10-week protocol led to a body weight loss of 30% (relative to control mice) and the total disappearance of BM adipocytes in the distal femur and lumbar vertebra (60) (two adipocyte-poor medullar sites). Despite this lack of adipocytes, the cortical thickness fell in the femur and lumbar vertebra, and the trabecular thickness fell in the femur (60). However, Devlin et al.’s 2010 study of the effects of a 9-week, 30% food restriction in 3-week-old male mice highlighted decreases of 11 and 27% in the bone volume/total volume (BV/TV) ratio and in cortical thickness, respectively (61). Although this protocol induced a relative body weight loss of 40% (compared with control mice), the food-restricted animals were nevertheless 80% heavier at the end of the protocol than at the start. The main impact on bone microarchitecture was observed in the femur, where the BM adipocyte density was 700% higher than in control animals. Third, Baek and Bloomfield fed 6-month-old Sprague-Dawley female rats a calorie-restricted diet for 12 weeks (62). At the end of this period, the calorie-restricted rats displayed body weight losses of 20% (relative to day 0) and 25% (relative to control rats). The volumetric bone mineral density of the proximal tibia was 14% below that of control mice, while the BMA in the proximal femur had doubled. More recently, Cawthorn et al. showed that 6 weeks of a 30% calorie-restricted diet in 9-week-old female mice induced a final increase in tibia BMA of 700% vs. mice able to feed ad libitum (27). In our separation-based model of AN (SBA), 8-week-old female mice were housed singly and submitted to time-restricted feeding (in order to avoid a compensatory increase in food intake and, thus, attain a daily food intake close to that of ad libitum mice) (63). The calorie-restricted animals rapidly lost around 25% of their initial body weight, which corresponded to a body weight loss of 40% (relative to control mice) after 10 weeks of the protocol. The bone mass gain observed in control mice was curtailed after 2 weeks of the protocol (63). After 10 weeks, the tibia trabecular BV/TV ratio, trabecular thickness, and cortical thickness were, respectively, 32, 31, and 15% lower in SBA mice than in control mice. However, the BMA level in the proximal tibia was similar to that observed in control mice (unpublished data). These results showed (as did Hamrick et al.’s study) that energy deficit can induce bone alterations in the absence of an obvious increase in BMA (60). Interestingly, Cawthorn et al. showed very recently that, in rabbit, CR leads to bone loss, even without increases in BMA (64).
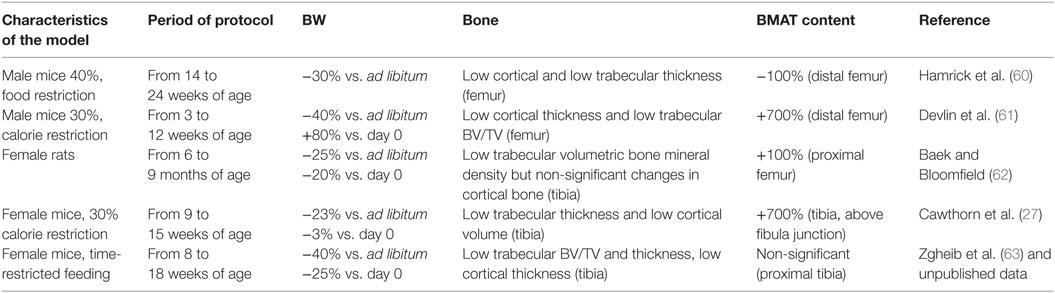
Table 2. Variations in BM adipose tissue (BMAT) content in calorie-restricted rodent models.
To learn more from these animal datasets about BMA regulation, one can attempt to compare them. The five above-mentioned studies assessed rodents of different genders and at different ages. The well-known differences between male and female physiology and the differences in BMA variation with age make it difficult to compare males with females (65). For the studies of male animals, the difference in observed BMA changes between Hamrick et al.’s study and Devlin et al.’s study might be linked to the age difference. One might conclude that calorie restriction induces a large increase in BMA in young male rodents only. However, it is also noteworthy that there is a late-onset BMA increase in male control mice; this might reduce the possible BMA increase in older animals (as observed at the end of Hamrick et al.’s study). When considering the three studies of female rodents, Baek’s work was performed on rats aged up to 9 months. It is difficult to compare old female rats with the 8- and 9-week-old C57Bl/6 female mice used by Cawthorn et al. and Zgheib et al., respectively. The main differences consisted in the body weight changes (relative to the start of the study) and the BMA changes in the tibia. Cawthorn et al. observed a stable body weight and a 700% increase in BMA, whereas Zgheib et al. observed a 25% decrease in body weight but no significant change in BMA. Given that these two models were similar enough to enable a valid comparison, one can hypothesize that the magnitude of body weight loss influences the change in BMA most strongly in young adult female mice.
Potential Regulators of BMA in a Context of Energy Deficit
As described above, it appears that BMA may be modulated by age, gender, and the severity of the energy deficit. However, it is important to bear in mind that BMA can also be affected by many different biological factors, including hormones, growth factors, and pharmacologic agents. Although the molecular mechanisms involved in BMA regulation have not been fully defined, they appear to converge on the modulation of peroxisome proliferator activated receptor gamma 2 (PPARγ2) expression and/or activity.
When considering potential regulators of BMA in subjects with a severely reduced calorie intake, it has been shown that dysregulation of the growth hormone insulin-like growth factor 1 axis and low leptin levels can stimulate BM adipogenesis (19, 61, 66). Moreover, starvation prompts the mobilization of fat stores, which might activate PPARγ2 and stimulate adipocyte differentiation in the BM (27). Furthermore, calorie restriction in a mouse model resulted in low expression and activity of runt-related transcription factor 2 (Runx2) and tafazzin (TAZ), both of which are pro-osteogenic transcriptional factors in BM stromal cells (67, 68).
Several other investigators have established links between BMA and pre-adipocyte factor 1 (Pref1). Indeed, circulating Pref1 concentrations are higher in women with AN than in healthy controls (66). In women who have recovered from AN, Pref1 levels are significantly lower than in normal-weight controls (66). Hence, it is possible that elevated Pref1 levels in AN may be involved in the increase in BMA.
It is also known that the production of reactive oxygen species (ROS) is greater in AN patients than in control subjects (69). ROS greatly influence the generation and survival of bone cells (70). In vitro studies of bone metabolism have shown that oxidative stress inhibits osteoblastic differentiation and induces apoptosis (71, 72).
Interestingly, women with AN have higher cortisol levels than healthy controls (73, 74). Cortisol levels are also predictive of a low bone mineral density in AN (73). In animal models, Cawthorn et al. showed that both BMA and glucocorticoids increase during CR in mice, but neither of these increases during CR in rabbits, suggesting a narrow link between these two phenomena (64). Experiments in vitro suggest that corticosteroids lead to adipogenesis by activating PPARγ2 and blocking the Wnt signaling pathway (75, 76). These findings also suggest that cortisol, Pref1, and leptin are all potential BMA regulators in a context of energy deficit.
Furthermore, women with AN have low estrogen levels (77, 78). Postmenopausal estrogen deficit has been linked to high BMA (79). In vitro studies have demonstrated that estradiol induces a pro-osteogenic lineage shift in BM stromal cells, whereas estrogen deficit in aging mice was found to induce a decrease in the expression and activity of the pro-osteogenic, anti-adipogenic factor sirtuin type 1 (80, 81). One can, thus, conclude that estrogen is likely to be involved in the regulation of BMA.
Moreover, it is important to note that BM adipose tissue (BMAT) expansion contributes significantly to the elevated serum adiponectin levels and skeletal muscle adaptation observed during CR (27). Indeed, the study by Cawthorn et al. suggested that BMAT is a major source of circulating adiponectin in states of leanness, and that (through endocrine functions) BMAT can have extraskeletal, systemic effects (27). Thus, adiponectin may also regulate BMA in this context.
Last, it is probable that ongoing and/or future research will prompt us to take account of new factors that regulate adiposity in a context of energy deficit.
Perspectives
This short overview of the relationship between BMA alterations and the severity of body weight loss highlights the complexity of the underlying processes and the mechanism of subsequent bone loss.
With a view to designing BMA-focused therapeutic strategies against osteoporosis in a context of energy deficit, one major question is “do BM adipocytes trigger bone loss in a context of energy deficit?” Several studies of patients with AN have shown that average-to-severe body weight loss tends to lead to normal or decreased BMA. This suggests that (i) the BMA increase observed in patients with mild body weight loss may be a late marker of changes that occur in BM and that result in low bone mass, and (ii) the absence of an increase in BMA does not necessarily mean that the skeleton is healthy. Some studies of CR animal models have shown that bone quality can decrease when the BMA is stable or even when it falls. This finding suggests that (at least in these models) hypotheses based on the effect of factors released by mature adipocytes on the BM microenvironment are not the most realistic. If the latter phenomenon is nevertheless involved, it might have a secondary role in the downregulation of bone physiology. Thus, BM adipocytes might not trigger bone loss in moderate-to-severe AN and in some CR models. Next, hypotheses involving competition between differentiation into osteoblasts and differentiation into adipocytes should be considered. Interestingly, our analysis of the differentiation capabilities of BM stromal cells from SBA and control mice found that the SBA cells displayed a huge increase in adipogenesis at the expense of osteoblastogenesis (unpublished data). This was observed in SBA mice that displayed normal or low BMA, which led us to suppose that the BM of these mice contains many pre-adipocytes that are not able to synthesize and store lipids in vivo. These preliminary results strengthen the second hypothesis, although further experiments will be required to confirm these observations and to determine which factors in the culture medium trigger this pre-adipocyte maturation and adipocyte activity. The glucose concentration appears to be a relevant candidate factor. However, favoring hypotheses based on the importance of pre-adipocytes raises another question: “Do pre-adipocytes influence their microenvironment?” The characterization of stromal cells at the earliest stage in culture might help to answer this question.
If one acknowledges that a shift in the differentiation of BM stromal cells toward the adipocyte lineage is the main BM event during bone mass loss in a context of energy deficit, the next question would be “how is this commitment regulated?” One way of addressing this question would be to develop CR models with different levels of body weight loss. One could then compare BMA, bone quality/turnover, concentrations of circulating hormones known to have effects on adipogenesis and osteoblastogenesis, and the BM stromal cells’ differentiation capabilities.
Tools are already available for studying how the differentiation of BM stromal cells is reprogrammed in animal models of CR and how differentiation is linked to the associated low bone mass. However, the development of novel tools for the in vivo assessment of specific cell types in the BM (such as pre-adipocytes) remains a true challenge.
Author Contributions
OG, NAR, PH, and CC discussed the concept, compiled the literature, and wrote the paper.
Conflict of Interest Statement
The authors declare that the research was conducted in the absence of any commercial or financial relationships that could be construed as a potential conflict of interest.
Funding
NAR’s PhD is founded by ULCO and Lebanon CNRS.
References
1. Song L, Tuan RS. Transdifferentiation potential of human mesenchymal stem cells derived from bone marrow. FASEB J (2004) 18(9):980–2. doi:10.1096/fj.03-1100fje
2. Rozman C, Feliu E, Berga L, Reverter JC, Climent C, Ferrán MJ. Age-related variations of fat tissue fraction in normal human bone marrow depend both on size and number of adipocytes: a stereological study. Exp Hematol (1989) 17(1):34–7.
3. Hardouin P, Rharass T, Lucas S. Bone marrow adipose tissue: to be or not to be a typical adipose tissue? Front Endocrinol (2016) 7:85. doi:10.3389/fendo.2016.00085
4. Moore SG, Dawson KL. Red and yellow marrow in the femur: age-related changes in appearance at MR imaging. Radiology (1990) 175(1):219–23. doi:10.1148/radiology.175.1.2315484
5. Griffith JF, Yeung DKW, Ma HT, Leung JCS, Kwok TCY, Leung PC. Bone marrow fat content in the elderly: a reversal of sex difference seen in younger subjects. J Magn Reson Imaging (2012) 36(1):225–30. doi:10.1002/jmri.23619
6. Shen W, Chen J, Gantz M, Punyanitya M, Heymsfield SB, Gallagher D, et al. MRI-measured pelvic bone marrow adipose tissue is inversely related to DXA-measured bone mineral in younger and older adults. Eur J Clin Nutr (2012) 66(9):983–8. doi:10.1038/ejcn.2012.35
7. Wren TAL, Chung SA, Dorey FJ, Bluml S, Adams GB, Gilsanz V. Bone marrow fat is inversely related to cortical bone in young and old subjects. J Clin Endocrinol Metab (2011) 96(3):782–6. doi:10.1210/jc.2010-1922
8. Verma S, Rajaratnam JH, Denton J, Hoyland JA, Byers RJ. Adipocytic proportion of bone marrow is inversely related to bone formation in osteoporosis. J Clin Pathol (2002) 55(9):693–8. doi:10.1136/jcp.55.9.693
9. Blebea JS, Houseni M, Torigian DA, Fan C, Mavi A, Zhuge Y, et al. Structural and functional imaging of normal bone marrow and evaluation of its age-related changes. Semin Nucl Med (2007) 37(3):185–94. doi:10.1053/j.semnuclmed.2007.01.002
10. Lecka-Czernik B. Marrow fat metabolism is linked to the systemic energy metabolism. Bone (2012) 50(2):534–9. doi:10.1016/j.bone.2011.06.032
11. Kawai M, Rosen CJ. Bone: adiposity and bone accrual-still an established paradigm? Nat Rev Endocrinol (2010) 6(2):63–4. doi:10.1038/nrendo.2009.249
12. Krings A, Rahman S, Huang S, Lu Y, Czernik PJ, Lecka-Czernik B. Bone marrow fat has brown adipose tissue characteristics, which are attenuated with aging and diabetes. Bone (2012) 50(2):546–52. doi:10.1016/j.bone.2011.06.016
13. Ahdjoudj S, Lasmoles F, Holy X, Zerath E, Marie PJ. Transforming growth factor beta2 inhibits adipocyte differentiation induced by skeletal unloading in rat bone marrow stroma. J Bone Miner Res (2002) 17(4):668–77. doi:10.1359/jbmr.2002.17.4.668
14. Justesen J, Stenderup K, Ebbesen EN, Mosekilde L, Steiniche T, Kassem M. Adipocyte tissue volume in bone marrow is increased with aging and in patients with osteoporosis. Biogerontology (2001) 2(3):165–71. doi:10.1023/A:1011513223894
15. Yeung DKW, Griffith JF, Antonio GE, Lee FKH, Woo J, Leung PC. Osteoporosis is associated with increased marrow fat content and decreased marrow fat unsaturation: a proton MR spectroscopy study. J Magn Reson Imaging (2005) 22(2):279–85. doi:10.1002/jmri.20367
16. Botolin S, McCabe LR. Bone loss and increased bone adiposity in spontaneous and pharmacologically induced diabetic mice. Endocrinology (2007) 148(1):198–205. doi:10.1210/en.2006-1006
17. Piccinin MA, Khan ZA. Pathophysiological role of enhanced bone marrow adipogenesis in diabetic complications. Adipocyte (2014) 3(4):263–72. doi:10.4161/adip.32215
18. Schafer AL, Li X, Schwartz AV, Tufts LS, Wheeler AL, Grunfeld C, et al. Changes in vertebral bone marrow fat and bone mass after gastric bypass surgery: a pilot study. Bone (2015) 74:140–5. doi:10.1016/j.bone.2015.01.010
19. Bredella MA, Torriani M, Ghomi RH, Thomas BJ, Brick DJ, Gerweck AV, et al. Vertebral bone marrow fat is positively associated with visceral fat and inversely associated with IGF-1 in obese women. Obesity (Silver Spring) (2011) 19(1):49–53. doi:10.1038/oby.2010.106
20. Bredella MA, Fazeli PK, Miller KK, Misra M, Torriani M, Thomas BJ, et al. Increased bone marrow fat in anorexia nervosa. J Clin Endocrinol Metab (2009) 94(6):2129–36. doi:10.1210/jc.2008-2532
21. Hardouin P, Pansini V, Cortet B. Bone marrow fat. Jt Bone Spine (2014) 81(4):313–9. doi:10.1016/j.jbspin.2014.02.013
22. Nishimura R, Hata K, Ikeda F, Ichida F, Shimoyama A, Matsubara T, et al. Signal transduction and transcriptional regulation during mesenchymal cell differentiation. J Bone Miner Metab (2008) 26(3):203–12. doi:10.1007/s00774-007-0824-2
23. Owen M. Marrow stromal stem cells. J Cell Sci Suppl (1988) 10:63–76. doi:10.1242/jcs.1988.Supplement_10.5
24. Pittenger MF, Mackay AM, Beck SC, Jaiswal RK, Douglas R, Mosca JD, et al. Multilineage potential of adult human mesenchymal stem cells. Science (1999) 284(5411):143–7. doi:10.1126/science.284.5411.143
25. Uckan D, Kilic E, Sharafi P, Kazik M, Kaya F, Erdemli E, et al. Adipocyte differentiation defect in mesenchymal stromal cells of patients with malignant infantile osteopetrosis. Cytotherapy (2009) 11(4):392–402. doi:10.1080/14653240802582083
26. Lecka-Czernik B. PPARs in bone: the role in bone cell differentiation and regulation of energy metabolism. Curr Osteoporos Rep (2010) 8(2):84–90. doi:10.1007/s11914-010-0016-1
27. Cawthorn WP, Scheller EL, Learman BS, Parlee SD, Simon BR, Mori H, et al. Bone marrow adipose tissue is an endocrine organ that contributes to increased circulating adiponectin during caloric restriction. Cell Metab (2014) 20(2):368–75. doi:10.1016/j.cmet.2014.06.003
28. Naveiras O, Nardi V, Wenzel PL, Hauschka PV, Fahey F, Daley GQ. Bone-marrow adipocytes as negative regulators of the haematopoietic microenvironment. Nature (2009) 460(7252):259–63. doi:10.1038/nature08099
29. Belaid-Choucair Z, Lepelletier Y, Poncin G, Thiry A, Humblet C, Maachi M, et al. Human bone marrow adipocytes block granulopoiesis through neuropilin-1-induced granulocyte colony-stimulating factor inhibition. Stem Cells (2008) 26(6):1556–64. doi:10.1634/stemcells.2008-0068
30. Yan Q-W, Yang Q, Mody N, Graham TE, Hsu C-H, Xu Z, et al. The adipokine lipocalin 2 is regulated by obesity and promotes insulin resistance. Diabetes (2007) 56(10):2533–40. doi:10.2337/db07-0007
31. Kern PA, Saghizadeh M, Ong JM, Bosch RJ, Deem R, Simsolo RB. The expression of tumor necrosis factor in human adipose tissue. Regulation by obesity, weight loss, and relationship to lipoprotein lipase. J Clin Invest (1995) 95(5):2111–9. doi:10.1172/JCI117899
32. Herzog W, Minne H, Deter C, Leidig G, Schellberg D, Wüster C, et al. Outcome of bone mineral density in anorexia nervosa patients 11.7 years after first admission. J Bone Miner Res (1993) 8(5):597–605. doi:10.1002/jbmr.5650080511
33. Solmi M, Veronese N, Favaro A, Santonastaso P, Manzato E, Sergi G, et al. Inflammatory cytokines and anorexia nervosa: a meta-analysis of cross-sectional and longitudinal studies. Psychoneuroendocrinology (2015) 51:237–52. doi:10.1016/j.psyneuen.2014.09.031
34. Corcos M, Guilbaud O, Chaouat G, Cayol V, Speranza M, Chambry J, et al. Cytokines and anorexia nervosa. Psychosom Med (2001) 63(3):502–4. doi:10.1097/00006842-200105000-00021
35. Bredella MA, Fazeli PK, Daley SM, Miller KK, Rosen CJ, Klibanski A, et al. Marrow fat composition in anorexia nervosa. Bone (2014) 66:199–204. doi:10.1016/j.bone.2014.06.014
36. Fazeli PK, Bredella MA, Freedman L, Thomas BJ, Breggia A, Meenaghan E, et al. Marrow fat and preadipocyte factor-1 levels decrease with recovery in women with anorexia nervosa. J Bone Miner Res (2012) 27(9):1864–71. doi:10.1002/jbmr.1640
37. Ecklund K, Vajapeyam S, Feldman HA, Buzney CD, Mulkern RV, Kleinman PK, et al. Bone marrow changes in adolescent girls with anorexia nervosa. J Bone Miner Res (2010) 25(2):298–304. doi:10.1359/jbmr.090805
38. Mayo-Smith W, Rosenthal DI, Goodsitt MM, Klibanski A. Intravertebral fat measurement with quantitative CT in patients with Cushing disease and anorexia nervosa. Radiology (1989) 170(3 Pt 1):835–8. doi:10.1148/radiology.170.3.2916039
39. Geiser F, Mürtz P, Lutterbey G, Träber F, Block W, Imbierowicz K, et al. Magnetic resonance spectroscopic and relaxometric determination of bone marrow changes in anorexia nervosa. Psychosom Med (2001) 63(4):631–7. doi:10.1097/00006842-200107000-00016
40. Abella E, Feliu E, Granada I, Millá F, Oriol A, Ribera JM, et al. Bone marrow changes in anorexia nervosa are correlated with the amount of weight loss and not with other clinical findings. Am J Clin Pathol (2002) 118(4):582–8. doi:10.1309/2Y7X-YDXK-006B-XLT2
41. Boutin RD, White LM, Laor T, Spitz DJ, Lopez-Ben RR, Stevens KJ, et al. MRI findings of serous atrophy of bone marrow and associated complications. Eur Radiol (2015) 25(9):2771–8. doi:10.1007/s00330-015-3692-5
42. Lambert M, Hubert C, Depresseux G, Vande Berg B, Thissen JP, Nagant de Deuxchaisnes C, et al. Hematological changes in anorexia nervosa are correlated with total body fat mass depletion. Int J Eat Disord (1997) 21(4):329–34. doi:10.1002/(SICI)1098-108X(1997)21:4<329::AID-EAT4>3.0.CO;2-Q
43. Vande Berg BC, Malghem J, Lecouvet FE, Lambert M, Maldague BE. Distribution of serous like bone marrow changes in the lower limbs of patients with anorexia nervosa: predominant involvement of the distal extremities. AJR Am J Roentgenol (1996) 166(3):621–5. doi:10.2214/ajr.166.3.8623638
44. Vande Berg BC, Malghem J, Devuyst O, Maldague BE, Lambert MJ. Anorexia nervosa: correlation between MR appearance of bone marrow and severity of disease. Radiology (1994) 193(3):859–64. doi:10.1148/radiology.193.3.7972838
45. Mant MJ, Faragher BS. The haematology of anorexia nervosa. Br J Haematol (1972) 23(6):737–49. doi:10.1111/j.1365-2141.1972.tb03488.x
46. Cornbleet PJ, Moir RC, Wolf PL. A histochemical study of bone marrow hypoplasia in anorexia nervosa. Virchows Arch A Pathol Anat Histol (1977) 374(3):239–47. doi:10.1007/BF00427118
47. Devuyst O, Lambert M, Rodhain J, Lefebvre C, Coche E. Haematological changes and infectious complications in anorexia nervosa: a case-control study. Q J Med (1993) 86(12):791–9.
48. Bailly D, Lambin I, Garzon G, Parquet PJ. Bone marrow hypoplasia in anorexia nervosa: a case report. Int J Eat Disord (1994) 16(1):97–100. doi:10.1002/1098-108X(199407)16:1<97::AID-EAT2260160112>3.0.CO;2-N
49. Mehler PS, Howe SE. Serous fat atrophy with leukopenia in severe anorexia nervosa. Am J Hematol (1995) 49(2):171–2. doi:10.1002/ajh.2830490219
50. Feugier P, Guerci A, Boman F, Stockemer V, Lederlin P. Transformation gélatineuse de la moelle osseuse. À propos de trois observations. Rev Méd Interne (1995) 16(1):15–9. doi:10.1016/0248-8663(96)80660-6
51. Nonaka D, Tanaka M, Takaki K, Umeno M, Okamura T, Taketa H. Gelatinous bone marrow transformation complicated by self-induced malnutrition. Acta Haematol (1998) 100(2):88–90. doi:10.1159/000040872
52. Orlandi E, Boselli P, Covezzi R, Bonaccorsi G, Guaraldi GP. Reversal of bone marrow hypoplasia in anorexia nervosa: case report. Int J Eat Disord (2000) 27(4):480–2. doi:10.1002/(SICI)1098-108X(200005)27:4<480::AID-EAT14>3.0.CO;2-3
53. Nishio S, Yamada H, Yamada K, Okabe H, Okuya T, Yonekawa O, et al. Severe neutropenia with gelatinous bone marrow transformation in anorexia nervosa: a case report. Int J Eat Disord (2003) 33(3):360–3. doi:10.1002/eat.10143
54. Boullu-Ciocca S, Darmon P, Sébahoun G, Silaghi A, Dutour-Meyer A. Gelatinous bone marrow transformation in anorexia nervosa. Ann Endocrinol (2005) 66(1):7–11. doi:10.1016/S0003-4266(05)81680-4
55. Tins B, Cassar-Pullicino V. Marrow changes in anorexia nervosa masking the presence of stress fractures on MR imaging. Skeletal Radiol (2006) 35(11):857–60. doi:10.1007/s00256-005-0053-5
56. Mohamed M, Khalafallah A. Gelatinous transformation of bone marrow in a patient with severe anorexia nervosa. Int J Hematol (2012) 97(2):157–8. doi:10.1007/s12185-012-1255-y
57. Rivière E, Pillot J, Saghi T, Clouzeau B, Castaing Y, Gruson D, et al. Gelatinous transformation of the bone marrow and acute hepatitis in a woman suffering from anorexia nervosa. Rev Méd Interne (2012) 33(7):e38–40. doi:10.1016/j.revmed.2011.11.011
58. Morii K, Yamamoto T, Kishida H, Okushin H. Gelatinous transformation of bone marrow in patients with anorexia nervosa. Intern Med (2013) 52(17):2005–6. doi:10.2169/internalmedicine.52.0912
59. Villate A, Iquel S, Legac E. Gelatinous transformation of the bone marrow: a retrospective monocentric case series of 12 patients. Rev Méd Interne (2015) 37(7):448–52. doi:10.1016/j.revmed.2015.10.349
60. Hamrick MW, Ding K-H, Ponnala S, Ferrari SL, Isales CM. Caloric restriction decreases cortical bone mass but spares trabecular bone in the mouse skeleton: implications for the regulation of bone mass by body weight. J Bone Miner Res (2008) 23(6):870–8. doi:10.1359/jbmr.080213
61. Devlin MJ, Cloutier AM, Thomas NA, Panus DA, Lotinun S, Pinz I, et al. Caloric restriction leads to high marrow adiposity and low bone mass in growing mice. J Bone Miner Res (2010) 25(9):2078–88. doi:10.1002/jbmr.82
62. Baek K, Bloomfield SA. Blocking β-adrenergic signaling attenuates reductions in circulating leptin, cancellous bone mass, and marrow adiposity seen with dietary energy restriction. J Appl Physiol (1985) (2012) 113(11):1792–801. doi:10.1152/japplphysiol.00187.2012
63. Zgheib S, Méquinion M, Lucas S, Leterme D, Ghali O, Tolle V, et al. Long-term physiological alterations and recovery in a mouse model of separation associated with time-restricted feeding: a tool to study anorexia nervosa related consequences. PLoS One (2014) 9(8):e103775. doi:10.1371/journal.pone.0103775
64. Cawthorn WP, Scheller EL, Parlee SD, Pham HA, Learman BS, Redshaw CM, et al. Expansion of bone marrow adipose tissue during caloric restriction is associated with increased circulating glucocorticoids and not with hypoleptinemia. Endocrinology (2016) 157(2):508–21. doi:10.1210/en.2015-1477
65. Scheller EL, Doucette CR, Learman BS, Cawthorn WP, Khandaker S, Schell B, et al. Region-specific variation in the properties of skeletal adipocytes reveals regulated and constitutive marrow adipose tissues. Nat Commun (2015) 6:7808. doi:10.1038/ncomms8808
66. Fazeli PK, Bredella MA, Misra M, Meenaghan E, Rosen CJ, Clemmons DR, et al. Preadipocyte factor-1 is associated with marrow adiposity and bone mineral density in women with anorexia nervosa. J Clin Endocrinol Metab (2010) 95(1):407–13. doi:10.1210/jc.2009-1152
67. Hong J-H, Yaffe MB. TAZ: a beta-catenin-like molecule that regulates mesenchymal stem cell differentiation. Cell Cycle (2006) 5(2):176–9. doi:10.4161/cc.5.2.2362
68. Guo X, Yang W, Ni J, He M, Yang L. A role for suppressed bone formation favoring catch-up fat in the pathophysiology of catch-up growth after food restriction. Eur J Nutr (2011) 50(8):645–55. doi:10.1007/s00394-011-0174-7
69. Victor VM, Rovira-Llopis S, Saiz-Alarcon V, Sangüesa MC, Rojo-Bofill L, Bañuls C, et al. Altered mitochondrial function and oxidative stress in leukocytes of anorexia nervosa patients. PLoS One (2014) 9(9):e106463. doi:10.1371/journal.pone.0106463
70. Hamada Y, Fujii H, Fukagawa M. Role of oxidative stress in diabetic bone disorder. Bone (2009) 45(Suppl 1):S35–8. doi:10.1016/j.bone.2009.02.004
71. Bai X, Lu D, Bai J, Zheng H, Ke Z, Li X, et al. Oxidative stress inhibits osteoblastic differentiation of bone cells by ERK and NF-kappaB. Biochem Biophys Res Commun (2004) 314(1):197–207. doi:10.1016/j.bbrc.2003.12.073
72. Fatokun AA, Stone TW, Smith RA. Hydrogen peroxide-induced oxidative stress in MC3T3-E1 cells: the effects of glutamate and protection by purines. Bone (2006) 39(3):542–51. doi:10.1016/j.bone.2006.02.062
73. Lawson EA, Donoho D, Miller KK, Misra M, Meenaghan E, Lydecker J, et al. Hypercortisolemia is associated with severity of bone loss and depression in hypothalamic amenorrhea and anorexia nervosa. J Clin Endocrinol Metab (2009) 94(12):4710–6. doi:10.1210/jc.2009-1046
74. Lawson EA, Misra M, Meenaghan E, Rosenblum L, Donoho DA, Herzog D, et al. Adrenal glucocorticoid and androgen precursor dissociation in anorexia nervosa. J Clin Endocrinol Metab (2009) 94(4):1367–71. doi:10.1210/jc.2008-2558
75. Greenberger JS. Corticosteroid-dependent differentiation of human marrow preadipocytes in vitro. In Vitro (1979) 15(10):823–8. doi:10.1007/BF02618309
76. Ohnaka K, Tanabe M, Kawate H, Nawata H, Takayanagi R. Glucocorticoid suppresses the canonical Wnt signal in cultured human osteoblasts. Biochem Biophys Res Commun (2005) 329(1):177–81. doi:10.1016/j.bbrc.2005.01.117
77. Pafumi C, Ciotta L, Farina M, Bosco P, Chiarenza M, Pernicone G, et al. Evaluation of bone mass in young amenorrheic women with anorexia nervosa. Minerva Ginecol (2002) 54(6):487–91.
78. Estour B, Germain N, Diconne E, Frere D, Cottet-Emard J-M, Carrot G, et al. Hormonal profile heterogeneity and short-term physical risk in restrictive anorexia nervosa. J Clin Endocrinol Metab (2010) 95(5):2203–10. doi:10.1210/jc.2009-2608
79. Syed FA, Oursler MJ, Hefferanm TE, Peterson JM, Riggs BL, Khosla S. Effects of estrogen therapy on bone marrow adipocytes in postmenopausal osteoporotic women. Osteoporos Int (2008) 19(9):1323–30. doi:10.1007/s00198-008-0574-6
80. Okazaki R, Inoue D, Shibata M, Saika M, Kido S, Ooka H, et al. Estrogen promotes early osteoblast differentiation and inhibits adipocyte differentiation in mouse bone marrow stromal cell lines that express estrogen receptor (ER) alpha or beta. Endocrinology (2002) 143(6):2349–56. doi:10.1210/en.143.6.2349
Keywords: bone marrow adiposity regulation, osteoporosis, gelatinous bone marrow transformation, mesenchymal stem cell differentiation, anorexia nervosa
Citation: Ghali O, Al Rassy N, Hardouin P and Chauveau C (2016) Increased Bone Marrow Adiposity in a Context of Energy Deficit: The Tip of the Iceberg? Front. Endocrinol. 7:125. doi: 10.3389/fendo.2016.00125
Received: 04 May 2016; Accepted: 30 August 2016;
Published: 16 September 2016
Edited by:
William Peter Cawthorn, University of Edinburgh, UKReviewed by:
Elaine Dennison, University of Southampton, UKJan Josef Stepan, Charles University in Prague, Czech Republic
Maureen Devlin, University of Michigan, USA
Copyright: © 2016 Ghali, Al Rassy, Hardouin and Chauveau. This is an open-access article distributed under the terms of the Creative Commons Attribution License (CC BY). The use, distribution or reproduction in other forums is permitted, provided the original author(s) or licensor are credited and that the original publication in this journal is cited, in accordance with accepted academic practice. No use, distribution or reproduction is permitted which does not comply with these terms.
*Correspondence: Christophe Chauveau, Y2hhdXZlYXVAdW5pdi1saXR0b3JhbC5mcg==