 Osamu Fujii
 Sawako Tatsumi*
 Mao OgataTomohiro ArakakiHaruna SakaguchiKengo NomuraAtsumi MiyagawaKayo Ikuta
 Ai HanazakiIchiro Kaneko
 Hiroko Segawa
 Ken-ichi Miyamoto*
- Department of Molecular Nutrition, Institution of Biomedical Science, Tokushima University Graduate School, Tokushima, Japan
In response to kidney damage, osteocytes increase the production of several hormones critically involved in mineral metabolism. Recent studies suggest that osteocyte function is altered very early in the course of chronic kidney disease. In the present study, to clarify the role of osteocytes and the canalicular network in mineral homeostasis, we performed four experiments. In Experiment 1, we investigated renal and intestinal Pi handling in osteocyte-less (OCL) model mice [transgenic mice with the dentin matrix protein-1 promoter-driven diphtheria toxin (DT)-receptor that were injected with DT]. In Experiment 2, we administered granulocyte colony-stimulating factor to mice to disrupt the osteocyte canalicular network. In Experiment 3, we investigated the role of osteocytes in dietary Pi signaling. In Experiment 4, we analyzed gene expression level fluctuations in the intestine and liver by comparing mice fed a high Pi diet and OCL mice. Together, the findings of these experiments indicate that osteocyte ablation caused rapid renal Pi excretion (P < 0.01) before the plasma fibroblast growth factor 23 (FGF23) and parathyroid hormone (PTH) levels increased. At the same time, we observed a rapid suppression of renal Klotho (P < 0.01), type II sodium phosphate transporters Npt2a (P < 0.01) and Npt2c (P < 0.05), and an increase in intestinal Npt2b (P < 0.01) protein. In OCL mice, Pi excretion in feces was markedly reduced (P < 0.01). Together, these effects of osteocyte ablation are predicted to markedly increase intestinal Pi absorption (P < 0.01), thus suggesting that increased intestinal Pi absorption stimulates renal Pi excretion in OCL mice. In addition, the ablation of osteocytes and feeding of a high Pi diet affected FGF15/bile acid metabolism and controlled Npt2b expression. In conclusion, OCL mice exhibited increased renal Pi excretion due to enhanced intestinal Pi absorption. We discuss the role of FGF23–Klotho on renal and intestinal Pi metabolism in OCL mice.
Introduction
Inorganic phosphate (Pi) homeostasis is maintained by complex interactions between vitamin D, parathyroid hormone (PTH), and fibroblast growth factor 23 (FGF23) (1–3). FGF23 promotes renal Pi excretion by decreasing its reabsorption in the proximal tubules while concurrently reducing plasma 1,25(OH)2D by both decreasing its biosynthesis and increasing its metabolism (3–6). FGF23 requires an additional cofactor, α-Klotho (Klotho), to bind with high affinity and signal efficiently through its cognate FGF receptor (7, 8). The FGF23–Klotho system directly participates in the bone–parathyroid axis as FGF23 inhibits PTH secretion (9–11). The sodium-dependent Pi cotransport system includes the Npt2a and Npt2c cotransporters, which locate in the apical membrane of the proximal tubular cells, and Npt2b cotransporter, which locates in the apical membrane of the intestinal epithelial cells (12–16). The FGF23–Klotho system suppresses renal Npt2a and Npt2c protein levels and decreases active vitamin D metabolism (17, 18). The reduction of plasma 1,25(OH)2D levels leads to decreased intestinal Npt2b protein levels (19). The FGF23–Klotho system regulates the three transporters and controls systematic Pi homeostasis (12, 13).
Elevated circulating FGF23 levels are strongly related to adverse outcomes in patients with chronic kidney disease (CKD) of all stages (20–22). Circulating FGF23 levels increase early in the course of CKD and reach levels that are several hundred times the normal range in advanced CKD and end-stage renal disease (20–22). CKD is also associated with reduced Klotho expression (23). Klotho deficiency is not only an early biomarker of CKD but also a pathogenic intermediate for CKD development and progression, and extrarenal complications (23). The causes of the increased cardiovascular risk associated with kidney disease are partly related to the CKD-mineral bone disorder (CKD-MBD) syndrome, with the FGF23–Klotho system playing an important role in the pathogenesis of CKD-MBD (23).
Osteocytes are abundant in bone and comprise 95% of all bone cells (24–26). The specialized morphology of osteocytes allows them to function effectively to direct the balance between osteoblast and osteoclast activity, and to regulate systemic mineral metabolism (24–26). Osteocytes respond to kidney damage by increasing the production of secreted factors important for bone and mineral metabolism (27). Indeed, these cells are the primary production site of several factors important for bone and mineral metabolism, including FGF23 and sclerostin (SOST), a negative regulator of the Wnt/β catenin pathway in bone (27, 28). Several recent reports suggest that altered osteocyte function is manifested by changes in osteocytic FGF23, and dentin matrix acidic phosphoprotrein-1 (DMP1) and SOST expression are observed very early in the course of CKD (27). By contrast, the decline in renal Klotho is an early event that is followed by other changes (FGF23, 1,25(OH)2D, PTH) as CKD progresses (29). Thus, osteocytes may be the central organ regulating Pi metabolism and dietary Pi-sensing in the kidney–bone axis (1, 24, 30, 31). The roles of osteocytes in mineral metabolism, however, have not been fully elucidated.
Recently, Tatsumi et al. established osteocyte-ablated model mice based on the diphtheria toxin receptor-mediated cell knockout (TRECK) system (32, 33) and examined the role of osteocytes in bone metabolism (32). Osteocyte-less (OCL) mice exhibit osteoporosis. Studies of osteocyte ablation model mice have provided in vivo evidence that osteocytes sense loading to the skeleton and orchestrate bone remodeling by controlling both osteoblasts and osteoclasts (32). The effect of osteocyte ablation on mineral metabolism remains unknown. Especially, the effects on calcium and Pi absorption, such as by the kidney and intestine, are not known. In addition, the effects of osteocyte ablation on the fluctuation of hormones related to mineral metabolism (PTH, FGF23, and vitamin D) are unclear. In the present study, we investigated mineral (calcium and Pi) metabolism in OCL mice.
Materials and Methods
Animal Experiments
In this study, we used the dentin matrix protein 1 promoter-diphtheria toxin receptor (DMP1-DTR) transgenic (Tg) mice established by Tatsumi et al. (32). Injecting these mice with diphtheria toxin (DT) achieves in vivo inducible and specific ablation of osteocytes. Ten-week-old DMP1-DTR Tg mice and wild-type (WT) mice as littermate controls (Cont) were maintained at 23°C on a 12-h light/dark cycle. The mice had unlimited access to water and a standard rodent diet. A metabolic cage was used to measure body weight, and to collect blood, urine, and feces. All animal studies were performed in accordance with the guidelines for the care and handling of laboratory animals and were approved by the animal care committee of Tokushima University.
For the dietary regulation experiments, 10-week-old male DT-injected mice (OCL and Cont mice) were placed on one of the following two isocaloric diets for 7 days: (1) control-Pi (CP) 0.6% Pi and (2) high-Pi (HP) 1.2% Pi (34, 35). For analysis of the osteocyte network-disrupted mice, we used granulocyte colony-stimulating factor (G-CSF)-injected mice. Injecting the mice with G-CSF induced hematopoietic stem/progenitor cell mobilization (36). Disruption of the osteocyte network was induced as described previously (37). Male C57 BL/6 mice were injected with recombinant human G-CSF (Filgrastim, Kyowa Kirin, 250 mg/kg body weight/day subcutaneously every 12 h in 10 divided doses unless otherwise indicated) in phosphate-buffered saline supplemented with 0.1% bovine serum albumin, and maintained for 1 day after administering the last dose of G-CSF for 24-h urine collection (37).
Establishment of Osteocyte-Ablated Mice (OCL Mice)
DMP1-DTR Tg mice were created based on the diphtheria TRECK system (32). The mouse DMP1 gene fused to human HB-EGF (DTR) cDNA with a polyadenylation signals were constructed. The DMP1-DTR Tg mice were mated with WT mice and the offspring were genotyped by polymerase chain reaction (PCR) targeting the inserted gene using genomic DNA extracted from the tail. The following primers were used: 5′-GGGTCCCTCTTCTTCCCTAGC-3′ (forward) and 5′-GTATCCACGGACCAGCTGCTAC-3′ (reverse) (200 bp product for the transgene). Injecting DMP1-DTR Tg mice with DT resulted in targeted and inducible ablation of osteocytes. DT (50 µg/kg body weight)-treated DMP1-DTR Tg mice were used as OCL mice (Figure 1A).
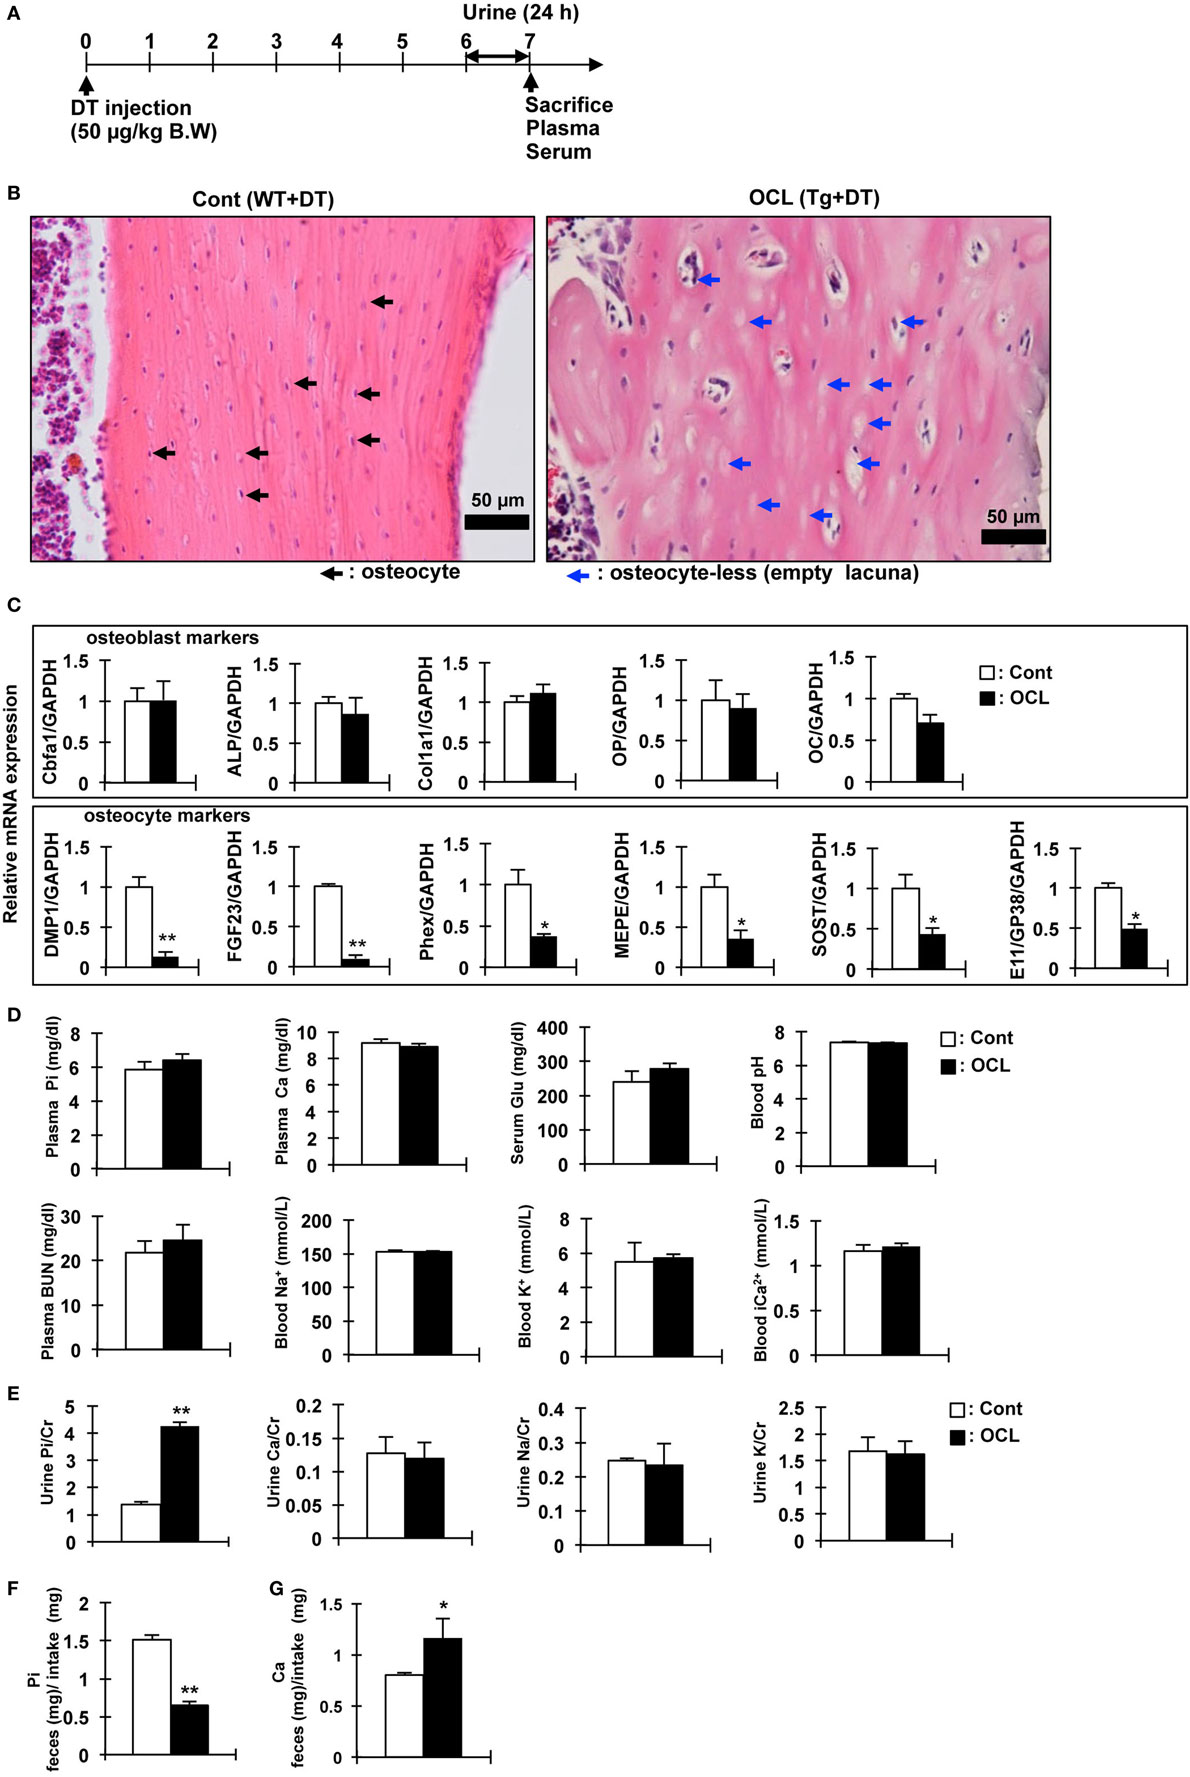
Figure 1. Gene expression and biochemical analysis in osteocyte-less (OCL) mice. (A) Experimental design. Ten-week old male wild-type (WT) and transgenic (Tg) mice were intraperitoneally injected with 50 µg/kg body weight diphtheria toxin (DT) in 0.9% NaCl were assessed at 7 days after injection. Controls (Cont): WT + DT, OCL: Tg + DT. (B) Cortical bone of the femurs of Cont and OCL mice stained with hematoxylin and eosin at 7 days after DT injection. Scale bars indicate 50 µm. Magnification 200×. Black arrowheads indicate osteocytes and blue arrowheads indicate ablated osteocytes (n = 6 mice/group). (C) Gene expression of osteocyte markers in femurs of OCL mice or Cont mice. Gene expression of osteocyte markers [dentin matrix protein-1 (DMP-1), fibroblast growth factor 23 (FGF23), phosphate-regulating endopeptidase homolog X-linked (Phex), matrix extracellular phosphoglycoprotein (MEPE), Sclerostin (SOST), and E11/GP38] and osteoblast markers [Cbfa1, a Alkaline Phosphatase (ALP), Collagen type I alpha (Col1a1), osteopontin (OP), and osteocalcin (OC)] were assessed by real-time polymerase chain reaction (PCR) at 7 days after DT injection. Data were normalized to glyceraldehyde 3-phosphate dehydrogenase (GAPDH) and pooled from two or three independent experiments (n = 6 mice/group). (D,E) Plasma, serum, whole blood, and urine biochemical markers in control and OCL mice at 7 days after DT injection (n = 6 mice/group). (F,G) From 6 to 7 days after DT injection, feces were collected for 24 h and food intake was measured (24 h) using a metabolic cage. (F) Inorganic phosphate (Pi) in feces (mg)/Pi intake (mg), (G) calcium in feces (mg)/Ca intake (mg) (n = 6 mice/group). Food consumption of the Cont mice was adjusted to that ingested by the OCL mice. Calcium and Pi levels in the feces were normalized to the amount of diet. The bar graphs are presented as arithmetic means ± SEM (n = 6/group). Two-tail unpaired t-test **P < 0.01, *P < 0.05 vs control.
Calcium Absorption Analysis
Intestinal Ca2+ absorption was assessed in 8-week-old mice by measuring serum 45Ca2+ at early time-points after oral gavage. Mice were fasted 12 h before the test. Animals were hemodynamically stable under anesthesia (urethane 1.4 mg/g body weight) during the entire experiment. The test solution contained 0.1 mM CaCl2, 125 mM NaCl, 17 mM Tris, and 1.8 g/l fructose, and was enriched with 20 μCi 45CaCl2/ml for oral tests (Cont and OCL mice) (38). For oral tests, 15 µl/g body weight was administered orally by gavage. Blood samples were obtained at the indicated time intervals. Serum (10 µl) was analyzed by liquid scintillation counting (38). Changes in the plasma calcium concentration (Δμmol) were calculated from the 45Ca content of the plasma samples and the specific activity of the administered calcium (38).
Gene Expression Studies
Total RNA was isolated from bone, liver, proximal intestine, and distal intestine with ISOGEN (Wako, Osaka, Japan). The proximal intestine refers to the duodenum and the proximal part of the jejunum. The distal intestine refers to the distal part of jejunum and ileum (39). For quantitative reverse transcription (RT)-PCR, total RNA (1 µg) was reverse-transcribed using Moloney Murine Leukemia Virus Reverse Transcriptase (Invitrogen), and samples were analyzed using the Applied Biosystems®StepOnePlus Real-Time PCR system (Thermo Fisher Scientific Inc., Japan). The primers and product size used are shown in Table S1 in Supplementary Material. The amount of target mRNA was normalized to that of glyceraldehyde 3-phosphate dehydrogenase (GAPDH) mRNA. RT-PCR was performed using SYBR® Premix Ex Taq II (Tli RNaseH Plus) (TAKARA, OSAKA, Japan). The PCRs contained 1 µl of cDNA (equivalent to 50 ng of total RNA), 2× SYBR® Premix Ex Taq II and 400 nM specific primers in a total of 25 µl. Relative expression values were evaluated with the 2−ΔΔCt method. Data were normalized to GAPDH and pooled from three independent experiments.
Biochemical Analyses
Plasma, feces, and urinary Pi and calcium and serum blood urea nitrogen (BUN) were determined by the Phospha-C test, Calcium-E test, or BUN-B test (Wako Pure Chemical Industries, Ltd., Osaka, Japan), respectively (40). To measure the fecal Pi and calcium levels, the collected feces (24 h) were dried at 110°C for 24 h, 250°C for 3 h, and at 350°C for 3 h. FGF23 and PTH concentrations were determined using an FGF23 ELISA kit (Kainos Laboratories, Inc., Tokyo, Japan) and mouse PTH 1-84 ELISA kit (Immutopics, CA, USA), respectively (40). 1,25(OH)2D levels were measured using a radioreceptor assay (SRL, Inc., Tokyo, Japan). Heparinized mixed arterial–venous blood was collected and analyzed immediately for pH, blood gases, and electrolytes using an OPTI CCA TS blood gas analyzer (Sysmex Corporation, Kobe, Japan).
Bone Analysis
Eight- to ten-week-old Tg mice and their WT littermates were perfused with 4% paraformaldehyde in 0.1 M cacodylate buffer (pH 7.4). Femurs and tibiae were immersed in the same fixative for 12 h prior to decalcification with 10% EDTA (pH 7.4) for 2 weeks. The specimens were embedded in paraffin and subjected to histochemistry with hematoxylin and eosin staining and immunohistochemical analysis using DMP1 antibody (TAKARA, Kyoto, Japan).
Preparation of Brush Border Membrane Vesicles (BBMVs) and Transport Assay
Brush border membrane vesicles were prepared from kidney and distal intestine using the Ca2+ precipitation method, and used for immunoblot analysis as previously described (34, 41). Levels of leucine aminopeptidase, Na+-K+-ATPase, and cytochrome c oxidase were measured to assess membrane purity. Uptake of 32P into the BBMVs was measured by the rapid filtration technique (34, 41).
Immunoblot Analyses
Protein samples were in denatured with 2-mercaptoethanol and subjected to 8 or 10% SDS-PAGE. The separated proteins were transferred by electrophoresis to Immobilon-P polyvinylidene difluoride (Millipore, Billerica, MA, USA) and then treated with the following diluted antibodies. Immunoblot analyses were performed using the following primary antibodies: affinity-purified anti-Npt2a (1:4,000) (34), anti-Npt2c (1:3,000) (41), and anti-Npt2b (1:2,000), as described previously (42). Anti-Klotho (for mouse total lysate; Trans Genic Inc., Fukuoka, Japan) was used following the manufacturer’s instructions. Mouse anti-actin monoclonal antibody (Chemicon, Temecula, CA, USA) was used as an internal control. Horseradish peroxidase-conjugated anti-rabbit or anti-mouse IgG was utilized as the secondary antibody (Jackson Immuno Research Laboratories, Inc., West Grove, PA, USA), and signals were detected using Immobilon Western (Millipore). Membranes were exposed to standard X-ray film and densitometric quantification was performed using ImageJ software (National Institutes of Health, Bethesda, MD, USA). All experiments were repeated at least five times.
Histochemical Analyses of Kidney Sections
Immunohistochemical analyses of rat kidney sections were performed as described previously with minor modifications (43). Specimens were embedded in paraffin and subjected to immunohistochemistry for affinity-purified Npt2a antibodies or affinity-purified Npt2c antibodies. Sections were then treated with Envision (+) rabbit peroxidase (Dako, Carpinteria, CA, USA) for 30 min at room temperature. Immunoreactivity was detected by incubating the sections with 0.8 mM diaminobenzidine (43). Masson trichrome staining was observed using a Trichrome Stain (Masson) Kit (Sigma-Aldrich, St. Louis, MO, USA) following the manufacturer’s instructions. Von kossa stain performed in OCL and klotho-deficient mice (43). Von Kossa staining for mineral deposition in the kidney was performed by applying 5% silver nitrate to the renal sections and exposing the sections to bright light for 30 min (44). Paraffin sections were counterstained with hematoxylin for evaluation of tissue and cell morphology.
Statistical Analysis
Data are expressed as mean ± SEM. Statistical analysis was performed using the Student’s t-test. We evaluated differences between the two groups by an unpaired t-test and differences among multiple groups were analyzed by ANOVA followed by Tukey’s post-test for multiple comparisons. All computations were performed using GraphPad Prism 5.0 Software. In all experiments, differences were considered statistically significant at P < 0.05.
Results
Pi Regulatory Genes in Bone of the OCL Mice
We investigated the physiologic function of osteocytes in OCL mice. Expression of DT receptors on osteocytes was targeted specifically using the DMP1 promoter (32). A single intraperitoneal injection of DT into DMP1-DTR Tg mice killed osteocytes harboring the DT receptor and resulted in a number of empty lacunae containing no osteocytes, as reported previously (32). The OCL mice exhibited a non-significant tendency toward decreased food intake, consistent with a previous report (45). Histochemical analysis of the cortical bone revealed a low abundance of osteocytes compared with Cont mice (32). Consistent with previous findings (9), OCL mice exhibited a decreased osteocyte number at 7 days after DT injection (Figures 1A,B). After ablated osteocytes, bone resorption was increased, bone formation and mineralization are suppressed, resulting in osteoporosis (32).
We also measured the expression of Pi regulatory genes in the osteocyte-rich fractions as described previously (32). The mRNA levels of DMP1 (P < 0.01), FGF23 (P < 0.01), matrix extracellular phosphoglycoprotein (MEPE) (P < 0.05), and phosphate-regulating endopeptidase homolog X-linked (Phex) (P < 0.05) as Pi regulatory factors were significantly decreased in OCL mice. SOST (P < 0.05) and E11/GP38 (P < 0.05) as osteocyte markers were also significantly decreased in OCL mice (Figure 1C). On the other hand, osteoblast markers were not changed in OCL mice compared with Cont mice. Compared with DT-injected WT mice, DT (50 µg/kg, DT50)-injected Tg mice showed no changes in plasma Pi, calcium, glucose, pH, BUN, Na+, K+, and Ca2+ (Figure 1D). In addition, urinary Ca/Cr, Na/Cr, and K/Cr concentrations were not different between DT50 mice and Cont mice (Figure 1E). By contrast, OCL mice exhibited prominent hyperphosphaturia (P < 0.01) (Figure 1E). Food consumption by the OCL mice was slightly lower than that of Cont mice. Food consumption by the Cont mice was adjusted to the amount in OCL mice. Calcium and Pi levels in the feces were normalized to the amount of diet consumed. The Pi content in the feces was reduced by 56.9% that in the Cont mice (P < 0.01) (Figure 1F). The calcium content in the feces was 45.4% higher than that in Cont mice (P < 0.05) (Figure 1G). These findings suggest that renal Pi excretion and intestinal Pi and calcium absorption may be abnormal in OCL mice. In particular, it is expected that the increased Pi absorption in the small intestine influences systemic Pi metabolism.
Time-Course of the Changes in the Hormones Involved in Pi Homeostasis in OCL Mice
To investigate the initial triggers for the increase in renal Pi excretion, we analyzed the time-course of the changes in the Pi excretion levels, plasma PTH, FGF23, and renal Klotho protein after DT treatment. Renal Pi excretion was significantly increased at 5 days after DT injection (3.45-fold, P < 0.01) (Figure 2A). Plasma FGF23 levels first decreased at 1 day (32.4%, P < 0.01) and 3 days (32.4%, P < 0.01) after injection of DT and then recovered (Figure 2B). By contrast, plasma PTH levels were significantly increased at 9 days (1.52-fold, P < 0.01) (Figure 2C). Renal Klotho levels were significantly (75.5%) decreased at 5 days after DT injection (P < 0.01) (Figure 2D). These data suggest that the beginning of the increase in Pi excretion is not consistent with that of the increase in plasma PTH and FGF23 levels. We analyzed renal fibrosis (Figure 2E). High dietary Pi loading increases renal fibrosis (46). In OCL mice, kidney samples were obtained at 7 days after DT injection. The kidney samples obtained from OCL mice were stained with Masson’s trichrome to detect total collagen deposits (Figure 2E), which revealed interstitial fibrosis and increased renal Pi excretion independent of plasma PTH and FGF23 levels. The kidney calcification observed in Klotho-deficient mice was not detected in OCL mice (Figure 2F).
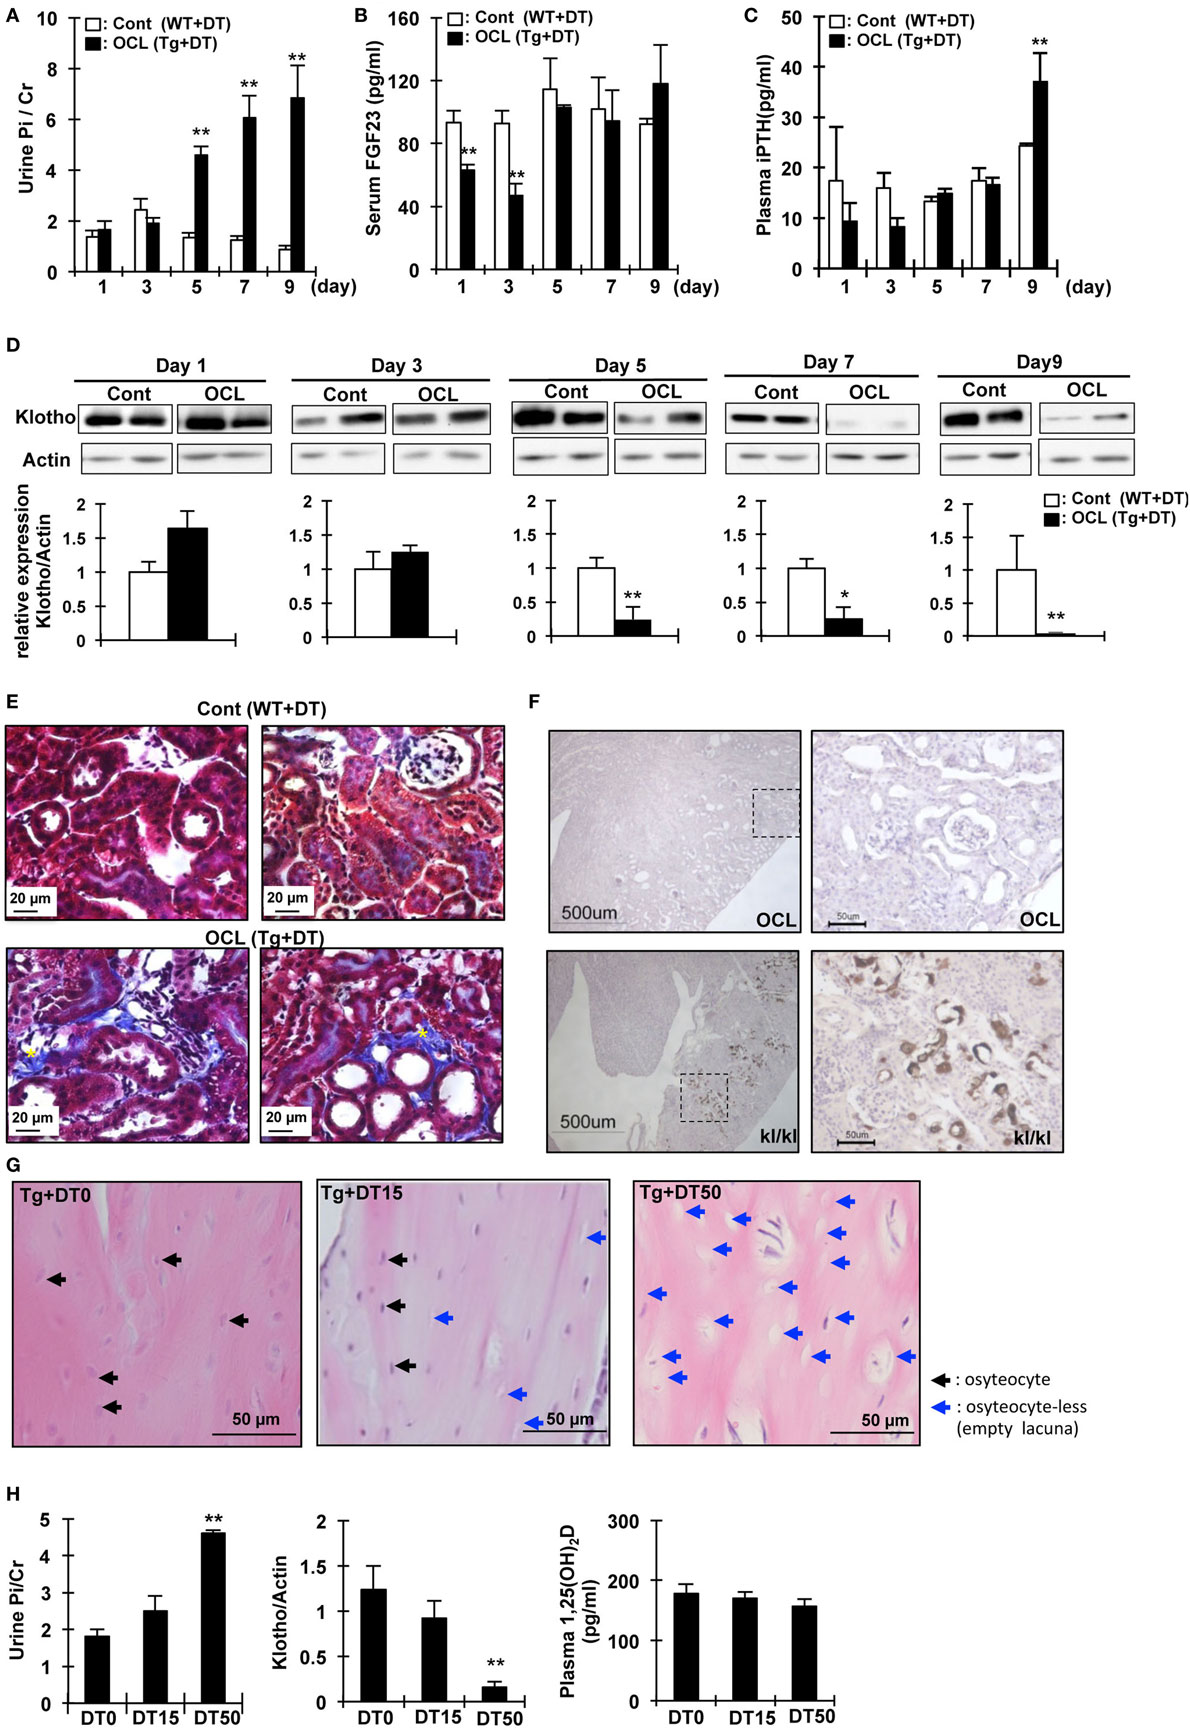
Figure 2. Changes in urine phosphate and phosphate-regulating factor in osteocyte-less (OCL) mice. Ten-week old male transgenic (Tg) mice and wild-type (WT) mice were intraperitoneally injected with 50 µg/kg body weight diphtheria toxin (DT) in 0.9% NaCl. Controls (Cont): WT + DT, OCL: Tg + DT. Analysis of biochemical markers at the indicated times after DT administration. (A) Urine Pi/Cr, (B) serum fibroblast growth factor 23 (FGF23), and (C) plasma PTH were analyzed in Cont and OCL mice after DT injection. (D) Renal Klotho expression in OCL mice by immunoblotting analysis (n = 6 mice/group). (E) Masson trichrome staining of sequential kidney sections from Cont and OCL mice. Scale bars indicate 20 µm. Magnification 400×. In OCL mice, severe fibrosis was observed in the peritubular interstitium. Fibrotic areas are stained blue (yellow *). (F) Von Kossa staining for mineral deposition in the kidney. OCL: Tg + DT (50 µg/kg body weight DT injection), kl/kl: klotho-deficient mice. Scale bars indicate 500 µm, Magnification 100× (n = 6/group). (G,H) Ten-week-old male transgenic (Tg) mice were intraperitoneally injected with 15 or 50 µg/kg body weight DT in 0.9% NaCl. DT0: vehicle (0.9%NaCl), DT15: 15 µg/kg body weight DT injection, DT50; 50 µg/kg body weight DT injection (n = 6/group). (G) Cortical bone mouse femurs stained with hematoxylin and eosin at 5 days after DT injection. Scale bars indicate 50 µm. Magnification 200×. (H) Urine Pi excretion in OCL. Renal Klotho expression in OCL mice by immunoblotting analysis. Plasma 1,25(OH)2D in OCL mice. The bar graphs are presented as arithmetic means ± SEM (n = 6/group). Two-tail unpaired t-test **P < 0.01 vs control.
We then investigated if DT injection induced dose-dependent changes in the osteocyte number and renal Pi excretion (32). At 5 days after DT (0, 15, or 50 µg/kg BW) injection, we measured Pi excretion and renal Klotho and 1,25(OH)2D levels (Figure 2G). At 5 days after DT injection, the number of osteocytes in the cortical bone decreased to 33.5 ± 1.7% (DT15) or 75.3 ± 4.2% (DT50) that in the DT0 mice (P < 0.01) (Figure 2G). The plasma 1,25(OH)2D levels did not change after DT injection (Figure 2H). Urinary Pi excretion was significantly increased at 5 days after DT50 injection (P < 0.01) (Figure 2C). By contrast, DT50 injection markedly suppressed renal Klotho expression (P < 0.01) (Figure 2D). These data suggest that the increased renal Pi excretion was dependent on the number of osteocytes ablated.
Renal and Intestinal Pi Transport Activity in the OCL Mice
To examine whether the expression of renal Pi transporters was affected in OCL mice, Npt2a and Npt2c mRNA and protein levels were investigated (Figure 3). Npt2a and Npt2c mRNA levels were significantly decreased in OCL mice (P < 0.01) (Figure 3A). PiT2 mRNA levels were not changed in OCL mice compared with Cont mice (Figure 3A). 1α(OH)ase mRNA levels were markedly increased in OCL mice (4.9-fold, P < 0.01), whereas 24(OH)ase mRNA expression levels were not changed (54.4% decreases, P < 0.01) (Figure 3A). Klotho mRNA expression levels were significantly (44.4%) decreased in OCL mice (P < 0.01) (Figure 3A).
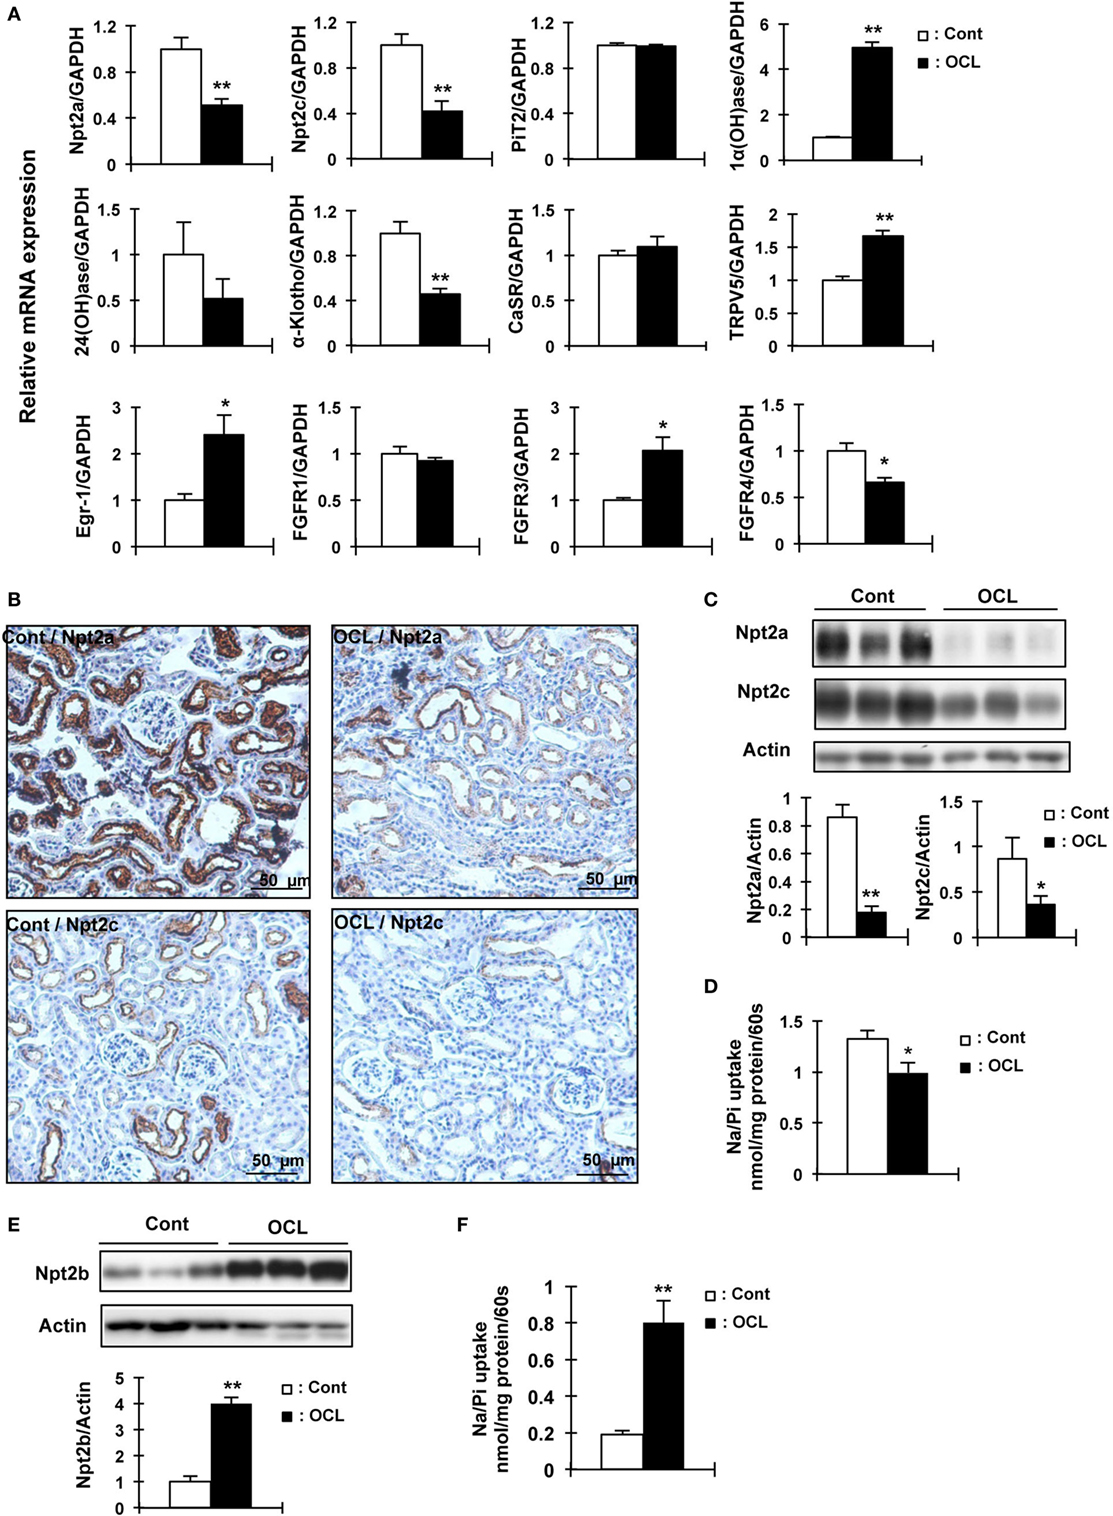
Figure 3. Expression of renal Npt2a, Npt2c, and intestinal Npt2b in osteocyte-less (OCL) mice. Ten-week-old male wild-type (WT) and transgenic (Tg) mice were intraperitoneally injected with 50 µg/kg body weight DT in 0.9% NaCl and assessed at 5 days after injection. Controls (Cont): WT + DT, OCL: Tg + DT. (A) Quantitative polymerase chain reaction (PCR) of Npt2a, Npt2c, PiT2, 1α(OH)ase, 24(OH)ase, Klotho, CasR, TRPV5, early growth response 1 (Egr-1), FGF receptor 1 (FGFR1), FGFR3, and FGF receptors 4 (FGFR4) mRNA in mouse kidney at 5 days after DT injection. Data were normalized to glyceraldehyde 3-phosphate dehydrogenase (GAPDH) and pooled from two or three independent experiments (n = 7 mice/group). (B) Immunohistochemical analysis of renal Npt2a and Npt2c proteins. Scale bars indicate 50 µm. Magnification 200×. (C) Immunoblotting analysis of Npt2a and Npt2c proteins in renal brush-border membrane vesicles (BBMVs). All membranes were reprobed for actin. Actin was used as an internal control. The bar graphs are presented as arithmetic means ± SEM (n = 5/group). (D) Renal Na/Pi transport activity in mice. Na/Pi transport activity was determined by 32P uptake in kidney BBMVs (n = 7/group). (E) Immunoblotting analysis of Npt2b proteins in intestinal (jejunum and ileum) brush-border membrane vesicles. All membranes were reprobed for actin. Actin was used as an internal control (n = 7 each/group). (F) Intestinal (distal jejunum and ileum) Na/Pi transport activity in mice. Na/Pi transport activity was determined by 32P uptake in intestinal BBMVs (n = 7/group). The bar graphs are presented as arithmetic means ± SEM, Two-tail unpaired t-test **P < 0.01, *P < 0.05 vs control.
The mRNA levels of the transcription factor early growth response 1 (Egr-1) were significantly increased in OCL mice (2.4-fold, P < 0.01), whereas FGF receptor 1 (FGFR1) mRNA levels were not changed. The mRNA expression levels of FGF receptors 3 (FGFR3) were significantly increased (2.1-fold, P < 0.01) and FGF receptors 4 (FGFR4) were significantly decreased (34%, P < 0.01) (Figure 3A). Npt2a and Npt2c protein levels were markedly decreased in OCL mice (P < 0.01, P < 0.05) (Figure 3C). In addition, sodium-dependent Pi cotransport activity in the BBMVs was also significantly reduced in OCL mice compared with Cont mice (P < 0.01) (Figure 3D). Immunohistochemical analysis revealed reduced Npt2a and Npt2c immunoreactivity in the proximal tubular cells (Figure 3B). Intestinal Npt2b protein levels were significantly increased in OCL mice compared with Cont mice (fourfold, P < 0.01) (Figure 3E). Intestinal Pi transport activity in OCL mice was 4.2-fold higher than that in the Cont mice (P < 0.01) (Figure 3F).
Intestinal Calcium Absorption
We then investigated calcium absorption in the small intestine. In contrast to intestinal Pi absorption, the calcium content in the feces in OCL mice was 45.4% higher than that in Cont mice (P < 0.05) (Figure 1G).
Oral calcium absorption analysis using 45Ca2+ solution indicated that calcium absorption (plasma 45Ca2+) levels were significantly (62–69%) decreased in OCL mice (P < 0.01) (Figure 4A). Intestinal transient receptor potential vanilloid 6 (TRPV6), calbindin-D9k (CaBP D9k), and plasma membrane calcium ATPase 1b (PMCA1) mRNA levels, however, were not altered in OCL mice (Figure 4B). On the other hand, mRNA expression levels of claudin 2, which regulates intestinal Ca2+ absorption via paracellular pathways, were dramatically (79.1%) decreased in OCL mice (P < 0.01) (Figure 4C). Although claudin 12 mRNA expression levels were not changed in OCL mice, claudin 15 mRNA expression levels were decreased in OCL mice (30.4% decreases, P < 0.05). Thus, intestinal calcium absorption was significantly decreased in OCL mice. On the other hand, renal excretion of calcium was not affected in OCL mice. In the kidney, calcium-sensing receptor mRNA levels were not changed and TRPV5 mRNA expression was significantly (1.7-fold) increased in OCL mice (P < 0.01) (Figure 3A).
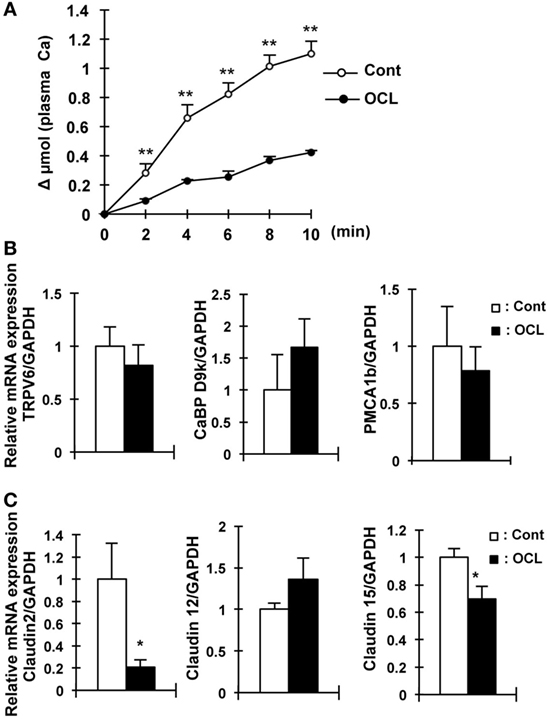
Figure 4. Calcium absorption in osteocyte-less (OCL) mice. Ten-week-old male wild-type (WT) and transgenic (Tg) mice were intraperitoneally injected with 50 µg/kg body weight DT in 0.9% NaCl at 5 days after DT injection. Control (Cont): WT + DT, OCL: Tg + DT. (A) Intestinal calcium absorption, assessed by whole blood levels of 45Ca (Δμmol) after oral gavage (n = 5/group). (B) Gene expression of calcium transport and its regulating factor in intestinal of OCL mice or Cont mice. Gene expression of transient receptor potential vanilloid channel 6 (TRPV6) as apical calcium transport, calbindin-D9k (CaBP-9k) as cytoplasmic calcium-binding proteins, and plasma membrane calcium ATPase 1b (PMCA1b) as basolateral calcium transporter were assessed by real-time polymerase chain reaction (PCR) at 5 days after DT injection. Data were normalized to glyceraldehyde 3-phosphate dehydrogenase (GAPDH) and pooled from two or three independent experiments (n = 7 mice/group). (C) Gene expression of intestinal claudin 2, 12, and 15 in OCL mice or Cont mice. Gene expression of intestinal (proximal part of intestine) claudin 2, 12, and 15 were assessed by real-time PCR at 5 days after DT injection. Data were normalized to GAPDH and pooled from two or three independent experiments (n = 7 mice/group). The bar graphs are presented as arithmetic means ± SEM, two-tail unpaired t-test **P < 0.01, *P < 0.05 vs control.
Analysis of Osteocyte Canalicular Network-Disrupted Mice
We investigated other mouse models of osteocyte network disruption. Eight-week-old C57BL/6 mice were administered recombinant human G-CSF (250 µg/kg body weight/day) and analyzed 1 day after the last dose of G-CSF (Figure 5A). In the G-CSF injected mice, hematopoietic stem cells were removed from the medullary cavity (data not shown). RNA was extracted from the tibias and femurs of vehicle- and G-CSF-treated mice after flushing out the bone marrow. Gene expression was assessed by quantitative RT-PCR and the results were normalized to GAPDH mRNA. In G-CSF injected mice, Col1a1 (64.6%, P < 0.01), osteocalcin (53.8%, P < 0.01), and osteopontin mRNA (58.8%, P < 0.05) as osteoblastic markers were decreased; and FGF23 (83.8%), DMP1 (54.8%), and Phex (62.4%) as osteocytic markers were also decreased (P < 0.01), suggesting that differentiation of osteoblasts into osteocytes was suppressed by G-CSF injection (Figure 5C). Immunohistochemical analysis using DMP1 antibody showed that the length and number of canaliculi were markedly decreased in the femoral bone of G-CSF treated mice (Figure 5B). Remarkably, canaliculi did not reach the surface of the bone (Figure 5C). Therefore, these results indicate that the osteocytic canalicular network was disrupted. The serum Pi concentration did not significantly differ between the G-CSF-injected mice and vehicle-injected mice (Figure 5D) and was similar to that in the OCL mice (Figure 1D). Urinary Pi levels, however, were significantly higher (2.2-fold, P < 0.05) in the G-CSF-injected mice than in the vehicle-injected mice (Figure 5D), same as in OCL mice (Figure 1E). In the renal BBM of G-CSF mice, Npt2a and Npt2c levels were significantly decreased (P < 0.05) (Figure 5E), similar to the renal Npt2a and Npt2c protein levels in OCL mice (Figure 3C). In G-CSF-injected mice, plasma iPTH and FGF23 levels did not differ significantly from those in the vehicle-injected mice (Figure 5F). On the other hand, renal Klotho protein levels were decreased in G-CSF-injected mice (P < 0.05) (Figure 5F). Thus, mice with G-CSF-induced osteocyte network disruption showed hyperphosphaturia independent of the plasma PTH and FGF23 levels.
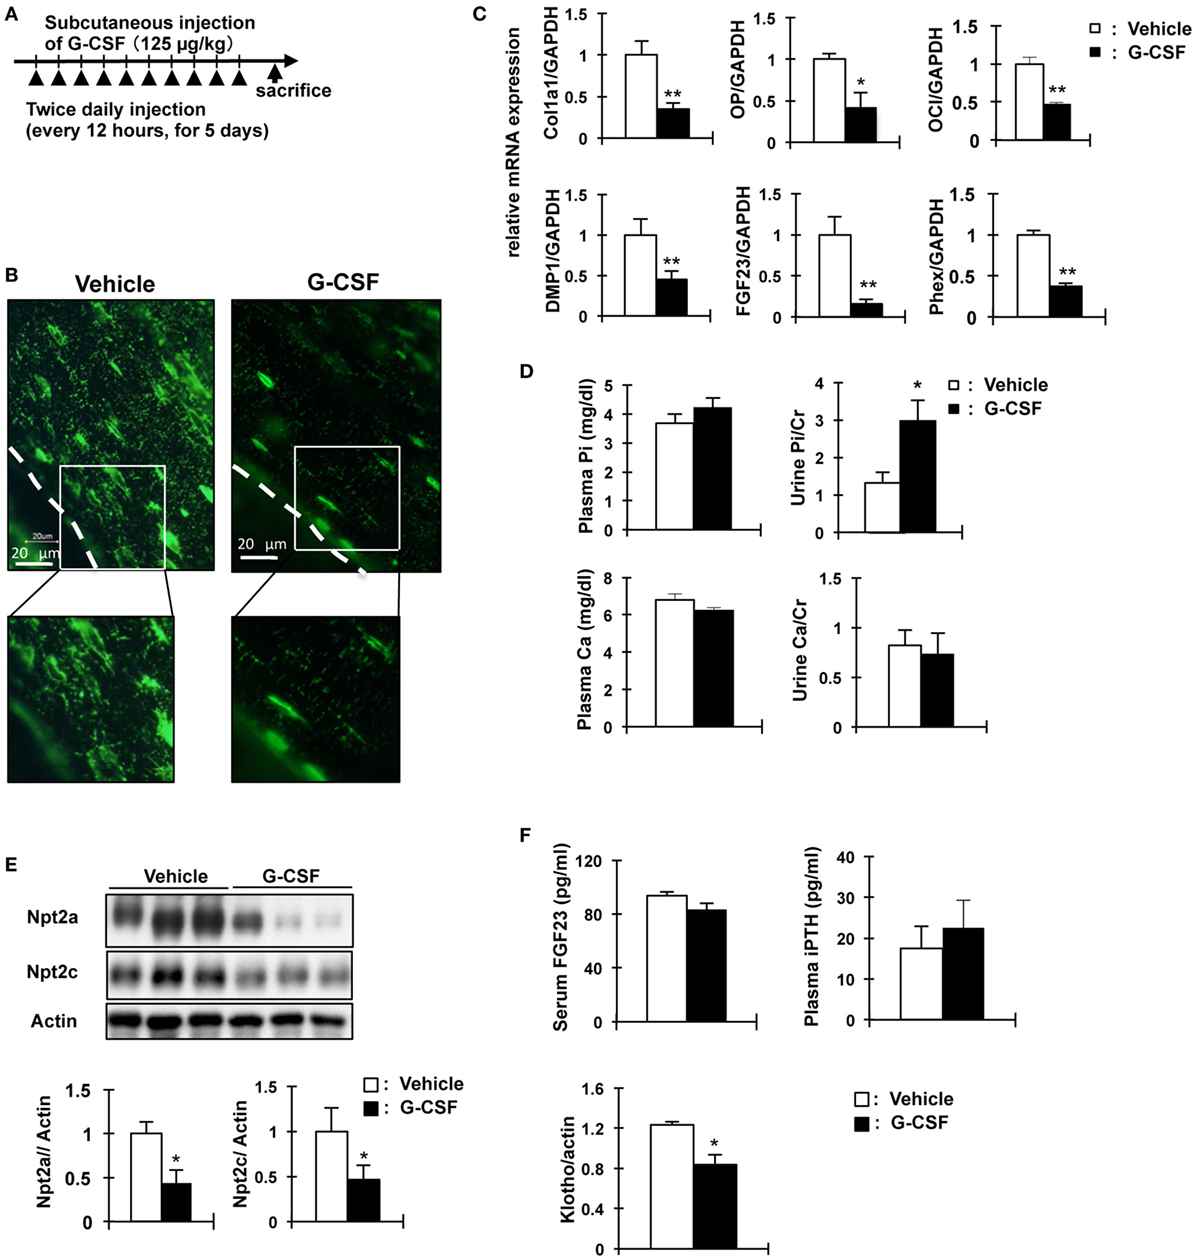
Figure 5. Analysis of granulocyte colony stimulating factor (G-CSF)- injected mice in phosphate metabolism. (A) Experimental design for osteocytic canaliculi network disruption by G-CSF (filgrastim 125 mg/kg/dose, s.c.). (B) Immunofluorescence staining of dentin matrix acidic phosphoprotrein-1 (DMP1) in osteocytes and lacuna-canaliculi network of the femur of vehicle and G-CSF injected mice. Green: DMP1. The scale bars indicate 20 µm. Magnification 400×. (C) Real-time polymerase chain reaction (PCR) analysis of markers of osteoblast and osteocytes. RNA was extracted from the femurs of 8-week-old WT mice injected with phosphate-buffered saline (white bars) or G-CSF (black bars) for 6days. Gene expression levels were normalized to glyceraldehyde 3-phosphate dehydrogenase (GAPDH) mRNA expression levels. Collagen type I alpha (Col1a1), osteopontin (OP) osteocalcin (OC), FGF23, DMP1, and Phex. Data are presented as mean ± SEM. **P < 0.01 **P < 0.05 (n = 6/group). (D) Biochemical analysis of plasma Inorganic phosphate (Pi), plasma calcium, urinary Pi/Cr, and urinary Ca/Cr levels in G-CSF or vehicle-injected mice. Urine was collected for 24 h from days 5 to 6. (E) Immunoblotting analysis of Npt2a and Npt2c proteins in renal brush-border membrane vesicles of G-CSF-treated mice and vehicle-injected mice. All membranes were reprobed for actin. Actin was used as an internal control. The bar graphs are presented as arithmetic means ± SEM (n = 6 each group). (F) Serum FGF23 and plasma iPTH and renal Klotho levels in G-CSF treated mice and vehicle-injected mice. **P < 0.01; *P < 0.05 (n = 6 mice/group). Renal Klotho protein levels were observed by immunoblotting analysis in renal total lysates. All membranes were reprobed for actin. Actin was used as an internal control. The bar graphs are presented as arithmetic means ± SEM (n = 6/group). Two-tail unpaired t-test **P < 0.01, *P < 0.05 vs control (vehicle injection).
Feeding on a High Pi Diet Does Not Stimulate Renal Pi Excretion in OCL and G-CSF Mice
The increased renal Pi excretion in OCL and G-CSF mice may be due to the increase in Pi released from the bone and intestinal Pi absorption. Therefore, we investigated whether feeding mice a high Pi diet increases urinary Pi excretion. Figures 6A,G show the schedule for dietary phosphate loading in OCL and G-CSF mice. After feeding on a high Pi diet, Pi excretion was significantly increased in the Cont mice (P < 0.01), but not changed in the OCL and G-CSF mice (Figures 6B,H). After feeding on a high Pi diet, plasma Pi and calcium levels were not changed in the OCL mice (Figure 6C).
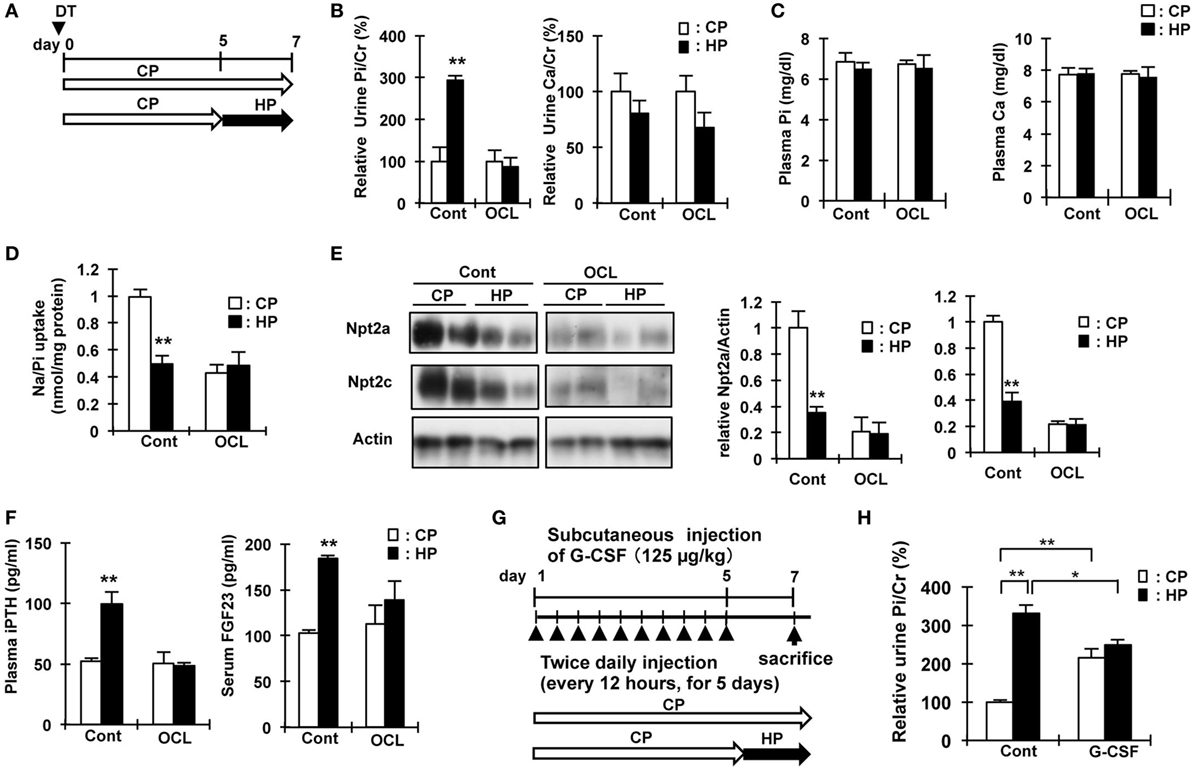
Figure 6. High phosphate diet response in osteocyte-less (OCL) and granulocyte colony stimulating factor (G-CSF) mice. (A) Experimental design of high-Pi (HP) dietary loading in OCL mice. Ten-week-old male transgenic (Tg) mice and wild-type (WT) mice were intraperitoneally injected with 50 µg/kg body weight DT in 0.9% NaCl. Control (Cont): WT + DT, OCL: Tg + DT. Control and OCL mice were fed the control inorganic phosphate (Pi) diet until day 5 and from days 5 to 7 were fed either the high Pi diet (HP) or control diet (CP). (B) Relative urine Pi/Cr (%) and Ca/Cr (24 h urine collection) at 6–7 days after diphtheria toxin (DT) injection. (C) Plasma Pi and calcium at 7 d after DT injection. (D) Renal Na/Pi transport activity in mice. Na/Pi transport activity was determined by 32P uptake in kidney brush border membrane vesicles (BBMVs) (n = 6/group). (E) Immunoblotting analysis of Npt2a and Npt2c proteins in renal BBMVs. All membranes were reprobed for actin. Actin was used as an internal control. (F) Plasma intact PTH and serum FGF23 at 7 days after DT injection. The bar graphs are presented as arithmetic means ± SEM (n = 6/group). Two-tail unpaired t-test **P < 0.01, *P < 0.05. (CP VS HP). (G) Experimental design of HP dietary loading in G-CSF mice. Seven-week-old male mice were injected with PBS or G-CSF (filgrastim 125 mg/kg/dose, s.c.). Control (Cont): WT + PBS, G-CSF: WT + G-CSF. Control and OCL mice were fed the control Pi diet until day 5 and fed either the high Pi diet (HP) or control diet (CP) from days 5 to 7. (H) Relative urine Pi/Cr (%) (24 h urine collection) at 6–7 days. The bar graphs are presented as arithmetic means ± SEM (n = 6/group). ANOVA followed by Tukey’s post-test for multiple comparisons. **P < 0.01, *P < 0.05 (CP vs HP, Cont vs G-CSF).
In Cont mice, feeding on a high Pi diet significantly reduced renal Npt2a and Npt2c protein levels (P < 0.01) and Na/Pi uptake in BBMs (P < 0.01), whereas no changes were observed in OCL mice (Figures 6D,E). In the mice fed a high Pi diet, the levels of plasma intact PTH were not changed in OCL mice, but significantly increased in Cont mice (1.9-fold, P < 0.01) (Figure 6F). The increase in plasma PTH levels and serum FGF23 levels induced by a high Pi diet in Cont mice was not observed in OCL mice. Therefore, for dietary Pi adaptation, signaling between the intestine and parathyroid gland, and between the intestine and kidney may be disturbed in OCL mice.
Analysis of Gene Expression Profiles in OCL Mice
We performed DNA microarray analysis of the intestine, liver, and kidney in OCL mice (data not shown). In these analyses, we focused on bile acid metabolism, a commonly changing metabolic system, in OCL mice and G-CSF-administered mice, because we did not detect prominent differences in the expression of genes related to glucose, amino acid, other nutrient metabolic pathways. Bile acid metabolism was markedly disturbed in the intestine and liver in OCL mice compared with Cont mice (Figure S1 in Supplementary Material). In a previous study, Sato et al. reported that osteocytes regulate fat metabolism, that OCL mice lack visible white adipose tissue, and plasma leptin levels decrease in association with fat loss (45). Bile acids serve as ligands for the nuclear receptor farnesoid X receptor (FXR) (46, 47). Bile acids act on FXR in ileal enterocytes to induce the expression of FGF15 (47, 48). FGF15 also stimulates gallbladder filling (47, 48). FGF15 inhibits bile acid synthesis by repressing the transcription of Cyp7al, which encodes the first and rate-limiting enzyme in the classic bile acid synthesis pathway (43). FGF15 acts through a cell surface receptor complex composed of the FGF receptor 4 and β-Klotho (49, 50). In liver, transcription of the small heterodimer partner (SHP) gene is induced by bile acids via FXR, and SHP, in turn, binds to the CYP7A1 promoter to repress gene transcription (47). SHP is required for FGF15 to efficiently repress bile acid synthesis (48). In OCL mice compared with Cont mice, transcripts of FXR (liver: P < 0.05, distal intestine: P < 0.01), Cyp7A1 (P < 0.05), FGF receptor 4 (FGFR4) (P < 0.05), β-Klotho (P < 0.01), SHP (distal intestine; P < 0.01), and FGF15 (P < 0.01), the concentrations of serum bile acid (P < 0.05), and feces bile acids (P < 0.05) intestinal bile acids (P < 0005) were significantly increased in the liver and/or distal intestine compared with Cont mice (Figures S1B–D in Supplementary Material). Intestinal vitamin D receptor, calcium-sensing receptor, and parathyroid hormone 1 receptor mRNA levels were not changed in OCL mice (data not shown).
Analysis of Gene Expression Profiles in High Pi Diet-Fed Mice
Next we investigated whether OCL mice are in a high Pi state. Lipid accumulation in white adipocytes was decreased in OCL and high Pi diet-fed mice (Figures S1A and S2A in Supplementary Material). We observed alterations in the genes involved in bile acid metabolism (P < 0.01) (Figure S1 in Supplementary Material). Quantitative PCR analysis revealed that, compared with Control Pi-fed mice (CP mice), high Pi-fed mice (HP mice) had significantly lower transcript levels of Cyp7A1 (P < 0.01), Cyp8b1 (P < 0.01), FGFR4 (P < 0.05), and β-Klotho (P < 0.05) in the liver. FXR (P < 0.01), OST-α (P < 0.05), and FGF15 (P < 0.01) levels in the distal intestine were also significantly decreased in HP mice (Figures S2B,C in Supplementary Material). On the other hand, the concentrations of serum bile acid and feces bile acids were not changed in the liver or distal intestine in HP mice compared with CP mice (Figure S2D in Supplementary Material). The serum triglyceride and cholesterol concentrations were lower in HP mice than in CP mice (Figure S2D in Supplementary Material).
Discussion
In the present study, we investigated the role of osteocytes in Pi metabolism using OCL mice. In this experiment, osteocyte ablation revealed that renal Pi excretion was enhanced before the plasma PTH and FGF23 levels increased. In particular, renal Klotho protein levels declined already in the early stage. In OCL mice, Pi excretion in the feces was markedly reduced and intestinal Pi absorption (Npt2b levels and Pi uptake in BBMV) was significantly enhanced. The present study indicates that the increased renal Pi excretion is due to increased intestinal Pi absorption in OCL mice (Figure 7). Similar findings regarding Pi metabolism were obtained in canalicular network-disrupted mice. Furthermore, the response to dietary Pi loading was suppressed in OCL mice.
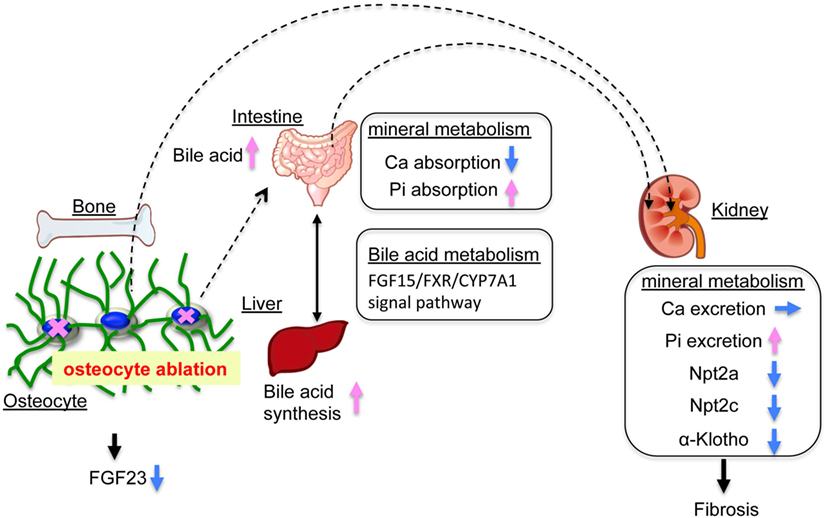
Figure 7. Mineral balance in osteocyte-less (OCL) mice. Osteocyte ablation affects mineral metabolism in the kidney and intestinal tract. The OCL mice showed increased renal inorganic phosphate (Pi) excretion (suppression of Npt2a and Npt2c) by enhanced intestinal Pi absorption (elevation of Npt2b). The OCL mice exhibited markedly suppressed renal Klotho expression, possibly reflecting a disrupted FGF23–Klotho system. OCL causes abnormalities in the bile acid (FGF15/FXR/CYP7A1) signaling pathway in the intestine–liver axis and stimulates intestinal Pi absorption. Thus, osteocytes may be an important regulator of mineral balance in addition to bile acid metabolism.
With regard to the mechanisms underlying the suppression of renal Pi transport, we observed that renal Npt2a and Npt2c protein levels were significantly decreased in the OCL mice. The transcription factor Egr-1 is downstream of ERK1/2 and is a biomarker of ERK1/2 signaling activation by FGF23 (7). Renal Egr-1 mRNA levels were significantly increased, while Klotho protein levels were markedly decreased (7). Renal 1alpha-hydroxylase (1α(OH)ase) mRNA was upregulated in the OCL mice, suggesting that klotho downregulation is involved in the stimulation of 1,25(OH)2D synthesis.
Recent studies demonstrated that FGFR1c/Klotho is the primary receptor complex responsible for mediating Pi metabolism (51), whereas there is a redundant requirement for FGFR3/Klotho and FGFR4/Klotho in the control of 1,25 (OH)2D levels (52, 53). Thus, the two pathways are expected to be involved in vitamin D and Pi transport by the FGF23–Klotho system (6, 54). Portale et al. reported that suppression of renal 1,25(OH)2D synthesis was intact in egr-1−/− mice treated with FGF23 (55). They found that downstream of FGFR binding and ERK1/2 signaling, the pathways diverge such that egr-1 is required for FGF23-dependent inhibition of Pi transport but not for inhibition of 1,25(OH)2D synthesis (55, 56). The mechanisms underlying the promotion of renal Pi excretion in OCL mice remain unknown, but the increase in egr-1 mRNA suggests the involvement of FGF23-dependent Pi inhibition. We are currently studying the molecular mechanism of the enhancement of Pi excretion in OCL mice.
Osteocyte-less (OCL) mice are thought to have abnormally high Pi absorption from the small intestine. If this hypothesis is correct, OCL mice would be in a state of high Pi and, thus, it is expected that the response of renal Pi excretion to a high Pi diet would be attenuated (43). Osteocytes extend dendrites to each other in the osteocytic canaliculi, and osteoblasts and osteoclasts connect with each other on the bone surface by gap junctions, referred to as the osteocytic canalicular network (24, 57–61). The network is complicated and extends through the entire bone, possibly forming gap junctional intercellular communication pathways (24, 57–61). Osteocyte canalicular networks are thought to be important for bone formation as the structure seems to be ideal for sensing mechanical stress and mechanotransduction (24, 57–61). A recent study demonstrated that osteocytic canalicular network-disrupted mice are created by injection of G-CSF (37). Disruption of the osteocyte canalicular network by G-CSF increased Pi excretion and decreased renal klotho levels independent of PTH and FGF23. In addition, in G-CSF-treated mice or OCL mice, renal Pi excretion did not increase in response to a high Pi diet. These observations suggest that OCL mice already had a high Pi state, and excessive Pi from intestinal absorption may promote renal Pi excretion.
In the present study, OCL mice exhibited abnormal intestinal Pi and calcium absorption. Previous studies demonstrated that the kidney rapidly increases Pi excretion when intestinal Pi absorption is markedly elevated (62, 63). In these conditions, the increase in the plasma PTH or FGF23 levels leads to increased renal Pi excretion in response to an increase in intestinal Pi absorption (62, 63). In OCL mice, however, we observed no increase in PTH or FGF 23. Therefore, the phosphaturic factors acting on the kidney are unknown. In OCL mice, 1,25(OH)2D may be a factor that enhances intestinal Pi absorption. With respect to the FGF23–Klotho system, plasma 1,25(OH)2D levels are an important factor for intestinal mineral absorption (3). In the OCL mice, plasma 1,25(OH)2D levels were not changed while renal 1α(OH)ase mRNA was significantly increased. We investigated the mechanism of the reduction of calcium absorption and the elevation of Pi absorption. To clarify intestinal Pi absorption, we measured intestinal Pi transport activity in BBMV and found the elevation of Npt2b protein and Pi uptake in the OCL mice. In addition, the transfer of 45Ca into the blood was markedly reduced. The calcium concentration in the feces was significantly increased and the gene expression levels of claudin 2 and claudin 15, which are involved in calcium transport, were reduced. No change in the plasma 1,25(OH)2D concentration, however, was observed. In the OCL mice, we observed the suppression of a vitamin D-responsive gene (claudin 2) involved in calcium absorption, but no decrease in TRPV6 or calbindin D9K mRNA (64). Based on these findings, we suspect that a system other than vitamin D metabolism is involved in the abnormal intestinal mineral absorption in OCL mice. Although the reasons for the abnormal intestinal mineral absorption remain unknown, osteocytes are considered to be extremely important for intestinal Pi and calcium absorption.
To elucidate the mechanism for abnormal mineral absorption in the OCL mice, we performed DNA microarray analyses of the intestine and liver. We observed alterations in the genes involved in fat and bile acid metabolism (Figures S1 and S2 in Supplementary Material). Metabolic analysis of the OCL mice and G-CSF-treated mice suggested a functional abnormality of the FGF15–FXR–CYP7A1 system in bile acid metabolism (43). Indeed, we observed increased serum bile acid and feces bile acid levels in the OCL mice. A recent study demonstrated that feeding of a lithocholic acid-rich diet increased intestinal Pi absorption and suppressed renal Pi absorption in WT mice (American Society of Nephrology, Kidney Week 2017 Abstract FR-PO258, Hashimoto N, Sakaguchi Y, Hamano T, Isaka Y, Matsui I, Mori D, Matsumoto A, Shimada K, Yamaguchi S, Kubota K, Oka T, Yonemoto S). Lithocholic acid is a known VDR ligand (65). The details of these mechanisms are unknown. However, bile acid metabolism is considered to be a regulator of important for intestinal and renal Pi absorption (66). Bile acids are natural detergents that may solubilize calcium-phosphate particles in the small intestine (67). Bile acids are also important signaling molecules and have a role in energy metabolism, metabolic syndrome, obesity, and diabetes (68). Because Pi is deeply involved in energy metabolism, it is expected to be involved in the regulation of energy metabolism by bile acids.
We investigated whether the enhanced intestinal Pi absorption is linked to changes in FGF15/CYP7A1/bile acid in the OCL mice. Dietary Pi load is a powerful factor to suppress intestinal Npt2b protein levels (42). We investigated the possibility that the FGF15/CYP7A1 system responds to the dietary Pi load. Based on quantitative PCR analysis, the increased gene expression levels in the FGF15–FXR–CYP7A1 system observed in OCL mice were largely suppressed in control mice fed a HP diet. These findings suggest that dietary Pi levels affect the FGF15–FXR–CYP7A1 system in the intestines and liver, in addition to vitamin D metabolism.
Previous studies showed that vitamin D exerts a negative feedback on bile acid synthesis by decreasing Cyp7a1 expression (69, 70). FGF15 and SHP play central roles in the feedback regulation of bile acid synthesis by bile acids and FXR (46–48). FGF15 is integral to the mechanism of CYP7A1 regulation of vitamin D (69, 71). VDR regulates FGF15 in the intestine and this pathway is essential for the vitamin D-induced suppression of bile acid synthesis (72). In the liver, the FGF15/FGFR4/β-klotho complex suppresses SHP expression and increases Cyp7A1 (47, 49, 50). The molecular mechanisms of the vitamin D and bile acid abnormalities in OCL mice are not clear. We speculate that OCL mice have disturbed vitamin D and bile acid (FGF15/FXR/CYP7A1) metabolism due to disruptions of the FGF23–Klotho system (Figure 7).
In conclusion, the findings of the present study suggest that osteocyte ablation stimulates intestinal Pi absorption and enhances renal Pi excretion. The phosphaturic factors active in OCL mice are unknown, but increased Pi absorption is prominent in OCL mice. The marked increase in intestinal Pi absorption may be due to disruption of the FGF23–Klotho system by osteocyte ablation affecting bile acids and vitamin D metabolism. Further studies are needed to clarify the factors involved in the increased renal Pi excretion in OCL mice.
Author Contributions
ST and K-iM contributed to the study design. OF, MO, TA, HS, KN, AM, KI, AH, IK, HS, ST, and K-iM collected and analyzed data. ST and K-iM wrote and revised the final draft of the manuscript.
Conflict of Interest Statement
The authors declare that the research was conducted in the absence of any commercial or financial relationships that could be construed as a potential conflict of interest.
Acknowledgments
We thank Dr. Yoshio Ogura who advised us regarding the bile acid metabolism research. We thank Dr. Kyoji Ikeda, who supervised the studies for DMP1-DTR Tg mice. T.K., M.F., S.Y., R.S., M.I., and R.F. provided support with animal maintenance and tissue sample preparation for RT-PCR analysis. This study was supported by a Grant-in Aid for Scientific Research on Innovative Areas (23136511, 25136715) and by Grants 23591218, 26461253 (ST), 26293204 (K-iM) from the Ministry of Education, Culture, Sports, Science, and Technology of Japan; and by Grants (#1032, ST) and (#1322, K-iM and ST) from The Salt Science Research Foundation and Grants JKFB09-5 and JKFB12-44 (ST) for pathophysiologic research in chronic kidney disease. This study was technical support by Advance Radiation Research, Education and Management Center and Support Center for Advanced Medical Sciences and Animal Research and Genetic Engineering Institute of Biomedical Sciences, Tokushima University Graduate School.
Supplementary Material
The Supplementary Material for this article can be found online at http://www.frontiersin.org/articles/10.3389/fendo.2017.00359/full#supplementary-material.
References
1. Martin A, David V, Quarles LD. Regulation and function of the FGF23/klotho endocrine pathways. Physiol Rev (2012) 92(1):131–55. doi:10.1152/physrev.00002.2011
2. Kaneko I, Tatsumi S, Segawa H, Miyamoto KI. Control of phosphate balance by the kidney and intestine. Clin Exp Nephrol (2017) 21(Suppl 1):21–6. doi:10.1007/s10157-016-1359-4
3. Erben RG, Andrukhova O. FGF23-Klotho signaling axis in the kidney. Bone (2017) 100:62–8. doi:10.1016/j.bone.2016.09.010
4. Shimada T, Mizutani S, Muto T, Yoneya T, Hino R, Takeda S, et al. Cloning and characterization of FGF23 as a causative factor of tumor-induced osteomalacia. Proc Natl Acad Sci U S A (2001) 98(11):6500–5. doi:10.1073/pnas.101545198
5. Saito H, Kusano K, Kinosaki M, Ito H, Hirata M, Segawa H, et al. Human fibroblast growth factor-23 mutants suppress Na+-dependent phosphate co-transport activity and 1alpha,25-dihydroxyvitamin D3 production. J Biol Chem (2003) 278(4):2206–11. doi:10.1074/jbc.M207872200
6. Shimada T, Kakitani M, Yamazaki Y, Hasegawa H, Takeuchi Y, Fujita T, et al. Targeted ablation of Fgf23 demonstrates an essential physiological role of FGF23 in phosphate and vitamin D metabolism. J Clin Invest (2004) 113(4):561–8. doi:10.1172/JCI19081
7. Kurosu H, Ogawa Y, Miyoshi M, Yamamoto M, Nandi A, Rosenblatt KP, et al. Regulation of fibroblast growth factor-23 signaling by klotho. J Biol Chem (2006) 281(10):6120–3. doi:10.1074/jbc.C500457200
8. Urakawa I, Yamazaki Y, Shimada T, Iijima K, Hasegawa H, Okawa K, et al. Klotho converts canonical FGF receptor into a specific receptor for FGF23. Nature (2006) 444(7120):770–4. doi:10.1038/nature05315
9. Ben-Dov IZ, Galitzer H, Lavi-Moshayoff V, Goetz R, Kuro-o M, Mohammadi M, et al. The parathyroid is a target organ for FGF23 in rats. J Clin Invest (2007) 117(12):4003–8. doi:10.1172/JCI32409
10. Brownstein CA, Adler F, Nelson-Williams C, Iijima J, Li P, Imura A, et al. A translocation causing increased alpha-klotho level results in hypophosphatemic rickets and hyperparathyroidism. Proc Natl Acad Sci U S A (2008) 105(9):3455–60. doi:10.1073/pnas.0712361105
11. Nabeshima Y, Imura H. alpha-Klotho: a regulator that integrates calcium homeostasis. Am J Nephrol (2008) 28(3):455–64. doi:10.1159/000112824
12. Miyamoto K, Haito-Sugino S, Kuwahara S, Ohi A, Nomura K, Ito M, et al. Sodium-dependent phosphate cotransporters: lessons from gene knockout and mutation studies. J Pharm Sci (2011) 100(9):3719–30. doi:10.1002/jps.22614
13. Lederer E, Miyamoto K. Clinical consequences of mutations in sodium phosphate cotransporters. Clin J Am Soc Nephrol (2012) 7(7):1179–87. doi:10.2215/CJN.09090911
14. Murer H, Hernando N, Forster I, Biber J. Proximal tubular phosphate reabsorption: molecular mechanisms. Physiol Rev (2000) 80(4):1373–409. doi:10.1152/physrev.2000.80.4.1373
15. Biber J, Hernando N, Forster I. Phosphate transporters and their function. Annu Rev Physiol (2013) 75:535–50. doi:10.1146/annurev-physiol-030212-183748
16. Wagner CA, Hernando N, Forster IC, Biber J. The SLC34 family of sodium-dependent phosphate transporters. Pflugers Arch (2014) 466(1):139–53. doi:10.1007/s00424-013-1418-6
17. Shimada T, Hasegawa H, Yamazaki Y, Muto T, Hino R, Takeuchi Y, et al. FGF-23 is a potent regulator of vitamin D metabolism and phosphate homeostasis. J Bone Miner Res (2004) 19(3):429–35. doi:10.1359/JBMR.0301264
18. Tomoe Y, Segawa H, Shiozawa K, Kaneko I, Tominaga R, Hanabusa E, et al. Phosphaturic action of fibroblast growth factor 23 in Npt2 null mice. Am J Physiol Renal Physiol (2010) 298(6):F1341–50. doi:10.1152/ajprenal.00375.2009
19. Miyamoto K, Ito M, Kuwahata M, Kato S, Segawa H. Inhibition of intestinal sodium-dependent inorganic phosphate transport by fibroblast growth factor 23. Ther Apher Dial (2005) 9(4):331–5. doi:10.1111/j.1744-9987.2005.00292.x
20. Wesseling-Perry K, Juppner H. The osteocyte in CKD: new concepts regarding the role of FGF23 in mineral metabolism and systemic complications. Bone (2013) 54(2):222–9. doi:10.1016/j.bone.2012.10.008
21. Wolf M. Forging forward with 10 burning questions on FGF23 in kidney disease. J Am Soc Nephrol (2010) 21(9):1427–35. doi:10.1681/ASN.2009121293
22. Kovesdy CP, Quarles LD. FGF23 from bench to bedside. Am J Physiol Renal Physiol (2016) 310(11):F1168–74. doi:10.1152/ajprenal.00606.2015
23. Olauson H, Larsson TE. FGF23 and Klotho in chronic kidney disease. Curr Opin Nephrol Hypertens (2013) 22(4):397–404. doi:10.1097/MNH.0b013e32836213ee
25. Wysolmerski JJ. Osteocytic osteolysis: time for a second look? Bonekey Rep (2012) 1:229. doi:10.1038/bonekey.2012.229
26. Kennedy OD, Schaffler MB. The roles of osteocyte signaling in bone. J Am Acad Orthop Surg (2012) 20(10):670–1. doi:10.5435/JAAOS-20-10-670
27. Moyses RM, Schiavi SC. Sclerostin, osteocytes, and chronic kidney disease – mineral bone disorder. Semin Dial (2015) 28(6):578–86. doi:10.1111/sdi.12415
28. Sapir-Koren R, Livshits G. Osteocyte control of bone remodeling: is sclerostin a key molecular coordinator of the balanced bone resorption-formation cycles? Osteoporos Int (2014) 25(12):2685–700. doi:10.1007/s00198-014-2808-0
29. Kuro OM, Moe OW. FGF23-alphaKlotho as a paradigm for a kidney-bone network. Bone (2017) 100:4–18. doi:10.1016/j.bone.2016.11.013
30. Quarles LD. Evidence for a bone-kidney axis regulating phosphate homeostasis. J Clin Invest (2003) 112(5):642–6. doi:10.1172/JCI19687
31. Quarles LD. Endocrine functions of bone in mineral metabolism regulation. J Clin Invest (2008) 118(12):3820–8. doi:10.1172/JCI36479
32. Tatsumi S, Ishii K, Amizuka N, Li M, Kobayashi T, Kohno K, et al. Targeted ablation of osteocytes induces osteoporosis with defective mechanotransduction. Cell Metab (2007) 5(6):464–75. doi:10.1016/j.cmet.2007.05.001
33. Saito M, Iwawaki T, Taya C, Yonekawa H, Noda M, Inui Y, et al. Diphtheria toxin receptor-mediated conditional and targeted cell ablation in transgenic mice. Nat Biotechnol (2001) 19(8):746–50. doi:10.1038/90795
34. Katai K, Segawa H, Haga H, Morita K, Arai H, Tatsumi S, et al. Acute regulation by dietary phosphate of the sodium-dependent phosphate transporter (NaP(i)-2) in rat kidney. J Biochem (1997) 121(1):50–5. doi:10.1093/oxfordjournals.jbchem.a021569
35. Tatsumi S, Segawa H, Morita K, Haga H, Kouda T, Yamamoto H, et al. Molecular cloning and hormonal regulation of PiT-1, a sodium-dependent phosphate cotransporter from rat parathyroid glands. Endocrinology (1998) 139(4):1692–9. doi:10.1210/endo.139.4.5925
36. Katayama Y, Battista M, Kao WM, Hidalgo A, Peired AJ, Thomas SA, et al. Signals from the sympathetic nervous system regulate hematopoietic stem cell egress from bone marrow. Cell (2006) 124(2):407–21. doi:10.1016/j.cell.2005.10.041
37. Asada N, Katayama Y, Sato M, Minagawa K, Wakahashi K, Kawano H, et al. Matrix-embedded osteocytes regulate mobilization of hematopoietic stem/progenitor cells. Cell Stem Cell (2013) 12(6):737–47. doi:10.1016/j.stem.2013.05.001
38. Van Cromphaut SJ, Dewerchin M, Hoenderop JG, Stockmans I, Van Herck E, Kato S, et al. Duodenal calcium absorption in vitamin D receptor-knockout mice: functional and molecular aspects. Proc Natl Acad Sci U S A (2001) 98(23):13324–9. doi:10.1073/pnas.231474698
39. Kaneko I, Segawa H, Furutani J, Kuwahara S, Aranami F, Hanabusa E, et al. Hypophosphatemia in vitamin D receptor null mice: effect of rescue diet on the developmental changes in renal Na+-dependent phosphate cotransporters. Pflugers Arch (2011) 461(1):77–90. doi:10.1007/s00424-010-0888-z
40. Inoue Y, Segawa H, Kaneko I, Yamanaka S, Kusano K, Kawakami E, et al. Role of the vitamin D receptor in FGF23 action on phosphate metabolism. Biochem J (2005) 390(Pt 1):325–31. doi:10.1042/BJ20041799
41. Segawa H, Kaneko I, Takahashi A, Kuwahata M, Ito M, Ohkido I, et al. Growth-related renal type II Na/Pi cotransporter. J Biol Chem (2002) 277(22):19665–72. doi:10.1074/jbc.M200943200
42. Ohi A, Hanabusa E, Ueda O, Segawa H, Horiba N, Kaneko I, et al. Inorganic phosphate homeostasis in sodium-dependent phosphate cotransporter Npt2b(+)/(-) mice. Am J Physiol Renal Physiol (2011) 301(5):F1105–13. doi:10.1152/ajprenal.00663.2010
43. Segawa H, Yamanaka S, Ohno Y, Onitsuka A, Shiozawa K, Aranami F, et al. Correlation between hyperphosphatemia and type II Na-Pi cotransporter activity in klotho mice. Am J Physiol Renal Physiol (2007) 292(2):F769–79. doi:10.1152/ajprenal.00248.2006
44. Chau H, El-Maadawy S, McKee MD, Tenenhouse HS. Renal calcification in mice homozygous for the disrupted type IIa Na/Pi cotransporter gene Npt2. J Bone Miner Res (2003) 18(4):644–57. doi:10.1359/jbmr.2003.18.4.644
45. Sato M, Asada N, Kawano Y, Wakahashi K, Minagawa K, Kawano H, et al. Osteocytes regulate primary lymphoid organs and fat metabolism. Cell Metab (2013) 18(5):749–58. doi:10.1016/j.cmet.2013.09.014
46. Chen Z, Chen D, McCarthy TL, Centrella M, Zhang Y, Moeckel GW. Inorganic phosphate stimulates fibronectin expression in renal fibroblasts. Cell Physiol Biochem (2012) 30(1):151–9. doi:10.1159/000339054
47. Lefebvre P, Cariou B, Lien F, Kuipers F, Staels B. Role of bile acids and bile acid receptors in metabolic regulation. Physiol Rev (2009) 89(1):147–91. doi:10.1152/physrev.00010.2008
48. Inagaki T, Choi M, Moschetta A, Peng L, Cummins CL, McDonald JG, et al. Fibroblast growth factor 15 functions as an enterohepatic signal to regulate bile acid homeostasis. Cell Metab (2005) 2(4):217–25. doi:10.1016/j.cmet.2005.09.001
49. Kurosu H, Choi M, Ogawa Y, Dickson AS, Goetz R, Eliseenkova AV, et al. Tissue-specific expression of betaKlotho and fibroblast growth factor (FGF) receptor isoforms determines metabolic activity of FGF19 and FGF21. J Biol Chem (2007) 282(37):26687–95. doi:10.1074/jbc.M704165200
50. Kuro-o M. Endocrine FGFs and Klothos: emerging concepts. Trends Endocrinol Metab (2008) 19(7):239–45. doi:10.1016/j.tem.2008.06.002
51. Gattineni J, Bates C, Twombley K, Dwarakanath V, Robinson ML, Goetz R, et al. FGF23 decreases renal NaPi-2a and NaPi-2c expression and induces hypophosphatemia in vivo predominantly via FGF receptor 1. Am J Physiol Renal Physiol (2009) 297(2):F282–91. doi:10.1152/ajprenal.90742.2008
52. Gattineni J, Twombley K, Goetz R, Mohammadi M, Baum M. Regulation of serum 1,25(OH)2 vitamin D3 levels by fibroblast growth factor 23 is mediated by FGF receptors 3 and 4. Am J Physiol Renal Physiol (2011) 301(2):F371–7. doi:10.1152/ajprenal.00740.2010
53. Li H, Martin A, David V, Quarles LD. Compound deletion of Fgfr3 and Fgfr4 partially rescues the Hyp mouse phenotype. Am J Physiol Endocrinol Metab (2011) 300(3):E508–17. doi:10.1152/ajpendo.00499.2010
54. Berndt T, Thomas LF, Craig TA, Sommer S, Li X, Bergstralh EJ, et al. Evidence for a signaling axis by which intestinal phosphate rapidly modulates renal phosphate reabsorption. Proc Natl Acad Sci U S A (2007) 104(26):11085–90. doi:10.1073/pnas.0704446104
55. Portale AA, Zhang MY, David V, Martin A, Jiao Y, Gu W, et al. Characterization of FGF23-dependent Egr-1 cistrome in the mouse renal proximal tubule. PLoS One (2015) 10(11):e0142924. doi:10.1371/journal.pone.0142924
56. Zhang MY, Ranch D, Pereira RC, Armbrecht HJ, Portale AA, Perwad F. Chronic inhibition of ERK1/2 signaling improves disordered bone and mineral metabolism in hypophosphatemic (Hyp) mice. Endocrinology (2012) 153(4):1806–16. doi:10.1210/en.2011-1831
57. Yellowley CE, Li Z, Zhou Z, Jacobs CR, Donahue HJ. Functional gap junctions between osteocytic and osteoblastic cells. J Bone Miner Res (2000) 15(2):209–17. doi:10.1359/jbmr.2000.15.2.209
58. Lanyon LE. Osteocytes, strain detection, bone modeling and remodeling. Calcif Tissue Int (1993) 53(Suppl 1):S102–6. doi:10.1007/BF01673415
59. Lu XL, Huo B, Park M, Guo XE. Calcium response in osteocytic networks under steady and oscillatory fluid flow. Bone (2012) 51(3):466–73. doi:10.1016/j.bone.2012.05.021
60. Buenzli PR, Sims NA. Quantifying the osteocyte network in the human skeleton. Bone (2015) 75:144–50. doi:10.1016/j.bone.2015.02.016
61. Knothe Tate ML, Adamson JR, Tami AE, Bauer TW. The osteocyte. Int J Biochem Cell Biol (2004) 36(1):1–8. doi:10.1016/S1357-2725(03)00241-3
62. Brown AJ, Ritter CS. The vitamin D analog 1alpha,25-dihydroxy-2beta-(3-hydroxypropyloxy) vitamin D(3) (Eldecalcitol) is a potent regulator of calcium and phosphate metabolism. Calcif Tissue Int (2011) 89(5):372–8. doi:10.1007/s00223-011-9528-7
63. Tatsumi S, Miyagawa A, Kaneko I, Shiozaki Y, Segawa H, Miyamoto K. Regulation of renal phosphate handling: inter-organ communication in health and disease. J Bone Miner Metab (2016) 34(1):1–10. doi:10.1007/s00774-015-0705-z
64. Haussler MR, Whitfield GK, Kaneko I, Haussler CA, Hsieh D, Hsieh JC, et al. Molecular mechanisms of vitamin D action. Calcif Tissue Int (2013) 92(2):77–98. doi:10.1007/s00223-012-9619-0
65. Nehring JA, Zierold C, DeLuca HF. Lithocholic acid can carry out in vivo functions of vitamin D. Proc Natl Acad Sci U S A (2007) 104(24):10006–9. doi:10.1073/pnas.0703512104
66. Lee DB, Hardwick LL, Hu MS, Jamgotchian N. Vitamin D-independent regulation of calcium and phosphate absorption. Miner Electrolyte Metab (1990) 16(2–3):167–73.
67. Hofmann AF, Mysels KJ. Bile acid solubility and precipitation in vitro and in vivo: the role of conjugation, pH, and Ca2+ ions. J Lipid Res (1992) 33(5):617–26.
68. Jiang C, Xie C, Lv Y, Li J, Krausz KW, Shi J, et al. Intestine-selective farnesoid X receptor inhibition improves obesity-related metabolic dysfunction. Nat Commun (2015) 6:10166. doi:10.1038/ncomms10166
69. Schmidt DR, Holmstrom SR, Fon Tacer K, Bookout AL, Kliewer SA, Mangelsdorf DJ. Regulation of bile acid synthesis by fat-soluble vitamins A and D. J Biol Chem (2010) 285(19):14486–94. doi:10.1074/jbc.M110.116004
70. Zhou H, Hylemon PB. Bile acids are nutrient signaling hormones. Steroids (2014) 86:62–8. doi:10.1016/j.steroids.2014.04.016
71. Chow EC, Magomedova L, Quach HP, Patel R, Durk MR, Fan J, et al. Vitamin D receptor activation down-regulates the small heterodimer partner and increases CYP7A1 to lower cholesterol. Gastroenterology (2014) 146(4):1048–59. doi:10.1053/j.gastro.2013.12.027
Keywords: osteocyte, phosphate, fibroblast growth factor 23, Klotho, intestine, kidney, liver, bile acid
Citation: Fujii O, Tatsumi S, Ogata M, Arakaki T, Sakaguchi H, Nomura K, Miyagawa A, Ikuta K, Hanazaki A, Kaneko I, Segawa H and Miyamoto K-i (2017) Effect of Osteocyte-Ablation on Inorganic Phosphate Metabolism: Analysis of Bone–Kidney–Gut Axis. Front. Endocrinol. 8:359. doi: 10.3389/fendo.2017.00359
Received: 12 September 2017; Accepted: 11 December 2017;
Published: 21 December 2017
Edited by:
Reinhold Gottfried Erben, Veterinärmedizinische Universität Wien, AustriaReviewed by:
Yan Viva Ma, Johnson & Johnson, United StatesHai-Bin Ruan, University of Minnesota, United States
Copyright: © 2017 Fujii, Tatsumi, Ogata, Arakaki, Sakaguchi, Nomura, Miyagawa, Ikuta, Hanazaki, Kaneko, Segawa and Miyamoto. This is an open-access article distributed under the terms of the Creative Commons Attribution License (CC BY). The use, distribution or reproduction in other forums is permitted, provided the original author(s) or licensor are credited and that the original publication in this journal is cited, in accordance with accepted academic practice. No use, distribution or reproduction is permitted which does not comply with these terms.
*Correspondence: Sawako Tatsumi, dGF0c3VtaUB0b2t1c2hpbWEtdS5hYy5qcA==;
Ken-ichi Miyamoto, a21peWFtb3RvQHRva3VzaGltYS11LmFjLmpw