 Sotonte Ebenibo
 Chimaroke Edeoga
 Ibiye Owei
 Sam Dagogo-Jack
- Division of Endocrinology, Diabetes and Metabolism, University of Tennessee Health Science Center, Memphis, TN, United States
Background: Fasting plasma leptin levels reflect fat mass, but dynamic leptin responses to secretagogues, and the influence of race/ethnicity, have not been well studied. Here, we compared basal and stimulated leptin levels in relation to cardiometabolic risk and weight trajectories in black and white subjects.
Subjects and methods: We studied 254 (127 black and 127 white) normoglycemic adults enrolled in the Pathobiology of Prediabetes in a Biracial Cohort (POP-ABC) study. At baseline and annually, POP-ABC participants underwent physical examination, oral glucose tolerance test, and measurements of body fat (dual energy X-ray absorptiometry), fasting plasma leptin, insulin, cortisol, lipids, and leptin secretory response to single-dose (2 mg) dexamethasone (dex). The interactions among basal and stimulated leptin and changes in adiposity/cardiometabolic measures during the ensuing year were then analyzed.
Results: The mean (±SD) fasting leptin level (50.6 ± 47.7 vs. 39.5 ± 37.6 ng/mL, P = 0.004) and body mass index (BMI) (31.9 ± 7.14 vs. 29.0 ± 7.66 kg/m2, P = 0.0043) were higher in black women vs. white women, but similar in black men vs. white men (leptin: 12.4 ± 2.07 vs. 11.1 ± 1.40 ng/mL; BMI: 29.4 ± 7.68 vs. 28.1 ± 4.23 kg/m2). The peak leptin response to dex (~200% baseline) did not differ significantly by gender or race. Total body fat correlated positively with fasting leptin (r = 0.81, P < 0.0001) and inversely stimulated leptin levels (r = −0.26, P < 0.0001). Fasting leptin was unrelated to 1-year change in weight or fat mass, whereas stimulated leptin levels were significantly associated with 1-year trajectories in weight (P = 0.0016) and total fat mass (P = 0.0035). Stimulated leptin levels also had significant interactions with insulin sensitivity (homeostasis model of insulin resistance, P = 0.01), triglycerides (P = 0.0078), fasting glucose (P = 0.027), systolic blood pressure (P = 0.037), and high-sensitivity C-reactive protein (P = 0.027).
Conclusion: We found no significant ethnic disparities in basal or dynamic leptin secretion in relation to adiposity. Fasting leptin levels were not associated with 1-year weight change, while stimulated levels showed weak though significant association with 1-year weight change.
Introduction
Leptin regulates body weight and influences metabolic processes in rodents (1–3) and human beings (4–8). The analysis of plasma leptin levels in relation to human metabolic pathophysiology has focused largely on specimens collected under basal (fasting) conditions (9–13). The findings from such studies indicate that fasting leptin levels are directly correlated with measures of adiposity (9–11) in lean and obese subjects as well as in persons with diabetes (14). We and others have reported that administration of glucocorticoids results in significant increases in plasma leptin levels (15–19). Others have reported that prolonged insulin infusion also increases plasma leptin levels (20). Thus, glucocorticoids and insulin can be deployed as leptin secretagogues to probe the metabolic physiology and pathophysiology of dynamic leptin secretion. Given the many drawbacks of insulin (the need for injection, risk of hypoglycemia, and obligate need to coadminister glucose), oral glucocorticoid is a more convenient secretagogue for studying dynamic leptin secretion. The previous reports had utilized different doses of methylprednisolone (15), dexamethasone (dex) (16, 17), or hydrocortisone (18, 19) to demonstrate glucocorticoid-induced leptin secretion. In this report, we investigated leptin responses to a single, 2-mg dose of dex in African-American (black) and European-American (white) men and women with a broad range of adiposity measures. Our data indicate that augmentation of plasma leptin levels in response to a single oral dose (2 mg) of dex is a highly conserved trait that may convey information regarding cardiometabolic risk status and weight trajectories.
Materials and Methods
Study Subjects
We studied 254 (127 black, 127 white) non-diabetic participants enrolled in the Pathobiology of Prediabetes in a Biracial Cohort (POP-ABC) study (21, 22). The POP-ABC participants had one or both biological parents with type 2 diabetes (T2D) and met the following additional inclusion criteria: age 18–65 years; non-Hispanic white or non-Hispanic black race/ethnicity status; no evidence of diabetes; normal fasting plasma glucose (FPG) [<100 mg/dL (5.6 mmol/L)] and normal glucose tolerance [2-hr plasma glucose (2hrPG) < 140 mg/dL (7.8 mmol/L) during a 75-g oral glucose tolerance test (OGTT)]; and good overall health, as previously described (21, 22). Persons using antidiabetes medications or other medications known to alter glucose metabolism or body weight were ineligible for enrollment. Also excluded were persons enrolled in active weight loss programs, using behavioral, pharmacological, surgical, or combined modalities (21, 22).
At baseline and annually, POP-ABC participants underwent physical examination, OGTT, and measurements of body fat (dual energy X-ray absorptiometry), blood lipids and other analytes, and leptin secretion. The POP-ABC study protocol was approved by the University of Tennessee Health Science Center Institution Review Board. All subjects gave written informed consent before the initiation of the study, which was conducted in accordance with the principles of the Declaration of Helsinki.
Leptin Secretion Test
Basal and stimulated leptin secretion was assessed as previously described (14), with dex dose reduction from 4 to 2 mg. In brief, on day 1 of the test, participants arrived at the General Clinical Research Center (GCRC) in the fasting state for baseline blood sampling at 0800 h and were given a single 2-mg tablet of dex. Between 11:00 p.m. and midnight on day 1, participants ingested the 2-mg dose of dex and returned to the GCRC on day 2 for fasting blood sampling at 8:00 a.m. (8-h sample). After that, participants had their usual breakfast and lunch and returned for final blood sampling at 4:00 p.m. on day 2 (16-h sample). Study subjects were given written instructions to maintain their usual dietary and physical activity habits and avoid strenuous exercise for at least 3 days before the test.
Biochemical Measurements
Plasma glucose was measured with a glucose oxidase method (Yellow Spring Instruments Co., Inc., Yellow Spring, OH, USA). Plasma insulin, cortisol, and high-sensitivity C-reactive protein (hsCRP) levels were measured immunochemically using commercial kits. Plasma leptin was measured by ELISA kit (Millipore, St. Charles, MO, USA). The leptin assay captured total circulating human leptin, with a sensitivity of 0.5 ng/mL and within-batch and between-batch coefficients of variation of <5%, respectively. Fasting plasma lipid profiles were measured in a contract clinical laboratory. The homeostasis model of insulin resistance (HOMA-IR) and homeostasis model of beta-cell function (HOMA-B) were derived from fasting glucose and insulin values (23).
Statistical Analysis
Data are reported as means ± SD unless SEM is specified. Significance level was set as P < 0.05. Differences between groups were analyzed using unpaired t-tests and analysis of variance (ANOVA) for continuous variables and chi-squared test for discrete variables. General linear regression models were used to analyze the relationship between basal and stimulated plasma leptin levels and adiposity and cardiometabolic measures. A percentile plot was generated to display the spectrum of stimulated peak leptin responses for the entire study cohort, and to enable sensitivity analyses. All statistical analyses were conducted using SAS statistical software, version 9.3 (SAS Institute Inc., Cary, NC, USA). The level of significance was set at P < 0.05.
Results
Cohort Characteristics
Table 1 shows the baseline characteristics of black and white participants. The gender distribution was similar in both groups. The mean age was lower and body mass index (BMI) higher in black than white subjects, but total and trunk fat mass were similar in the two groups. The ethnic difference in BMI was driven by higher values in black women: 31.9 ± 7.14 vs. 29.0 ± 7.66 kg/m2, P = 0.0043; the BMI was not significantly different in black men vs. white men (29.4 ± 7.68 vs. 28.1 ± 4.23 kg/m2) FPG, and serum triglyceride levels were higher in white than black participants, although glucose and lipid values were well within the normal ranges in entire cohort.
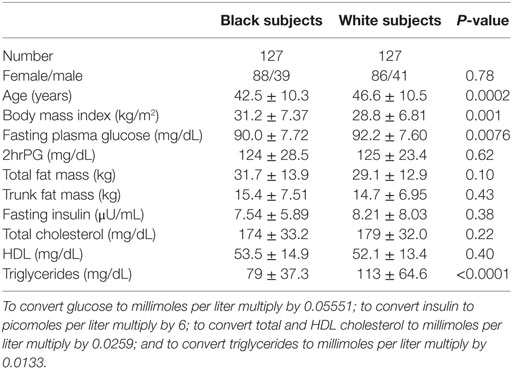
Table 1. Baseline characteristics of study participants by ethnicity.
Leptin Levels
Owing to the known gender dimorphism in circulating leptin levels, plasma leptin data are presented separately for men and women (Table 2; Figure 1). The mean fasting plasma leptin level was higher in black women than white women (50.6 ± 47.7 vs. 39.5 ± 36.7 ng/mL, P = 0.004) but similar in black men and white men (12.4 ± 13.9 vs. 11.1 ± 9.57 ng/mL, P = 0.59) (Table 2). Following ingestion of the 2-mg dose of dex, the mean plasma cortisol levels were suppressed to <1.5 μg/dL in all subject groups at the 8- and 16-h sampling times (Figure 1A; Table 2). The sustained suppression of plasma cortisol levels reflects feedback inhibition of corticotropin release by exogenous glucocorticoid, which is prima facie evidence of dex ingestion by study participants.
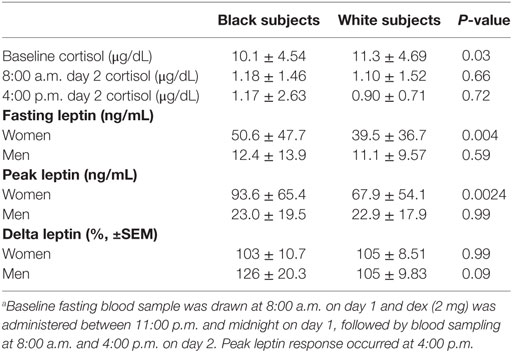
Table 2. Plasma cortisol and leptin levels before and after dexamethasone (dex) (2 mg).a
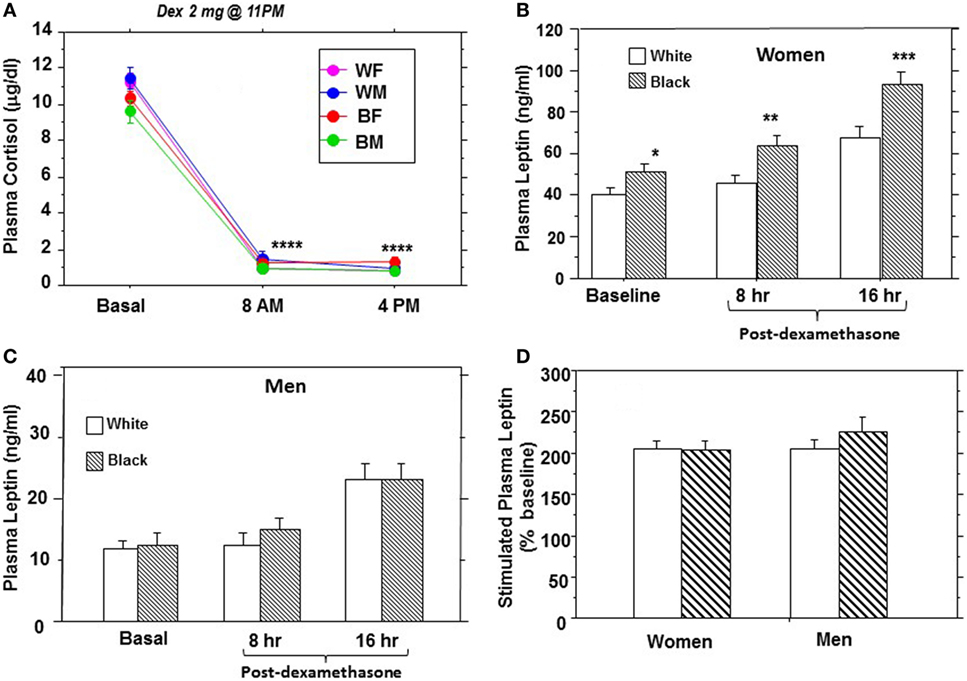
Figure 1. Plasma cortisol (A) and leptin (B–D) responses to a single dose (2 mg) of dexamethasone in African-American and European-American men and women. Abbreviations: WF, white female; WM, white male; BF, black female; BM, black male (*P = 0.004, **P = 0.0036, ***P = 0.0024, and ****P < 0.0001).
As previously reported by us (14, 16), the peak plasma leptin response to dex occurred at 16 h following ingestion, although increased secretion was evident at 8 h (Figures 1B,C). The baseline difference in fasting leptin levels between black women and white women was exaggerated following dex stimulation (Figure 1B), but the responses among men did not differ significantly by race (Figure 1C). To account for baseline differences in individual leptin levels, we expressed stimulated responses as a percentage of baseline values before comparing distinct groups. The peak leptin response to dex (% baseline, ±SEM) was 216 ± 9.04% in black participants vs. 204 ± 6.74% in white participants (P = 0.19), and 217 ± 9.1% in men vs. 204 ± 6.60% in women (P = 0.11). The peak plasma leptin responses to dex showed a consistent doubling from baseline (~200% baseline) in all four demographic groups: black men and white men; black women and white women (Figure 1D). The mean (±SEM) incremental change in leptin from baseline was 103 ± 10.7 vs. 105 ± 8.51% in black vs. white women (P = 0.99) and 126 ± 20.3 vs. 105 ± 9.83% in black men vs. white men (P = 0.09) (Table 2).
Being a natural history study, our POP-ABC participants did not receive any behavioral or pharmacological intervention for control of body weight or alteration of glucose levels. These free-living participants maintained their usual habits and often exhibited fluctuations in weight and body composition during serial measurement. We calculated the 1-year changes in weight and total body fat mass from enrollment (baseline) and evaluated the association of fasting and stimulated leptin secretion (assessed in year 1) with prospective changes in weight and fat mass in year 2. We found that fasting leptin levels had no significant relationship with 1-year change in weight (P = 0.34) and only a marginal relationship with 1-year changes total fat mass (P = 0.05) (Figures 2A,B). By contrast, peak stimulated leptin levels were modestly but significantly associated with 1-year trajectories in weight (r = 0.20, P = 0.0016) and total fat mass (r = 0.21, P = 0.0035) (Figures 2C,D).
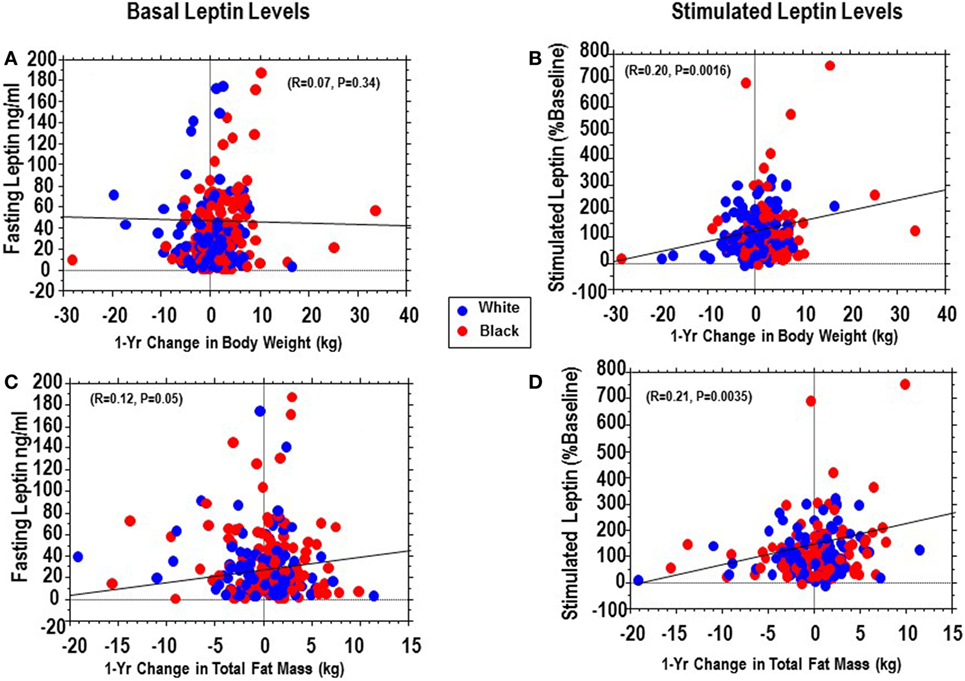
Figure 2. Regression of basal (fasting) plasma leptin vs. 1-year change in weight (A) or total fat (C) compared with regression of stimulated plasma leptin vs. and 1-year change in weight (B) or total fat (D) in African-Americans (red dots) and European-Americans (blue dots).
Percentile Analysis and Cardiometabolic Correlates
Fasting leptin levels correlated positively with body fat (r = 0.81, P < 0.0001), whereas peak stimulated leptin levels correlated inversely with body fat (r = −0.26, P < 0.0001) (Figures 3A,B). Figure 3C shows the percentile plot for change in leptin following dex ingestion for the entire cohort. The change in plasma leptin, expressed as a percentage of baseline levels, showed marked individual variability (range: −8 to +800%). Sensitivity analysis showed that plasma leptin responses to dex in 29 subjects (15 black, 14 white) were at or above the 90th percentile, and 74 subjects (38 black, 36 white) gave responses below the 25th percentile of the cohort distribution. There was a significant interaction between percentile response and 1-year change in body weight (ANOVA P = 0.0058) and total fat mass (ANOVA P = 0.0006). Subjects below the 75th percentile of leptin response maintained stable (or decreasing) body weight and total fat mass, whereas those above the 75th percentile had an increased risk of weight gain (Figure 3D). In univariate models significant associations were observed between dynamic leptin response to dex and fasting leptin levels (r = −0.29, P < 0.0001), BMI (r = 0.26, P < 0.0001), HOMA-B (r = −0.26, P = 0.0027), HOMA-IR (r = −0.24, P = 0.01), triglycerides (r = −0.17, P = 0.0078), FPG (r = −0.13, P = 0.027), hsCRP (r = −0.13, P = 0.027), and systolic blood pressure (BP) (r = −0.12, P = 0.037). Age, race, and gender were not significant predictors of stimulated leptin responses.
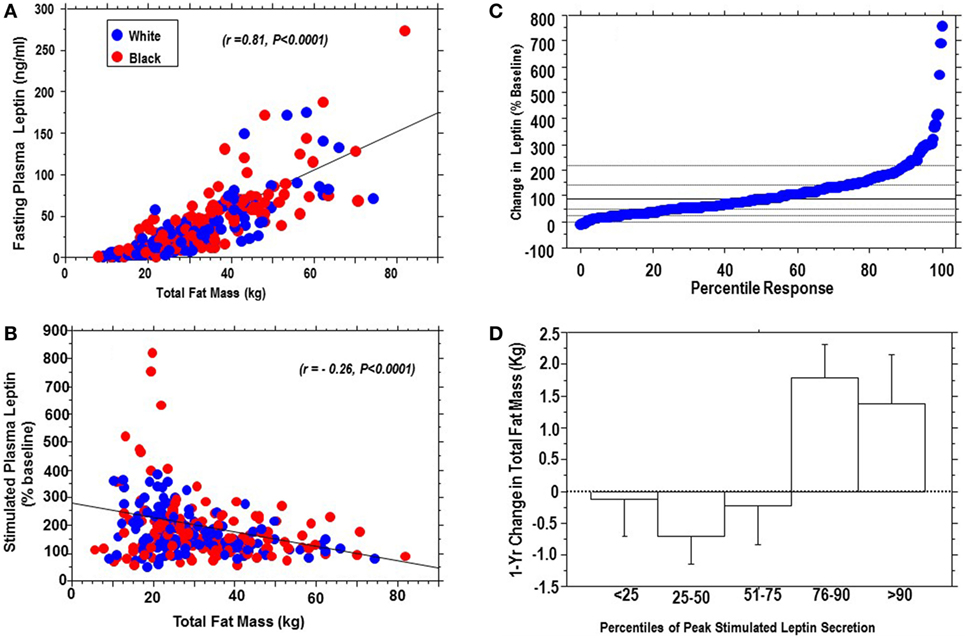
Figure 3. Positive association of fasting plasma leptin levels with body fat (A), and inverse association of stimulated plasma leptin levels with body fat (B), in African-Americans (red dots) and European-Americans (blue dots); percentile distribution of percent change in leptin following dexamethasone (C) and association with 1-year change in total fat mass (D). There was a significant interaction between change in leptin and change in fat mass, P = 0.0006.
Discussion
Despite more than 20 years of investigation, the exact role of leptin in human metabolic pathophysiology remains unclear. Leptin replacement is remarkably effective in treating rare forms of human obesity due to mutation of the leptin gene (4, 5). However, hopes of leptin therapy for common forms of obesity have not been fulfilled, although recombinant human leptin received approval by the U.S. Food and Drug Administration in 2014 for the treatment of generalized lipodystrophy (7, 24). The physiology and regulation of leptin also need to be fully clarified, as the notion of leptin as an anorectic, anti-obesity hormone has been expanded to emphasize leptin’s role as a rapid signal of starvation or energy deficit (25). Our previous studies focusing on the hormonal regulation of leptin in humans have established glucocorticoids as potent leptin secretagogues and have proposed that the glucocorticoid–leptin axis might be of metabolic relevance (14, 16, 18, 19, 26–28). The possible physiologic significance of glucocorticoid–leptin interaction is suggested by four related observations. First, the plasma leptin response to glucocorticoid has been demonstrated at physiological doses of hydrocortisone in humans (19). Second, glucocorticoid-induced hyperleptinemia is abolished by fasting (19, 29). Thirdly, inhibition of steroidogenesis by metyrapone decreases leptin production in humans (28, 30). Fourthly, glucocorticoid-induced hyperleptinemia has been reported to modulate anti-ingestive behavior in humans (27).
This report was an exhaustive analysis of basal and dynamic leptin secretion in a biracial cohort of otherwise healthy offspring of parents with T2D. Our findings confirm the well-known gender dimorphism in leptin levels (~3-fold higher in women than men). Although black women had higher basal and stimulated leptin levels than white women, the difference is accounted for by the higher BMI and fat mass among the former. Thus, the correlation between fasting leptin and body fat was identical (r = 0.81) in black and white subjects. Using a modification of our previous method, we demonstrated that the lower dose of dex (2 mg) stimulated leptin secretion by approximately the same magnitude compared with higher glucocorticoid doses (14, 16, 18). Our findings show definitively that a doubling of basal leptin levels is the expected peak response to glucocorticoid among healthy adults. Furthermore, there is no discernible evidence of gender or ethnic disparities when dynamic leptin secretion is expressed as a percentage of baseline values.
We observed an inverse correlation between stimulated leptin levels and total body fat, which contrasts with the well-recognized direct correlation between fasting leptin levels and adiposity. The mechanism for the inverse relationship is unclear. We propose that people with high body fat might be near maximal in their leptin secretory potential and, thus, limited in their capacity for mounting fold increases in leptin secretion (31). By contrast, people with lower body fat (and therefore low basal leptin levels) might be more capable responding more briskly to a response to leptin secretagogue. Another novel finding from the present study is the dissociation between basal and stimulated leptin levels in the prediction of future weight gain in our biracial cohort of African-Americans and European-Americans. A previous report had suggested that fasting plasma leptin levels might predict future weight gain in Pima Indians (32). That report was based on an analysis of fasting plasma leptin levels in 19 Pima Indians who gained weight and 17 who maintained their weight during approximately 3 years of follow-up (32). In our much larger sample of 254 subjects, we did not observe a significant association between fasting plasma leptin levels and future weigh change over a 1-year period. By contrast, we noted a weak but significant association between stimulated leptin levels and 1-year weight gain. We also found an inverse association between stimulated leptin levels and body fat at baseline. The latter finding suggests that the magnitude of leptin response to secretagogue might be a surrogate for adipocyte size and capacity for additional fat storage. Viewed in that light, obese, hyperleptinemic individuals who give a weak response to glucocorticoid stimulation might be signaling a plateau in their weight trajectory and adipocyte fat storage capacity (31). By contrast, heterogeneity in dynamic leptin responses among leaner individuals might convey information regarding differential adipocyte secretory/fat storage capacity, with implications for future weight gain. Indeed, our percentile and sensitivity analyses showed that individuals below the 75th percentile of stimulated leptin secretion maintained stable weight and body fat, whereas hypersecretors above the 75th percentile were more likely to experience weight gain. Further studies correlating dynamic leptin secretory status with morphological characteristics of adipocytes from fat biopsies might be informative. Similarly, longitudinal studies evaluating dynamic leptin secretion in relation to clinical cardiometabolic endpoints would also be valuable.
In conclusion, findings from our biracial cohort indicate that basal and dynamic (dex-stimulated) leptin levels were similar in African-Americans and Caucasians. Moreover, dynamic leptin levels correlated with a wide range of cardiometabolic risk markers (including blood glucose, insulin, BP, triglycerides, hsCRP and short-term weight trajectories).
Ethics Statement
The POP-ABC study protocol was approved by the University of Tennessee Health Science Center Institution Review Board. All subjects gave written informed consent before the initiation of the study, which was conducted in accordance with the principles of the Declaration of Helsinki.
Author Contributions
The authors’ individual contributions included the following: SD-J as the principal investigator, developed the study concept and design and wrote the manuscript; SE and CE collected the data and reviewed and revised the manuscript; and IO conducted the statistical analysis and reviewed and revised the manuscript.
Conflict of Interest Statement
The authors declare that the research was conducted in the absence of any commercial or financial relationships that could be construed as a potential conflict of interest.
Acknowledgments
The authors are indebted to the participants who volunteered for this study and to the research nurses and staff of the University of Tennessee General Clinical Research Center.
Funding
This work was supported by Grant R01 DK067269 from the National Institutes of Health. The funding source (National Institutes of Health) had no role in the design and execution of the study, the analysis and presentation of the data obtained from the study, or the decision to submit manuscript for publication.
Abbreviations
ANOVA, analysis of variance; BMI, body mass index; BP, blood pressure; Dex, dexamethasone; DEXA, dual energy X-ray absorptiometry; FPG, fasting plasma glucose; HOMA-B, homeostasis model of beta-cell function; HOMA-IR, homeostasis model of insulin resistance; hsCRP, high-sensitivity C-reactive protein; NGT, normal glucose tolerance; OGTT, oral glucose tolerance test; POP-ABC, Pathobiology of Prediabetes in a Biracial Cohort; 2hrPG, two-hour post-load plasma glucose during 75-gram standard oral glucose tolerance test; T2D, type 2 diabetes.
References
1. Halaas JL, Gajiwala KS, Maffei M, Cohen SL, Chait BT, Rabinowitz D, et al. Weight-reducing effects of the plasma protein encoded by the obese gene. Science (1995) 269:543–6. doi:10.1126/science.7624777
2. Pelleymounter MA, Cullen MJ, Baker MB, Hecht R, Winters D, Boone T, et al. Effects of the obese gene product on body weight regulation in ob/ob mice. Science (1995) 269:540–3. doi:10.1126/science.7624776
3. Weigle DS, Bukowski TR, Foster DC, Holderman S, Kramer JM, Lasser G, et al. Recombinant ob protein reduces feeding and body weight in the ob/ob mouse. J Clin Invest (1995) 96:2065–70. doi:10.1172/JCI118254
4. Montague CT, Faroogi IS, Whitehead JP, Soos MA, Rau H, Wareham NJ, et al. Congenital leptin deficiency is associated with severe early-onset obesity in humans. Nature (1997) 387:903–8. doi:10.1038/43185
5. Licinio J, Caglayan S, Ozata M, Yildiz BO, de Miranda PB, O’Kirwan F, et al. Phenotypic effects of leptin replacement on morbid obesity, diabetes mellitus, hypogonadism, and behavior in leptin-deficient adults. Proc Natl Acad Sci U S A (2004) 101:4531–6. doi:10.1073/pnas.0308767101
6. Rosenbaum M, Murphy EM, Heymsfield SB, Matthews DE, Leibel RL. Low dose leptin administration reverses effects of sustained weight-reduction on energy expenditure and circulating concentrations of thyroid hormones. J Clin Endocrinol Metab (2002) 87:2391–4. doi:10.1210/jcem.87.5.8628
7. Heymsfield SB, Greenberg AS, Fujioka K, Dixon RM, Kushner R, Hunt T, et al. Recombinant leptin for weight loss in obese and lean adults: a randomized, controlled, dose escalation trial. JAMA (1999) 282:1568–75. doi:10.1001/jama.282.16.1568
8. Dagogo-Jack S. Human leptin regulation and promise in pharmacotherapy. Curr Drug Targets (2001) 2:181–95. doi:10.2174/1389450013348623
9. Considine RV, Sinha MK, Heiman ML, Kriaciunas A, Stephens TW, Nyce MR, et al. Serum immunoreactive-leptin concentrations in normal-weight and obese humans. N Engl J Med (1996) 334:292–5. doi:10.1056/NEJM199602013340503
10. Dagogo-Jack S, Fanelli C, Paramore D, Brothers J, Landt M. Plasma leptin and insulin relationships in obese and nonobese humans. Diabetes (1996) 45:695–8. doi:10.2337/diab.45.5.695
11. Ostlund RE Jr, Yang JW, Klein S, Gingerich R. Relation between plasma leptin concentration and body fat, gender, diet, age, and metabolic covariates. J Clin Endocrinol Metab (1996) 81:3909–13. doi:10.1210/jcem.81.11.8923837
12. Liu J, Askari H, Dagogo-Jack S. Reproducibility of fasting plasma leptin concentrations in lean and obese humans. Endocr Res (1999) 25:1–10. doi:10.3109/07435809909066124
13. Grinspoon S, Gulick T, Askari H, Landt M, Lee K, Anderson E, et al. Serum leptin levels in women with anorexia nervosa. J Clin Endocrinol Metab (1996) 81:3861–3. doi:10.1210/jcem.81.11.8923829
14. Liu J, Askari H, Dagogo-Jack S. Basal and stimulated plasma leptin in diabetic subjects. Obesity Res (1999) 7:537–44. doi:10.1002/j.1550-8528.1999.tb00711.x
15. Berneis K, Vosmeer S, Keller U. Effects of glucocorticoids and of growth hormone on serum leptin concentration in man. Eur J Endocrinol (1996) 135:663–5. doi:10.1530/eje.0.1350663
16. Dagogo-Jack S, Selke G, Melson AK, Newcomer JW. Robust leptin secretory responses to dexamethasone in obese subjects. J Clin Endocrinol Metab (1997) 82:3230–3. doi:10.1210/jc.82.10.3230
17. Papaspyrou-Rao S, Schneider SH, Petersen RN, Fried SK. Dexamathasone increases leptin expression in humans in vivo. J Clin Endocrinol Metab (1997) 82:1635–7. doi:10.1210/jcem.82.5.3928
18. Newcomer JW, Selke G, Melson AK, Gross J, Volger GP, Dagogo-Jack S. Dose-dependent cortisol-induced increases in plasma leptin concentration in healthy humans. Arch Gen Psychiatry (1998) 55:995–1000. doi:10.1001/archpsyc.55.11.995
19. Dagogo-Jack S, Umamaheswaran I, Askari H, Tykodi G. Leptin response to glucocorticoid occurs at physiological doses and is abolished by fasting. Obes Res (2003) 11:232–7. doi:10.1038/oby.2003.36
20. Saad MF, Khan A, Sharma A, Michael R, Riad-Gabriel MG, Boyadjian R, et al. Physiological insulinemia acutely modulates plasma leptin. Diabetes (1998) 47:544–9. doi:10.2337/diabetes.47.4.544
21. Dagogo-Jack S, Edeoga C, Nyenwe E, Chapp-Jumbo E, Wan J. Pathobiology of Prediabetes in a Biracial Cohort (POP-ABC): design and methods. Ethn Dis (2011) 21:33–9.
22. Dagogo-Jack S, Edeoga C, Ebenibo S, Chapp-Jumbo E. Pathobiology of Prediabetes in a Biracial Cohort (POP-ABC) study: baseline characteristics of enrolled subjects. J Clin Endocrinol Metab (2013) 98:120–8. doi:10.1210/jc.2012-2902
23. Matthews D, Hosker J, Rudenski A, Naylor B, Treacher D, Turner R. Homeostasis model assessment: insulin resistance and beta cell function from fasting plasma glucose and insulin concentrations in man. Diabetologia (1985) 28:412–9. doi:10.1007/BF00280883
24. Javor ED, Cochran EK, Musso C, Young JR, Depaoli AM, Gorden P. Long-term efficacy of leptin replacement in patients with generalized lipodystrophy. Diabetes (2005) 54:1994–2002. doi:10.2337/diabetes.54.7.1994
25. Flier JS, Maratos-Flier E. Leptin’s physiologic role: does the emperor of energy balance have no clothes? Cell Metab (2017) 26:24–6. doi:10.1016/j.cmet.2017.05.013
26. Askari H, Liu J, Dagogo-Jack S. Hormonal regulation of human leptin in vivo: effects of hydrocortisone and insulin. Inter J Obesity (2000) 24:1254–9. doi:10.1038/sj.ijo.0801379
27. Askari H, Liu J, Dagogo-Jack S. Energy adaptation to glucocorticoid-induced hyperleptinemia in human beings. Metabolism (2005) 54:876–80. doi:10.1016/j.metabol.2005.01.035
28. Dagogo-Jack S, Tykodi G, Umamaheswaran I. Inhibition of cortisol biosynthesis decreases circulating leptin levels in obese humans. J Clin Endocrinol Metab (2005) 90:5333–5. doi:10.1210/jc.2005-0803
29. Laferrère B, Fried SK, Hough K, Campbell SA, Thornton J, Pi-Sunyer FX. Synergistic effects of feeding and dexamethasone on serum leptin levels. J Clin Endocrinol Metab (1998) 83:3742–5. doi:10.1210/jc.83.10.3742
30. Laferrère B, Abraham C, Awad M, Jean-Baptiste S, Hart AB, Garcia-Lorda P, et al. Inhibiting endogenous cortisol blunts the meal-entrained rise in serum leptin. J Clin Endocrinol Metab (2006) 91:2232–8. doi:10.1210/jc.2005-0693
31. Dagogo-Jack S, Askari H, Tykodi G, Liu J, Umamaheswaran I. Dynamic responses to leptin secretagogues in lean, obese, and massively obese men and women. Horm Res (2008) 70:174–81. doi:10.1159/000145018
Keywords: leptin regulation, glucocorticoids, race/ethnicity, weight trajectories, cardiometabolic risk
Citation: Ebenibo S, Edeoga C, Owei I and Dagogo-Jack S (2018) Basal and Dynamic Leptin Secretion: Association with Cardiometabolic Risk and Body Weight Trajectories in African-Americans and European-Americans. Front. Endocrinol. 9:12. doi: 10.3389/fendo.2018.00012
Received: 07 July 2017; Accepted: 11 January 2018;
Published: 26 January 2018
Edited by:
Jan Polák, Charles University, CzechiaReviewed by:
Joseph Aloi, Wake Forest Baptist Medical Center, United StatesRade Vukovic, The Institute for Health Protection of Mother and Child Serbia, Serbia
Copyright: © 2018 Ebenibo, Edeoga, Owei and Dagogo-Jack. This is an open-access article distributed under the terms of the Creative Commons Attribution License (CC BY). The use, distribution or reproduction in other forums is permitted, provided the original author(s) and the copyright owner are credited and that the original publication in this journal is cited, in accordance with accepted academic practice. No use, distribution or reproduction is permitted which does not comply with these terms.
*Correspondence: Sam Dagogo-Jack, c2RqQHV0aHNjLmVkdQ==