 Daniel Aizen
 Metsada Pasmanik-Chor2
 Rive Sarfstein
 Ilan Bruchim
 Haim Werner
- 1Department of Human Molecular Genetics and Biochemistry, Sackler School of Medicine, Tel Aviv University, Tel Aviv, Israel
- 2Bioinformatics Unit, George Wise Faculty of Life Sciences, Tel Aviv University, Tel Aviv, Israel
- 3Endocrine and Diabetes Research Unit, Schneider Children’s Medical Center, Petah Tikva, Israel
- 4Gynecological Oncology Division, Hillel Yaffe Medical Center, Technion – Israel Institute of Technology, Hadera, Israel
- 5Yoran Institute for Human Genome Research, Tel Aviv University, Tel Aviv, Israel
Insulin analogs were developed to improve diabetes therapy. However, certain modifications introduced into the insulin molecule were shown to enhance their affinity to the insulin-like growth factor-1 receptor (IGF1R). Most tumors, including endometrial cancers, express high levels of IGF1R. The present study was aimed at identifying the entire set of genes that are differentially activated by insulin glargine or detemir, in comparison to insulin and IGF1, in Type 1 and Type 2 endometrial cancer cell lines (ECC-1 and USPC-1, respectively). Global gene expression analyses demonstrated a ligand-dependent upregulated expression of filamin-A (FLNA), a gene that encodes an actin filament cross-linking protein, in both endometrial cancer cell types. Silencing experiments linked to migration assays confirmed the role of FLNA in cell growth and motility. Our data suggest that the activation of distinct sets of genes by glargine may lead to stimulation of specific pathways or, alternatively, may provide additive effects, different from those classically induced by insulin. Given that metastases are probably the main factor contributing to tumor invasiveness, the identification of FLNA as a downstream target for insulin-like hormones may be of translational relevance in oncology. Clinical studies in endometrial cancer may add further relevant information regarding the possible differential actions of insulin analogs with respect to native insulin.
Introduction
Insulin analogs were developed in order to provide a better glycemic control to diabetes patients. Analogs are generated by modifying the amino acid sequence of the insulin molecule to either prolong or shorten their action time (1–3). These modifications usually lead to improved pharmacokinetic and/or pharmacodynamic properties. Insulin analogs are classified into two main categories: short-acting and long-acting analogs, according to their action kinetics and absorption rates. However, certain structural changes introduced into the insulin molecule were shown to alter the affinities of analogs for the insulin (INSR) and insulin-like growth factor-1 receptor (IGF1R) (4). Altered binding kinetics may lead to a number of non-classical biological activities often associated with insulin analogs.
Most clinical and experimental data support the concept that INSR activation (primarily by insulin) leads to metabolic types of action. On the other hand, IGF1R activation (primarily by IGF1 or IGF2) is mainly linked to growth and differentiation (5, 6). Nonetheless, there is a large degree of cross talk within this growth factor family. These complex interactions seem to be responsible for compensatory and overlapping activities usually observed in this endocrine axis. The IGF1R, which is structurally related to the INSR, is expressed in many types of cancer and is regarded as an important player in the establishment of a malignant phenotype. Given that some insulin analogs display an enhanced affinity to IGF1R, reports have shown that various analogs exhibit increased mitogenic activities in comparison to native insulin (7–10). The clinical implications of these findings, however, are still a matter of debate (4, 11, 12).
Endometrial cancer is one of the most common types of gynecological cancer (13). Endometrial cancers are divided into Type I and Type II tumors (14). Type I tumors account for ~80% of cases, are usually well-differentiated, and have a relatively good prognosis. Type II tumors, on the other hand, are more aggressive, occur in older women, and have a worse prognosis. The incidence of endometrial cancer significantly increased in recent years, apparently as a result of the growing obesity epidemics (15). Based on epidemiological and clinical correlations, we postulated that insulin analogs might elicit non-classical mitogenic and signaling activities in endometrial cancer. In a recent study, we analyzed the actions of short-acting insulin lispro (LysB28, ProB29 human insulin) and aspart (AspB28 human insulin), and long-acting insulin glargine (GlyA21, ArgB31, ArgB32 human insulin), and detemir [LysB29 (N-tetradecanoyl) des (B30) human insulin] in endometrial cancer cells (16). We showed that glargine exhibits a strong, IGF1-like, mitogenic effect whereas detemir and short-acting analogs lispro and aspart display reduced proliferative potentials. In addition, analogs activated the INSR and IGF1R pathways in cell-type specific fashions.
The present study was designed to identify the entire set of genes that are differentially activated by glargine or detemir, in comparison to native insulin and IGF1, in both Type I and II endometrial cancer cell lines. Global gene expression analyses allowed us to identify the molecular events that are differentially induced by analogs, as well as genes that are commonly activated by all insulin-like hormones. The filamin-A (FLNA) gene encodes an actin filament cross-linking protein that interacts with binding proteins involved in cell motility. Microarray gene expression analyses showed a significant ligand-dependent upregulated expression of FLNA in ECC-1 and USPC-1 endometrial cancer cells. Silencing experiments linked to migration assays confirmed the role of FLNA in cell growth and motility. Hence, our data identify FLNA as a novel downstream target candidate for insulin-like hormones.
Materials and Methods
Cell Cultures
Gene expression analyses were conducted in the Type I endometrial cancer cell line ECC-1 and Type II uterine serous papillary carcinoma cell line USPC-1. ECC-1 cells were grown in DMEM and USPC-1 cells in RPM-1640 media (Biological Industries, Beit Haemek, Israel). Media were supplemented with 10% fetal bovine serum, 2 mM glutamine, 50 µg/ml gentamicin sulfate, and 5.6 mg/l amphotericin B. The ECC-1 cell line was obtained from Dr. Yoav Sharoni (Ben Gurion University, Beer-Sheba, Israel) and the USPC-1 cell line was provided by Dr. Alessandro Santin (Yale University School of Medicine, New Haven, CT, USA). Cells were treated with the following hormones: regular insulin (Humulin R®, Lilly Pharma, Germany), insulin glargine (Lantus®, Sanofi Aventis, Germany), insulin detemir (Levemir®, Novo Nordisk, Denmark) and IGF1 (PeproTech Ltd., Rocky Hill, NJ, USA).
RNA Extraction and cDNA Synthesis
ECC-1 and USPC-1 cells were seeded in 10-cm Petri dishes and grown until confluence. Cells were serum-starved for 24 h and treated with insulin, IGF1, glargine, or detemir, at a dose of 8.6 nM, for 8 h. After incubation, cells were washed with PBS, and total RNA was extracted using the TRIzol® Reagent (Life Technologies, Carlsbad, CA, USA). RNA was quantitated by measuring absorption at 260/280 and 260/230 nm using a NanoDrop 2000 spectrophotometer (Thermo Fisher Scientific, Wilmington, DE, USA). Extracted RNA was converted to single-stranded cDNA using a High Capacity cDNA Reverse Transcription Kit (Applied Biosystems, Carlsbad, CA, USA).
Genomic Analyses
Affymetrix® Human Gene 2.1 ST Array Strips (Cat. #902114, Affymetrix, Santa Clara, CA, USA) were used for gene expression analysis. These microarrays offer whole-transcript coverage of 30,654 well established annotations of total RefSeq transcripts with 764,885 distinct probes. The microarray data was submitted to GEO and assigned the accession GSE109022.
Bioinformatics Analyses
Data analysis was performed on CEL files using Partek Genomics Suite v 6.6 (Partek, St. Louis, MO, USA). Data were normalized and summarized with the robust multi-average method followed by one-way analysis of variance. Differentially expressed genes were selected by using p-value (FDR corrected) <0.05 and fold change (FC) of at least 1.5. Hierarchical clustering analysis was done by Partek Genomics Suite software with Pearson’s dissimilarity correlation and average linkage methods.
Real-Time Quantitative Polymerase Chain Reactions (RT-qPCR)
Real-time quantitative PCR of genes of interest was performed in a StepOne™ Real-Time PCR System (Applied Biosystems™, Life Technologies Ltd., UK) by using the FastStart Universal SYBR Green Master (Rox) (Roche, Mannheim, Germany). Primer sequences for RT-qPCR are shown in Table 1. The expression measurement of the designated genes was analyzed using the StepOne™ Real-Time PCR software. Primers were normalized by specific cDNA standard curves obtained from known amounts of cDNA. The comparative Ct method was used for presenting quantitative data. RT-qPCR experiments were performed at least three times, in triplicates for each gene product examined. A SD for each relative gene expression value was calculated as a measure of data variation.
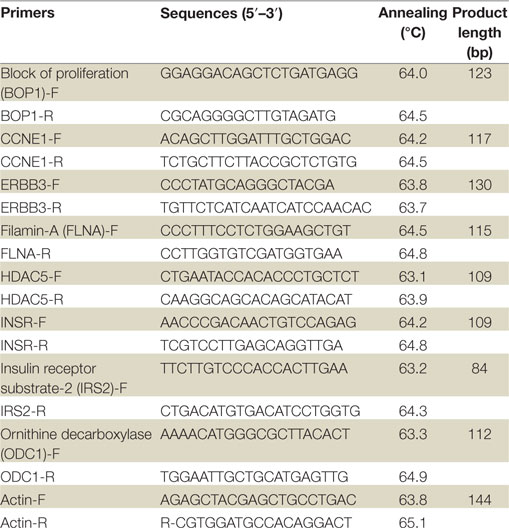
Table 1. Primer sequences for validation of microarray results by real-time quantitative polymerase chain reactions.
Western Blot Analyses
Cells were serum-starved overnight and then treated with insulin analogs, IGF1, or insulin at the indicated concentrations. After incubation, cells were harvested and lysed in a buffer containing protease inhibitors. Following centrifugation, the supernatants were collected and protein concentrations were determined. Samples were electrophoresed, followed by transfer to nitrocellulose membranes. Membranes were blocked with 5% skim milk for 1 h. The membranes were then incubated overnight with the indicated antibodies. After incubation, blots were washed and incubated with the appropriate horseradish peroxidase (HRP)-conjugated secondary antibody. The secondary antibodies were HRP-conjugated goat anti-rabbit IgG (1:50,000) and donkey anti-mouse IgG (1:25,000). Membranes were developed by using the SuperSignal West Pico® Chemiluminescent Substrate (Pierce, Rockford, IL, USA) and analyzed using chemiluminescence imaging analyzer Fusion FX7 (Vilber Lourmat SAS, France).
Knockdown of FLNA by siRNA Transfection
ECC-1 cells were seeded at a density of 1 × 10⁶/ml into 10-cm plates and incubated until 60% confluent. Filamin-A gene silencing was performed using filamin-A siRNA (Cat. #sc-35374, Santa Cruz Biotechnology), a pool of three target-specific 20–25 nt siRNAs designed for the inhibition of filamin-A expression in human cells. To obtain the best silencing efficiency, preliminary experiments were performed to determine the optimal concentration of siRNAs and the kinetics of silencing. Control siRNA-A (Cat. #sc-35374), containing a scrambled sequence of non-targeting 20–25 nt siRNA, was used as a negative control. Western blotting was performed to confirm the gene expression knockdown of FLNA in transfected cells.
Cell Migration Assays
Cell migration assays were assessed by IncuCyte ZOOM™ CellPlayer 96-Well Kinetic (Essen Bioscience, Ann Arbor, MI, USA), which is designed for kinetic quantification of cell migration. Briefly, ECC-1 cells were seeded at a density of 3 × 10⁴ cells per well and incubated overnight in full media. Wound scratchs were made the following day using a 96-pin WoundMaker™ device and incubated in starvation media with or without increasing concentrations of ligands. Cell migration was monitored in real time and confluence was measured by the IncuCyte ZOOM™ software. Results were plotted as percentage wound confluence as a function of time.
Statistical Analyses
The statistical significance of the differences between groups was assessed by Student’s t-test (two samples, equal variance) using SPSS Statistics version 19 software. Densitometry analysis was performed using FUSION-CAPT analysis software (Vilber Lourmat SAS, France). Signal intensities of phosphor-proteins were normalized to the corresponding protein signals. Data are presented as mean ± SE of three independent experiments. p-Values less than 0.05 were considered statistically significant.
Results
Microarray and Bioinformatics Analyses
In recent studies, we provided evidence that certain insulin analogs elicit differential activities in endometrial cancer cells in comparison to regular insulin or IGF1. In order to examine gene expression variation in endometrial cancer cells following treatment with insulin glargine, detemir, regular insulin, or IGF1 (in comparison to untreated control cells), the Affymetrix® Human Gene 2.1 ST Array was employed. RNA was prepared from 15 ECC-1 samples (corresponding to three biological replicates for each treatment) and five USPC-1 samples (corresponding to one biological replicate per treatment), and subjected to gene expression array analysis. Differentially expressed genes following ligand treatment were selected by using p-value (FDR corrected) <0.05 and FC of at least 1.5.
Hierarchical cluster analysis revealed differential expression of multiple genes in ECC-1 cells following stimulation with glargine (189 differentially expressed genes), IGF1 (251 differentially expressed genes), or insulin (116 differentially expressed genes), compared to untreated cells (Figures 1A–C). Principle component analysis (PCA) demonstrated that samples were nicely clustered (with a few exceptions) by treatment. There were variations between the different treatments, with detemir being the least effective treatment (Figure 1D). The Venn diagram shown in Figure 2 displays all possible logical relations between the differential gene expression sets for each treatment in ECC-1 cells. 298 genes were found to be differentially expressed by the four ligands in ECC-1 cells. In particular, IGF1-treated cells had the largest number of differentially expressed genes (251 genes), suggesting that it was the most potent treatment in comparison with the other ligands. Many of the differentially expressed genes upon treatment with insulin, glargine, or IGF1 are common to all three treatments (88 genes, circled in red). In contrast, detemir treatment was shown to be very similar to control cells gene expression. In fact, only one gene (histone deacetylase-5, HDAC5) was differentially expressed with stringent cutoff used (pFDR < 0.05 and FC = 1.5). Therefore, we chose to focus on the differentially expressed genes upon IGF1, glargine, or insulin treatments.
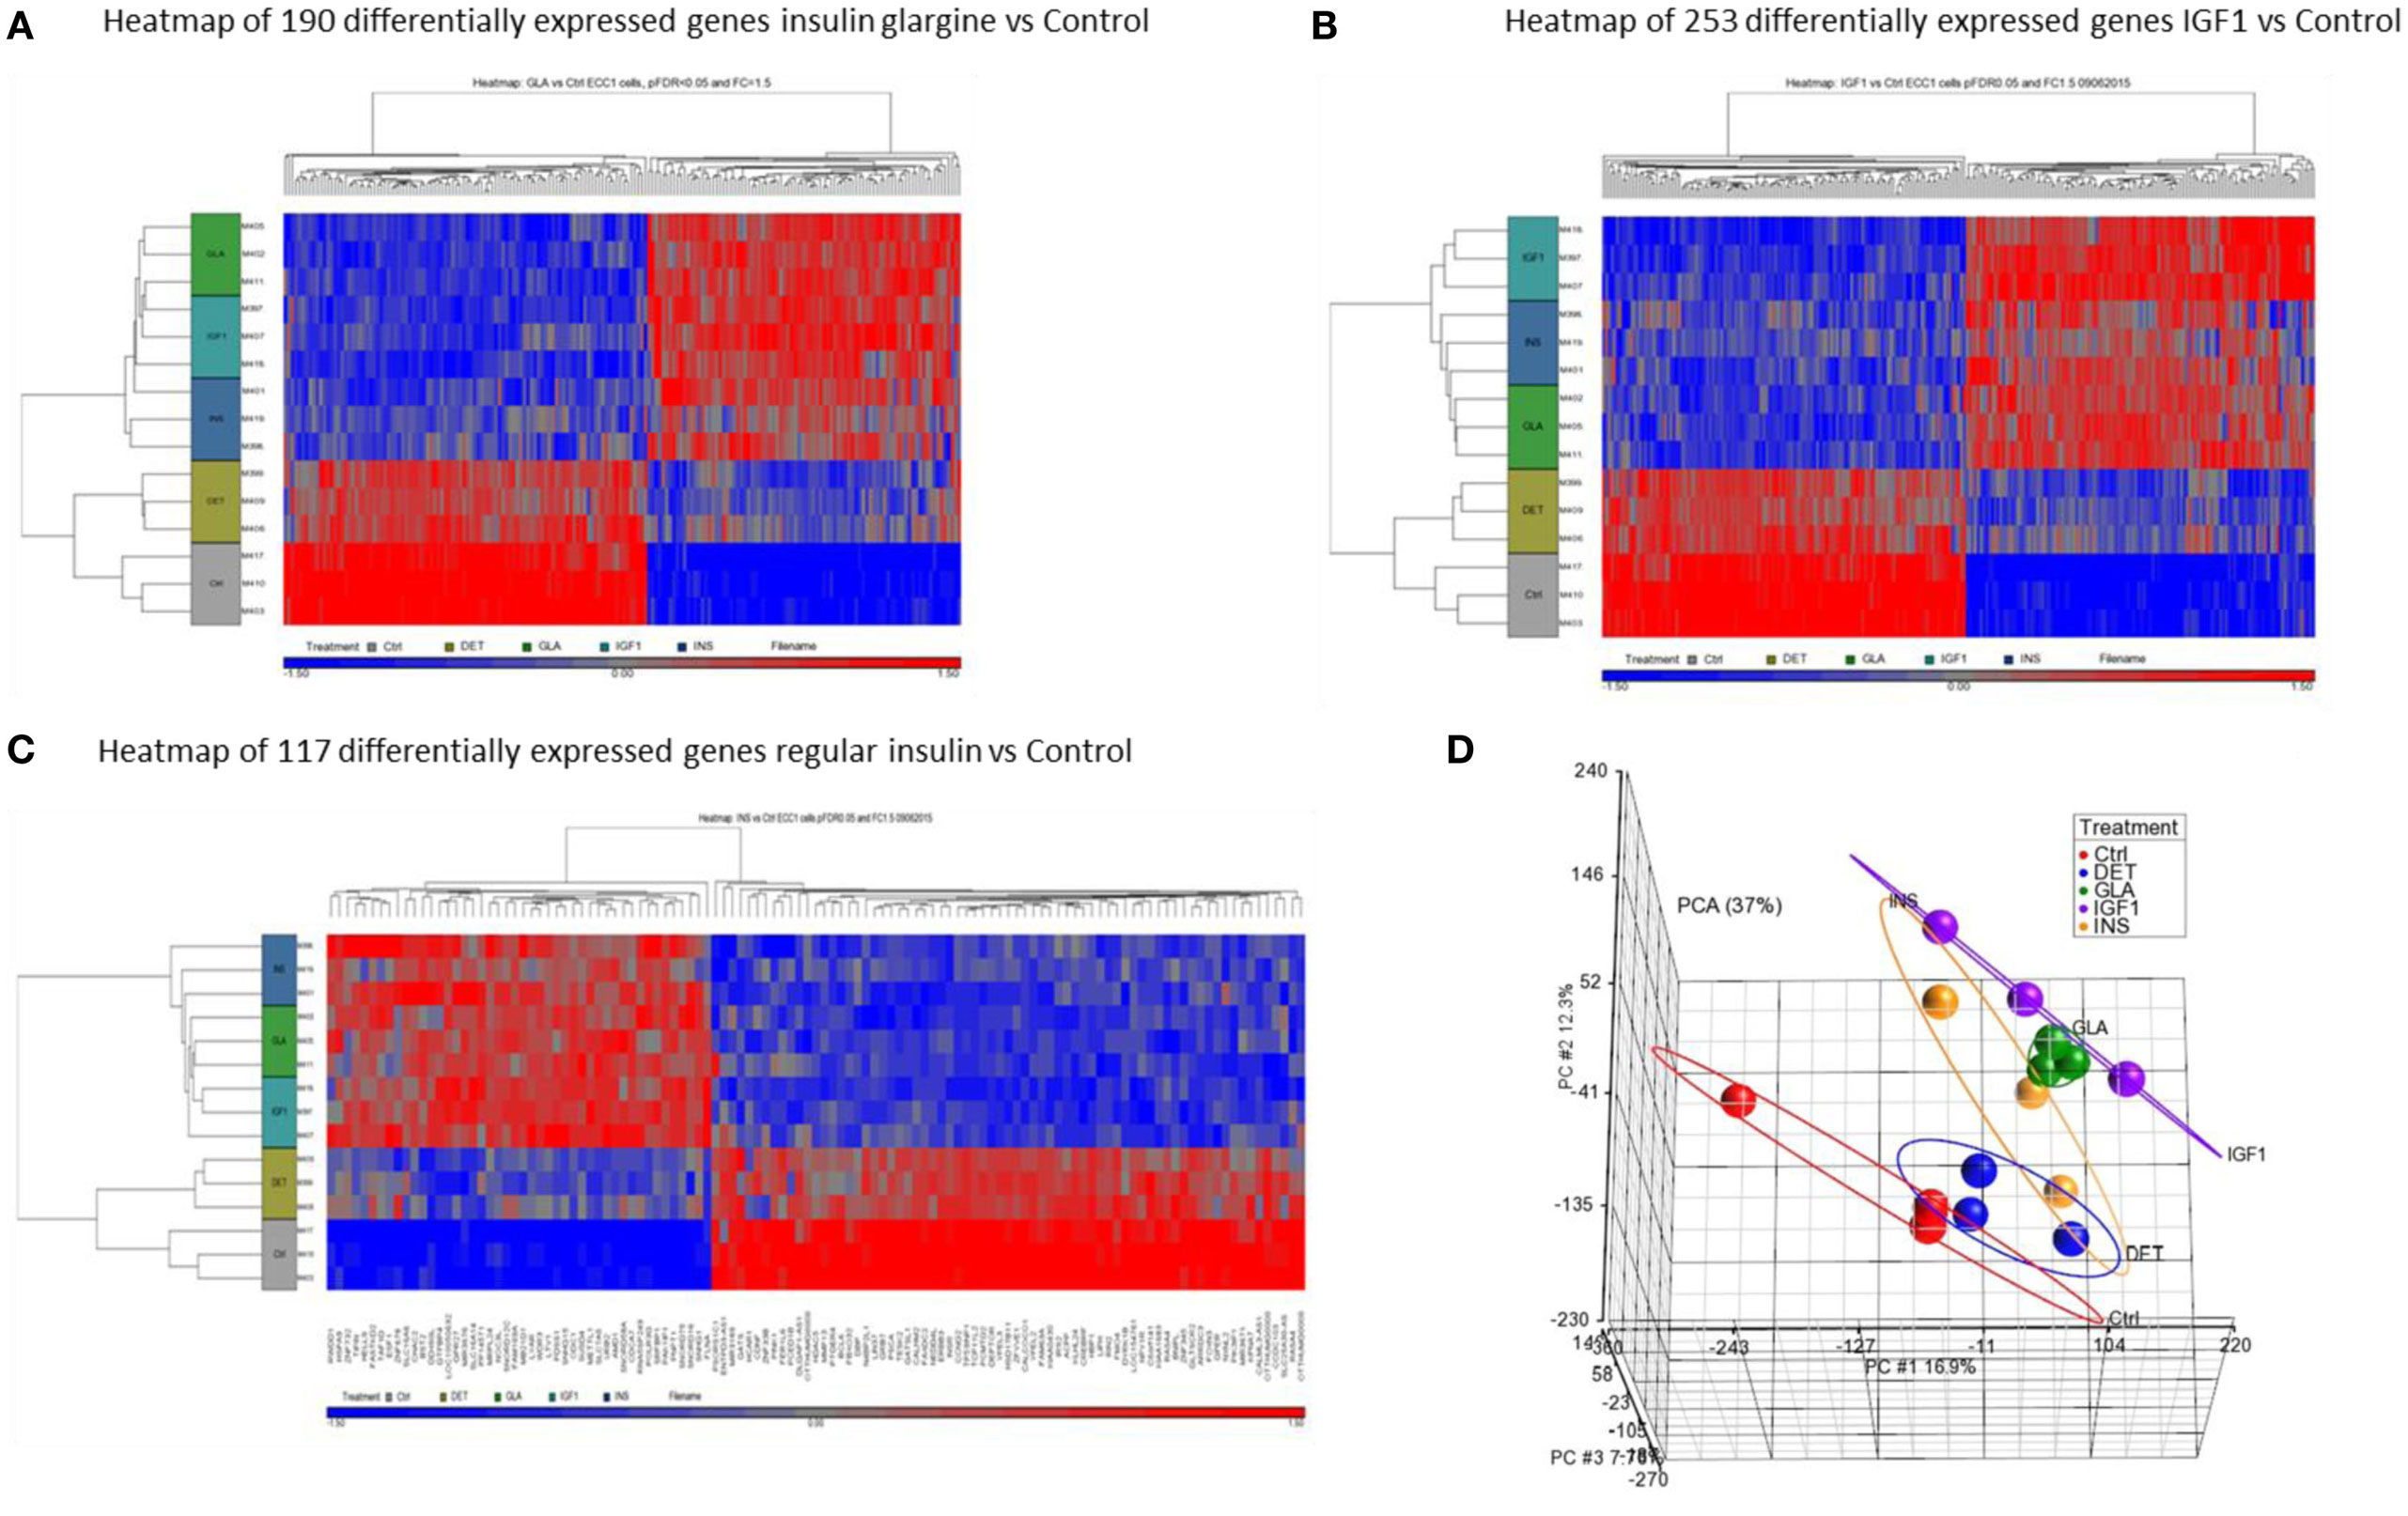
Figure 1. Hierarchical clustering map of differential gene expression in ECC-1 cells. Heatmaps of microarray results in the ECC-1 cell line after treatment with insulin glargine (A), IGF1 (B), and regular insulin (C). The figures depict heatmaps of differentially expressed genes [FC > 1.5 or <−1.5 and p-value (FDR) < 0.05]. The scale below indicates the relative changes in gene expression represented by red (upregulated genes) and blue (downregulated genes) colors. (D) Principal component analysis (PCA) of all 15 arrays of ECC-1 cells (three biological replicates were performed for each treatment). Each data point represents RNA sample applied to microarray: red (untreated cells—Control, Ctrl), blue (Detemir, DET), green (Glargine, GLA), violet (IGF1), and orange (regular insulin, INS).
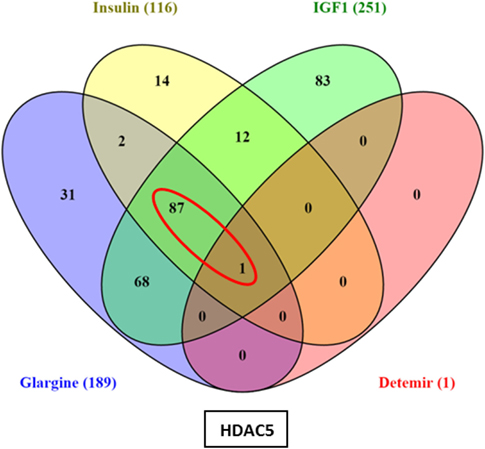
Figure 2. Venn diagram: differentially expressed genes in ECC-1 cells after ligands treatment. The diagram displays all possible logical relations between the differential gene expression sets for each treatment in ECC-1 cells. Only one gene (HDAC5) was differentially expressed after detemir treatment (shown in box). FC = 1.5 and pFDR < 0.05.
As shown in Figure 3, 68 genes were differently regulated by both glargine and IGF1 treatments, while 12 genes were regulated differently by both insulin and IGF1. In percentages, 37% of the total genes induced by glargine were also induced by IGF1 treatment. On the other hand, only 10% of the genes induced by insulin were induced also by IGF1. Thus, treatment with glargine leads to the activation of more genes in common with IGF1 than with insulin.
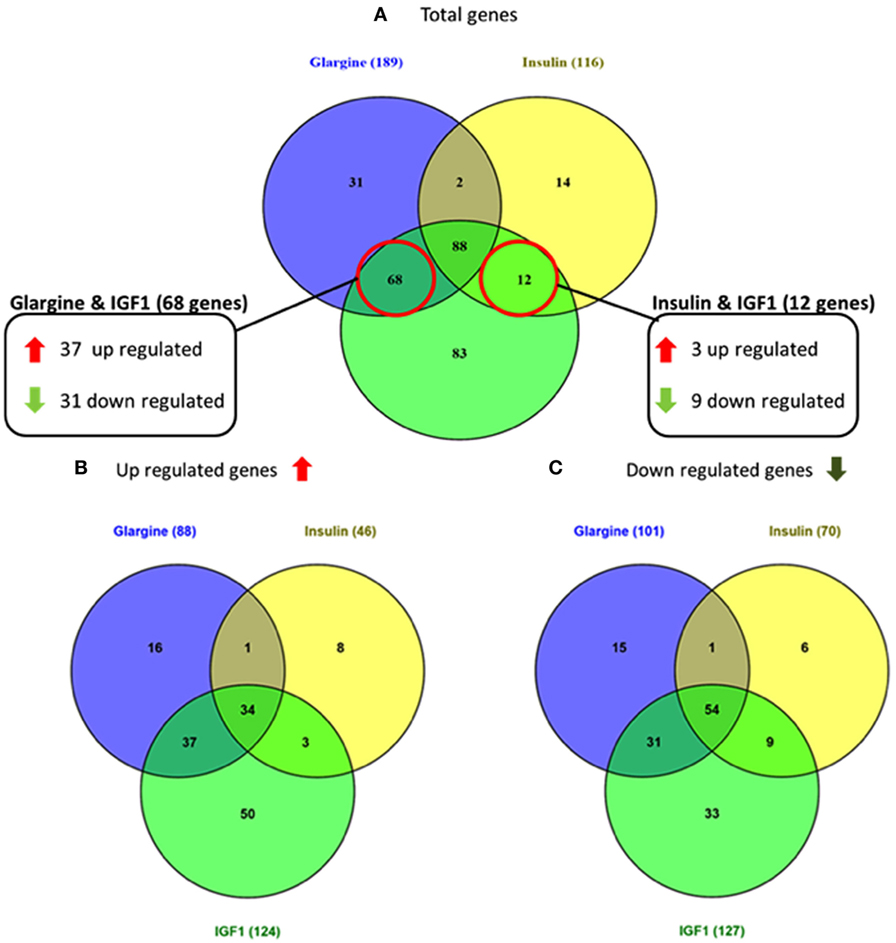
Figure 3. Venn diagrams showing the number of differentially expressed genes in response to glargine, regular insulin, or IGF1 in ECC-1 cells. (A) Number of total genes induced after IGF1, glargine, or regular insulin treatment; (B) number of upregulated genes; (C) number of downregulated genes. The Venn diagram shows the number of genes uniquely expressed after response to the indicated treatment. The intersection of the circles shows the number of genes commonly expressed (up- or downregulated). The genes included in this analysis showed a 1.5-fold change in expression compared to the control with a pFDR < 0.05.
Next, we conducted a pathway enrichment analysis of the differently expressed genes upon IGF1, insulin, or glargine treatments, compared to untreated ECC-1 cells. The enriched signaling pathway analysis revealed that, in addition to the mTOR, insulin, and IGF1 pathways, ligand stimulation alters additional pathways that are associated with cell cycle progression, proliferation, apoptosis, and migration, among others (Table 2). The features of gene expression changes in ECC-1 cells after treatment with all four ligands (glargine, detemir, IGF1, and insulin) are shown in Figure 4. Out of 298 differentially expressed genes detected with either one of the four treatments, clustering analysis identified the presence of a cluster of 20 genes. Except for detemir, these 20 genes showed the same differential expression in each treatment.
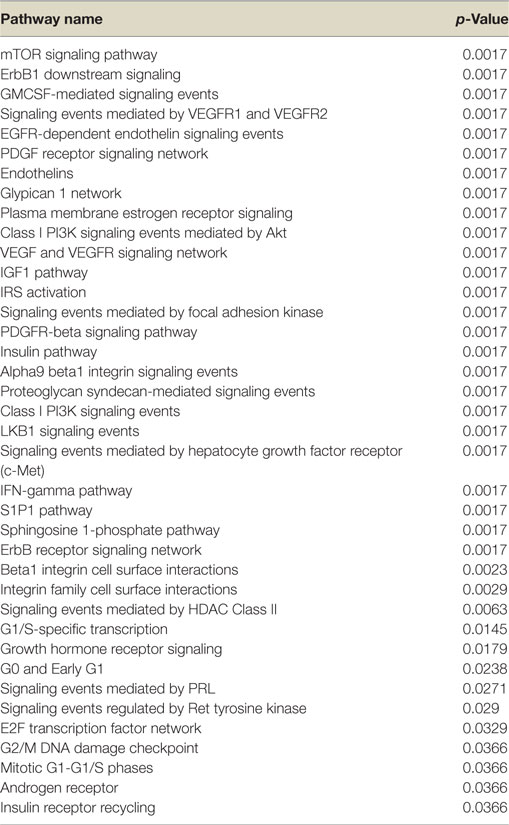
Table 2. Enriched signaling pathways following ligand stimulation in ECC-1 cells.
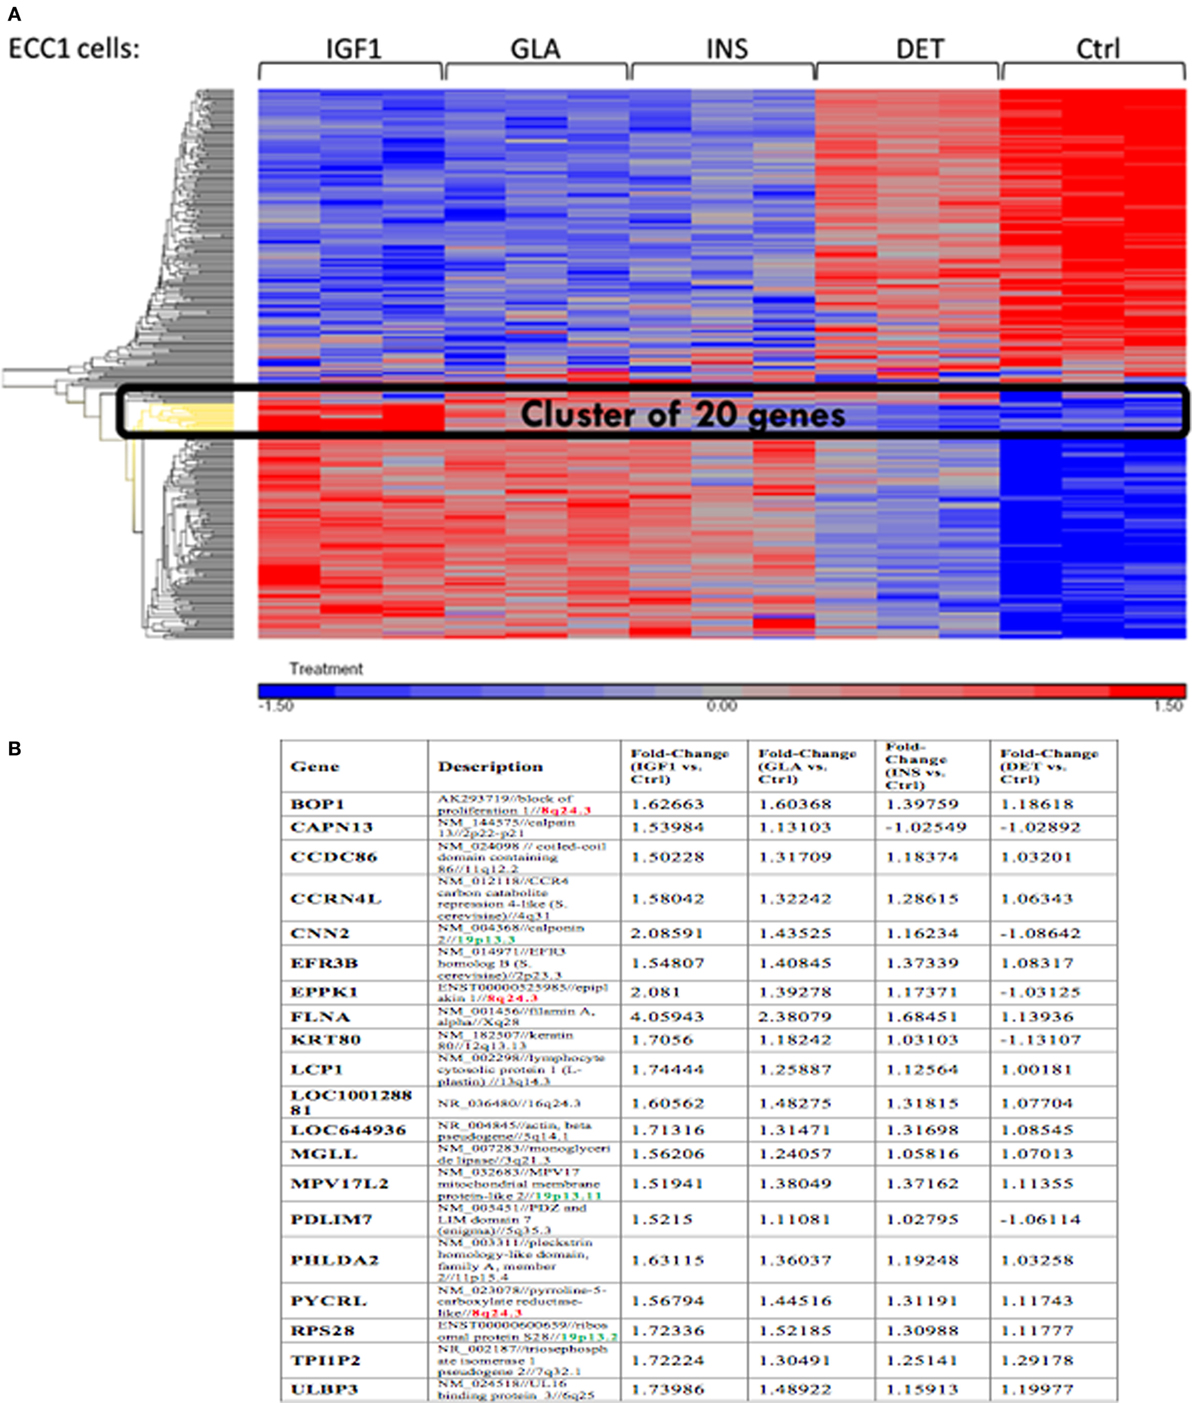
Figure 4. Features of differentially expressed genes in ECC-1 cells after ligands treatment. (A) Heatmap of 298 differentially expressed genes that were detected for all four treatments in ECC1 cells; (B) list of the 20 genes from the cluster marked in black in (A). Fold changes are indicated.
Regarding USPC-1 cells, microarray analysis demonstrated a similar expression pattern to ECC-1 cells. The hierarchical clustering map shows that detemir had very little effect in comparison to the other treatments (Figure 5). Likewise, the other three treatments (glargine, IGF1, and insulin) exhibited similar effects with minor differences. Cluster analysis detected 3,000 differentially expressed genes for the four treatments in these cells (fold-change difference = 1.5). Similarly to ECC-1, we investigated the total, up- and downregulated expression of genes elicited by the hormones (Figure 6). Like ECC-1, treatment with glargine had more genes in common with IGF1 treatment than with insulin (Figure 6A). Furthermore, Venn analysis showed a similar number of up- and downregulated common genes induced by all three ligands (Figures 6B,C). Moreover, ECC-1 and USPC-1 cells showed the same percentage of up- and downregulated commons genes after treatment by all three ligands (Figure 7). The difference in number of genes compared to ECC-1 cells could be explained by the fact that the microarray analysis of USPC-1 cells was performed only in five samples (corresponding to one biological replicate per treatment). Therefore, clusters analysis was done on the basis of FC = 1.5 only, without a pFDR statistical value available.
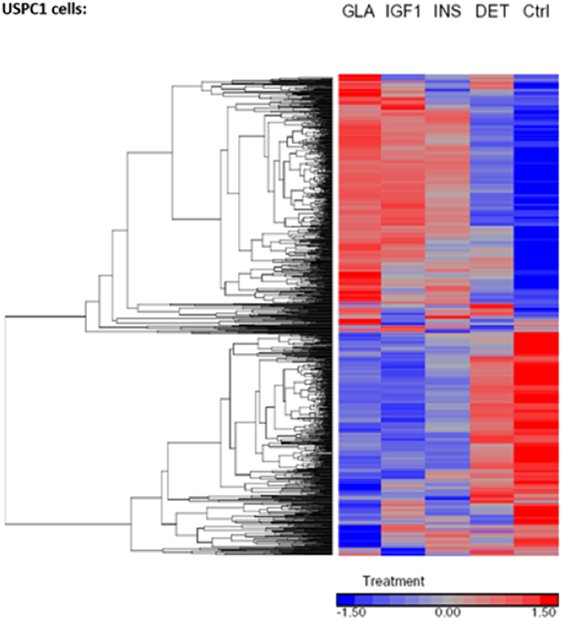
Figure 5. Hierarchical clustering map of differential gene expression in USPC-1 cells. Heatmaps of microarray results in the USPC-1 cell line after treatment with insulin glargine, detemir, IGF1, and regular insulin. The figure depicts a heatmap of differentially expressed genes (FC > 1.5 or <−1.5). The scale below indicates the relative changes in gene expression represented by red and blue colors. Upregulated genes are shown in red and downregulated genes are shown in blue. FC, fold change.
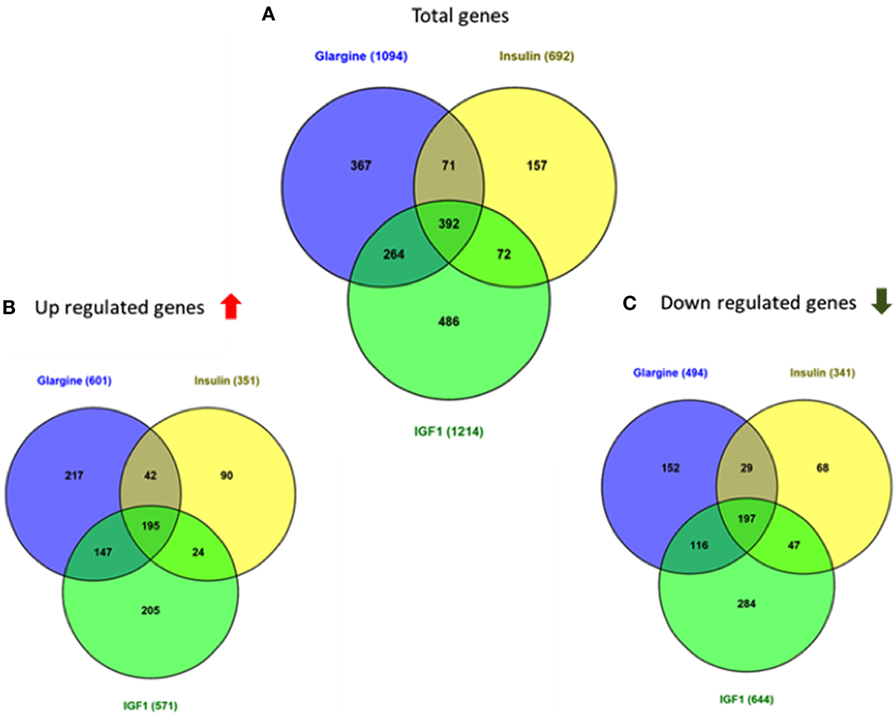
Figure 6. Venn diagrams showing the number of differentially expressed genes in response to glargine, insulin, or IGF1 in USPC-1 cells. (A) Number of total genes induced after IGF1, glargine, or insulin treatment; (B) number of genes up-regulated; (C) number of genes downregulated. The Venn diagram shows the number of genes uniquely expressed after response of the indicated treatment. The intersection of the circles shows the number of genes commonly expressed. The genes included in this analysis showed a 1.5-fold change in the expression compared to the control.
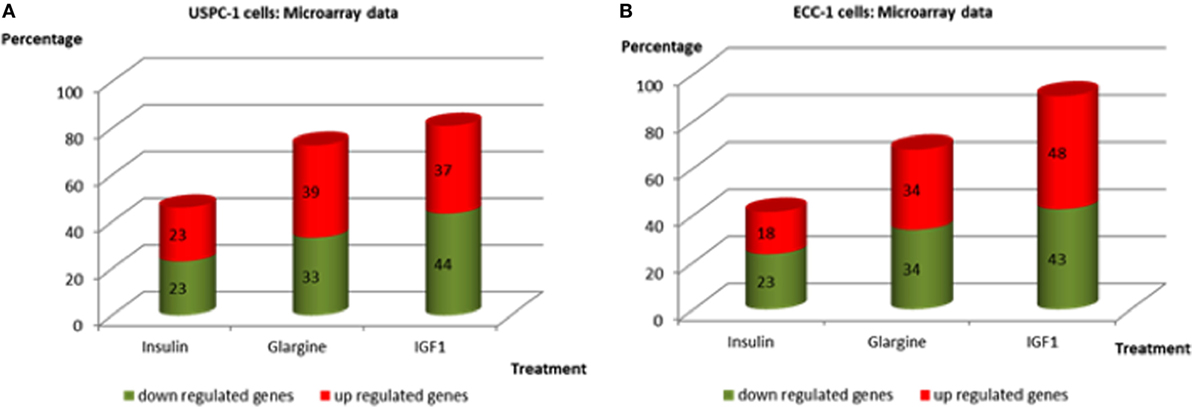
Figure 7. Commonly up- and downregulated genes by regular insulin, glargine, and IGF1 treatments in USPC-1 cells (A) and in ECC-1 cells (B). Comparison of common genes up- and downregulated by insulin, glargine, and IGF1 (in percentages) in both cell lines.
Microarray Data Validation
In order to validate the microarray results in ECC-1 and USPC-1 cells, changes in mRNA levels of four upregulated genes [cyclin E1 (CCNE1), FLNA, ornithine decarboxylase (ODC1), block of proliferation] and four downregulated genes [Erb-B2 receptor tyrosine kinase (ERBB3), insulin receptor (INSR), histone deacetylase-5 (HDAC5), insulin receptor substrate-2 (IRS2)], were quantified using RT-qPCR from new independent RNA samples after ligand treatment (8.6 nM, 8 h). These genes were associated with cell cycle, cellular assembly and organization, cell proliferation, cellular growth and development, and DNA synthesis and repair. RT-qPCR results confirmed the microarray data for two of the upregulated genes (FLNA, ODC1) (Figures 8A,B) and for the four downregulated genes (ERBB3, INSR, HDAC5, IRS2) (Figures 8C,D). RT-qPCR results of the BOP and CCNE1 genes did not support the microarray gene expression data. In contrast, we did not find correlation between microarray gene expression data and RT-qPCR values for upregulated genes in USPC-1 cells (data not shown). RT-qPCR results of downregulated genes in USPC-1 cells (HDAC5, INSR, and IRS2) confirmed the microarray data (Figure 9). The relatively poor validity may be explained by the fact that the USPC-1 experiment was performed on single replicates only.
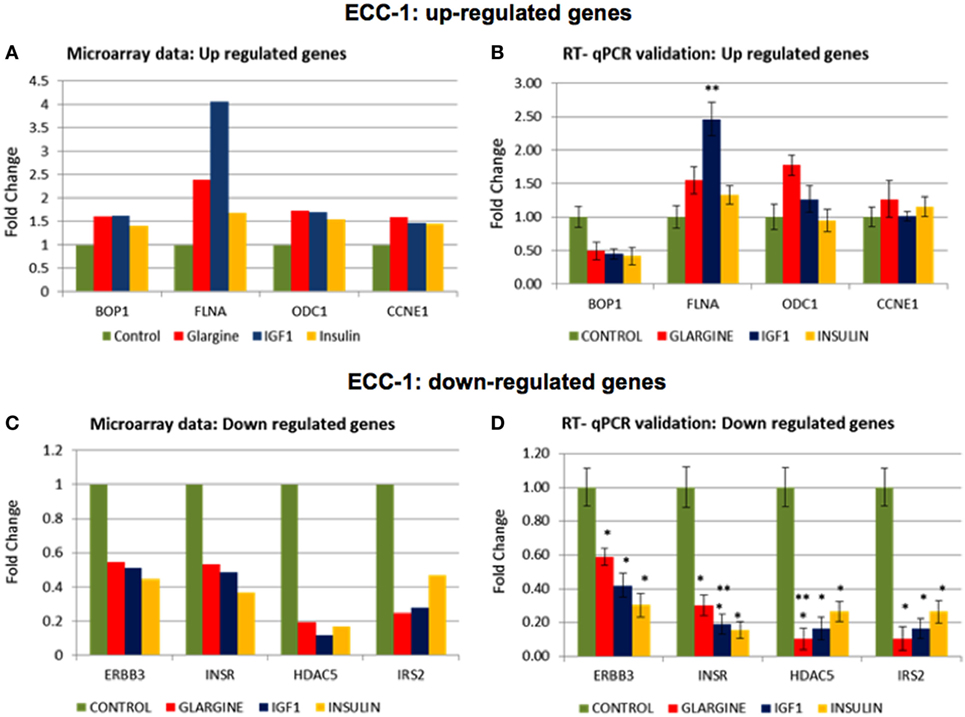
Figure 8. Real-time quantitative polymerase chain reactions (RT-qPCR) validation of the microarray data for selected up- and downregulated genes in ECC-1 cells. (A) Microarray results of four selected upregulated genes; (B) relative expression of the upregulated genes by RT-qPCR. (C) Microarray results of four selected downregulated genes; (D) relative expression of the downregulated genes by RT-qPCR. Lower fold-change values were obtained in the RT-qPCR validation compared to microarray assays. RT-qPCR was done in triplicate and the ratio was calculated relative to the reference gene actin. Statistical analysis was done by using Student’s test. *p < 0.05 insulin analogs vs. untreated cells; **p < 0.05 ligand vs. regular insulin.
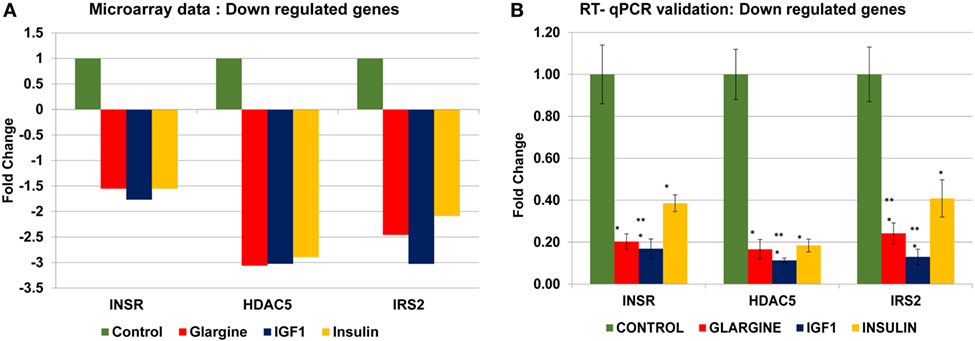
Figure 9. Real-time quantitative polymerase chain reactions (RT-qPCR) validation of the microarray data for selected downregulated genes in USPC-1 cells. (A) Microarray results of four selected downregulated genes; (B) relative expression of the downregulated genes by RT-qPCR. Lower values were obtained in the RT-qPCR validation compared to values obtained in the microarray assay. RT-qPCR was done in triplicate and the ratio was calculated relative to actin. *p < 0.05 insulin analogs vs. untreated cells; **p < 0.05 ligand vs. regular insulin. The y-axis represents fold changes.
Identification of FLNA As a Target for Insulin and IGF1 Action
The FLNA gene encodes an actin-binding protein involved in the cross-linking of actin filaments and membrane glycoproteins. The FLNA protein has an important role in remodeling the cytoskeleton with ensuing changes in cell shape and migration. In addition, FLNA interacts with transmembrane receptor complexes, integrins, and second messengers. As indicated above, the FLNA gene was identified as member of a cluster of 20 genes that exhibited the same differential expression following each treatment. Furthermore, among all validated candidate genes, FLNA displays the greatest fold-changes compared to untreated cells (4.05-FC for IGF1 treatment, 2.38 for glargine, and 1.68 for insulin) (Figure 10).
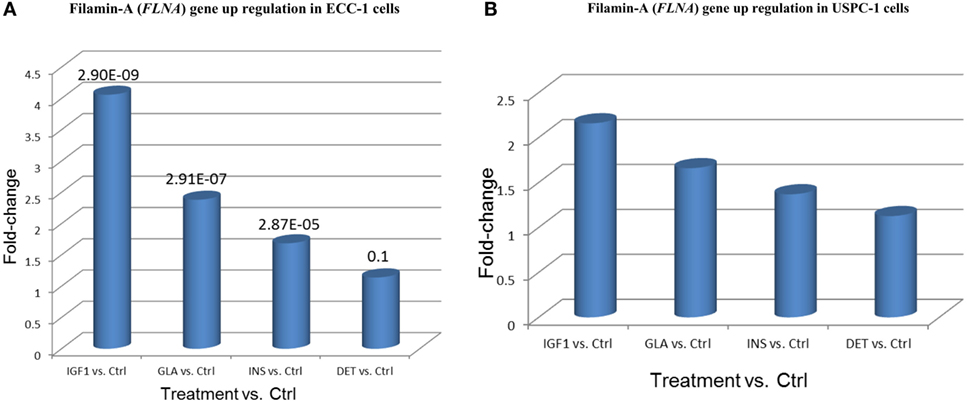
Figure 10. Filamin-A (FLNA) gene upregulation in (A) ECC-1 and (B) USPC-1 cells. Starved ECC-1 (A) and USPC-1 (B) cells were treated with IGF1, glargine, insulin, or detemir at a dose of 8.6 nM for 24 h, after which, RNA was prepared and FLNA gene expression was measured as described in Section “Materials and Methods.” Results are expressed as fold-changes compared to untreated cells.
To validate the reliability of the microarray and RT-qPCR data regarding FLNA, we next analyzed FLNA protein expression by Western immunoblots. To this end, USPC-1 and ECC-1 cells were treated with glargine, detemir, IGF1, or insulin for 10 min or 8 h, after which, levels of total and phosphorylated FLNA were measured. As depicted in Figures 11A,B, treatment with all four ligands led to substantial increases in phosphorylated FLNA levels after 10 min, with a similar pattern in both cell lines. Interestingly, IGF1 induced the highest increase in FLNA phosphorylation (1.6-fold in USPC-1 cells and 2-fold in ECC-1 cells). Treatment with glargine or insulin induced similar levels of FLNA phosphorylation (approximately 1.5-fold increase in USPC-1 cells and 1.9-fold increase in ECC-1 cells) in both cell lines. Of interest, detemir stimulated FLNA phosphorylation in ECC-1 cells similarly to the other hormones. Increases in phosphorylation were also seen at 8 h (Figures 11C,D).
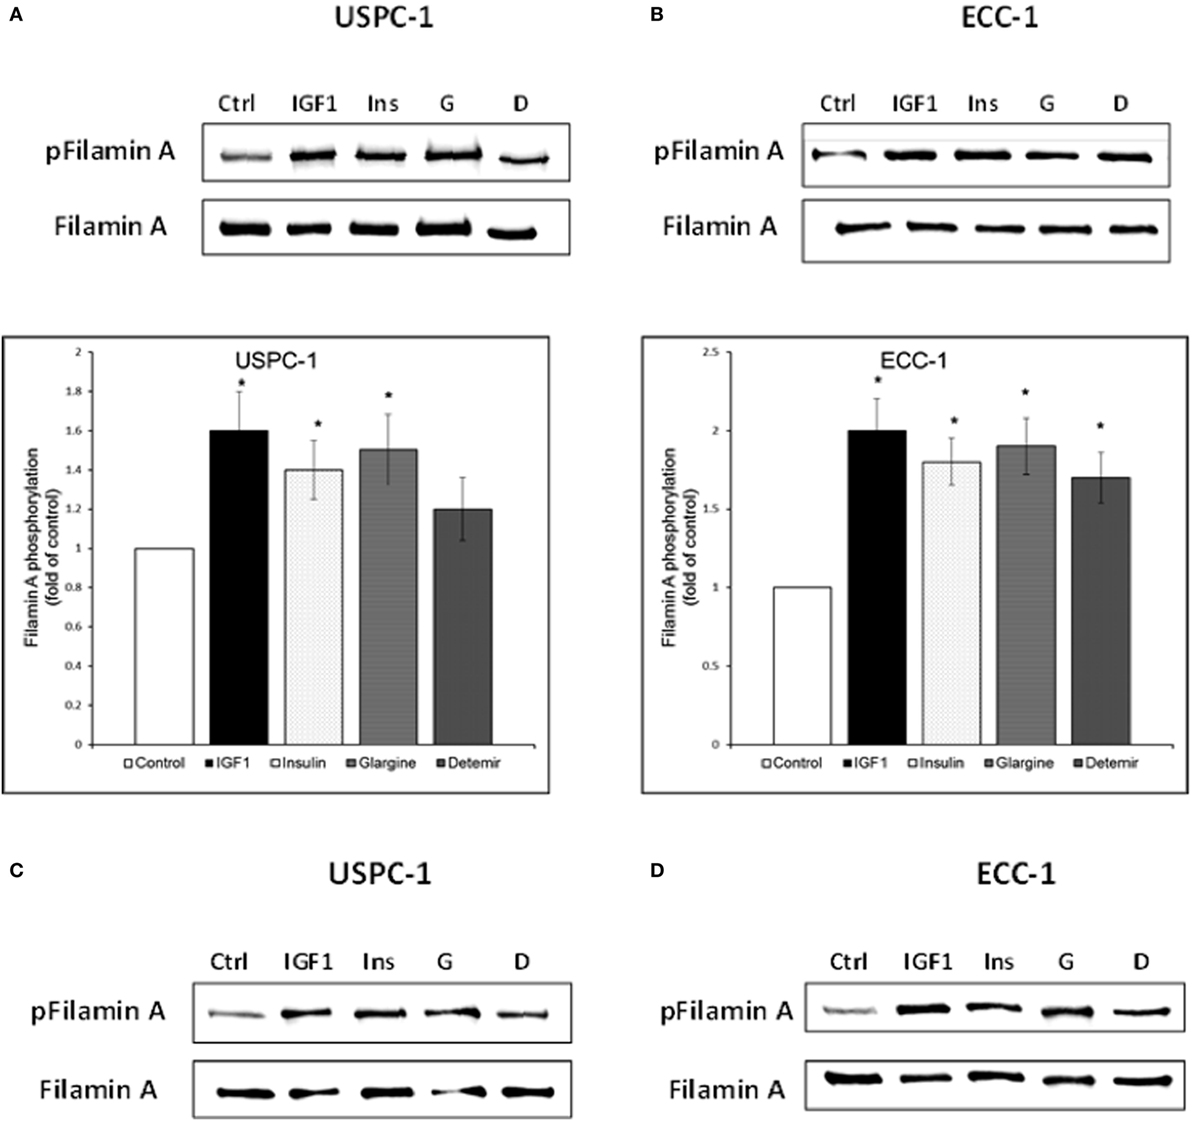
Figure 11. Filamin-A (FLNA) phosphorylation by insulin-like hormones. Starved USPC-1 and ECC-1 cells were treated with IGF1, insulin, glargine, or detemir at a dose of 50 ng/ml for 10 min (A,B), or 8 h (C,D). Cells were lysed and extracts (100 µg) were electrophoresed and immunoblotted with antibodies against phospho-filamin-A. Membranes were stripped and incubated with antibodies against total FLNA. Fold of control was obtained by normalizing levels of the phospho-protein by total protein levels and then comparing with untreated cells. Bar graphs represent three independent experiments; *p < 0.05, ligand-treated vs. untreated.
Silencing Experiments
Evidence has been presented showing that FLNA has an important role in mammalian cell locomotion (17). The potential hormonal regulation of this process has not yet been investigated. Given that IGF1, insulin, and analogs were shown to phosphorylate FLNA, we postulated that hormonal activation of FLNA might have a key role in cell migration. To evaluate this hypothesis, we silenced FLNA by transfecting ECC-1 cells with a FLNA-specific siRNA (siFLNA), or control scramble sequence (siCtrl), followed by ligand (17.2 nM) treatment for 60 h. Western blots indicated that siFLNA transfection markedly reduced FLNA protein levels (Figure 12). Cell migration measurements showed that ligand treatment increased ECC-1 cells migration compared to controls. A marked reduction in migration was observed in siFLNA-transfected, compared to siCtrl, cells. Thus, total wound closure was seen after 60 h in control cells treated with insulin, IGF1, or glargine (Figures 13B,D). On the other hand, a strong inhibition of ligand-induced migration was observed in cells with a silenced FLNA (Figures 13A,C). These results indicate that (1) FLNA is an important regulator of cell migration; and (2) all four ligands tested stimulated FLNA activation.
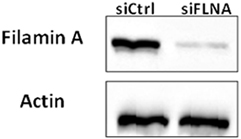
Figure 12. Western blot analysis of FLNA expression in FLNA-silenced cells. ECC-1 cells were transfected with 10 µM control siRNA (siCtrl) or FLNA siRNA (siFLNA) for 96 h. Cells were lysed and extracts (100 µg) were electrophoresed and immunoblotted with an antibody against FLNA. Actin levels were measured as a loading control. The figure shows the results of a typical experiment, repeated three times with similar results.
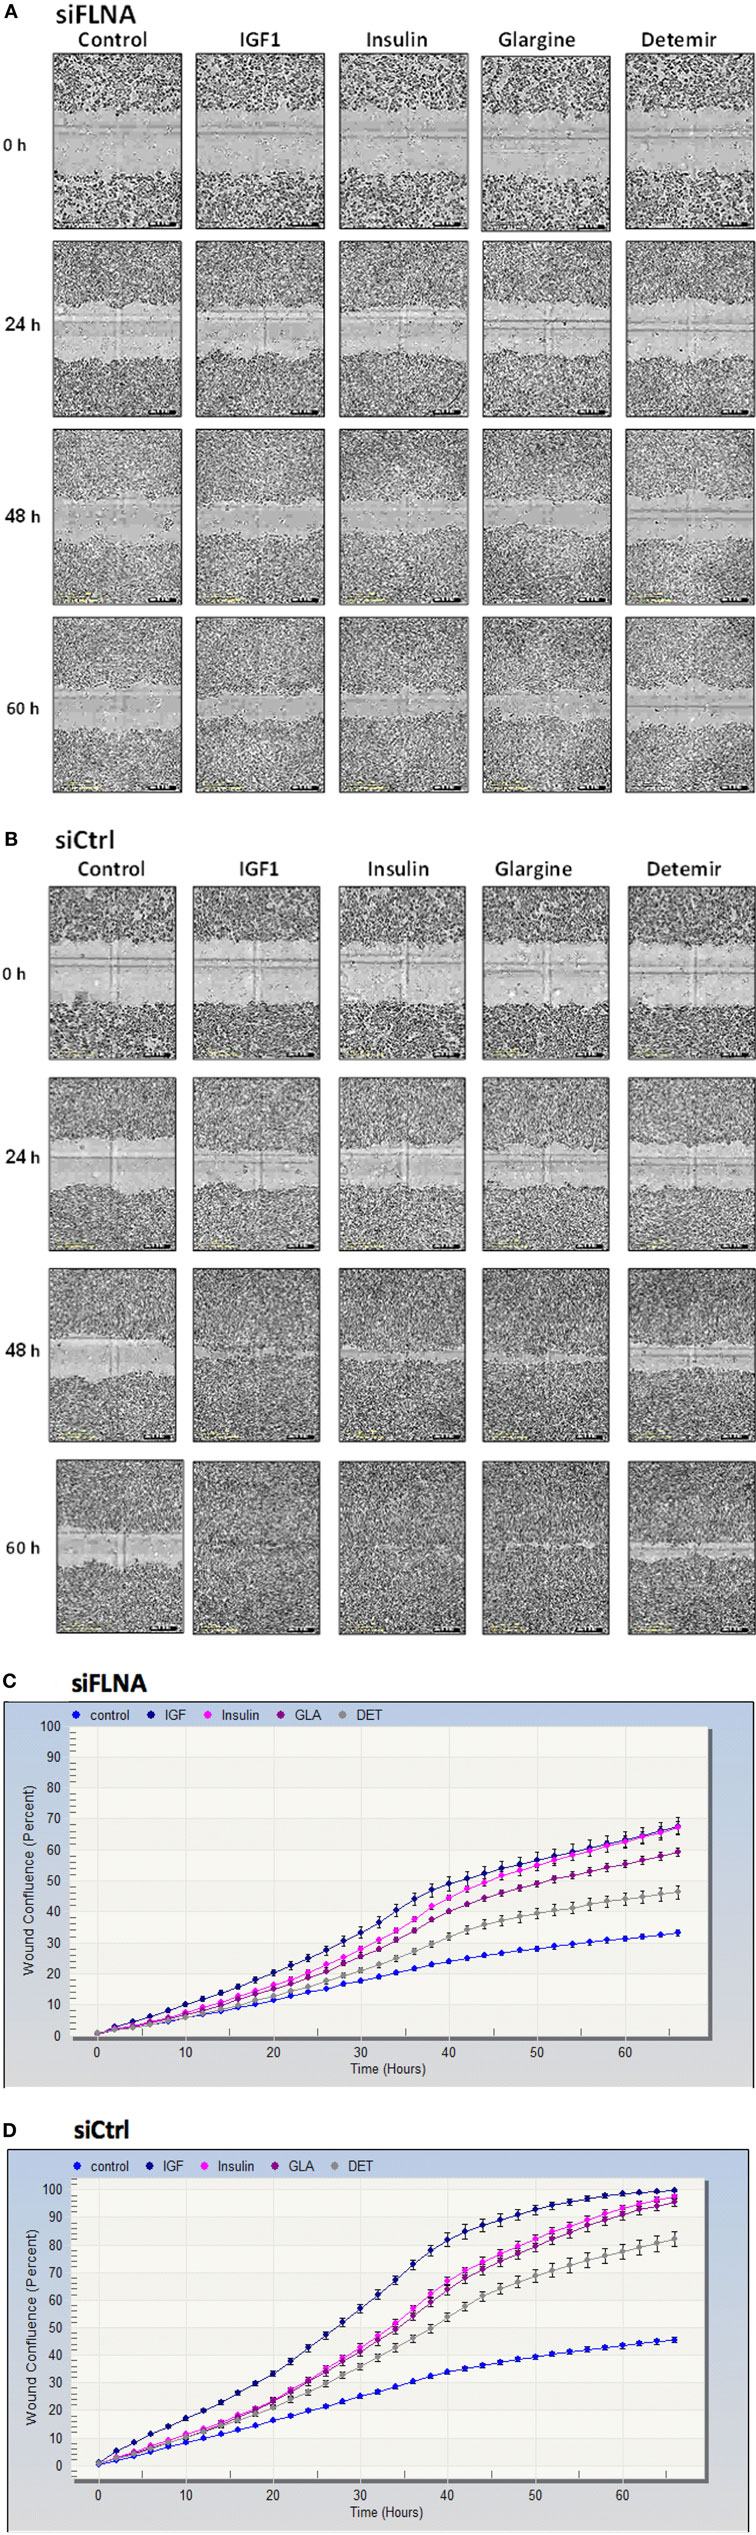
Figure 13. Cell migration measurement in FLNA-silenced cells. Cell migration assays were performed in ECC-1 cells transfected with 10 µM siFLNA (or siCtrl), as described in Section “Materials and Methods.” Cells were scratch wounded and monitored to determine the rate of migration into the scratched area. Representative images indicate areas of the scratch wound that are occupied by ECC-1 cells transfected with siFLNA (A) or siCtrl (B), at 0 (initial scratch), 24, 48, and 60 h post-wounding. Results were plotted in terms of percentage wound confluence as a function of time (C,D). Data are expressed as mean ± SD, n = 10.
Discussion
The introduction of insulin analogs in the last decades had a great impact in the area of diabetes. The higher stability, reduced variability and, importantly, selective action of insulin analogs led to an increase in individualized treatment strategies targeted to specific patient needs. In general terms, advances resulted in improvement in glycemic control and diabetes therapy (18–20). However, modifications in the insulin molecule may change the affinities of the analogs for INSR and IGF1R as well as their intracellular signaling and biological effects (21). Hence, the long-term benefit of some of the new insulin analogs has been questionated.
In recent years, the medical literature has become aware that the use of some long-acting analogs was correlated with an apparent increase in cancer risk. Specifically, large-scale epidemiological studies published in 2009 raised the concern that insulin analogs, especially glargine, might increase breast cancer risk (22–26). Some of these analyses, however, have been criticized on the basis of study design (27, 28). These controversies emphasize the need for more clinical and basic research to clarify this issue. In view of flaws in study design and analyses of these “first generation” studies, “second generation” studies emerged with more robust pharmaco-epidemiological analyses (29). Out of five “second generation” studies, only one observed a significantly increased breast cancer risk associated with high cumulative exposure to glargine (30–34). However, all studies lacked sufficient follow-up to robustly estimate cancer risk. Until now, there is no epidemiological and animal evidence that any clinically available insulin analog, nor human insulin, increases breast cancer risk. In any case, several studies have suggested that although insulin treatment was not involved in breast tumor initiation, it might induce tumor progression by upregulating mitogenic pathways.
In the present study, microarray analysis revealed alterations in genes and cancer-associated pathways following ligand stimulation. Indeed, hierarchical cluster analysis identified 298 and 3,000 differentially expressed genes in ECC-1 and USPC-1 cells lines, respectively. Our analyses revealed that IGF1, insulin, and glargine stimulate overlapping genes (88 genes in ECC-1 cells and 392 in USPC-1 cells), as well as specific gene expression responses. Furthermore, we showed that most signaling pathways activated by the ligands are involved in cell cycle progression, proliferation, apoptosis, and cell migration. Of interest, we provide evidence that each ligand specifically regulated a group of genes that was not regulated by the other two ligands. For example, in ECC-1 cells, we observed that 83 genes were significantly induced by IGF1 whereas 31 genes and 14 genes were specifically regulated by glargine and insulin, respectively. These results demonstrate that glargine activates distinct sets of genes that are associated to specific pathways that are not necessarily activated by IGF1 or insulin. Moreover, we showed the same percentage of up- and downregulated commons genes in ECC-1 and USPC-1 cells lines after treatment with insulin, glargine, or IGF1.
For the most part, RT-qPCR validation experiments confirmed that the microarray data identified changes in gene expression mediated by these ligands. Validated genes are involved in various cellular functions, including cytoskeleton remodeling and migration (FLNA), biosynthetic pathways (ODC1), cell proliferation (ERBB3), cytoplasmic insulin signaling (INSR, IRS2), and cell cycle progression and developmental events (HDAC5).
Global gene expression changes following IGF1 or insulin treatment have been examined in multiple mouse and human cell lines (35–38). Dupont et al. (35) evaluated the IGF1-induced global gene expression in mouse NIH-3T3 fibroblasts overexpressing either IGF1R or INSR in an attempt to understand how insulin and IGF1 can signal through the same post-receptor signaling pathways, yet mediate distinct biological functions. They found that 30 out of 2,221 genes were significantly induced by IGF1 but not by regular insulin; most of these genes were associated with mitogenesis and differentiation. Similarly to our study, Dupont et al. found that IGF1 appeared to have a greater stimulatory effect on transcription regulation than insulin.
Our microarray analysis identified FLNA as one of the most significantly upregulated genes induced by glargine, IGF1, or insulin in the ECC-1 cell line. FLNA was initially identified as an actin filament cross-linking protein that also interacts with integrins and a number of cytoskeleton remodeling proteins (39). FLNA’s importance in cellular adhesion and migration makes it a critical player in cancer invasion and metastasis (40, 41). Moreover, FLNA functions as a scaffold for about 90 binding partners and is involved in many cellular functions, including cell signaling, motility, angiogenesis, phosphorylation, proteolysis, transcription, receptor activation, muscle development, etc. (42–44). Of importance, FLNA anchors the GTPases to the cell membrane. Western blots revealed that FLNA is basally expressed in both ECC-1 and USPC-1 endometrial cancer cells. This finding is in accordance with Brown and Binder (45), who reported high filamin expression in uterus, among other organs. Furthermore, our results are in line with the fact that FLNA is overexpressed in multiple types of cancer (41).
The biological actions of insulin are associated with a rapid and efficient reorganization of the cytoskeleton. The specific effect of FLNA on insulin-mediated signaling events is still unknown. Further, limited information is available regarding the question whether insulin analogs are also capable of regulating the key processes of tumor cell motility, invasion, and metastasis. We and others have reported that glargine is a potent activator of protein kinase Akt in endometrial cancer cell lines (16). Evidence has suggested that Akt can not only provide the cells with growth advantages by eliciting proliferative or antiapoptotic signals but also engage with motility of the cells through regulating actin stress fiber assembly (46). Thus, it is possible that glargine participates in tumor cell migration through Akt activation and subsequent FLNA phosphorylation.
In summary, we have identified FLNA as a novel target for insulin-like hormones, including glargine. Further studies will dissect the physical and functional interactions between insulin-like hormones and FLNA, and the impact of these interactions on endometrial cancer motility, invasion, and metastasis. Likewise, it will be of interest to examine the biological roles played by the other genes identified by genomic tools in the specific context of the IGF1R and INSR pathways.
Author Contributions
DA, IB, and HW conceived of and designed the experiments. The experimental procedures were performed by DA and RS and were analyzed by DA, MP-C, and HW. HW and ZL prepared the manuscript.
Conflict of Interest Statement
The authors declare that there is no conflict of interest that could be perceived as prejudicing the impartiality of the research reported.
Acknowledgments
The authors wish to express their gratitude to the Insulin-Dependent Diabetes Trust (IDDT), Northampton, U.K., for their generous support. DA performed this work in partial fulfillment of the requirements for a Ph.D. degree at the Sackler Faculty of Medicine, Tel Aviv University. HW is the incumbent of the Lady Davis Chair in Biochemistry.
Funding
This work was funded by a grant from the Insulin Dependent Diabetes Trust (IDDT), Northampton, U.K.
References
1. Vajo Z, Fawcett J, Duckworth WC. Recombinant DNA technology in the treatment of diabetes: insulin analogs. Endocr Rev (2001) 22:706–17. doi:10.1210/edrv.22.5.0442
2. Mathieu C, Gillard P, Benhalima K. Insulin analogues in type 1 diabetes mellitus: getting better all the time. Nat Rev Endocrinol (2017) 13:385–99. doi:10.1038/nrendo.2017.39
3. Cahn A, Miccoli R, Dardano A, Del Prato S. New forms of insulin and insulin therapies for the treatment of type 2 diabetes. Lancet Diabetes Endocrinol (2015) 3:638–52. doi:10.1016/S2213-8587(15)00097-2
4. Werner H, Weinstein D, Yehezkel E, Laron Z. Controversies in the use of insulin analogues. Expert Opin Biol Ther (2011) 11:199–209. doi:10.1517/14712598.2011.540233
5. Werner H, Weinstein D, Bentov I. Similarities and differences between insulin and IGF-I: structures, receptors, and signaling pathways. Arch Physiol Biochem (2008) 114:17–22. doi:10.1080/13813450801900694
6. LeRoith D, Yakar S. Mechanisms of disease: metabolic effects of growth hormone and insulin-like growth factor-1. Nat Clin Pract Endocrinol Metab (2007) 3:302–10. doi:10.1038/ncpendmet0427
7. Weinstein D, Simon M, Yehezkel E, Laron Z, Werner H. Insulin analogues display IGF-I-like mitogenic and antiapoptotic activities in cultured cancer cells. Diabetes Metab Res Rev (2009) 25:41–9. doi:10.1002/dmrr.912
8. Yehezkel E, Weinstein D, Simon M, Sarfstein R, Laron Z, Werner H. Long-acting insulin analogues elicit atypical signalling events mediated by the insulin receptor and insulin-like growth factor-I receptor. Diabetologia (2010) 53:2667–75. doi:10.1007/s00125-010-1899-1
9. Kurtzhals P, Schaffer L, Sorensen A, Kristensen C, Jonassen I, Schmid C, et al. Correlations of receptor binding and metabolic and mitogenic potencies of insulin analogs designed for clinical use. Diabetes (2000) 49:999–1005. doi:10.2337/diabetes.49.6.999
10. Hansen BF. Insulin analogues with increased mitogenic potency-are they safe? Horm Metab Res (2008) 40:431–3. doi:10.1055/s-2008-1062740
11. LeRoith D. Insulin glargine and receptor-mediated signalling: clinical implications in treating type 2 diabetes. Diabetes Metab Res Rev (2008) 23:593–9. doi:10.1002/dmrr.776
12. Werner H, Chantelau EA. Differences in bioactivity between human insulin and insulin analogues approved for therapeutic use compilation of reports from the past 20 years. Diabetol Metab Syndr (2011) 3:13. doi:10.1186/1758-5996-3-13
13. Siegel RL, Miller KD, Jemal A. Cancer statistics, 2016. CA Cancer J Clin (2016) 66:7–30. doi:10.3322/caac.21332
14. Lax SF. Molecular genetic pathways in various types of endometrial carcinoma: from a phenotypical to a molecular-based classification. Virchows Arch (2004) 444:213–23. doi:10.1007/s00428-003-0947-3
15. Kaaks R, Lukanova A, Kurzer MS. Obesity, endogenous hormones, and endometrial cancer risk: a synthetic review. Cancer Epidemiol Biomarkers Prev (2002) 11:1531–43.
16. Aizen D, Sarfstein R, Bruchim I, Weinstein D, Laron Z, Werner H. Proliferative and signaling activities of insulin analogues in endometrial cancer cells. Mol Cell Endocrinol (2015) 406:27–39. doi:10.1016/j.mce.2015.02.011
17. Zhou AX, Hartwig JH, Akyürek LM. Filamins in cell signaling, transcription and organ development. Trends Cell Biol (2010) 130:113–23. doi:10.1016/j.tcb.2009.12.001
19. Crotty S, Reynolds SL. The new insulins. Pediatr Emerg Care (2007) 23:903–5. doi:10.1097/pec.0b013e31816121ba
20. Bolli GB. Rational use of insulin analogues in the treatment of type 1 diabetes mellitus. Pediatr Endocrinol Rev (2003) 1:9–21.
21. Shukla A, Grisouard J, Ehemann V, Hermani A, Enzmann H, Mayer D. Analysis of signaling pathways related to cell proliferation stimulated by insulin analogs in human mammary epithelial cell lines. Endocr Relat Cancer (2009) 16:429–41. doi:10.1677/ERC-08-0240
22. Butler PC. Insulin glargine controversy: a tribute to the editorial team at diabetologia. Diabetes (2009) 58:2427–8. doi:10.2337/db09-9030
23. Colhoun HM; SDRN Epidemiology Group. Use of insulin glargine and cancer incidence in Scotland: a study from the Scottish Diabetes Research Network Epidemiology group. Diabetologia (2009) 52:1755–65. doi:10.1007/s00125-009-1453-1
24. Currie CJ, Poole CD, Gale EA. The influence of glucose-lowering therapies on cancer risk in type 2 diabetes. Diabetologia (2009) 52:1766–77. doi:10.1007/s00125-009-1440-6
25. Hemkens LG, Grouven U, Bender R, Günster C, Gutschmidt S, Selke GW, et al. Risk of malignancies in patients with diabetes treated with human insulin or insulin analogues: a cohort study. Diabetologia (2009) 52:1732–44. doi:10.1007/s00125-009-1418-4
26. Jonasson JM, Ljung R, Talbäck M, Haglund B, Gudbjörnsdòttir S, Steineck G. Insulin glargine use and short-term incidence of malignancies-a population-based follow-up study in Sweden. Diabetologia (2009) 52:1745–54. doi:10.1007/s00125-009-1444-2
27. Dejgaard A, Lynggaard H, Råstam J, Krogsgaard Thomsen M. No evidence of increased risk of malignancies in patients with diabetes treated with insulin detemir: a meta-analysis. Diabetologia (2009) 52:2507–12. doi:10.1007/s00125-009-1568-4
28. Pocock SJ, Smeeth L. Insulin glargine and malignancy: an unwarranted alarm. Lancet (2009) 374:511–3. doi:10.1016/S0140-6736(09)61307-6
29. Renehan AG. Insulin analogues and cancer risk: the emergence of second-generation studies. Diabetologia (2012) 55:7–9. doi:10.1007/s00125-011-2352-9
30. Suissa S, Azoulay L, Dell’Aniello S, Evans M, Vora J, Pollak M. Long-term effects of insulin glargine on the risk of breast cancer. Diabetologia (2011) 54:2254–62. doi:10.1007/s00125-011-2190-9
31. Habel LA, Danforth KN, Quesenberry CP, Capra A, Van Den Eeden SK, Weiss NS, et al. Cohort study of insulin glargine and risk of breast, prostate, and colorectal cancer among patients with diabetes. Diabetes Care (2013) 36:3953–60. doi:10.2337/dc13-0140
32. Stürmer T, Marquis MA, Zhou H, Meigs JB, Lim S, Blonde L, et al. Cancer incidence among those initiating insulin therapy with glargine versus human NPH insulin. Diabetes Care (2013) 36:3517–25. doi:10.2337/dc13-0263
33. Fagot JP, Blotière PO, Ricordeau P, Weill A, Alla F, Allemand H. Does insulin glargine increase the risk of cancer compared with other basal insulins? A French nationwide cohort study based on national administrative databases. Diabetes Care (2013) 36:294–301. doi:10.2337/dc12-0506
34. Lim S, Stember KG, He W, Bianca PC, Yelibi C, Marquis A, et al. Electronic medical record cancer incidence over six years comparing new users of glargine with new users of NPH insulin. PLoS One (2014) 9:e109433. doi:10.1371/journal.pone.0109433
35. Dupont J, Khan J, Qu BH, Metzler P, Helman L, LeRoith D. Insulin and IGF-1 induce different patterns of gene expression in mouse fibroblast NIH-3T3 cells: identification by cDNA microarray analysis. Endocrinology (2001) 142:4969–75. doi:10.1210/endo.142.11.8476
36. Pandini G, Medico E, Conte E, Sciacca L, Vigneri R, Belfiore A. Differential gene expression induced by insulin and insulin-like growth factor-II through the insulin receptor isoform A. J Biol Chem (2003) 278:42178–89. doi:10.1074/jbc.M304980200
37. Mulligan C, Rochford J, Denyer G, Stephens R, Yeo G, Freeman T, et al. Microarray analysis of insulin and insulin-like growth factor-1 (IGF-1) receptor signaling reveals the selective up-regulation of the mitogen heparin-binding EGF-like growth factor by IGF-1. J Biol Chem (2002) 277:42480–7. doi:10.1074/jbc.M206206200
38. Werner H, Bruchim I. Basic and clinical significance of IGF-1-induced signatures in cancer. BMC Med (2010) 8:2. doi:10.1186/1741-7015-8-2
39. Wickstead B, Gull K. The evolution of the cytoskeleton. J Cell Biol (2011) 194:513–25. doi:10.1083/jcb.201102065
40. Shao QQ, Zhang TP, Zhao WJ, Liu ZW, You L, Zhou L, et al. Filamin-A: insights into its exact role in cancers. Pathol Oncol Res (2016) 22:245–52. doi:10.1007/s12253-015-9980-1
41. Savoy RM, Ghosh PM. The dual role of filamin-A in cancer: can’t live with (too much of) it, can’t live without it. Endocr Relat Cancer (2013) 20:R341–56. doi:10.1530/ERC-13-0364
42. Lian G, Lu J, Hu J, Zhang J, Cross SH, Ferland RJ, et al. Filamin a regulates neural progenitor proliferation and cortical size through Wee1-dependent Cdk1 phosphorylation. J Neurosci (2012) 32:7672–84. doi:10.1523/JNEUROSCI.0894-12.2012
43. Yue J, Wang Q, Lu H, Brenneman M, Fan F, Shen Z. The cytoskeleton protein filamin-A is required for an efficient recombinational DNA double strand break repair. Cancer Res (2009) 69:7978–85. doi:10.1158/0008-5472.CAN-09-2177
44. Uramoto H, Akyürek LM, Hanagiri T. A positive relationship between filamin and VEGF in patients with lung cancer. Anticancer Res (2010) 30:3939–44.
45. Brown KD, Binder LI. Expression of the cytoskeletal-associated protein filamin in adult rat organs. Exp Cell Res (1993) 209:325–32. doi:10.1006/excr.1993.1317
Keywords: insulin-like growth factor-1, insulin analogues, endometrial cancer, microarray analysis, filamin-A
Citation: Aizen D, Pasmanik-Chor M, Sarfstein R, Laron Z, Bruchim I and Werner H (2018) Genome-Wide Analyses Identify Filamin-A As a Novel Downstream Target for Insulin and IGF1 Action. Front. Endocrinol. 9:105. doi: 10.3389/fendo.2018.00105
Received: 24 December 2017; Accepted: 02 March 2018;
Published: 20 March 2018
Edited by:
Andreas Hoeflich, Leibniz-Institut für Nutztierbiologie (FBN), GermanyReviewed by:
Leonard Girnita, Karolinska Institute (KI), SwedenMichael Danilenko, Ben-Gurion University of the Negev, Israel
Copyright: © 2018 Aizen, Pasmanik-Chor, Sarfstein, Laron, Bruchim and Werner. This is an open-access article distributed under the terms of the Creative Commons Attribution License (CC BY). The use, distribution or reproduction in other forums is permitted, provided the original author(s) and the copyright owner are credited and that the original publication in this journal is cited, in accordance with accepted academic practice. No use, distribution or reproduction is permitted which does not comply with these terms.
*Correspondence: Haim Werner, aHdlcm5lckBwb3N0LnRhdS5hYy5pbA==