 Karla A. Temple1,2
 Rachel Leproult1,2Lisa Morselli1,3David A. Ehrmann1,2
 Eve Van Cauter1,2
 Babak Mokhlesi1,4*
- 1Department of Medicine, Sleep, Metabolism and Health Center, University of Chicago, Chicago, IL, United States
- 2Section of Endocrinology, Diabetes and Metabolism, Department of Medicine, University of Chicago, Chicago, IL, United States
- 3Division of Endocrinology and Metabolism, Department of Internal Medicine, University of Iowa Carver College of Medicine, Iowa City, IA, United States
- 4Section of Pulmonary and Critical Care, Department of Medicine, Sleep Disorders Center, University of Chicago, Chicago, IL, United States
Objectives: Obstructive sleep apnea (OSA) is more prevalent in men and is an independent risk factor for type 2 diabetes. We aimed to determine if there are sex differences in the impact of OSA on glucose metabolism in nondiabetic overweight and obese adults.
Methods: One hundred and forty-five men and women (age 33.4 ± 0.6, BMI 37.2 ± 0.7, 70.3% blacks) from the community underwent in-laboratory polysomnography. Severity of OSA was assessed by the apnea-hypopnea index (AHI). Glucose tolerance was assessed using fasting glucose, 1-h glucose, 2-h glucose and the area under the curve (AUC) during the 2-h oral glucose tolerance test (OGTT). Fasting insulin resistance was assessed by HOMA-IR, and insulin sensitivity during the OGTT was assessed by the Matsuda Index. Pancreatic beta-cell function was assessed by fasting HOMA-%B and by AUCinsulin/glucose, insulinogenic index, and oral disposition index (DIoral) during the OGTT. All comparisons were adjusted for age, BMI, race and severity of OSA.
Results: There were no significant demographic differences between men and women without OSA. Men and women with OSA were similar in age, BMI, and severity of OSA, but there were more black women with OSA. Compared to women with OSA, men with OSA had significantly higher fasting glucose, 1-h glucose levels, AUCglucose, and AUC for insulin secretion rate (AUCISR) but similar 2-h glucose levels. These differences persisted in adjusted analyses. Men with OSA secreted significantly more insulin than women with OSA in order to achieve similar glucose levels. Men with OSA had significantly worse beta cell function as measured by the DIoral than women with OSA. In contrast, there were no significant sex differences in measures of glucose tolerance and beta-cell function in participants without OSA.
Conclusion: Men with OSA secreted more insulin compared to women with OSA in order to maintain glucose homeostasis. The adverse impact of OSA on beta-cell responsiveness was larger in men, which may result in an overall greater risk of type 2 diabetes compared to women.
Introduction
Type 2 diabetes affects nearly 30 million individuals or 9.4% of the US population with an estimated 1.5 million new cases per year. Even more alarming is the significant increase in the prevalence of prediabetes (impaired fasting glucose and/or impaired glucose tolerance), an intermediate state between normal glucose tolerance and overt diabetes. According to the Centers for Disease Control and Prevention, the number of American adults with prediabetes increased from 57 million in 2008 to 84 million in 2015 (1). Undoubtedly the high prevalence of obesity has played a pivotal role in this epidemic. In parallel, the obesity epidemic has also resulted in an increased prevalence of obstructive sleep apnea (OSA) in the general population (2, 3).
Several clinic-based and community-based cross-sectional studies have found a robust association between the presence and severity of OSA—as measured by the apnea-hypopnea index or AHI—and insulin resistance in both men and women, independent of age and various measures of adiposity (4–10). A recent meta-analysis of 9 longitudinal studies that included 64,101 participants, with follow up ranging from 2.7 to 12.8 years, revealed that OSA is associated with incident type 2 diabetes with an adjusted pooled relative risk of 1.35 (95% CI, 1.24–1.47) (11). However, the sex-specific difference of the impact of OSA on glucose metabolism remains mostly unexplored. To that end, we aimed to quantify the impact of OSA on glucose tolerance, insulin sensitivity, beta-cell responsiveness and diabetes risk in a community-based cohort of overweight and obese men and women without diabetes.
Methods
Participants
Subjects were recruited using flyers and public advertisement. The flyer requested healthy obese men and women between ages 18–50 to volunteer for a research study related to sleep and metabolism. Interested participants who called in to the recruitment phone line underwent a brief phone screen to assess eligibility for the study. Eligible participants were admitted to the University of Chicago General Clinical Resource Center. All subjects were between 18 and 50 years of age, with a body mass index (BMI) >25 kg/m2, and free of psychiatric, endocrine and cardiovascular disorders except for well-controlled hypothyroidism and hypertension. Sleep complaints or symptoms of OSA were not used as selection criteria for the study. Shift workers, subjects with chronic insomnia, and subjects with self-reported habitual sleep duration of <6.5 h per night or more than 9 h per night as well as any subjects with diagnosis of a sleep disorder other than OSA were excluded. Other exclusion criteria included any prior or current treatment for OSA (upper airway surgery, CPAP therapy, oral appliances or supplemental oxygen), active cigarette smoking, habitual alcohol intake above 2 drinks per day, previous diagnosis of type 2 diabetes, use of antihypertensives that impact sleep or glucose metabolism (e.g., thiazide diuretics and beta blockers), caffeine intake above 300 mg per day, pregnancy, and women taking hormonal therapy. We also excluded post-menopausal women and women with established diagnosis of polycystic ovary syndrome (PCOS) or suspicion of PCOS based on hyperandrogenemia. All study participants gave written informed consent prior to participating in this study. This study was approved by the University of Chicago Institutional Review Board, and was conducted in accordance with the Declaration of Helsinki.
Consented subjects had a physical examination, and a complete medical history was obtained. Height and weight were measured in all participants on the night of the polysomnography (PSG). Race was self-reported and categorized as non-Hispanic white or black. Subjects had an overnight in-laboratory PSG to assess the presence and severity of OSA. The following morning, a standard 75-g oral glucose tolerance test (OGTT) was performed to measure glucose tolerance and insulin sensitivity.
Polysomnography
Subjects were admitted to the University of Chicago Clinical Resource Center (CRC) and underwent an overnight in-laboratory PSG. Lights were turned off at 11 pm and turned on at 7 am. The PSG (Neurofax EEG 1100 system; Nihon Kohden, Foothill Ranch, CA) included recordings of six electroencephalogram channels, bilateral electro-oculograms, chin and tibialis electromyogram, electrocardiogram, airflow by nasal pressure transducer and oronasal thermocouples, chest and abdominal wall motion by piezo electrodes, and oxygen saturation by pulse oximeter. All PSGs were staged and scored according to the 2007 American Academy of Sleep Medicine Manual for the Scoring of Sleep and Related Events (12). Apneas were defined as total cessation of airflow for at least 10 s (obstructive if respiratory effort was present and central if respiratory effort was absent). Hypopneas were scored if the magnitude of ventilation signal decreased by at least 50% of the baseline amplitude of the nasal pressure transducer for at least 10 s and were associated with either a 3% or greater drop in oxygen saturation as measured by finger pulse oximetry, or an electroencephalographic microarousal (12). AHI was defined as the total number of obstructive apneas and obstructive hypopneas per hour of sleep. Severity of OSA was measured by the AHI. A subject was considered not to have OSA if the AHI was <5, to have mild OSA if the AHI was 5–14, moderate OSA if the AHI was 15–29, and severe OSA if the AHI was ≥30. The oxygen desaturation index (ODI) was defined as the total number of oxygen desaturations of at least 3% per total sleep time (TST) in hours. The microarousal index (MAI) was calculated as the total number of microarousals per hour of sleep.
Oral Glucose Tolerance Test (OGTT)
After a 12-h overnight fast, an intravenous catheter was placed into an antecubital vein for blood drawing. Baseline blood samples were drawn at −15 and 0 min for measurement of glucose, insulin, and C-peptide concentrations. At time 0 min, subjects consumed a 75-g glucose beverage over a period not to exceed 5 min. Subsequent blood samples were drawn at 30, 60, 90, and 120 min for measurement of glucose, insulin, and C-peptide concentrations. If the fasting glucose concentration was ≥100 mg/dl but <126 mg/dl, a diagnosis of impaired fasting glucose (IFG) was assigned; a fasting glucose concentration >126 mg/dl was diagnostic of type 2 diabetes. The glucose concentration post-2h glucose challenge was used to diagnose normal glucose tolerance (<140 mg/dL), impaired glucose tolerance (IGT; 140–199 mg/dl) and type 2 diabetes ≥200 mg/dL) (13). Area under the curve (AUC) for glucose and insulin response was calculated for the first 2-h interval after glucose load using the trapezoidal rule (14, 15).
The degree of insulin resistance was quantified using the homeostasis model assessment index of insulin resistance (HOMA-IR) [(glucose (mmol/L) • insulin (mIU/L))/22.5]. (16) Fasting HOMA-IR and area under the curve of glucose (AUC glucose) were used as measures of insulin resistance and glucose tolerance, respectively. The Matsuda Index was used as a measure of insulin sensitivity (17). Beta-cell responsiveness was assessed using the fasting HOMA-%B [(20 • insulin (mIU/L))/(glucose (mmol/L) – 3.5)], AUCinsulin/AUCglucose [AUCinsulin/glucose] (16), AUCISR, and insulinogenic index (IGI) (18). Oral disposition index (DIOral) was used as a measure of beta-cell function adjusted for insulin sensitivity (18).
Assays
Plasma glucose was assayed by the glucose oxidase method (YSI Life Sciences). Serum insulin and C-Peptide were measured by chemiluminescence assays using the Immulite immunochemistry system (Diagnostic Products Corp., Los Angeles, CA). As a result of hemolysis, <1.5% of insulin values were adjusted by linear interpolation or extrapolation after examination of corresponding C-Peptide values. Hemoglobin A1c was measured using turbidimetric inhibition immunoassay (Roche Diagnostics).
Determination of Insulin Secretory Rates
In each blood sampling interval during the OGTT, the insulin secretion rate (ISR) (19) was mathematically derived from plasma C-Peptide levels using a two-compartment model for C-Peptide disappearance kinetics (20, 21). The kinetic parameters were obtained from published demographic data taking into account sex, age, and body surface area (22). The mean (±SEM) parameter values were 4.55 ± 0.0 min for the short half-life, 33.8 ± 0.08 min for the long half-life, and 0.78 ± 0.0 for the fraction of decay associated with the short half-life. The volume of distribution averaged 4.69 ± 0.05 L.
Statistical Analyses
Continuous variables are expressed as mean ± SEM for normally distributed data, or median with 25–75% interquartile range (IQR) when the assumption of normality was not met; categorical variables are summarized as percentages (%). The main objective of this study was to determine if sex differences exist in the impact of OSA on insulin resistance and glucose tolerance (fasting HOMA-IR, AUC glucose, and Matsuda Index) and beta-cell function (HOMA-%B, AUCinsulin/glucose, insulinogenic index and oral disposition index). We therefore created four groups based on sex (men, women) and OSA (presence, absence). Comparisons were made separately between men and women with OSA and men and women without OSA. Unadjusted group comparisons were performed using a t-test for normally distributed continuous variables and the Wilcoxon/Mann-Whitney test for non-normally distributed continuous variables. Pearson Chi Square test was used to compare categorical variables. Multivariate linear regression models were constructed to examine whether sex was independently associated with measures of glucose metabolism after adjusting for age and BMI as continuous variables, race, and severity of OSA based on the natural log of AHI (LnAHI). Dependent variables that were not normally distributed were log transformed. Given that the calculation for insulin secretion rate (ISR) takes into account body surface area, the multivariate regression models examining AUCISR did not adjust for BMI. For AHI values equal to zero, we used the formula Ln (AHI + 0.1) to log transform. P-values <0.05 were considered statistically significant. All statistical calculations were performed using JMP 9.0 statistical software for Macintosh (SAS Institute).
Results
A total of 157 subjects participated in the study. An OGTT was not performed in 6 subjects who had a fasting plasma glucose ≥126 mg/dl, consistent with the presence of undiagnosed type 2 diabetes. Four additional subjects were excluded because their HbA1c level was ≥6.5%. Two subjects were excluded because of uncontrolled hypothyroidism. Thus the final analytic cohort included 145 subjects (90 women and 55 men). OSA, defined as AHI ≥5 events per hour, was present in 72.7% of men and 43.3% of women (p < 0.001). We categorized the subjects by sex and presence of OSA. Table 1 summarizes the demographics of the four groups of subjects. There were no significant differences between men and women without OSA. In those with OSA, men and women had similar age and BMI, but there were more black women than black men with OSA (p = 0.0016).
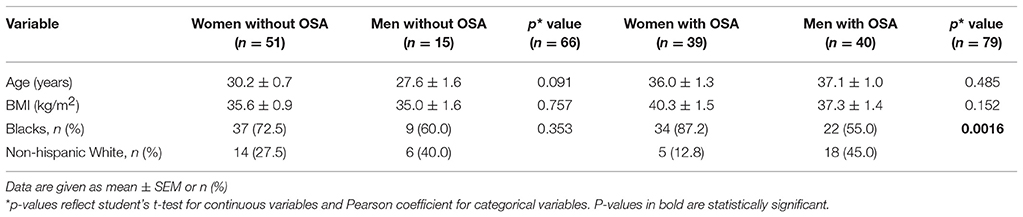
Table 1. Subject demographics.
Table 2 summarizes polysomnographic differences between men and women with and without OSA. There was a statistically significant, but likely clinically less relevant, difference in AHI between men and women without OSA (1.9 vs. 1.1; p = 0.0265). In participants with OSA, the only polysomnographic difference between men and women was a lower percentage of slow wave sleep in men (p = 0.0017). Importantly, the severity of OSA was not significantly different between men and women with OSA.
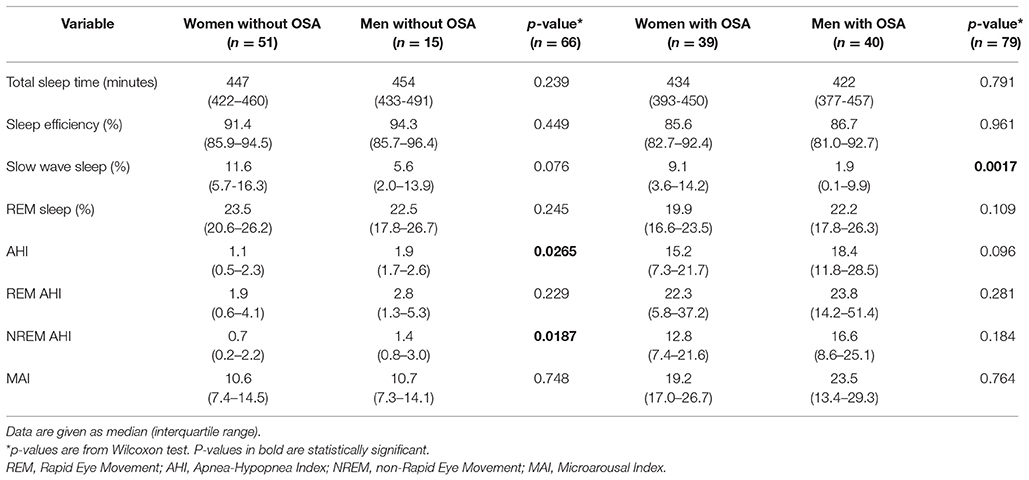
Table 2. Polysomnographic variables.
The proportion of individuals with IFG varied between the 4 groups (p = 0.0004). A higher prevalence of IFG was observed in men with and without OSA (35.0 and 26.7%, respectively) compared to women with and without OSA (10.3 and 3.9%, respectively). After adjusting for age, BMI, race, and severity of OSA (LnAHI), men were more likely to have IFG (odds ratio 10.2, CI 2.9–42.7; p = 0.0001). The prevalence of impaired glucose tolerance (IGT) was higher in men and women with OSA (27.5 and 20.5%, respectively) compared to men and women without OSA (6.7 and 9.8%, respectively). After adjusting for confounders, there was no significant group differences for IGT (p = 0.094).
Figure 1 illustrates profiles of plasma glucose, serum insulin, and ISR from the OGTT. In unadjusted analyses, men with OSA had a significantly higher fasting, 30-min and 1-h glucose levels compared to women with OSA. Men with OSA had significantly higher AUCGlucose than women with OSA (p = 0.005). Although men without OSA had a higher fasting and 30-min glucose levels compared to women without OSA, the AUCGlucose was similar between men and women without OSA (p = 0.204). In unadjusted analysis, the AUCISR was significantly greater in men with OSA compared to women with OSA (p = 0.0069), as well as in men without OSA compared to women without OSA (p = 0.0030).
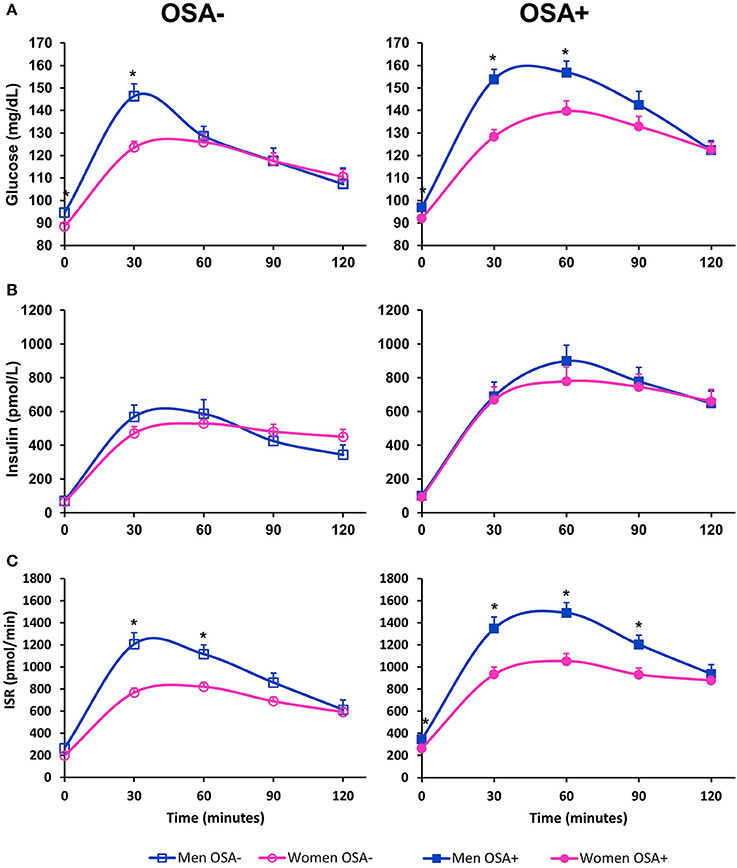
Figure 1. Oral glucose tolerance test in men and women with and without OSA. (A) Illustrates plasma glucose, (B) illustrates serum insulin and (C) illustrates insulin secretion rate (ISR) as measured during a 2-h 75-g oral glucose challenge. Data are represented as mean + SEM. *denotes an unadjusted p-value < 0.05 from a student's t-test for variables with normal distribution, and Wilcoxon test for variables that are not normally distributed.
Tables 3, 4 summarize metabolic differences between men and women. In subjects without OSA, men had a higher fasting glucose in both unadjusted and adjusted comparisons. There were no significant differences between men and women without OSA in any of the measures of beta-cell function, measures of insulin sensitivity, and glucose tolerance. In contrast, in subjects with OSA, men had significantly higher fasting glucose, 1-hr glucose, and AUCGlucose. Men with OSA secreted more insulin compared to women with OSA, as evidenced by a significantly higher AUCISR. These differences remained significant after adjusting for covariates. Men with OSA had significantly lower beta-cell function as assessed by the DIOral even after adjusting for covariates.
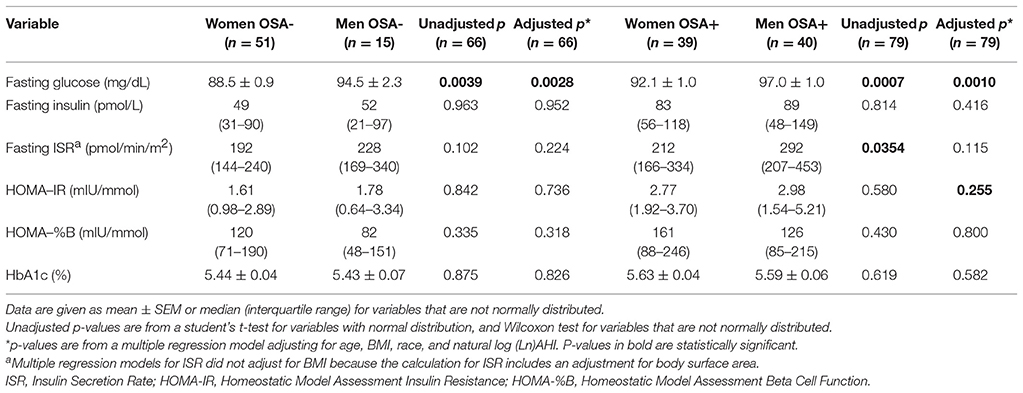
Table 3. Fasting metabolic measures.
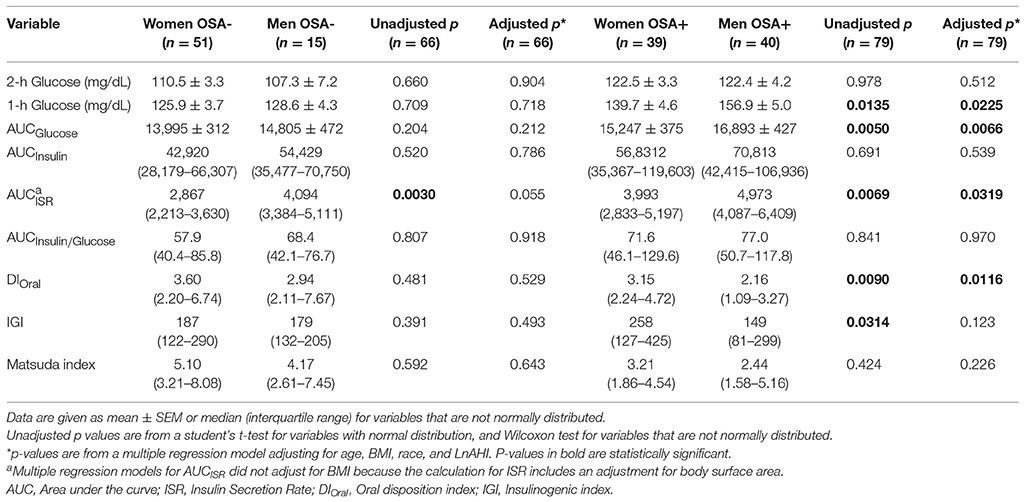
Table 4. Metabolic measures derived from response to oral glucose.
Discussion
Our study rigorously examines sex-specific differences in the impact of OSA on glucose metabolism in relatively young overweight and obese subjects without diabetes. There were no significant differences in glucose tolerance and beta-cell function between men and women without OSA. In contrast, men with OSA had worse glucose tolerance than women with OSA despite secreting more insulin. As such, the adverse impact of OSA on beta-cell responsiveness is of greater magnitude in men, which may result in an overall greater risk of developing type 2 diabetes. Higher glucose levels and insulin responses during the OGTT (i.e., 1-h glucose and the shape of the plasma glucose curve) are indeed related to the risk of developing type 2 diabetes, particularly if the 2-h plasma glucose does not return to or below the fasting plasma glucose levels (23–25). A slower rate of decrease in plasma glucose concentration during an OGTT is indicative of increased insulin resistance and/or impaired beta-cell responsiveness, both of these being important risk factors for future type 2 diabetes.
The underlying pathogenesis of impaired glucose metabolism due to OSA is not fully understood but factors such as activation of the sympathetic nervous system, intermittent hypoxemia, oxidative stress, and low-grade systemic inflammation have been implicated. In a study of 118 nondiabetics recruited from the community who underwent a frequently sampled intravenous glucose tolerance test, the severity of OSA as measured by the AHI was independently associated with insulin sensitivity after controlling for age, sex, race and percent body fat. Moreover, the acute insulin response to glucose, a measure of beta-cell function, did not increase across OSA severity categories. Together these findings suggest that the increased diabetes risk in OSA is associated with increased insulin resistance without adequate compensation by the beta-cell (26). The sex-specific differences of the impact of OSA on glucose metabolism, however, remains mostly unexplored as most studies have predominantly included men or only women or did not take sex differences into account (4–10, 27, 28). A few cross-sectional epidemiologic studies have suggested that markers of OSA, namely observed apneas and habitual snoring, are independently associated with type 2 diabetes or prediabetes in women only (29–32). These studies were questionnaire based and lacked objective polysomnographic evaluation. In contrast, we quantified the presence and severity of OSA using the gold standard in-laboratory polysomnography. Our findings of increased risk of type 2 diabetes with OSA in men are consistent with findings from the largest nationwide health claims database analysis which revealed a higher prevalence of type 2 diabetes in men with OSA compared to women with OSA (33). In a Swedish clinic-based longitudinal study with 16 years of follow up, OSA was independently associated with incident type 2 diabetes in women only (34). However, this study was limited due to lack of full in-lab polysomnography, it included only 10 women with OSA and the presence of incident type 2 diabetes was obtained by questionnaires mailed to the patients. The questionnaire based nature of the study and lack of OGTT precludes any inferences regarding sex-specific mechanistic differences by which OSA may impact glucose metabolism.
A number of population-based and clinic-based studies have reported a stronger association between OSA and hypertension in men than in women (35–37). There is a paucity of studies examining sex differences of the adverse metabolic impact of OSA. Our cross-sectional analysis suggests that the adverse impact of OSA on beta-cell function is more prominent in men. Harsch and colleagues performed hyperinsulinemic euglycemic clamps after 2 days of all-night CPAP therapy in the sleep laboratory in 40 nondiabetic subjects (36 men and 4 women) with severe OSA. Although they did not measure beta-cell function, they demonstrated significant improvement in insulin sensitivity after only 2 nights of effective all-night CPAP therapy (38). Clinical trials assessing the impact of CPAP therapy on glucose metabolism in patients with OSA and type 2 diabetes, on the other hand, have yielded mixed results, in part due limited adherence to CPAP therapy (11). However, clinical trials with higher CPAP adherence in patients with either type 2 diabetes (39, 40) or prediabetes (41, 42) have found that therapeutic CPAP improves glycemic control or insulin sensitivity compared to the control group. These findings suggest that in order to derive metabolic benefits from CPAP therapy, treatment should include the great majority of the sleep period (43).
Our study has several limitations. First and foremost, its cross-sectional design does not establish the direction of causality. Second, we used derived measures of insulin resistance, glucose tolerance and beta-cell function from an OGTT alone. Although some of the derived measures of beta-cell function have been previously validated (18, 44), there is no clear consensus on how best to measure beta-cell function based on an OGTT. We therefore explored several derived measures of beta-cell function. Undoubtedly, additional studies with more detailed and intensive assessments of beta-cell function and insulin sensitivity are needed to better elucidate mechanistic pathways. Third, our study includes one night of sleep in the laboratory and therefore does not take into account variability in sleep patterns as well as participants' habitual sleep duration which can influence glucose metabolism. Fourth, although we excluded post-menopausal women, metabolic testing was not standardized to a particular phase of the menstrual cycle. Lastly, we did not assess measures of body fat distribution. This may be relevant given the established sex differences in fat distribution.
In summary, the adverse impact of OSA on beta-cell responsiveness is greater in men, which may result in an overall higher risk of future development of type 2 diabetes compared to women.
Author Contributions
BM and EV designed the protocol. LM, KT, and RL recruited subjects and collected data. KT, DE, EV, and BM analyzed the data. BM drafted the manuscript. KT, EV, DE, and BM reviewed and edited the manuscript.
Funding
Supported by NIH grants P50-HD057796, R01-HL75025, R01-DK071696, P01 AG-11412, P60-DK20595 (The University of Chicago DRTC Laboratory), a grant from the ResMed Foundation, and NIH grant UL1-TR000430 to the University of Chicago Institute for Translational Science. BM is supported in part by NIH grant R01 HL-119161.
Conflict of Interest Statement
BM is supported by National Institutes of Health grant R01HL119161 and is supported by the Merck Investigator Studies Program. EV is the principal investigator of an investigator-initiated study sponsored by Philips/Respironics.
The remaining authors declare that the research was conducted in the absence of any commercial or financial relationships that could be construed as a potential conflict of interest.
Acknowledgments
The authors wish to thank Harry Whitmore, R-PSGT, from the Sleep, Metabolism and Health Center (SMAHC) at the University of Chicago, for providing expert technical assistance with the collection and scoring of polysomnographic recordings. We are also grateful to the staff of the Sleep, Metabolism and Health Center and the General Clinical Resource Center of the University of Chicago, and to the study participants.
References
1. National diabetes statistics report 2017. U.S. Department of Health and Human Services. Centers for Disease Control and Prevention (2017). Available online at: https://www.CDC.Gov/diabetes/pdfs/data/statistics/national-diabetes-statistics-report.Pdf (Accessed February 1, 2018).
2. Peppard PE, Young T, Barnet JH, Palta M, Hagen EW, Hla KM. Increased prevalence of sleep-disordered breathing in adults. Am J Epidemiol. (2013) 177:1006–14. doi: 10.1093/aje/kws342
3. Heinzer R, Vat S, Marques-Vidal P, Marti-Soler H, Andries D, Tobback N, et al. Prevalence of sleep-disordered breathing in the general population: the hypnolaus study. Lancet Respir Med. (2015) 3:310–8. doi: 10.1016/S2213-2600(15)00043-0
4. Punjabi NM, Sorkin JD, Katzel LI, Goldberg AP, Schwartz AR, Smith PL. Sleep-disordered breathing and insulin resistance in middle-aged and overweight men. Am J Respir Crit Care Med. (2002) 165:677–82. doi: 10.1164/ajrccm.165.5.2104087
5. Ip MS, Lam B, Ng MM, Lam WK, Tsang KW, Lam KS. Obstructive sleep apnea is independently associated with insulin resistance. Am J Respir Crit Care Med. (2002) 165:670–6. doi: 10.1164/ajrccm.165.5.2103001
6. Meslier N, Gagnadoux F, Giraud P, Person C, Ouksel H, Urban T, et al. Impaired glucose-insulin metabolism in males with obstructive sleep apnoea syndrome. Eur Respir J. (2003) 22:156–60. doi: 10.1183/09031936.03.00089902
7. Punjabi NM, Shahar E, Redline S, Gottlieb DJ, Givelber R, Resnick HE. Sleep-disordered breathing, glucose intolerance, and insulin resistance: the sleep heart health study. Am J Epidemiol. (2004) 160:521–30. doi: 10.1093/aje/kwh261
8. Theorell-Haglow J, Berne C, Janson C, Lindberg E. Obstructive sleep apnoea is associated with decreased insulin sensitivity in females. Eur Respir J. (2008) 31:1054–60. doi: 10.1183/09031936.00074907
9. Seicean S, Kirchner HL, Gottlieb DJ, Punjabi NM, Resnick H, Sanders M, et al. Sleep-disordered breathing and impaired glucose metabolism in normal-weight and overweight/obese individuals: the sleep heart health study. Diabetes Care (2008) 31:1001–6. doi: 10.2337/dc07-2003
10. Lindberg E, Theorell-Haglow J, Svensson M, Gislason T, Berne C, Janson C. Sleep apnea and glucose metabolism: a long-term follow-up in a community-based sample. Chest (2012) 142:935–42. doi: 10.1378/chest.11-1844
11. Reutrakul S, Mokhlesi B. Obstructive sleep apnea and diabetes: a state of the art review. Chest (2017) 152:1070–86. doi: 10.1016/j.chest.2017.05.009
12. Iber C, Ancoli-Israel S, Chesson AL, Quan SF. The American Academy of Sleep Medicine Manual for the Scoring of Sleep and Associated Events: Rules, Terminology and Technical Specifications. American Academy of Sleep Medicine (2007) 1–59.
13. American Diabetes A. 2. Classification and diagnosis of diabetes: standards of medical care in diabetes-2018. Diabetes Care (2018) 41(Suppl. 1):S13–27. doi: 10.2337/dc18-S002
14. Tai MM. A mathematical model for the determination of total area under glucose tolerance and other metabolic curves. Diabetes Care (1994) 17:152–4.
16. Matthews DR, Hosker JP, Rudenski AS, Naylor BA, Treacher DF, Turner RC. Homeostasis model assessment: insulin resistance and beta-cell function from fasting plasma glucose and insulin concentrations in man. Diabetologia (1985) 28:412–9.
17. Matsuda M, DeFronzo RA. Insulin sensitivity indices obtained from oral glucose tolerance testing: comparison with the euglycemic insulin clamp. Diabetes Care (1999) 22:1462–70.
18. Utzschneider KM, Prigeon RL, Faulenbach MV, Tong J, Carr DB, Boyko EJ, et al. Oral disposition index predicts the development of future diabetes above and beyond fasting and 2-h glucose levels. Diabetes Care (2009) 32:335–41. doi: 10.2337/dc08-1478
19. Belchetz PE, Plant TM, Nakai Y, Keogh EJ, Knobil E. Hypophysial responses to continuous and intermittent delivery of hypopthalamic gonadotropin-releasing hormone. Science (1978) 202:631–3.
20. Polonsky KS, Licinio-Paixao J, Given BD, Pugh W, Rue P, Galloway J, et al. Use of biosynthetic human c-peptide in the measurement of insulin secretion rates in normal volunteers and type i diabetic patients. J Clin Invest. (1986) 77:98–105.
21. Polonsky KS, Rubenstein AH. Current approaches to measurement of insulin secretion. Diabetes Metab Rev. (1986) 2:315–29.
22. Van Cauter E, Mestrez F, Sturis J, Polonsky KS. Estimation of insulin secretion rates from c-peptide levels. Comparison of individual and standard kinetic parameters for c-peptide clearance. Diabetes (1992) 41:368–77.
23. Abdul-Ghani MA, Lyssenko V, Tuomi T, Defronzo RA, Groop L. The shape of plasma glucose concentration curve during ogtt predicts future risk of type 2 diabetes. Diabetes Metab Res Rev. (2010) 26:280–6. doi: 10.1002/dmrr.1084
24. Abdul-Ghani MA, DeFronzo RA. Plasma glucose concentration and prediction of future risk of type 2 diabetes. Diabetes Care (2009) 32 (Suppl. 2):S194–8. doi: 10.2337/dc09-S309
25. Oh TJ, Lim S, Kim KM, Moon JH, Choi SH, Cho YM, et al. One-hour postload plasma glucose concentration in people with normal glucose homeostasis predicts future diabetes mellitus: a 12-year community-based cohort study. Clin Endocrinol. (2017) 86:513–9. doi: 10.1111/cen.13280
26. Punjabi NM, Beamer BA. Alterations in glucose disposal in sleep-disordered breathing. Am J Respir Crit Care Med. (2009) 179:235–40. doi: 10.1164/rccm.200809-1392OC
27. Marshall NS, Wong KK, Phillips CL, Liu PY, Knuiman MW, Grunstein RR. Is sleep apnea an independent risk factor for prevalent and incident diabetes in the busselton health study? J Clin Sleep Med. (2009) 5:15–20.
28. Reichmuth KJ, Austin D, Skatrud JB, Young T. Association of sleep apnea and type ii diabetes: a population-based study. Am J Respir Crit Care Med. (2005) 172:1590–5. doi: 10.1164/rccm.200504-637OC
29. Enright PL, Newman AB, Wahl PW, Manolio TA, Haponik EF, Boyle PJ. Prevalence and correlates of snoring and observed apneas in 5,201 older adults. Sleep (1996) 19:531–8.
30. Valham F, Stegmayr B, Eriksson M, Hagg E, Lindberg E, Franklin KA. Snoring and witnessed sleep apnea is related to diabetes mellitus in women. Sleep Med. (2009) 10:112–7. doi: 10.1016/j.sleep.2007.11.005
31. Sabanayagam C, Teppala S, Shankar A. Markers of sleep disordered breathing and diabetes mellitus in a multiethnic sample of us adults: results from the national health and nutrition examination survey (2005-2008). Int J Endocrinol. (2012) 2012:879134. doi: 10.1155/2012/879134
32. Alshaarawy O, Teppala S, Shankar A. Markers of sleep-disordered breathing and prediabetes in us adults. Int J Endocrinol. (2012) 2012:902324. doi: 10.1155/2012/902324
33. Mokhlesi B, Ham SA, Gozal D. The effect of sex and age on the comorbidity burden of osa: an observational analysis from a large nationwide us health claims database. Eur Respir J. (2016) 47:1162–9. doi: 10.1183/13993003.01618-2015.
34. Celen YT, Hedner J, Carlson J, Peker Y. Impact of gender on incident diabetes mellitus in obstructive sleep apnea: a 16-year follow-up. J Clin Sleep Med. (2010) 6:244–50.
35. Cano-Pumarega I, Barbe F, Esteban A, Martinez-Alonso M, Egea C, Duran-Cantolla J, et al. Sleep apnea and hypertension: are there sex differences? The vitoria sleep cohort. Chest (2017) 152:742–50. doi: 10.1016/j.chest.2017.03.008
36. Hedner J, Bengtsson-Bostrom K, Peker Y, Grote L, Rastam L, Lindblad U. Hypertension prevalence in obstructive sleep apnoea and sex: a population-based case-control study. Eur Respir J. (2006) 27:564–70. doi: 10.1183/09031936.06.00042105
37. Mohsenin V, Yaggi HK, Shah N, Dziura J. The effect of gender on the prevalence of hypertension in obstructive sleep apnea. Sleep Med. (2009) 10:759–62. doi: 10.1016/j.sleep.2008.09.005
38. Harsch IA, Schahin SP, Radespiel-Troger M, Weintz O, Jahreiss H, Fuchs FS, et al. Continuous positive airway pressure treatment rapidly improves insulin sensitivity in patients with obstructive sleep apnea syndrome. Am J Respir Crit Care Med. (2004) 169:156–62. doi: 10.1164/rccm.200302-206OC
39. Martinez-Ceron E, Barquiel B, Bezos AM, Casitas R, Galera R, Garcia-Benito C, et al. Effect of continuous positive airway pressure on glycemic control in patients with obstructive sleep apnea and type 2 diabetes. A randomized clinical trial. Am J Respir Crit Care Med. (2016) 194:476–85. doi: 10.1164/rccm.201510-1942OC
40. Mokhlesi B, Grimaldi D, Beccuti G, Abraham V, Whitmore H, Delebecque F, et al. Effect of one week of 8-hour nightly continuous positive airway pressure treatment of obstructive sleep apnea on glycemic control in type 2 diabetes: a proof-of-concept study. Am J Respir Crit Care Med. (2016) 194:516–9. doi: 10.1164/rccm.201602-0396LE
41. Weinstock TG, Wang X, Rueschman M, Ismail-Beigi F, Aylor J, Babineau DC, et al. A controlled trial of cpap therapy on metabolic control in individuals with impaired glucose tolerance and sleep apnea. Sleep (2012) 35:617–25B. doi: 10.5665/sleep.1816
42. Pamidi S, Wroblewski K, Stepien M, Sharif-Sidi K, Kilkus J, Whitmore H, et al. Eight hours of nightly continuous positive airway pressure treatment of obstructive sleep apnea improves glucose metabolism in patients with prediabetes. A randomized controlled trial. Am J Respir Crit Care Med. (2015) 192:96–105. doi: 10.1164/rccm.201408-1564OC
43. Grimaldi D, Beccuti G, Touma C, Van Cauter E, Mokhlesi B. Association of obstructive sleep apnea in rapid eye movement sleep with reduced glycemic control in type 2 diabetes: therapeutic implications. Diabetes Care (2014) 37:355–63. doi: 10.2337/dc13-0933
Keywords: obstructive sleep apnea, sleep-disordered breathing, diabetes, glucose tolerance, insulin resistance, beta-cell, gender, sex
Citation: Temple KA, Leproult R, Morselli L, Ehrmann DA, Van Cauter E and Mokhlesi B (2018) Sex Differences in the Impact of Obstructive Sleep Apnea on Glucose Metabolism. Front. Endocrinol. 9:376. doi: 10.3389/fendo.2018.00376
Received: 02 April 2018; Accepted: 22 June 2018;
Published: 10 July 2018.
Edited by:
Claudia Torres-Farfan, Universidad Austral de Chile, ChileReviewed by:
Barbara Morgan, University of Wisconsin-Madison, United StatesHariom Yadav, Wake Forest School of Medicine, United States
Copyright © 2018 Temple, Leproult, Morselli, Ehrmann, Van Cauter and Mokhlesi. This is an open-access article distributed under the terms of the Creative Commons Attribution License (CC BY). The use, distribution or reproduction in other forums is permitted, provided the original author(s) and the copyright owner(s) are credited and that the original publication in this journal is cited, in accordance with accepted academic practice. No use, distribution or reproduction is permitted which does not comply with these terms.
*Correspondence: Babak Mokhlesi, Ym1va2hsZXNAbWVkaWNpbmUuYnNkLnVjaGljYWdvLmVkdQ==