 Manjunath Ramanjaneya1*
 Ilham Bettahi1
 Jayakumar Jerobin1
 Prem Chandra1Charbel Abi Khalil2
 Monica Skarulis1
 Stephen Lawrence Atkin2,3*†Abdul-Badi Abou-Samra1*†
- 1Hamad Medical Corporation, Department of Medicine, Qatar Metabolic Institute and Interim Translational Research Institute, Academic Health System, Doha, Qatar
- 2Epigenetics Cardiovascular Laboratory, Department of Genetic Medicine, Weill Cornell Medicine Qatar, Doha, Qatar
- 3Research Department, Weill Cornell Medicine Qatar, Doha, Qatar
Background: Mitochondrial dysfunction is implicated in the pathogenesis of Type 2 diabetes (T2D) and the development of diabetes related complications such as cardiovascular disease and stroke. Mitochondria produce several small polypeptides that may influence mitochondrial function and may impact on insulin sensitivity, such as humanin (HN) and the mitochondrial open reading frame of the 12S rRNA type-c (MOTS-c) that are mitochondrial derived proteins (MDP). The aim of this study was to determine MDP in normal, prediabetes and diabetes subjects.
Subjects and Measurements: In this cross-sectional study, we analyzed the serum concentrations of MDP and adiponectin (ADP) in 225 subjects: normal (n = 68), pre-diabetes (n = 33), T2D less than (good control; n = 31), and greater than HbA1c 7% (poor control; n = 93) subjects. The relationship of serum MDP and ADP concentrations with biochemical and anthropometric measurements were performed and assessed by multilinear regression.
Results: Serum HN concentrations were lower in T2D (p < 0.0001) and negatively correlated with age (p < 0.0001), HbA1c (p < 0.0001), glucose (p < 0.0001), triglycerides (p < 0.003), ALT (p < 0.004), and TG/HDL ratio (p < 0.001). Circulating HN levels were positively correlated to cholesterol (p < 0.017), LDL (p < 0.001), and HDL (p < 0.001). Linear regression analysis showed that HbA1c and ALT were two independent predictors of circulating HN. Similarly, serum MOTS-c was significantly lower in T2D subjects compared to controls (p < 0.007). Circulating MOTS-c positively correlated with BMI (p < 0.035), total cholesterol (p < 0.0001), and LDL (p < 0.001) and negatively correlated with age (p < 0.002), HbA1c (p < 0.001), and glucose (p < 0.002). Serum ADP concentrations were lower in T2D (p < 0.002) and negatively correlated with HbA1c (p < 0.001), weight (p < 0.032) TG (p < 0.0001), and ALT (p < 0.0001); and positively correlated with HDL (p < 0.0001) and HN (p < 0.003). Linear regression analysis showed that HbA1c and weight were two independent predictors of circulating ADP. Multilinear regression showed that HN and MOT-c correlated with each other, and only HN correlated with HbA1c.
Conclusion: The MDPs HN and MOT-c, similar to ADP, are decreased in T2D and correlate with HbA1c. The data provide an additional evidence that mitochondrial dysfunction contributes to glycemic dysregulation and metabolic defects in T2D.
Introduction
Type 2 diabetes (T2D) and its associated comorbidities and complications are global health problems especially for developing nations (1), and in Qatar, 17–20% of adults are estimated to be diabetic (2). This is a significant risk factor for developing major life-threatening illness, including cardiovascular disease, stroke, chronic kidney disease (3), and cancer, which are linked with a markedly diminished life expectancy (4–12). T2D is characterized by insulin resistance (IR) through which insulin target tissue is unable to respond normally to insulin reflecting insulin deficiency (13). Mitochondria are central for maintaining metabolic health and cellular energy homeostasis, and mitochondrial dysfunction leads to inefficiency in the electron transport chain and beta-oxidation, thus trigging IR (14–16). It has been suggested that mitochondrial dysfunction is associated with T2D as well as in diabetes related complications (17–19). Blake et al. demonstrated that mitochondrial dysfunction was involved in diabetes-induced complications affecting the kidneys, nervous system, heart and retina (19), and it was suggested that mitochondrial dysfunction-induced oxidative stress was contributory for these complications (19). Others reported that mitochondrial oxidative stress was responsible for hyperglycemia-induced disorders affecting blood vessels, kidney, pancreatic β cells, and liver (20).
Mitochondria produce numerous small polypeptides from their short open reading frame (sORF) regions of mtDNA that have significant biological activity (21). These include humanin, six small-humanin like peptides, and MOTS-c (mitochondrial open reading frame of the 12S rRNA type-c), together termed mitochondrial derived peptides (MDP). Studies in rodents demonstrate that MDP promote mitochondrial metabolism and regulate critical processes such as aging, inflammation, and reverse insulin resistance (22–25). Humanin (HN) is a 24-amino acid neuro-protective polypeptide discovered in healthy neurons of Alzheimer's patients. HN and HN-analogs regulate important cellular function such as promoting cell survival, metabolism, response to stressors, and inflammation both in vivo and in vitro (23). MOTS-c inhibits folate cycle, purine biosynthesis and promotes 5′ AMP-activated protein kinase (AMPK) activation and mitochondrial metabolism. (24). The mitochondrial derived peptides (MDP) humanin and MOTSc are key regulators of insulin sensitivity and metabolism. The insulin sensitizing properties of MPDs have been demonstrated previously in cellular and rodent models. Administration of HN and HN-GF6A reduced blood glucose and promoted insulin sensitivity in Zuker diabetic rats, whilst in the non-obese diabetic mouse model, HN administration prevented the early onset of type 1 diabetes (26). Similar to HN, short humanin like peptide 2 (SHLP2) decreased hepatic glucose production and increased glucose disposal into peripheral tissue in hyperinsulinemic-euglycemic clamp studies in mice (27). The role of MDP in insulin sensitivity was supported further with the discovery of MOTS-c. Overexpression of MOTS-c increased glucose uptake in myoblasts and intraperitoneal administration of MOTS-c activated AMPK pathway and GLUT4 expression in skeletal muscle, and reversed age and diet induced IR in mice (24). This data suggested that, in rodent models, MDP had a role in improving T2D induced insulin resistance. However, the association of MDP in obese and T2D subjects with insulin resistance in human is not clearly understood.
Adipokines are a family of cytokines (leptin, adiponectin, resistin, and visfatin) that are released mainly by activated macrophages of adipocytes. They play an essential role in the development of insulin resistance and T2D, and are associated with an increased risk of obesity related cardiovascular disease (28, 29). It has been suggested that adiponectin may influence mitochondrial biogenesis and hence MDP production (30). Therefore, we sought to investigate the association of serum MDP in normal, prediabetes and T2D subjects to gain insight as to their role in diabetes and to determine if they were related to adiponectin levels.
Materials and Methods
This was a cross-sectional study performed using blood samples collected from Qatari T2D subjects attending the outpatient department and endocrinology clinics at Hamad Medical Corporation according to an IRB approved protocol [Hamad Medical Corporation (HMC#9093/09) and Weill Cornell Medicine Qatar (WCM-Q#13-00063)]. All study participants gave informed written consent before participation in the study.
Study Participants
Two hundred and twenty five Qatari subjects, aged 30–75 years, were enrolled in a population-based cross-sectional study. The T2D subjects were recruited from the outpatient department at Hamad Medical Corporation, and healthy controls were either family members or visitors in the waiting area of the outpatient clinics. Pregnant women, subjects with type 1 diabetes, secondary diabetes, chronic hematological disorders known to affect HbA1c levels, active malignancy during the past 5 years or other chronic conditions not related to diabetes and its complications were excluded.
SThe study subjects were divided into 4 groups based on their HbA1c following NICE criteria for prediabetes/diabetes diagnosis. The study group consisted of 68 healthy volunteer control subjects (HbA1c < 6%), 33 volunteers with prediabetes (HbA1c 6.0–6.4%) and 124 T2D (31 T2D (HbA1c < 7.0%, and 93 T2D HbA1c > 7%). Subjects with T2D were included within 10 years of diagnosis and free of complications. None of the prediabetes subjects were on an insulin sensitizer. The age, sex, height, weight, body mass index (BMI), random plasma glucose, glycated hemoglobin (HbA1c), total cholesterol (TCH), triglycerides, high-density lipoproteins cholesterol (HDL), low-density lipoprotein cholesterol (LDL), alanine aminotransferase (ALT), systolic blood pressure, and diastolic blood pressure were recorded at the time of participation in the study. Serum humanin (HN) concentrations were measured using a commercially available ELISA kit (MyBioSource, CA, USA; Catalog number: MBS914849) according to manufacturer's recommended protocol, with a detection range between 28 and 1,800 pg/ml and intra-assay coefficient of variation of <8% and inter-assay coefficient of variation of <10%. Serum MOTS-c concentrations were measured using a commercially available extraction-free EIA kit (Peninsula Laboratories International, CA, USA: Catalog number: S-1526) according to manufacturer's recommended protocol, with a detection range between 0.10 and 100 ng/ml. Serum ADP concentrations were measured using a commercially available Bio-Plex Pro™ human diabetes adiponectin immune assay kit (Bio-Rad Laboratories Ltd, Hertfordshire, U.K, Catalog number # 171a7003m) according to the manufacturer's recommended protocol, with a detection range between 0.17 and 704.02 ng/ml) and intra-assay coefficient of variation of <4% and inter-assay coefficient of variation of <3%.
Statistical Analysis
Data points are represented as means ± SD or median and interquartile range unless otherwise stated. The differences in mean serum MDP concentration between control, prediabetes T2D good control and in T2D poor control subjects were determined by one-way ANOVA followed by post-hoc tests with Bonferroni correction adjusting for alpha-error in the multiple group comparison. Spearman rank correlation was used to assess the relationship between serum MDP with clinical and biochemical parameters. Multiple linear regression analysis was conducted using individual covariant found to be significant in Spearman correlation analysis using SPSS software version 22.0 (SPSS, Inc, Chicago, IL, USA) and GraphPad Prism version 5. Assumptions of linear regression such as linearity, multivariate normality, multicollinearity, and homoscedasticity were tested and found to be satisfactory. The P < 0.05 was considered significant.
Results
Anthropometric and Biochemical Variations in Control and T2D Subjects
The study group demographics, anthropometrics and biochemical data are shown in Table 1A. The control group was slightly younger than the groups with pre-diabetes and diabetes. However, there was no difference in BMI across the groups. Not unexpectedly and in keeping with the groups defined by HbA1c, there were differences observed in triglycerides and HDL (Table 1A). However, the groups were generally similar with minor differences.
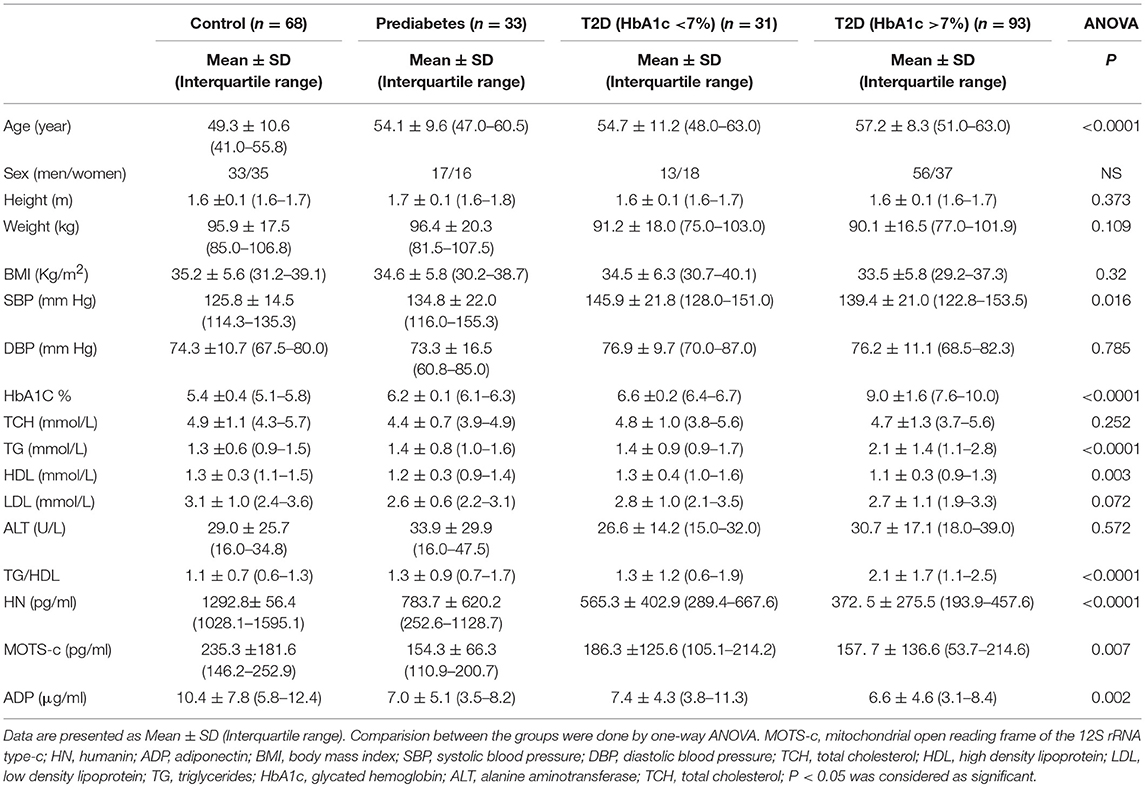
Table 1A. Clinical and metabolic features of study subjects.
HbA1c and Serum HN, MOTS-c, and ADP Levels
Serum HN levels differed according to level of glycemia (p < 0.0001) (Table 1A and Figure 1A). Compared to controls, there was a significant decrease in HN in prediabetes, the T2D good control and the T2D poor control groups. Further multiple comparison test with Bonferroni correction showed that HN levels were lower but not significantly different in T2D compared to prediabetes, and there was further decrease in poorly controlled T2D compared to prediabetes (p < 0.0001). Patients with well-controlled and poorly controlled T2D have similar HN levels (Table 1B). Serum MOTS-c levels were significantly lower in poorly controlled T2D patients compared to healthy controls (Table 1A and Figure 1B). No impact of the type of antidiabetic treatment including metformin on HN or MOTS-c levels was observed (Table 3). There were no significant differences in MDP between male and female subjects in the four groups. The mean and SD for HN in combined group was (781.4 ± 580.0 pg/ml) in male and (798.8 ± 609.1 pg/ml) in female and the MOTS-c levels were (209.8 ± 132 pg/ml) in male and (221.6 ± 180 pg/ml) in female subjects. The relationship between circulating HN, MOTS-c, and ADP with HbA1c are shown in Figure 1. As the HbA1c levels increased serum HN and MOTS-c levels decreased. Control subjects had higher HN and MOTS-c levels compared to subjects with prediabetes, well-controlled T2D or poorly-controlled T2D groups, respectively (Figure 1, Table 1A). One way ANOVA analysis showed that mean serum ADP was significantly lower in T2D (p < 0.002) compared to controls (Table 1A and Figure 1C). Males (6.8 ± 4.3 μg/ml) had lower ADP compared to females (9.4 ± 7.2 μg/ml, p < 0.002). The relationship between circulating ADP and HbA1c are shown in Figure 1C. Control subjects had higher ADP levels compared to subjects with prediabetes, well-controlled T2D or poorly-controlled T2D groups, respectively (Figure 1C, Table 1A).
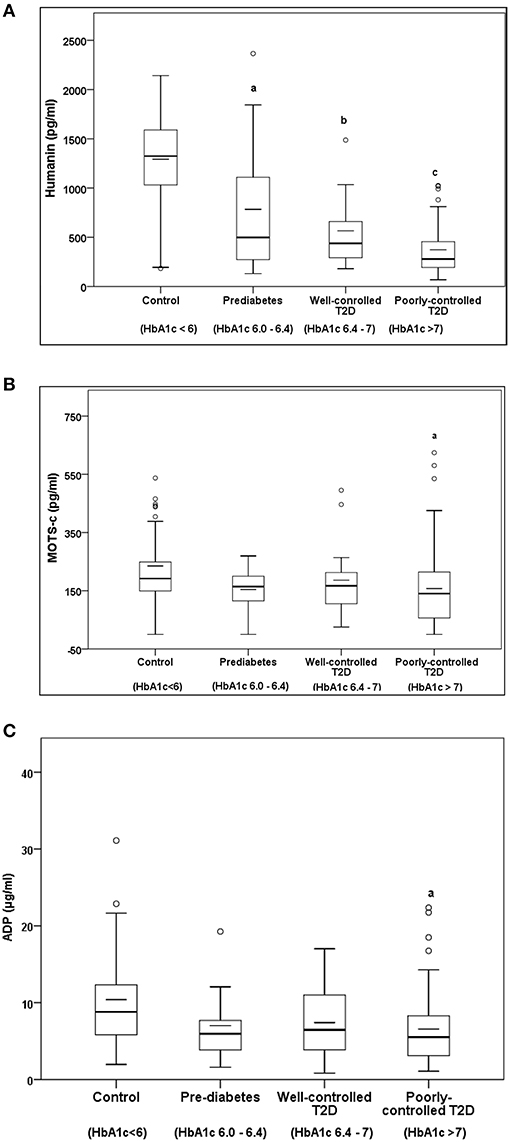
Figure 1. The Boxplot of (A) HN, (B) MOTS-c, and (C) ADP concentration in circulation and its association with variation of HbA1C in control, prediabetes, well-controlled T2D and poorly-controlled T2D subjects. Lower border of the box plots represent the 25th percentile and the upper border represents the 75th percentile ± SD. Short–inside the Boxplot represents statistical mean for HN (A), MOTS-c (B), and ADP (C), respectively. Alphabets on the Boxplot represent significant difference between groups. (a) P < 0.0001 between control and prediabetes, (b) p < 0.0001 between control and T2D good control, and (c) p < 0.0001 between control and T2D poor control. Out layers are highlighted as circles.
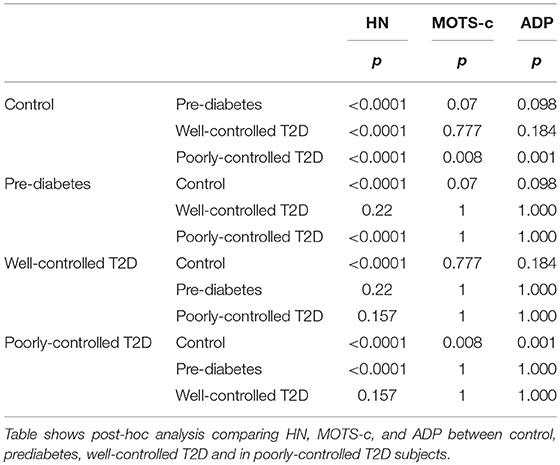
Table 1B. Post-hoc analysis with bonferroni correction adjusting for alpha error.
Correlations of MDP and ADP With Biochemical and Metabolic Parameters
The relationship of HN, MOTS-c, and ADP to age, lipids (TCH, LDL, and HDL triglycerides), liver function (AST) were analyzed by Spearman Rank correlation. HN was positively correlated with TCH (r = 0.158; P = 0.017), HDL (r = 0.172; P = 0.009), LDL (r = 0.212; P < 0.001), and insulin sensitivity marker ADP (r = 0.213; P < 0.003). And negatively correlated with HbA1c (r = −0.657; P < 0.0001), glucose (r = −0.577; P < 0.0001), ALT (r = −0.187; P = 0.004), TG/HDL (r = −0.234; P < 0.0001), and age (r = −0.256; P < 0.0001) (Table 2A). MOTS-c was positively correlated with BMI (r = 0.142; P = 0.035), TCH (r = 0.253; P < 0.0001), LDL (r = 0.231; P < 0.001) and negatively correlated with HbA1c (r = −0.233; P = 0.001), glucose (r = −0.213; P = 0.002), and age (r = −0.208; P = 0.002) (Table 2C). HN and MOTS-c were positively correlated with each other (r = 0.312; P < 0.0001). To test the effect of those variables that showed significant association with HN and MOTS-c in bivariate analysis, these parameters were tested by linear regression analysis model to determine if any of the covariates could individually predict variations in HN and MOTS-c. The combined group multiple linear regression analysis showed that HbA1c (regression coefficient β = −0.442; P < 0.0001) and ALT (β = −0.127; P = 0.026) were the two independent predictors that were able to predict serum HN for combined group analysis) (Table 2B). Similarly, for MOTS-c linear regression analysis showed TCH as the only predicting factor in combined group analysis) (Table 2D). Association of HN with HbA1c (R2 = 0.316) and age (R2 = 0.074) and association of MOTS-c with HbA1c (R2 = 0.024) and age (R2 = 0.022) is shown in Figure 2. ADP levels were positively correlated with HN (r = 0.213; P = 0.003), age (r = −0.156; P < 0.029), and HDL (r = 0.292; P = 0.0001) and negatively correlated with HbA1c (r = −0.237; P < 0.001), weight (r = −0.153; P < 0.032), TG (r = −0.324; P < 0.0001), ALT (r = −0.319; P < 0.0001), TG/HDL (r = −0.374; P < 0.0001), and TCH/HDL (r = −0.254; P < 0.0001) (Table 2E). Multiple linear regression analysis showed HbA1c and weight to independently correlate with ADP in combined group analysis (Table 2F).
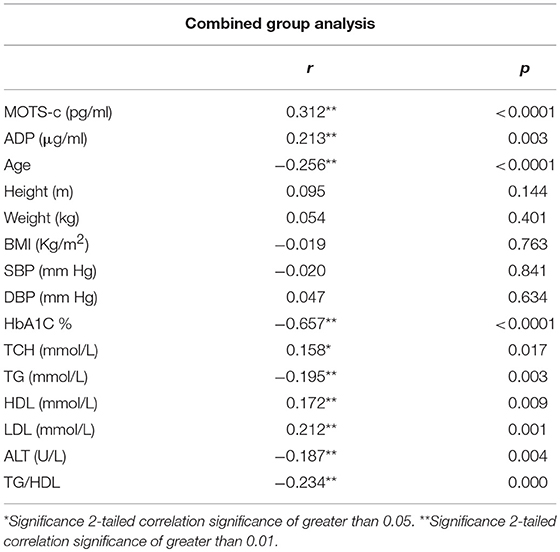
Table 2A. Spearman Rank correlation bivariate analysis of variables associated with HN.
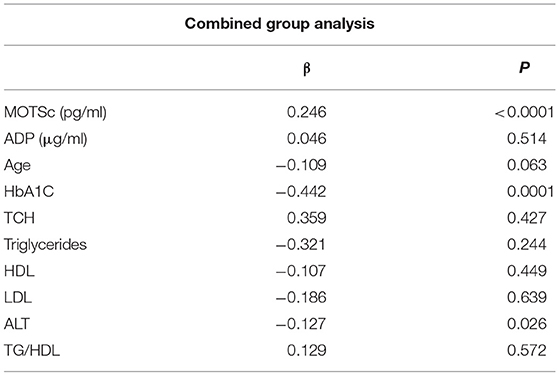
Table 2B. Multiple linear regression analysis of variables that showed significant association with HN.
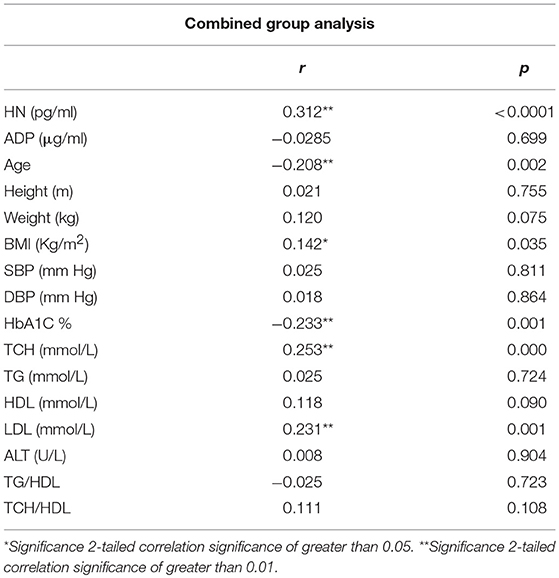
Table 2C. Spearman Rank correlation bivariate analysis of variables associated with MOTS-c.
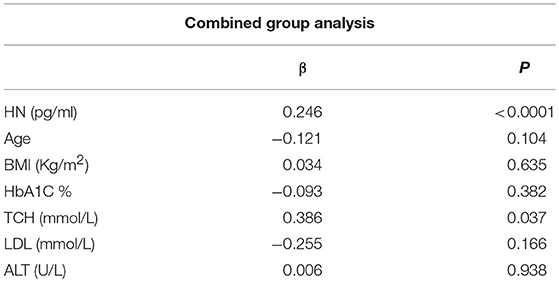
Table 2D. Multiple linear regression analysis of variables that showed significant association with MOTS-c.
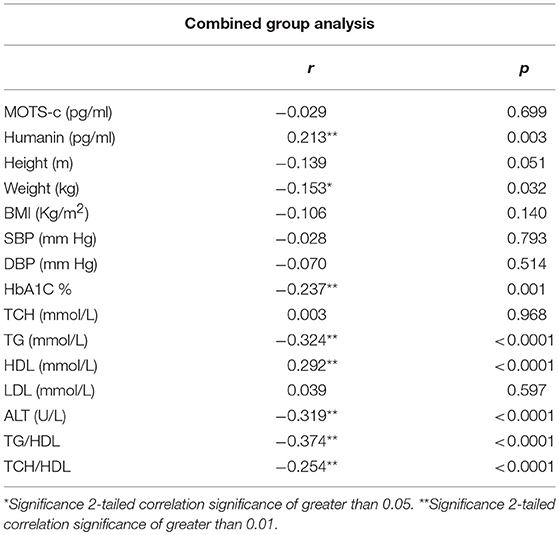
Table 2E. Spearman Rank correlation bivariate analysis of variables associated with ADP.
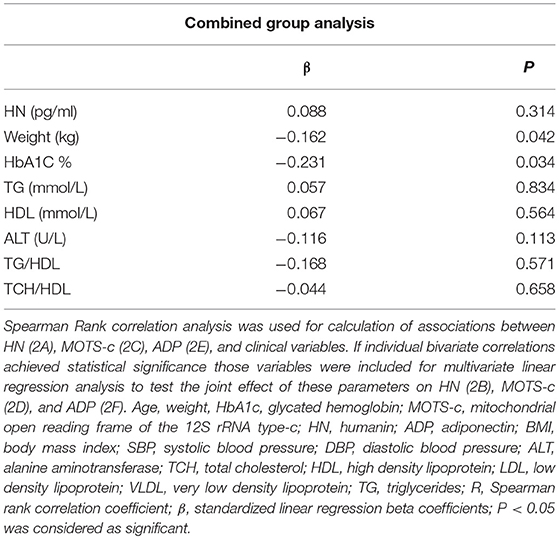
Table 2F. Multiple linear regression analysis of variables that showed significant association with ADP.
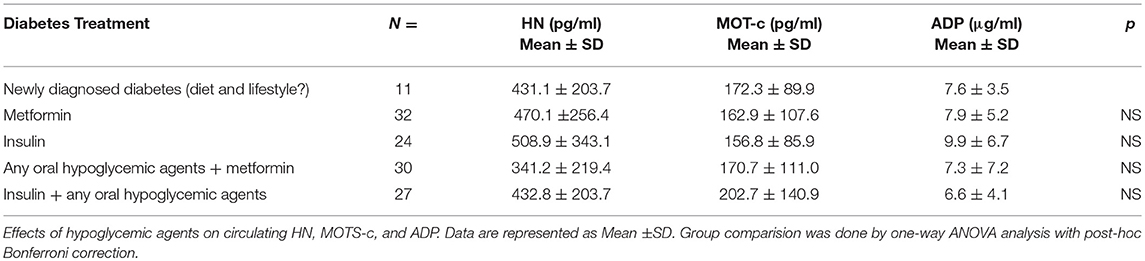
Table 3. Effects of antidiabetic medications on serum HN, MOTS-c and ADP levels.
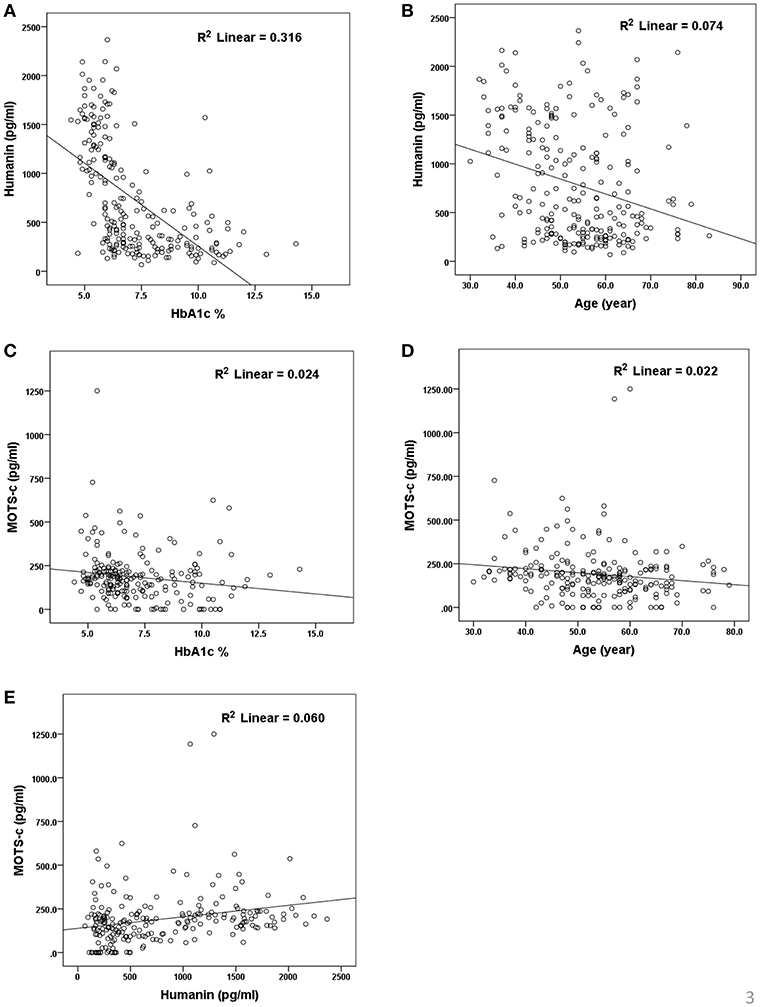
Figure 2. Association of serum HN (A,B) and MOTS-c (C,D) with HbA1C, age and between HN and MOTS-c (E). HbA1C, glycated hemoglobin. The “R2” values represent coefficient of determination in linear regression analysis.
Discussion
Our study demonstrates that the circulating MDPs (HN and MOT-c), and ADP levels were reduced in T2D and significantly related to HbA1c. We found that HN levels were decreased in patients with prediabetes, a condition that carries an annualized progression rate to diabetes of 5–10% (31). HN was further decreased in T2D and may be influenced by the degree of glycemic control. Mean HN concentrations were reduced by 62% in the prediabetes group, 66 % in diabetes subjects with good control (HbA1c <7%) and 77% in poorly controlled diabetes subjects (HbA1c >7%) compared to non-diabetes subjects. In contrast, mean MOTS-c concentrations were reduced by 27% in diabetic subjects with a range of HbA1c between 7.6 and 10% compared to non-diabetic controls.
HN levels, as expected, were negatively associated with other clinical markers of insulin resistance, triglyceride and ALT however only ALT and HbA1c independently contributed to the variation in the circulating HN levels in our combined cohort. In the diabetic groups, an association with BMI was identified in the poorly-controlled T2D group suggesting an added negative impact of obesity. HN concentrations have positive correlation with TCH, LDL, and HDL and negative correlation with triglycerides which cannot be fully explained in this study. However, previous studies in obese mice show intracerebroventricular infusion of HN analog decreases hepatic triglyceride accumulation promotes hepatic microsomal triglyceride transfer protein (MTTP) activity and there by increases serum triglycerides (32).
Serum HN concentration inversely correlated with age in the combined group, since the T2D group with poor control was significantly older than the non-diabetic controls and since HN is lower in T2D than non DM subjects we performed multiple linear regression analysis comparisons and found that age is not a significant contributor in the multivariable model. A previous study plagued by the same confounder reported that circulating HN to be lower in elderly people and in prediabetes subjects (33); and is confirmed in our study. Altered HN levels in prediabetes and T2D could serve as a potential biomarker; however, additional work is required to determine the contribution of age and other factors that are modifiable such as fitness level and adiposity. HN levels are reported to be altered in other metabolic diseases including type 1 diabetes (34), cardiovascular disease (35, 36), memory loss, amyotrophic lateral sclerosis (37), stroke (38), and inflammation (39). HN is present in the blood, cerebrospinal fluid and in seminal fluid (40–42), however, it is still not clear which tissue(s) contributes most to the circulating HN pool in humans. Given its mitochondrial origin, one would presume majority of the metabolically active tissues such as heart, liver, adipose tissue, and skeletal muscle would contribute to the circulating HN pool.
Exercise promotes skeletal muscle HN expression in prediabetes subjects, suggesting a potential role for HN in glucose metabolism (43). In rodents, HN and its analogs promote insulin sensitivity and restore glucose homeostasis under hyperinsulinemic euglycemic clamp conditions (23). Peripheral administration of HN delayed the onset of diabetes and improved beta cell survival in non-obese type 1 diabetes (NOD) mice (26). In cultured beta cells, HNG-F6A, a potent analog of HN, promoted mitochondrial metabolism and ATP generation, indicating a role for HN in substrate metabolism (22). HNG-F6A reduces oxidative stress and prevents atherosclerosis progression in ApoE knockout mice (44). The above studies suggest that HN and its analog may function as potent regulators of oxidative stress and glucose metabolism.
Accumulating literatures suggest that mitochondrial dysfunction is a salient feature in T2D. Reduction in skeletal muscle mtDNA and diminished oxidative capacity in T2D subjects have been observed in T2D subjects who fail to respond to exercise intervention (45), decreased mtDNA content strongly correlates with IR and lower mtDNA strongly associated with reduced capacity of glucose-stimulated insulin secretion in prediabetes and T2D subjects (46).
The lower levels of HN in T2D subjects might be a net effect or secondary response to the elevated ROS production, oxidative stress and lowered mtDNA copy number (47), which are all risk factors for IR. Preceding studies have shown no significant changes in HN levels between healthy men and women, and this was confirmed here (34). HN levels were not affected by the differing anti-diabetes treatment regimens: HN was similar in newly diagnosed T2D subjects and those on anti-diabetes therapy for more than 6 months. Anti-diabetes therapy such as insulin, metformin, combination of insulin + an oral hypoglycemic agent or combination of metformin + an oral hypoglycemic agent for more than 6 months did not alter serum HN levels in our study cohort.
Increasing adiponectin expression reduces metabolic abnormalities associated with obesity and T2D. Our data are in agreement with a previous report (48) that ADP concentrations are reduced in prediabetes and T2D. Our data are also consistent with the findings that ADP knockout mice have decreased mitochondrial content in skeletal muscle associated with insulin resistance and mitochondrial dysfunctional skeletal muscle (49): and that adiponectin may affect mitochondrial biogenesis (30). Thus the lower mitochondrial function may be a consequence of the lower adiponectin levels: certainly the association of ADP with HN was clearly seen in this study.
Serum MOTS-c levels reflected those of HN, although only in poorly-controlled T2D subjects compared to non-diabetes subjects. The T2D poor control group was significantly older compared to control group, however, age was found inversely correlate with MOTS-c concentrations in bivariate analysis but not in multivariate modeling. As in the case of HN, we are not able to determine the exact contribution of poorer glycemic control in T2D or aging on serum MOTS-c in these patients. MOTS-c levels in the circulation were positively correlated with lipids TCH, LDL, and HN in the whole cohort in bivariate analysis but only HN and TCH remained significant in multiple linear regression analysis. MOTS-c negatively correlated with age and HbA1c in combined group analysis.
There is little known about MOTS-c in metabolic disease (38, 39), although preclinical studies demonstrate a positive impact on glucose metabolism. Recently, two studies reported conflicting findings in circulating MOTS-c levels in lean and obese subjects. Cataldo et al. reported MOTS-c levels to be the same in a small group of obese and non-obese subjects with a positive association with IR only in lean subjects (50). Conversely, Du et al. reported that MOTS-c levels are significantly lower in obese male children and adolescents compared to females, and also showed a negative correlation with BMI, HOMA, HbA1c, and fasting insulin in male subjects (51). Of note, the study from Du et al. used commercially available elisa kit (# CEX132HU, Cloud clone corporation, China) and reported circulating MOTS-c to be nearly 1,000-fold higher compared to the study from Cataldo et al. which employed non-commercial elisa kit. This suggests that the immunoreactive species in the circulation detected by these two different kits are not same. The favorable effects of MOTS-c on insulin sensitivity and glucose metabolism have been seen in animal models (24), with MOTS-c enhancing glucose utilization, promotion of insulin sensitivity and restoration of metabolic homeostasis through activation of an AMPK and AKT dependent mechanism in rodent skeletal muscle and in vitro models. MOTS-c protects mice against insulin resistance induced by obesity and aging (24). MOTS-c inhibits bone loss and reduced the osteoporosis rate in an ovariectomy-induced osteoporosis mice model (52), promotes endothelial function in rodents and the level was reduced in patients with impaired endothelial function (53).
HN levels correlated positively with MOTS-c and with ADP in our group analysis both in univariate and multivariate modeling. One possible explanation for this positive relationship between MDPS could be that both HN and MOTS-c are released simultaneously into circulation to counter act the oxidative stress induced by hyperglycemia. This is supported by previous findings in cellular and rodent models that HN inhibits oxidative stress, rescues mitochondrial function, lowers apoptotic rate and enhances glucose metabolism (54). It has been shown that HN analog (HNG) enhances intracellular anti-oxidant capacity, preserves mitochondrial membrane potential, ATP levels and restores mitochondrial integrity in rat myoblasts (H9c2 cells) (55), inhibits mitochondrial complex 1 activity and prevents mitochondrial dysfunction and oxidative stress induced by H2O2 in isolated cardiac mitochondria (56). MOTS-c is also regulated by stress; it translocates to the nucleus in response to glucose restriction-induced metabolic stress and modulates nuclear gene expression in AMPK dependent manner (57).
The strength of this study is being a relatively large scale cohort conducted to address the importance of MDP in diabetes and non-diabetic control subjects. Limitations of the study include its retrospective design dependent on previously measured clinical parameters. Both T2D patients and the control group were overweight or obese; therefore it was not possible to determine the contribution of obesity to circulating MDP. Samples used in the study were randomly collected for this reason it was not possible to determine HOMA-IR or other indices of insulin resistance derived from fasting glucose and insulin levels. Furthermore, the non- diabetes subjects were younger obscuring the contribution of age on MDP concentrations.
In conclusion, the present study demonstrates the MDPs HN and MOT-c expression were lower in T2D and were related to the HbA1c, and HN was associated with ADP, giving additional evidence that mitochondrial dysfunction contributes to glycemic dysregulation and metabolic effects in T2D. Additional studies are required to determine the role of MDPs in the metabolic dysregulation of T2D.
Ethics Statement
This was a cross-sectional study performed using blood samples collected from Qatari T2D subjects attending the outpatient department and endocrinology clinics at Hamad Medical Corporation according to an IRB approved protocol (HMC#9093/09 and WCM-Q#13-00063). All study participants gave informed written consent before participation in the study.
Author Contributions
MR designed the experiments, performed the experiments, analyzed, interpreted data, and prepared the manuscript. IB performed ELISA studies with subsequent analysis. JJ performed ELISA studies prepared graphical presentation. PC analyzed the data and performed statistical analysis. CA provided the samples and revised the manuscript. MS verified all obtained results, analyzed the data, and revised the manuscript. SA and A-BA-S designed the experiments, analyzed data, and revised the manuscript. All authors took part in preparation and modification of figures and the manuscript.
Conflict of Interest Statement
The authors declare that the research was conducted in the absence of any commercial or financial relationships that could be construed as a potential conflict of interest.
Acknowledgments
The authors would like to thank Qatar metabolic institute, Medical research Center, iTRI, Hamad Medical Corporation, Doha, Qatar. Weill Cornell Medicine Qatar, Qatar Foundation, Doha, Qatar and Qatar National Library for the support. The publication charges for this article was funded by Qatar National Library.
Abbreviations
T2D, Type 2 diabetes; IR, insulin resistance; MOTS-c, mitochondrial open reading frame of the 12S rRNA type-c; HN, humanin; BMI, body mass index; SBP, systolic blood pressure; DBP, diastolic blood pressure; TCH, total cholesterol; HDL, high density lipoprotein; LDL, low density lipoprotein; TG, triglycerides; HbA1c, glycated hemoglobin; ALT, alanine aminotransferase; TCH, total cholesterol; AMPK, 5’ AMP-activated protein kinase; ROS, reactive oxygen species; H2O2, hydrogen peroxide.
References
1. Hu FB. Globalization of diabetes: the role of diet, lifestyle, and genes. Diabetes Care. (2011) 34:1249–57. doi: 10.2337/dc11-0442
2. Christos PJ, Chemaitelly H, Abu-Raddad LJ, Ali Zirie M, Deleu D, Mushlin AI. Prevention of type II diabetes mellitus in Qatar: who is at risk? Qatar Med J. (2014) 2014:70–81. doi: 10.5339/qmj.2014.13
3. Ali FM, Nikoloski Z, Reka H, Gjebrea O, Mossialos E. The diabetes-obesity-hypertension nexus in Qatar: evidence from the World Health Survey. Popul Health Metr. (2014) 12:18. doi: 10.1186/1478-7954-12-18
4. Grundy SM. Adipose tissue and metabolic syndrome: too much, too little or neither. Eur J Clin Invest. (2015) 45:1209–17. doi: 10.1111/eci.12519
5. Wainwright P, Byrne CD. Bidirectional relationships and disconnects between NAFLD and features of the metabolic syndrome. Int J Mol Sci. (2016) 17:367. doi: 10.3390/ijms17030367
6. Izadi V, Farabad E, Azadbakht L. Epidemiologic evidence on serum adiponectin level and lipid profile. Int J Prev Med. (2013) 4:133–40.
7. Esser N, Paquot N, Scheen AJ. Inflammatory markers and cardiometabolic diseases. Acta Clin Belg. (2015) 70:193–9. doi: 10.1179/2295333715Y.0000000004
8. Shimabukuro M, Kozuka C, Taira S, Yabiku K, Dagvasumberel M, Ishida M, et al. Ectopic fat deposition and global cardiometabolic risk: new paradigm in cardiovascular medicine. J Med Invest. (2013) 60:1–14. doi: 10.2152/jmi.60.1
9. Fang X, Liu H, Zhang X, Zhang H, Qin X, Ji X. Metabolic syndrome, its components, and diabetes on 5-year risk of recurrent stroke among mild-to-moderate ischemic stroke survivors: a multiclinic registry study. J Stroke Cerebrovasc Dis. (2016) 25:626–34. doi: 10.1016/j.jstrokecerebrovasdis.2015.11.017
10. Ganzetti G, Campanati A, Molinelli E, Offidani A. Psoriasis, non-alcoholic fatty liver disease, and cardiovascular disease: three different diseases on a unique background. World J Cardiol. (2016) 8:120–31. doi: 10.4330/wjc.v8.i2.120
11. Marino L, Jornayvaz FR. Endocrine causes of nonalcoholic fatty liver disease. World J Gastroenterol. (2015) 21:11053–76. doi: 10.3748/wjg.v21.i39.11053
12. Sharma S, Adrogue JV, Golfman L, Uray I, Lemm J, Youker K, et al. Intramyocardial lipid accumulation in the failing human heart resembles the lipotoxic rat heart. FASEB J. (2004) 18:1692–700. doi: 10.1096/fj.04-2263com
13. Foster-Schubert KE, Alfano CM, Duggan CR, Xiao L, Campbell KL, Kong A, et al. Effect of diet and exercise, alone or combined, on weight and body composition in overweight-to-obese postmenopausal women. Obesity. (2012) 20:1628–38. doi: 10.1038/oby.2011.76
14. Lu H, Koshkin V, Allister EM, Gyulkhandanyan AV, Wheeler MB. Molecular and metabolic evidence for mitochondrial defects associated with beta-cell dysfunction in a mouse model of type 2 diabetes. Diabetes. (2010) 59:448–59. doi: 10.2337/db09-0129
15. Sivitz WI, Yorek MA. Mitochondrial dysfunction in diabetes: from molecular mechanisms to functional significance and therapeutic opportunities. Antioxid Redox Signal. (2010) 12:537–77. doi: 10.1089/ars.2009.2531
16. Wang CH, Wang CC, Wei YH. Mitochondrial dysfunction in insulin insensitivity: implication of mitochondrial role in type 2 diabetes. Ann N Y Acad Sci. (2010) 1201:157–65. doi: 10.1111/j.1749-6632.2010.05625.x
17. DiMauro S, Schon EA. Mitochondrial respiratory-chain diseases. N Engl J Med. (2003) 348:2656–68. doi: 10.1056/NEJMra022567
18. Kadowaki H, Tobe K, Mori Y, Sakura H, Sakuta R, Nonaka I, et al. Mitochondrial gene mutation and insulin-deficient type of diabetes mellitus. Lancet. (1993) 341:893–4. doi: 10.1016/0140-6736(93)93101-6
19. Blake R, Trounce IA. Mitochondrial dysfunction and complications associated with diabetes. Biochim Biophys Acta (BBA). (2014) 1840:1404–12. doi: 10.1016/j.bbagen.2013.11.007
20. Nishikawa T, Araki E. Impact of mitochondrial ROS production in the pathogenesis of diabetes mellitus and its complications. Antioxid Redox Signal. (2007) 9:343–53. doi: 10.1089/ars.2006.1458
21. Mercer TR, Neph S, Dinger ME, Crawford J, Smith MA, Shearwood AM, et al. The human mitochondrial transcriptome. Cell. (2011) 146:645–58. doi: 10.1016/j.cell.2011.06.051
22. Kuliawat R, Klein L, Gong Z, Nicoletta-Gentile M, Nemkal A, Cui L, et al. Potent humanin analog increases glucose-stimulated insulin secretion through enhanced metabolism in the beta cell. FASEB J. (2013) 27:4890–8. doi: 10.1096/fj.13-231092
23. Muzumdar RH, Huffman DM, Atzmon G, Buettner C, Cobb LJ, Fishman S, et al. Humanin: a novel central regulator of peripheral insulin action. PLoS ONE. (2009) 4:e6334. doi: 10.1371/journal.pone.0006334
24. Lee C, Zeng J, Drew BG, Sallam T, Martin-Montalvo A, Wan J, et al. The mitochondrial-derived peptide MOTS-c promotes metabolic homeostasis and reduces obesity and insulin resistance. Cell Metab. (2015) 21:443–54. doi: 10.1016/j.cmet.2015.02.009
25. Alis R, Lucia A, Blesa JR, Sanchis-Gomar F. The role of mitochondrial derived peptides (MDPs) in metabolism. J Cell Physiol. (2015) 230:2903–4. doi: 10.1002/jcp.25023
26. Hoang PT, Park P, Cobb LJ, Paharkova-Vatchkova V, Hakimi M, Cohen P, et al. The neurosurvival factor Humanin inhibits beta-cell apoptosis via signal transducer and activator of transcription 3 activation and delays and ameliorates diabetes in nonobese diabetic mice. Metab Clin Exp. (2010) 59:343–9. doi: 10.1016/j.metabol.2009.08.001
27. Cobb LJ, Lee C, Xiao J, Yen K, Wong RG, Nakamura HK, et al. Naturally occurring mitochondrial-derived peptides are age-dependent regulators of apoptosis, insulin sensitivity, and inflammatory markers. Aging. (2016) 8:796–809. doi: 10.18632/aging.100943
28. Antuna-Puente B, Feve B, Fellahi S, Bastard J-P. Adipokines: the missing link between insulin resistance and obesity. Diabetes Metab. (2008) 34:2–11. doi: 10.1016/j.diabet.2007.09.004
29. Fantuzzi G. Adipose tissue, adipokines, and inflammation. J Allergy Clin Immunol. (2005) 115:911–9. doi: 10.1016/j.jaci.2005.02.023
30. O'Brien LC, Graham ZA, Chen Q, Lesnefsky EJ, Cardozo C, Gorgey AS. Plasma adiponectin levels are correlated with body composition, metabolic profiles, and mitochondrial markers in individuals with chronic spinal cord injury. Spinal Cord. (2018) 56:863–72. doi: 10.1038/s41393-018-0089-8
31. Forouhi NG, Luan J, Hennings S, Wareham NJ. Incidence of Type 2 diabetes in England and its association with baseline impaired fasting glucose: the Ely study 1990-2000. Diabetic Med J Br Diabetic Assoc. (2007) 24:200–7. doi: 10.1111/j.1464-5491.2007.02068.x
32. Gong Z, Su K, Cui L, Tas E, Zhang T, Dong HH, et al. Central effects of humanin on hepatic triglyceride secretion. Am J Physiol Endocrinol Metab. (2015) 309:E283–92. doi: 10.1152/ajpendo.00043.2015
33. Voigt A, Jelinek HF. Humanin: a mitochondrial signaling peptide as a biomarker for impaired fasting glucose-related oxidative stress. Physiol Rep. (2016) 4:1–5. doi: 10.14814/phy2.12796
34. Lytvyn Y, Wan J, Lai V, Cohen P, Cherney DZ. The effect of sex on humanin levels in healthy adults and patients with uncomplicated type 1 diabetes mellitus. Can J Physiol Pharmacol. (2015) 93:239–43. doi: 10.1139/cjpp-2014-0401
35. Muzumdar RH, Huffman DM, Calvert JW, Jha S, Weinberg Y, Cui L, et al. Acute humanin therapy attenuates myocardial ischemia and reperfusion injury in mice. Arterioscler Thromb Vasc Biol. (2010) 30:1940–8. doi: 10.1161/ATVBAHA.110.205997
36. Zhang X, Urbieta-Caceres VH, Eirin A, Bell CC, Crane JA, Tang H, et al. Humanin prevents intra-renal microvascular remodeling and inflammation in hypercholesterolemic ApoE deficient mice. Life Sci. (2012) 91:199–206. doi: 10.1016/j.lfs.2012.07.010
37. Matsuoka M, Hashimoto Y, Aiso S, Nishimoto I. Humanin and colivelin: neuronal-death-suppressing peptides for Alzheimer's disease and amyotrophic lateral sclerosis. CNS Drug Rev. (2006) 12:113–22. doi: 10.1111/j.1527-3458.2006.00113.x
38. Xu X, Chua CC, Gao J, Hamdy RC, Chua BH. Humanin is a novel neuroprotective agent against stroke. Stroke. (2006) 37:2613–9. doi: 10.1161/01.STR.0000242772.94277.1f
39. Zhao ST, Zhao L, Li JH. Neuroprotective Peptide humanin inhibits inflammatory response in astrocytes induced by lipopolysaccharide. Neurochem Res. (2013) 38:581–8. doi: 10.1007/s11064-012-0951-6
40. Widmer RJ, Flammer AJ, Herrmann J, Rodriguez-Porcel M, Wan J, Cohen P, et al. Circulating humanin levels are associated with preserved coronary endothelial function. Am J Physiol Heart Circ Physiol. (2013) 304:H393–7. doi: 10.1152/ajpheart.00765.2012
41. Chin YP, Keni J, Wan J, Mehta H, Anene F, Jia Y, et al. Pharmacokinetics and tissue distribution of humanin and its analogues in male rodents. Endocrinology. (2013) 154:3739–44. doi: 10.1210/en.2012-2004
42. Moretti E, Giannerini V, Rossini L, Matsuoka M, Trabalzini L, Collodel G. Immunolocalization of humanin in human sperm and testis. Fertil Steril. (2010) 94:2888–90. doi: 10.1016/j.fertnstert.2010.04.075
43. Gidlund EK, von Walden F, Venojarvi M, Riserus U, Heinonen OJ, Norrbom J, Sundberg CJ. Humanin skeletal muscle protein levels increase after resistance training in men with impaired glucose metabolism. Physiol Rep. (2016) 4:1–10. doi: 10.14814/phy2.13063
44. Oh YK, Bachar AR, Zacharias DG, Kim SG, Wan J, Cobb LJ, et al. Humanin preserves endothelial function and prevents atherosclerotic plaque progression in hypercholesterolemic ApoE deficient mice. Atherosclerosis. (2011) 219:65–73. doi: 10.1016/j.atherosclerosis.2011.06.038
45. Stephens NA, Xie H, Johannsen NM, Church TS, Smith SR, nd Sparks LM. A transcriptional signature of “exercise resistance” in skeletal muscle of individuals with type 2 diabetes mellitus. Metab Clin Exp. (2015) 64:999–1004. doi: 10.1016/j.metabol.2015.06.008
46. Gianotti TF, Sookoian S, Dieuzeide G, Garcia SI, Gemma C, Gonzalez CD, et al. A decreased mitochondrial DNA content is related to insulin resistance in adolescents. Obesity. (2008) 16:1591–5. doi: 10.1038/oby.2008.253
47. Tan BL, Norhaizan ME, Liew WP. Nutrients and oxidative stress: friend or foe? Oxid Med Cell Longev. (2018) 2018:9719584. doi: 10.1155/2018/9719584
48. Kim JY, Bacha F, Tfayli H, Michaliszyn SF, Yousuf S, Arslanian S. Adipose tissue insulin resistance in youth on the spectrum from normal weight to obese and from normal glucose tolerance to impaired glucose tolerance to type 2 diabetes. Diabetes care. (2018) 42:265–72. doi: 10.2337/dc18-1178
49. Civitarese AE, Ukropcova B, Carling S, Hulver M, DeFronzo RA, Mandarino L, et al. Role of adiponectin in human skeletal muscle bioenergetics. Cell Metab. (2006) 4:75–87. doi: 10.1016/j.cmet.2006.05.002
50. Cataldo LR, Fernandez-Verdejo R, Santos JL, Galgani JE. Plasma MOTS-c levels are associated with insulin sensitivity in lean but not in obese individuals. J Invest Med. (2018) 66:1019–22. doi: 10.1136/jim-2017-000681
51. Du C, Zhang C, Wu W, Liang Y, Wang A, Wu S, et al. Circulating MOTS-c levels are decreased in obese male children and adolescents and associated with insulin resistance. Pediatr Diabetes. (2018) 19:1058–1064. doi: 10.1111/pedi.12685
52. Ming W, Lu G, Xin S, Huanyu L, Yinghao J, Xiaoying L, et al. Mitochondria related peptide MOTS-c suppresses ovariectomy-induced bone loss via AMPK activation. Biochem Biophys Res Commun. (2016) 476:412–9. doi: 10.1016/j.bbrc.2016.05.135
53. Qin Q, Delrio S, Wan J, Jay Widmer R, Cohen P, Lerman LO, et al. Downregulation of circulating MOTS-c levels in patients with coronary endothelial dysfunction. Int J Cardiol. (2018) 254:23–7. doi: 10.1016/j.ijcard.2017.12.001
54. Rosenbaum D, Haber RS, Dunaif A. Insulin resistance in polycystic ovary syndrome: decreased expression of GLUT-4 glucose transporters in adipocytes. Am J Physiol. (1993) 264:E197–202. doi: 10.1152/ajpendo.1993.264.2.E197
55. Klein LE, Cui L, Gong Z, Su K, Muzumdar R. A humanin analog decreases oxidative stress and preserves mitochondrial integrity in cardiac myoblasts. Biochem Biophys Res Commun. (2013) 440:197–203. doi: 10.1016/j.bbrc.2013.08.055
56. Thummasorn S, Shinlapawittayatorn K, Khamseekaew J, Jaiwongkam T, Chattipakorn SC, Chattipakorn N. Humanin directly protects cardiac mitochondria against dysfunction initiated by oxidative stress by decreasing complex I activity. Mitochondrion. (2018) 38:31–40. doi: 10.1016/j.mito.2017.08.001
Keywords: type 2 diabetes, mitochondrial derived peptides, humanin, mitochondrial open reading frame of the 12S rRNA type-c, glycated hemoglobin, triglycerides and insulin resistance
Citation: Ramanjaneya M, Bettahi I, Jerobin J, Chandra P, Abi Khalil C, Skarulis M, Atkin SL and Abou-Samra A-B (2019) Mitochondrial-Derived Peptides Are Down Regulated in Diabetes Subjects. Front. Endocrinol. 10:331. doi: 10.3389/fendo.2019.00331
Received: 18 January 2019; Accepted: 07 May 2019;
Published: 31 May 2019.
Edited by:
Undurti Narasimha Das, UND Life Sciences LLC, United StatesReviewed by:
Penghua Fang, Nanjing University of Chinese Medicine, ChinaKatsuhiko Kohara, Ehime University, Japan
Copyright © 2019 Ramanjaneya, Bettahi, Jerobin, Chandra, Abi Khalil, Skarulis, Atkin and Abou-Samra. This is an open-access article distributed under the terms of the Creative Commons Attribution License (CC BY). The use, distribution or reproduction in other forums is permitted, provided the original author(s) and the copyright owner(s) are credited and that the original publication in this journal is cited, in accordance with accepted academic practice. No use, distribution or reproduction is permitted which does not comply with these terms.
*Correspondence: Manjunath Ramanjaneya, bXJhbWFuamFuZXlhQGhhbWFkLnFh; Stephen Lawrence Atkin, c2xhMjAwMkBxYXRhci1tZWQuY29ybmVsbC5lZHU=; Abdul-Badi Abou-Samra, YXNhbXJhQGhhbWFkLnFh
†Joint senior authors