 Hayat Aljaibeji1
 Debasmita Mukhopadhyay1
 Abdul Khader Mohammed1
 Sarah Dhaiban1
 Mahmood Y. Hachim1
 Noha M. Elemam1
 Nabil Sulaiman1
 Albert Salehi2
 Jalal Taneera1*
- 1Sharjah Institute for Medical Research, University of Sharjah, Sharjah, United Arab Emirates
- 2Department of Clinical Sciences, Lund University Diabetes Centre (LUDC), Lund University, Malmö, Sweden
Previous work has shown that reduced expression of PLCXD3, a member of the phosphoinositide-specific phospholipases (PI-PLC) family, impaired insulin secretion with an unclear mechanism. In the current study, we aim to investigate the mechanism underlying this effect using human islets and rat INS-1 (832/13) cells. Microarray and RNA sequencing data showed that PLCXD3 is among the highly expressed PI-PLCs in human islets and INS-1 (832/13) cells. Expression of PLCXD3 was reduced in human diabetic islets, correlated positively with Insulin and GLP1R expression and inversely with the donor's body mass index (BMI) and glycated hemoglobin (HbA1c). Expression silencing of PLCXD3 in INS-1 (832/13) cells was found to reduce glucose-stimulated insulin secretion (GSIS) and insulin content. In addition, the expression of Insulin, NEUROD1, GLUT2, GCK, INSR, IRS2, and AKT was downregulated. Cell viability and apoptosis rate were unaffected. In conclusion, our data suggest that low expression of PLCXD3 in pancreatic β-cells associates with downregulation of the key insulin signaling and insulin biosynthesis genes as well as reduction in glucose sensing.
Introduction
Phosphoinositide-specific phospholipase C (PI-PLC) is an enzyme that hydrolyzes the membrane phospholipid phosphatidylinositol-4,5-bisphosphate (PIP2) to inositol-1,4,5-trisphosphate (IP3) and diacylglycerol in response to external stimuli such as hormones, neurotransmitter, and growth factors (1). There are six different subtypes of PI-PLCs (β, γ, δ, ε, ζ, and η) that have been identified and isolated from different tissues in humans, including brain, heart, spleen, thymus, and hematopoietic cells (2). The majority of the PI-PLC subtypes (with an exception of PLC-β and PLC-γ) have a C2 domain (calcium-binding motif), which plays an essential role in membrane interactions (2). Additionally, all PI-PLC subtypes hold distinct tissue distribution patterns with a distinctive function in regulating cell metabolism (3). In human islets, little is known about the expression of PI-PLC subtypes. However, it has been previously reported that rodent pancreatic islets contain the three major PLC subtypes classes (β1, γ1, and δ1). Various studies have linked the PI-PLC with the regulation of insulin secretion and pancreatic β-cell function, where calcium influx was shown to activate PI-PLC in a positive feedback manner resulting in exocytosis (4–6).
In 2012, Gellatly et al. have identified a new class of PI-PLC, which contains only a catalytic X domain in its structure termed phospholipase C X domain containing protein (PLCXD3) (3). Three different isoforms of PLCXD (PLCXD1, PLCXD2, and PLCXD3) have been recognized; each has a distinct function depending on their tissue distribution and cellular localization. Furthermore, it was found that PLCXD proteins function as active phosphodiesterases as shown by the increase of inositol phosphate turnover (3). The PLCXD3 isoform was shown to localize in cytoplasmic and perinuclear vesicles in HeLa cells. At the messenger RNA (mRNA) level, PLCXD3 expression was found to be predominant in the brain (3). Additionally, PLCXD3 has been ascribed a role in early-onset bipolar disorder vulnerability, sporadic Creutzfeldt–Jakob disease and the mouse olfactory sensory neurons (7–9). Moreover, a mutation in the PLCXD3 gene has been linked to rapid-onset obesity with hypothalamic dysfunction, hypoventilation, and autonomy dysregulation (ROHHAD) (10).
In previous work, siRNA silencing of PLCXD3 in INS-1 (832/13) cells markedly reduced in glucose-stimulated insulin secretion (GSIS), indicating that the gene is a key molecule in the pancreatic β-cell function (11). However, how PLCXD3 mediates insulin secretion impairment is not fully understood. In the present study, we shed more light on the expression profile of the PI-PLC subtypes overall and PLCXD3 in particular using microarray and RNA sequencing expression data from isolated human islets and INS-1 (832/13) cells. Further, we performed several functional studies to investigate the consequences of PLCXD3 silencing on insulin biosynthesis, insulin secretion, cell viability, apoptosis, and expression of key β-cell function genes.
Materials and Methods
Human Pancreatic Islets
Islets were obtained from the Human Tissue Laboratory at Lund University Diabetes Centre in collaboration with the Nordic Network for Clinical Islet Transplantation (Uppsala University, Sweden) (12). Islets were collected from 170 donors with no history of diabetes (65 females and 105 males, age 58.9 ± 10, BMI 26.2 ± 3.5, HbA1c 5.7 ± 0.7, days in culture 3.5 ± 1.9) and 32 donors with type 2 diabetes (T2D) (10 females and 22 males, age 61.7 ± 11, BMI 28.1 ± 4.5, HbA1c 7.0 ± 1.2, and days in culture 2 ± 1.0). Written informed consent has been obtained from the patients or relative in accordance with the Declaration of Helsinki. The local ethics committees at both Uppsala and Lund universities (Sweden) have approved all procedures with human islets isolation and investigations (approval number: 2011–5).
Microarray Gene Expression
The Affymetrix gene expression array (Human Gene 1.0 ST, n of donors = 67 non-diabetics + 10 with T2D; and Rat 2.0 ST, n = 3) was performed as previously described (12). The robust multi-array analysis (RMA) method was used to normalize array data. The background values of the arrays were set based on the mean expression values of all negative probe sets. Genes with expression levels higher than the background values are likely to be expressed, whereas genes with expression levels lower than the background values are not. Human expression data are deposited in a Gene Expression Omnibus (GEO) database with accession numbers GSE 50398 and GSE 50397.
RNA Sequencing Expression of PLCXD3 in Isolated Human Islets
RNA sequencing was performed (non-diabetic = 170 and T2D = 32) using Illumina's TruSeq as described previously (13). The human reference genome (hg19) was used to align the output reads with STAR (14). Expression data were presented as fragments/kilobase of exon per million fragments mapped (FPKM) or transformed into log2 counts per million using the voom-function (edgeR/limma R packages).
RNA Sequencing in INS-1 (832/13) Cells
The RNA sequencing was performed on a BGISEQ-500 RS platform at the Beijing Genomics Institution (BGI, Shenzhen, China) (www.genomics.org.cn). Briefly, RNAs (from control and treated cells, three replicates for each treatment) were fragmented to prepare complementary DNA (cDNA) libraries using the RNA fragments as templates for N6 random primers. The quantity and quality of the cDNA libraries were assessed using an Agilent 2100 Bioanalyzer. Finally, the libraries were sequenced on the BGISEQ-500 with 50 single-end reads. Sequencing reads that contained adapters, had low quality, or aligned to rRNA were filtered off before mapping. Clean reads were aligned to the hg19 UCSC RefSeq (RNA sequences, GRCh37) using bowtie2. Fragments per kilobase of transcript per million mapped reads values were obtained by transforming mapped transcript reads using RSEM. Differential expression analysis was performed by DESeq2. Differentially expressed genes were defined as genes with fold change ≥0.8 and p-value ≤ 0.05. Clean reads were mapped to the hg19 genome using hisat2.
siRNA Silencing of PLCXD3 in INS-1 (832/13) Cells and Insulin Secretion Measurements
The rat clonal pancreatic INS-1 (832/13) β-cells (a kind gift from Dr. Chris Newgard, Duke University) were maintained in RPMI-1640 medium (15). INS-1 (832/13) cells were cultured in a 24-well plate in complete RPMI-1640 medium without antibiotics overnight and then were transfected with two different siRNA sequences for PLCXD3 (s160317 and s160319) (Thermo Fisher Scientific, USA) along with the Lipofectamine 3000 transfection reagent and siRNA negative control sequence at a concentration of 40 nM (Thermo Fisher Scientific) (16). After 48 h, cells were washed with pre-warmed secretion assay buffer (11, 17) containing 2.8 mM glucose and then pre-incubated with the same buffer for 2 h. Next, the buffer was removed, and cells were incubated with 1 ml of SAB containing either 2.8 or 16.7 mM glucose for 1 h. Stimulated insulin secretion was assessed using a rat insulin ELISA kit (Elabsciences, China). For insulin content measurements, the total protein was extracted from transfected cells using an M-PER reagent (Thermo Fisher Scientific, USA) and quantified by Pierce BCA protein assay kit (Thermo Fisher Scientific, USA). The total protein was diluted (1:250), and insulin content was assessed using ELISA (Elabsciences). Finally, insulin content was normalized to the total amount of protein.
To evaluate the effect of hyperglycemia exposure on the expression of PLCXD3, INS-1 (832/13) cells were cultured for 24 h at 11.1 mM (control) and 16.7 and 22.2 mM glucose at mRNA and protein levels.
Quantitative RT-qPCR
Extraction of total RNA from intact human pancreatic islets was performed using the RNeasy Plus Mini Kit (Qiagen, Germany). RNA quantity and quality were measured by NanoDrop 2000 and Agilent 2100 Bioanalyzer. For cDNA synthesis, a high-capacity cDNA synthesis kit was used (Thermo Fisher Scientific, USA). Silencing efficiency and gene expression analysis were assessed using TaqMan gene expression assays; PLCXD3 (Rn01762608_m1), INS1 (Rn02121433_g1), INS2 (Rn01774648_g1), MAFA (Rn00845206_g1), PDX1 (Rn00755591_m1), INSR (Rn00690703_m1), GCK (Rn00561265_m1), GLUT2 (Rn00563565_m1). HPRT1 (Rn01527840_m1) was used as an endogenous control to normalize the expression of target mRNA. SYBR Green qPCR gene expression analysis with the corresponding primers (Table 1) was used for NEUROD1, NKX2.2, and HPRT1. Relative gene expression was performed using the 2−ΔΔCt method. All reactions were executed in QuantStudio 3 Real-time PCR (Applied Biosystems, USA).
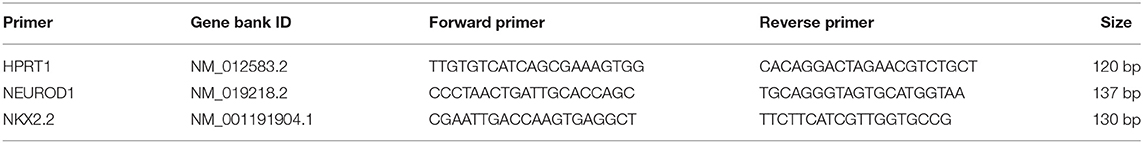
Table 1. SYBR Green qPCR primer sequences.
Apoptosis and MTT Assays
The impact of PLCXD3 on INS-1 (832/13) cell apoptosis rate was evaluated using annexin-V staining in PLCXD3-silenced cells compared to control cells using flow cytometry (FACSAria III, BD Biosciences, USA) as described previously (18). Cell viability was assessed using MTT colorimetric assay (Sigma-Aldrich, Germany) in transfected cells as described previously (18).
Western Blot Analysis
Total protein was extracted using an M-PER reagent containing protease inhibitor cocktail (Thermo Fisher Scientific, USA). A lysate containing a 30–40 μg sample of total protein was separated by SDS-PAGE (10%) and transferred onto a nitrocellulose membrane (Bio-Rad, USA). The membranes were blocked with 5% skimmed milk prepared in Tris-buffered saline with 0.1% Tween 20 (TBS-T) for 1 h. The blot was probed with PLCXD3 (anti-rabbit; #PA5-71235, Thermo Fisher Scientific), Insulin (anti-mouse; #8138s, Cell Signaling Technology, USA), INSRα (anti-rabbit; #ab5500, Abcam), PDX1 (anti-rabbit; #ab47267, Abcam), GLUT2 (anti-rabbit; #ab54460, Abcam), AKT1/2/3 (anti-Rabbit; #Ab179463, Abcam), IRS2 [Phospo (s731), #ab3690, Abcam], NeuroD1 (anti-rabbit, #ab213725, Abcam), or GCK (anti-rabbit; #ab37796, Abcam) antibody overnight at 4°C with the same procedure probing with primary antibodies against β-actin (Sigma-Aldrich). The secondary horseradish peroxidase (HRP)-linked anti-mouse (#7076S, Cell Signaling Technology, USA) and HRP-linked anti-rabbit (#7074S, Cell Signaling) antibodies were added to the membranes at 1:1,000 dilutions for 1 h. Chemiluminescence was detected using the Clarity ECL substrate kit (Bio-Rad, USA). Protein bands were quantified using the Bio-Rad Image Lab software (ChemiDoc™ Touch Gel Western Blot Imaging System; Bio-Rad, USA). β-Actin was used as an endogenous control.
Statistical Analysis
The edge-R was used to calculate differential gene expression (adjusted for age, sex, and BMI) in human islets. Correlation of gene expression and phenotypes was calculated by a linear regression model adjusted for sex, age, and BMI or Spearman's test. p-values illustrating the significance were calculated using the eBayes function in limma (19). For insulin secretion and qRT-PCR analysis, we used a parametric unpaired two-tailed Student's t-test. Data are presented as mean ± SEM unless otherwise stated. Statistical significance was indicated by asterisks (*p < 0.05, **p < 0.01, ***p < 0.001).
Results
Microarray Expression Profile of PI-PLC Subtypes in Human and Rat Cells
Expression of PI-PLC subtypes in human pancreatic islets is not well-characterized. Thus, using microarray expression from non-diabetic islets (n = 67), we examined the expression of 18 PI-PLC subtypes. PLCε1 and PLCXD3 were the most highly expressed (Figure 1A). However, PLCδ4 and PLCζ1 had low expression as their expression levels were similar to/below the background level (Figure 1A). Microarray expression from rat INS-1 (832/13) cells showed that 14 transcripts of PI-PLC subtypes were present. PLCη1, PLCη2, PLCγ2, and PLCζ1 transcripts were not present in the Rat Gene 2.0 ST array (Figure 1A). Among the PI-PLC subtypes, PLCXD3 and PLCβ4 were the highest expressed genes in INS-1 (832/13) cells, whereas PLCδ4, PLCβ2, and PLCδ4 were the lowest (Figure 1A). Interestingly, although PLCε1 was highly expressed in human islets, its expression was low in INS-1 (832/13) cells (Figure 1A). Next, differential expression analysis for PI-PLC subtypes revealed a significantly lower expression for PLCXD3 (p = 0.002) and PLCβ4 (p = 0.02) in diabetic islets when compared with non-diabetic ones (Figure 1B). As the focus of this study is PLCXD3, we analyzed the co-expression correlation of PLCXD3 with all PI-PLC subtypes in human islets. Our data showed that PLCXD3 is correlated positively with PLCβ1, PLCβ4, PLCε1, PLCη1, PLCL2, and PLCγ2 and negatively with PLCβ3 and PLCδ3 (Figures 1C–J).
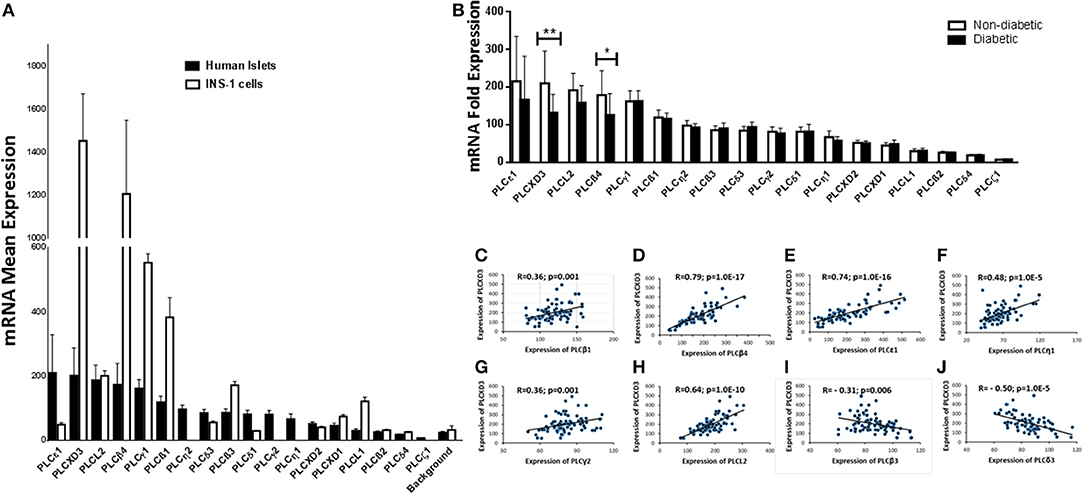
Figure 1. Microarray gene expression profile of phosphatidylinositol-specific phospholipase C (PI-PLC) subtypes in non-diabetic human islets and INS-1 (832/13) cells. (A) Mean expression of 18 human (n = 67) and 14 rat (n = 3) PI-PLC subtypes that present in the microarray. The background is the mean expression of all negative control probe sets on the human or rat whole transcript arrays. (B) Differential expression analysis of the 18 human PI-PLC subtypes in diabetic islets (n = 10) vs. non-diabetic islets (n = 67) donors. (C–J) Co-expression correlations of PLCXD3 (n = 77) with PLCβ1 (C), PLCβ4 (D), PLCε1 (E), PLCη1 (F), PLCγ2 (G), PLCL2 (H), PLCβ3 (I), and PLCδ3 (J). R and p values are indicated in the respective graphs. R: correlation coefficient; p: p-value. *P < 0.05, **P < 0.01, and ***P < 0.001. Bars represent mean ± SD.
RNA Sequencing Expression Analysis of PLCXD3 From Isolated Human Islets
To further validate the PLCXD3 expression in human islets, RNA sequencing data from a large number of donors (n = 202) were analyzed. As illustrated in Figure 2A, PLCXD3 showed high expression (top 94th percentile) as compared with the expression of KCNJ11, a functional marker of human islets (20). Furthermore, expression of PLCXD3 was confirmed in non-diabetic human islets (n = 3) at the protein level (Figure 2B).
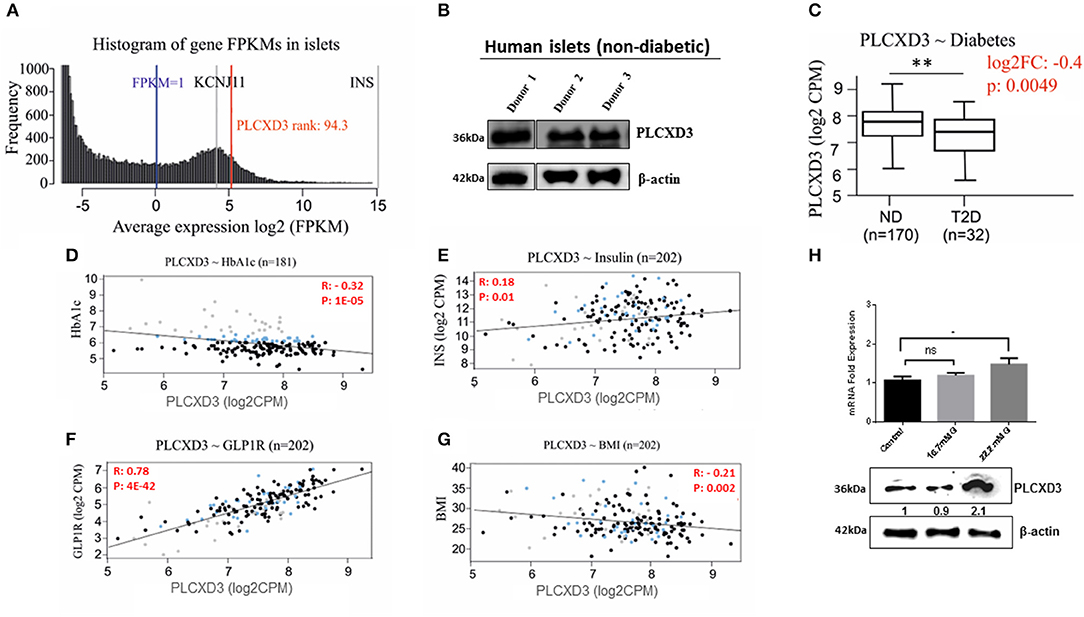
Figure 2. RNA sequencing expression of PLCXD3 in human islets. (A) Expression histogram of PLCXD3 obtained from non-diabetic human islets (n = 170) compared to KCNJ11 and INS genes. (B) Western blot expression analysis of PLCXD3 in human islets obtained from three different non-diabetic donors. (C) Expression level of PLCXD3 in diabetic islets (n = 32) vs. non-diabetic islets (n = 170). Correlation of RNA sequencing expression of PLCXD3 with (D) HbA1c levels, (E) insulin transcript, (F) GLP1R transcript, (G) and body mass index (BMI). (H) messenger RNA (mRNA) and protein expression analysis of PLCXD3 measured from cultured INS-1 (832/13) cells for 24 h at 16.7 mM glucose. The correlation coefficient (R) and p-value are indicated in the respective graphs (n = 192). *P < 0.05, **P < 0.01, and ***P < 0.001. Bars represent mean ± SEM.
In a previous study, we reported lower expression of PLCXD3 in diabetic islets compared to healthy islets, where its expression was correlated with insulin secretion and HbA1c (11). This finding was further confirmed using RNA sequencing data collected from a large number of donors (n = 202). As shown in Figure 2C, significant reduction of PLCXD3 expression in diabetic islets (p = 0.004) compared to non-diabetic islets was observed. Furthermore, PLCXD3 expression was shown to correlate positively with insulin expression (p = 0.01) and negatively with HbA1c (p = 0.0001) (Figures 2D,E). Additionally, PLCXD3 exhibited a strong positive correlation with GLP1R (p = 4E−42) (Figure 2F) and a negative correlation with BMI (p = 0.002) (Figure 2G). Finally, to investigate whether the reduced expression of PLCXD3 was due to the exposure of hyperglycemia status, expression of PLCXD3 was measured in INS-1 (832/13) cells cultured for a short term (24 h) at 11.1 mM (control) and 16.7 or 22.2 mM glucose at mRNA and protein levels. As illustrated in Figure 2H, the PLCXD3 expression level was significantly unchanged at 16.7 mM glucose as compared to control cells, while at 22.2 mM glucose, we observed increased PLCXD3 expression (Figure 2H), indicating that the observed reduction of PLCXD3 expression in diabetic islets is not due to short-term hyperglycemia.
PLCXD3 Silencing in INS-1 (832/13) Cells Impairs Insulin Secretion and Content
In an attempt to explore the mechanistic defect of PLCXD3 on insulin secretion, we silenced the expression of PLCXD3 using a pool of two different siRNAs. Silencing efficiency assessed 48 h post-transfection by qRT-PCR showed that almost 85% decreased in PLCXD3 expression (p < 0.01) relative to the negative control (Figure 3A). At the protein level, a comparable expression reduction of PLCXD3 (~75%; p < 0.01) was observed as assessed by western blot analysis (Figure 3A).
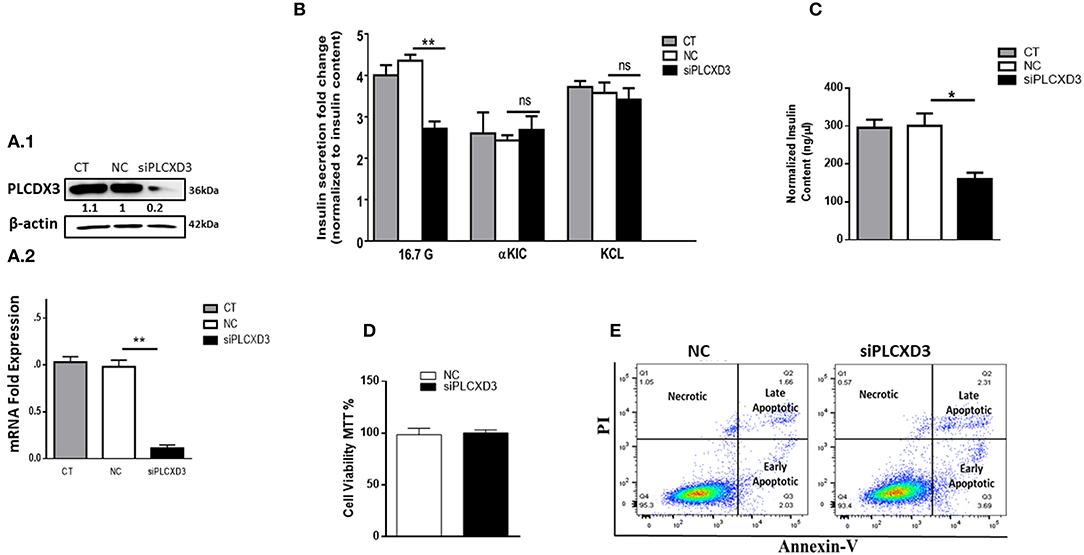
Figure 3. Silencing of PLCXD3 in INS-1 (832/13) cells reduces insulin secretion and content. (A.1) Silencing efficiency of small interfering RNA (siRNA) of PLCXD3 48 h after transfection with a pool of two different siRNA sequences measured by RT-PCR. (A.2) Fold change differences in the intensity of the western blot band of PLCXD3 protein expression relative to the endogenous control β-actin in PLCXD3-silenced cells compared to untreated control (CT) or negative siRNA control (NC) 48 h post-transfection. (B) Stimulated insulin secretion in response to 2.8 mM glucose, 16.7 mM glucose, and 10 mM α-KIC in the presence of 2.8 mM glucose or 35 mM potassium chloride (KCl) in the presence of 2.8 mM glucose performed in PLCXD3-silenced cells or negative control cells for one static hour of incubation. Insulin secretion measurements were normalized to protein content. (C) Normalized insulin content measurements from PLCXD3-silenced cells compared to negative control cells. (D) Percentage of cell viability in PLCXD3-silenced cells as determined using the MTT assay compared to control cells. (E) Assessment of apoptosis in PLCXD3-silenced cells and negative control as analyzed by flow cytometry. Data are shown from three independent experiments. *P < 0.05, **P < 0.01, and ***P < 0.001. Bars represent mean ± SD.
Intriguingly, siRNA silencing of PLCXD3 resulted in a marked reduction in GSIS at 2.8 mM (basal) or 16.7 mM glucose (stimulation) for 1 h (p = 0.02, p = 0.007, respectively) (Figure 3B) as compared with negative siRNA control.
Moreover, stimulating PLCXD3-silenced cells with either 10 mM α-KIC (a secretagogue that directly stimulates mitochondrial metabolism and enhances the mitochondrial ATP synthesis) or 35 mM KCl (depolarizing agent) for 1 h showed no effect on insulin secretion (Figure 3B). However, insulin content was significantly reduced in the transfected cells (~45%; p < 0.01) compared to the negative control cells (Figure 3C). Whether PLCXD3 silencing is associated with decreased cell viability and thereby led to the impairment of GSIS was assessed. As shown in Figure 3D, the percentage of viable cells in PLCXD3-silenced cells was not affected compared to control cells. This result was further confirmed by apoptosis analysis with “annexin-V and PI” assay. No difference in the percentage of apoptotic cells was observed in PLCXD3-silenced cells as compared with negative control cells (Figure 3E).
Finally, to address whether the impairment of insulin secretion is mainly attributed to reduced expression of PLCXD3 or due to other subtypes (in particular PLCε1, PLCβ4, and PLCγ1) which are significantly present in human islets or INS-1 (832/13) cells, we analyzed the expression of all PI-PLC subtypes using RNA sequencing data from PLCXD3-silenced INS-1 cells. As shown in Table 2, only PLCβ1 was shown to be affected by silencing of PLCXD3 (FC = 0.66; p adj = 0.05).
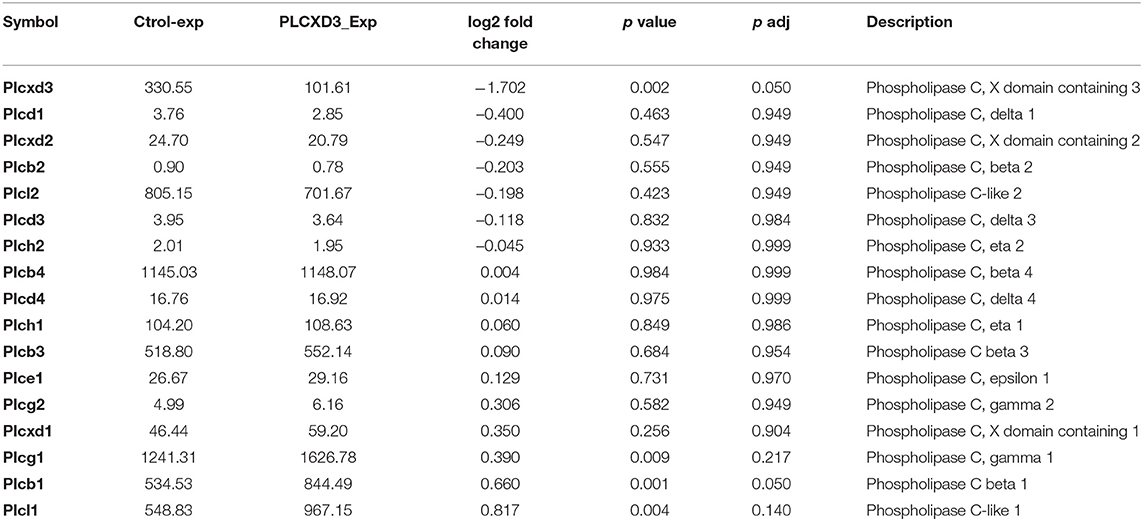
Table 2. RNA sequencing expression of PI-PLC subtypes in PLCXD3-silenced cells.
PLCXD3 Signaling in INS-1 (832/13) Cells Affects β-Cell Function Genes
To further understand how silencing of PLCXD3 impairs insulin secretion, we analyzed the expression of several genes involved in the β-cell function. At first, genes involved in proinsulin biosynthesis [Ins1 (p = 0.02), Ins2 (p = 0.004), PDX1 (p = 0.03), MAFA (p = 0.004), NEUROD1 (p = 0.001), and NKX2.2 (p = 0.001)] was shown to be significantly downregulated at the transcriptional level (Figure 4A). At the protein level, a marked expression reduction (p < 0.05) of insulin (~75%) and NEUROD1 (~70%) was observed (Figure 4B), whereas PDX1 expression was not affected (Figure 4B). Glucose-sensing genes showed a significant downregulation [GLUT2 (p = 0.003) and GCK (p = 0.02)] at the mRNA level (Figure 4C). Similarly, protein expression analysis revealed a marked reduction of GLUT2 (~75%) and GCK (~30%) (p < 0.05) (Figure 4D). Genes involved in insulin signaling including INSR (α/β), AKT, and IRS2 revealed that INSR mRNA expression is reduced (p < 0.05) in PLCXD3-silenced cells compared to negative control cells (Figure 4B). At the protein level, a reduced expression of INSRα (~80%, p < 0.05), INSRβ (~30%, p < 0.05), IRS2 phosphorylation (~40%, p < 0.05), and AKT1/2/3 (~40%, p < 0.05) was observed in PLCXD3-silenced cells (Figure 4E). Moreover, expression correlation analyses showed that PLCXD3 is positively correlated with expression of PDX1, MAFA, NEUROD1, NKX2.2, GLUT2, GCK, IRS2, and AKT3 (Figures 4F–O) as analyzed in human islet microarray expression data. No correlation was observed between PLCXD3 and INSR or AKT1 (Figures 4I–N).
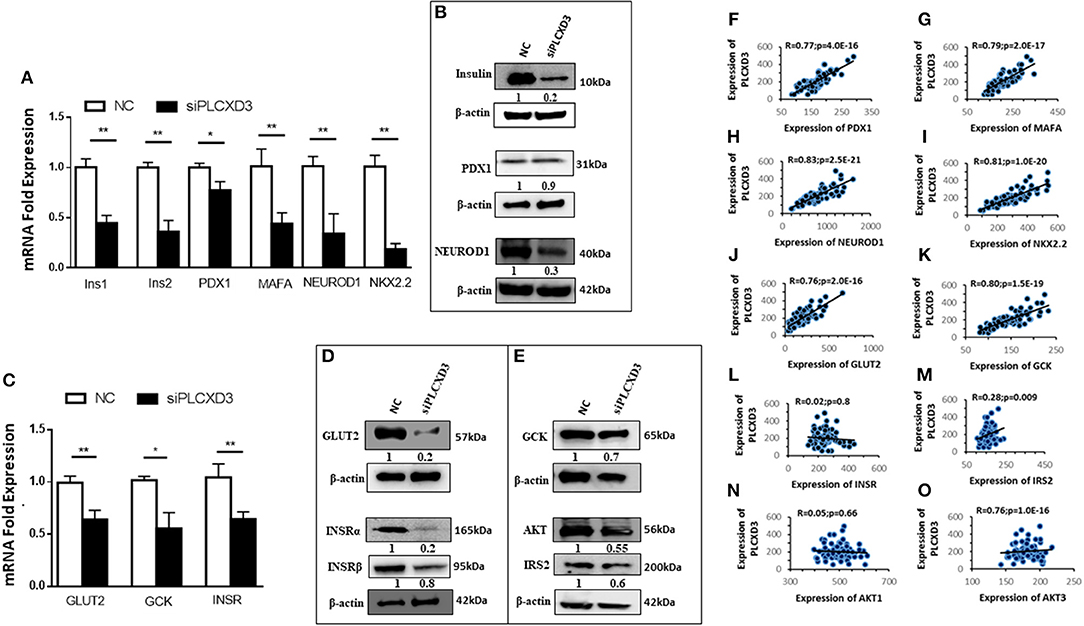
Figure 4. Effect of PLCXD3 silencing on genes involved in the β-cell function. RNA and protein were extracted from PLCXD3-silenced cells or negative control 48 h post-transfection. (A) qRT-PCR expression analysis of Ins1, Ins2, PDX1, MAFA, NEUROD1, and NKX2.2. (B) Western blot analysis of Insulin, PDX1, and NEUROD1 relative to the endogenous control protein β-actin. (C) qRT-PCR expression analysis of GLUT2, GCK, and INSR. (D) Western blot analysis of GLUT2 and GCK relative to the endogenous control. (E) Western blot analysis of INSRα, phosphor-IRS2, and AKT1/2/3 relative to the endogenous control. qRT-PCR data were obtained from three independent experiments, and western blot data are a representative from three independent experiments. (F–O) Spearman's expression correlation of PLCXD3 with PDX1 (F), MAFA (G), NEUROD1 (H), NKX2.2 (I), GLUT2 (J), GCK (K), INSR (L), IRS2 (M), AKT1 (N), and AKT3 (O) using microarray data from human pancreatic islets (n = 64). R and p values are indicated in the respective graphs. R, correlation coefficient; p, p-value. *P < 0.05, **P < 0.01, and ***P < 0.001. Bars represent mean ± SD.
Discussion
Multiple studies have attempted to identify and understand the role of PI-PLC subtypes in human physiology. However, only a few studies have focused on the pathophysiology role of PI-PLCs in diabetes or their respective expression in human pancreatic islets. Thus, in this study, the expression of 18 PI-PLC subtypes in human islets (healthy or diabetic condition) and in the rat INS-1(832/13) cells was examined using microarray analysis. Our data showed that PLCε1, PLCXD3, PLCL2, and PLCβ4 were the most expressed PI-PLC subtypes in human islets while PLCXD3 and PLCβ4 were the most abundant in INS-1 (832/13) cells. The discrepancy in the expression of the PI-PLCs between human and rat islet cells might be ascribed to a species-specific expression. Another possible explanation could be that there is a discrete functional impact of PI-PLCs in immortalized β-cell lines as compared to primary β-cells. Also, such variations could be of great interest and importance for further functional validation. For example, genes that are highly expressed in INS-1 (832/13) cells such as PLCXD3 or PLCβ4 would be a suitable target to be investigated in the INS-1 (832/13) research model, unlike the low-expression PLC genes such as PLCδ4 or PLCβ2.
The low expression of PLCXD3 in human diabetic islets and its correlation with eight PI-PLC subtypes (Figures 1, 2C) raise the question of whether ablation of PLCXD3 might lead to altering the expression of other PI-PLC subtypes. As shown in Figure 1, PLCε1 and PLCβ4 were found to be highly expressed in human islets, and their expression correlated positively with PLCXD3. In contrast to human islets, PLCε1 was previously reported to be present at low levels in most tissues as compared to other PI-PLC subtypes (21–23). It has been shown that knockout of PLCε1 in mouse islet led to a disruption in GSIS (21, 24, 25). On the other hand, reduced expression of PLCβ4 was reported in pancreatic islets of diabetic cadaver donors compared to non-diabetic controls (12).
The observed positive correlation of PLCXD3 with GLP1R is interesting (Figure 2F). Previous studies have shown that GLP1R receptor positively influenced β-cell function by regulating postprandial glucose level via insulin release and increased the generation of cAMP (26–28). Likewise, ablation of PLCε1 has been shown to impair GSIS through the cAMP pathway and to increase in insulin secretion via responding to incretin hormones like GLP1/GLP1R (24, 25). On the other hand, the inverse correlation of PLCXD3 and BMI goes in line with a previous study reporting that a mutation in PLCXD3 could potentially cause ROHHAD (10).
The present study shows that silencing of PLCXD3 in INS-1 (832/13) cells reduced the insulin secretion in response to glucose as well as the insulin content without affecting cell viability or apoptosis. The findings of expression downregulation of INS1 and INS2 and the transcription factors that activate the insulin gene promoter (PDX1, MAFA, NEUROD1, and NKX2.2) (29–32) are further support that PLCXD3 is an important player in insulin secretion and biosynthesis.
The finding that silencing of PLCXD3 resulted in reduced expression of GLUT2 and GCK in INS1 (832/13) cells (Figures 4C,D) is interesting. GSIS is initiated by glucose uptake mostly by glucose transporters (GLUT2 in rodent or GLUT1 in human) (33, 34), which was then phosphorylated by GCK and subsequently metabolized through the glycolytic pathway, leading to the activation of the mitochondrial metabolism and the generation of ATP and glutamate, which trigger insulin granule exocytosis (35).
Thus, GLUT2 and GCK are key players of the glucose-sensing machinery, which help pancreatic β-cells to respond to physiological blood glucose changes (36, 37). Defects in the glucose-sensing machinery have been shown to impair insulin secretion and subsequently the development of severe hyperglycemia (38, 39).
Insulin signaling in β-cells is essential to maintain normal cell function, where any defects can lead to a reduction in insulin synthesis and secretion (40). Our data showed a reduction in mRNA expression of INSR and protein level of INSR. Also, the protein expression of AKT1/2/3 and phosphorylated IRS2 was reduced in PLCXD3-silenced cells (Figure 4C). It has been reported that knockdown of INSR in pancreatic β-cell diminished GSIS, expression of insulin, insulin content, and expression of PDX1 as well as GLUT2 (40, 41). Our data go in line with previous information where inhibition of PLC activity by U73122 had caused a reduction in insulin and hormonally stimulated glucose transport along with prevention of the translocation of GLUT4 to the plasma membrane (42). Collectively, these findings might suggest a potential role of PLCXD3 in the development of insulin resistance by diminishing the expression of INSR and GLUT2, thus resulting in β-cell dysfunction. The microarray co-expression correlation of PLCXD3 with the expression GCK, GLUT2, IRS2, and AKT3 (Figure 4) might further support this hypothesis. However, unlike in INS-1 (832/13) cells, no co-expression correlation between PLCXD3 and INSR in human islets was observed. Lack of correlation with INSR measured by microarray expression does not rule out that an internal relationship might exist. Insulin resistance syndrome including obesity, hyperglycemia, hyperlipidemia, and hypertension or insulin therapy in our donors might interfere with the insulin signaling pathway, leading to alteration of the INSR function (43). The main limitations of the present study are that our data do not address the expression of PLCXD3 in sorted pancreatic β- or α-cells but rather intact human pancreatic islets. Additionally, we were not able to investigate the protein expression of PLCXD3 in diabetic and non-diabetic human islets, which will further support the mRNA expression finding.
In conclusion, PLCXD3 expression is among the top highly expressed PI-PLC subtypes in human islets and rat pancreatic β-cells. Reduced expression of PLCXD3 is associated with impaired insulin secretion through a mechanism that might involve insulin receptor signaling besides altering glucose sensing.
Data Availability Statement
All datasets generated for this study are included in the article/supplementary material.
Ethics Statement
The studies involving human participants were reviewed and approved by the local ethics committees at both Uppsala and Lund universities (Sweden) have approved all procedures with human islets isolation and investigations. The patients/participants provided their written informed consent to participate in this study.
Author Contributions
HA and JT designed the experiments. HA, DM, AM, SD, and NE performed all functional experimental work. HA, JT, MH, and AS analyzed human expression data. JT, HA, NS, and AS wrote and edited the manuscript.
Conflict of Interest
The authors declare that the research was conducted in the absence of any commercial or financial relationships that could be construed as a potential conflict of interest.
Acknowledgments
We thank Lund University Diabetes Centre (LUDC/EXODIAB) who provided us with pancreatic tissue samples. JT was supported by grants from the University of Sharjah (1701090119-P and 1701090121-P) and Al Jalila Foundation (seed grant AJF201723).
Abbreviations
T2D, type 2 diabetes; PLCXD3, phosphatidylinositol-specific phospholipase C X-domain containing 3; PI-PLC, phosphatidylinositol-specific phospholipase C; GSIS, glucose-stimulated insulin secretion; siRNA, small interfering RNA; HbA1c, glycated hemoglobin; BMI, body mass index; INS2, insulin 2; MAFA, MAF bZIP transcription factor A; PDX1, pancreatic and duodenal homeobox 1; INSR, insulin receptor; GCK, glucokinase; SLC2A2 (GLUT2), solute carrier family 2 member 2; HPRT1, hypoxanthine phosphoribosyltransferase 1; NEUROD1, neuronal differentiation 1; NKX2. 2, NK2 homeobox 2.
References
1. Suh PG, Park JI, Manzoli L, Cocco L, Peak JC, Katan M, et al. Multiple roles of phosphoinositide-specific phospholipase C isozymes. BMB Rep. (2008) 41:415–34. doi: 10.5483/BMBRep.2008.41.6.415
2. Fukami K, Inanobe S, Kanemaru K, Nakamura Y. Phospholipase C is a key enzyme regulating intracellular calcium and modulating the phosphoinositide balance. Prog Lipid Res. (2010) 49:429–37. doi: 10.1016/j.plipres.2010.06.001
3. Gellatly SA, Kalujnaia S, Cramb G. Cloning, tissue distribution and sub-cellular localisation of phospholipase C X-domain containing protein (PLCXD) isoforms. Biochem Biophys Res Commun. (2012) 424:651–6. doi: 10.1016/j.bbrc.2012.06.079
4. Ganesan S, Calle R, Zawalich K, Greenawalt K, Zawalich W, Shulman GI, et al. Immunocytochemical localization of alpha-protein kinase C in rat pancreatic beta-cells during glucose-induced insulin secretion. J Cell Biol. (1992) 119:313–24. doi: 10.1083/jcb.119.2.313
5. Ganesan S, Calle R, Zawalich K, Smallwood JI, Zawalich WS, Rasmussen H. Glucose-induced translocation of protein kinase C in rat pancreatic islets. Proc Natl Acad Sci USA. (1990) 87:9893–7. doi: 10.1073/pnas.87.24.9893
6. Thore S, Dyachok O, Gylfe E, Tengholm A. Feedback activation of phospholipase C via intracellular mobilization and store-operated influx of Ca2+ in insulin-secreting β-cells. J Cell Sci. (2005) 118:4463–71. doi: 10.1242/jcs.02577
7. Bishop MT, Sanchez-Juan P, Knight RS. Splice site SNPs of phospholipase PLCXD3 are significantly associated with variant and sporadic Creutzfeldt-Jakob disease. BMC Med Genet. (2013) 14:91. doi: 10.1186/1471-2350-14-91
8. Jamain S, Cichon S, Etain B, Mühleisen TW, Georgi A, Zidane N, et al. Common and rare variant analysis in early-onset bipolar disorder vulnerability. PLoS ONE. (2014) 9:e104326. doi: 10.1371/journal.pone.0104326
9. Fischl AM, Heron PM, Stromberg AJ, McClintock TS. Activity-dependent genes in mouse olfactory sensory neurons. Chem Senses. (2014) 39:439–49. doi: 10.1093/chemse/bju015
10. Barclay SF, Rand CM, Borch LA, Nguyen L, Gray PA, Gibson WT, et al. Rapid-Onset obesity with hypothalamic dysfunction, hypoventilation, and autonomic dysregulation (ROHHAD): exome sequencing of trios, monozygotic twins and tumours. Orphanet J Rare Dis. (2015) 10:103. doi: 10.1186/s13023-015-0314-x
11. Taneera J, Fadista J, Ahlqvist E, Atac D, Ottosson-Laakso E, Wollheim CB, et al. Identification of novel genes for glucose metabolism based upon expression pattern in human islets and effect on insulin secretion and glycemia. Hum Mol Genet. (2015) 24:1945–55. doi: 10.1093/hmg/ddu610
12. Taneera J, Lang S, Sharma A, Fadista J, Zhou Y, Ahlqvist E, et al. A systems genetics approach identifies genes and pathways for type 2 diabetes in human islets. Cell Metab. (2012) 16:122–34. doi: 10.1016/j.cmet.2012.06.006
13. Fadista J, Vikman P, Laakso EO, Mollet IG, Esguerra JL, Taneera J, et al. Global genomic and transcriptomic analysis of human pancreatic islets reveals novel genes influencing glucose metabolism. Proc Natl Acad Sci USA. (2014) 111:13924–9. doi: 10.1073/pnas.1402665111
14. Trapnell C, Pachter L, Salzberg SL. TopHat: discovering splice junctions with RNA-Seq. Bioinformatics. (2009) 25:1105–11. doi: 10.1093/bioinformatics/btp120
15. Hohmeier HE, Mulder H, Chen G, Henkel-Rieger R, Prentki M, Newgard CB. Isolation of INS-1-derived cell lines with robust ATP-sensitive K+ channel-dependent and-independent glucose-stimulated insulin secretion. Diabetes. (2000) 49:424–30. doi: 10.2337/diabetes.49.3.424
16. Zhou Y, Oskolkov N, Shcherbina L, Ratti J, Kock KH, Su J, et al. HMGB1 binds to the rs7903146 locus in TCF7L2 in human pancreatic islets. Mol Cell Endocrinol. (2016) 430:138–45. doi: 10.1016/j.mce.2016.01.027
17. Tang X, Muniappan L, Tang G, Ozcan S. Identification of glucose-regulated miRNAs from pancreatic {beta} cells reveals a role for miR-30d in insulin transcription. RNA. (2009) 15:287–93. doi: 10.1261/rna.1211209
18. Taneera J, Mohammed AK, Dhaiban S, Hamad M, Prasad RB, Sulaiman N, et al. RORB and RORC associate with human islet dysfunction and inhibit insulin secretion in INS-1 cells. Islets. (2019) 11:10–20. doi: 10.1080/19382014.2019.1566684
19. Ritchie ME, Phipson B, Wu D, Hu Y, Law CW, Shi W, et al. limma powers differential expression analyses for RNA-sequencing and microarray studies. Nucleic Acids Res. (2015) 43:e47. doi: 10.1093/nar/gkv007
20. Jonsson A, Isomaa B, Tuomi T, Taneera J, Salehi A, Nilsson P, et al. A variant in the KCNQ1 gene predicts future type 2 diabetes and mediates impaired insulin secretion. Diabetes. (2009) 58:2409–13. doi: 10.2337/db09-0246
21. Smrcka AV, Brown JH, Holz GG. Role of phospholipase Cε in physiological phosphoinositide signaling networks. Cell Signal. (2012) 24:1333–43. doi: 10.1016/j.cellsig.2012.01.009
22. Wang H, Oestreich EA, Maekawa N, Bullard TA, Vikstrom KL, Dirksen RT, et al. Phospholipase C epsilon modulates beta-adrenergic receptor-dependent cardiac contraction and inhibits cardiac hypertrophy. Circ Res. (2005) 97:1305–13. doi: 10.1161/01.RES.0000196578.15385.bb
23. Zhang L, Malik S, Kelley GG, Kapiloff MS, Smrcka AV. Phospholipase C epsilon scaffolds to muscle-specific A kinase anchoring protein (mAKAPbeta) and integrates multiple hypertrophic stimuli in cardiac myocytes. J Biol Chem. (2011) 286:23012–21. doi: 10.1074/jbc.M111.231993
24. Dzhura I, Chepurny OG, Kelley GG, Leech CA, Roe MW, Dzhura E, et al. Epac2-dependent mobilization of intracellular Ca2+ by glucagon-like peptide-1 receptor agonist exendin-4 is disrupted in β-cells of phospholipase C-ε knockout mice. J Physiol. (2010) 588:4871–89. doi: 10.1113/jphysiol.2010.198424
25. Dzhura I, Chepurny OG, Leech CA, Roe MW, Dzhura E, Xu X, et al. Phospholipase C-ε links Epac2 activation to the potentiation of glucose-stimulated insulin secretion from mouse islets of Langerhans. Islets. (2011) 3:121–8. doi: 10.4161/isl.3.3.15507
26. Doyle ME, Egan JM. Mechanisms of action of glucagon-like peptide 1 in the pancreas. Pharmacol Ther. (2007) 113:546–93. doi: 10.1016/j.pharmthera.2006.11.007
27. Meloni AR, DeYoung MB, Lowe C, Parkes DG. GLP-1 receptor activated insulin secretion from pancreatic β-cells: mechanism and glucose dependence. Diabetes Obes Metab. (2013) 15:15–27. doi: 10.1111/j.1463-1326.2012.01663.x
28. Holst JJ. The physiology of glucagon-like peptide 1. Physiol Rev. (2007) 87:1409–39. doi: 10.1152/physrev.00034.2006
29. Aramata S, Han SI, Kataoka K. Roles and regulation of transcription factor MafA in islet beta-cells. Endocr J. (2007) 54:659–66. doi: 10.1507/endocrj.KR-101
30. Aramata S, Han SI, Yasuda K, Kataoka K. Synergistic activation of the insulin gene promoter by the beta-cell enriched transcription factors MafA, Beta2, and Pdx1. Biochim Biophys Acta. (2005) 1730:41–6. doi: 10.1016/j.bbaexp.2005.05.009
31. Docherty HM, Hay CW, Ferguson LA, Barrow J, Durward E, Docherty K. Relative contribution of PDX-1, MafA and E47/beta2 to the regulation of the human insulin promoter. Biochem J. (2005) 389:813–20. doi: 10.1042/BJ20041891
32. Zhao L, Guo M, Matsuoka TA, Hagman DK, Parazzoli SD, Poitout V, et al. The Islet beta cell-enriched MafA activator is a key regulator of insulin gene transcription. J Biol Chem. (2005) 280:11887–94. doi: 10.1074/jbc.M409475200
33. Van de Bunt M, Gloyn AL. A tale of two glucose transporters: how GLUT2 re-emerged as a contender for glucose transport into the human beta cell. Diabetologia. (2012) 55:2312–5. doi: 10.1007/s00125-012-2612-3
34. De Vos A, Heimberg H, Quartier E, Huypens P, Bouwens L, Pipeleers D, et al. Human and rat beta cells differ in glucose transporter but not in glucokinase gene expression. J Clin Invest. (1995) 96:2489–95. doi: 10.1172/JCI118308
35. Maechler P, Wollheim CB. Mitochondrial glutamate acts as a messenger in glucose-induced insulin exocytosis. Nature. (1999) 402:685–9. doi: 10.1038/45280
36. Schuit FC, Huypens P, Heimberg H, Pipeleers DG. Glucose sensing in pancreatic beta-cells: a model for the study of other glucose-regulated cells in gut, pancreas, and hypothalamus. Diabetes. (2001) 50:1–11. doi: 10.2337/diabetes.50.1.1
37. Lenzen S. A fresh view of glycolysis and glucokinase regulation: history and current status. J Biol Chem. (2014) 289:12189–94. doi: 10.1074/jbc.R114.557314
38. Thorens B, Guillam MT, Beermann F, Burcelin R, Jaquet M. Transgenic reexpression of Glut1 or Glut2 in pancreatic beta cells rescues Glut2-null mice from early death and restores normal glucose-stimulated insulin secretion. J Biol Chem. (2000) 275:23751–8. doi: 10.1074/jbc.M002908200
39. Taneera J, Mussa B, Saber-Ayad M, Dhaiban S, Aljaibeji H, Sulaiman N. Maturity-onset diabetes of the young: an overview with focus on the middle east. Curr Mol Med. (2017) 17:549–62. doi: 10.2174/1566524018666180222121158
40. Wang J, Gu W, Chen C. Knocking down insulin receptor in pancreatic beta cell lines with lentiviral-small hairpin RNA reduces glucose-stimulated insulin secretion via decreasing the gene expression of insulin, GLUT2 and Pdx1. Int J Mol Sci. (2018) 19:E985. doi: 10.3390/ijms19040985
41. Kulkarni RN, Bruning JC, Winnay JN, Postic C, Magnuson MA, Kahn CR. Tissue-specific knockout of the insulin receptor in pancreatic beta cells creates an insulin secretory defect similar to that in type 2 diabetes. Cell. (1999) 96:329–39. doi: 10.1016/S0092-8674(00)80546-2
42. Van Epps-Fung M, Gupta K, Hardy RW, Wells A. A role for phospholipase C activity in GLUT4-mediated glucose transport. Endocrinology. (1997) 138:5170–5. doi: 10.1210/en.138.12.5170
Keywords: type 2 diabetes, microarray, gene expression, RNA sequencing, PLCXD3
Citation: Aljaibeji H, Mukhopadhyay D, Mohammed AK, Dhaiban S, Hachim MY, Elemam NM, Sulaiman N, Salehi A and Taneera J (2019) Reduced Expression of PLCXD3 Associates With Disruption of Glucose Sensing and Insulin Signaling in Pancreatic β-Cells. Front. Endocrinol. 10:735. doi: 10.3389/fendo.2019.00735
Received: 12 July 2019; Accepted: 10 October 2019;
Published: 06 November 2019.
Edited by:
Åke Sjöholm, Gävle Hospital, SwedenReviewed by:
Lenzen Sigurd, Hannover Medical School, GermanyRajakrishnan Veluthakal, City of Hope National Medical Center, United States
Ivonne Bazwinsky-Wutschke, Martin Luther University, Germany
Copyright © 2019 Aljaibeji, Mukhopadhyay, Mohammed, Dhaiban, Hachim, Elemam, Sulaiman, Salehi and Taneera. This is an open-access article distributed under the terms of the Creative Commons Attribution License (CC BY). The use, distribution or reproduction in other forums is permitted, provided the original author(s) and the copyright owner(s) are credited and that the original publication in this journal is cited, in accordance with accepted academic practice. No use, distribution or reproduction is permitted which does not comply with these terms.
*Correspondence: Jalal Taneera, anRhbmVlcmFAc2hhcmphaC5hYy5hZQ==