 Moloud Payab1
 Mostafa Qorbani2,3*†
 Nazila Shahbal4
 Mohammad Esmaeil Motlagh5Shirin Hasani-Ranjbar1Hoda Zahedi1,6
 Gita Shafiee7Hasan Ziaodini8Mohammad Ali Pourmirzaiee9
 Ramin Heshmat7*†
 Roya Kelishadi9
- 1Obesity and Eating Habits Research Center, Endocrinology and Metabolism Molecular-Cellular Sciences Institute, Tehran University of Medical Sciences, Tehran, Iran
- 2Non-communicable Diseases Research Center, Alborz University of Medical Sciences, Karaj, Iran
- 3Endocrinology and Metabolism Research Center, Endocrinology and Metabolism Clinical Sciences Institute, Tehran University of Medical Sciences, Tehran, Iran
- 4Non-Communicable Diseases Research Center, Endocrinology and Metabolism Population Sciences Institute, Tehran University of Medical Sciences, Tehran, Iran
- 5Department of Pediatrics, Ahvaz Jundishapur University of Medical Sciences, Ahvaz, Iran
- 6Department of Clinical Nutrition, School of Nutritional Sciences and Dietetics, Tehran University of Medical Sciences, Tehran, Iran
- 7Chronic Diseases Research Center, Endocrinology and Metabolism Population Sciences Institute, Tehran University of Medical Sciences, Tehran, Iran
- 8Health Psychology Research Center, Education Ministry, Tehran, Iran
- 9Department of Pediatrics, Child Growth and Development Research Center, Research Institute for Primordial Prevention of Non-communicable Disease, Isfahan University of Medical Sciences, Isfahan, Iran
Background: Obesity, particularly in the upper part of the body, is a major health problem. Measuring the neck circumference (NC) and wrist circumference (WrC) is a relatively new method of differentiating between normal and abnormal fat distributions. This study aimed to evaluate the association of NC, hip circumference (HC), and WrC with different phenotypes of obesity and their metabolic status.
Methods: In this multi-centric cross-sectional study, 4,200 students aged 7–18 years were selected from 30 provinces in Iran in 2014 by using a multistage cluster random sampling method. Metabolic syndrome (MetS) was defined based on the ATP III criteria modified for the pediatric age group. The subjects were classified into four groups according to their weight and metabolic status: metabolically healthy obese (MHO), metabolically non-healthy non-obese (MNHNO), metabolically non-healthy obese (MNHO), and metabolically healthy non-obese (MHNO).
Results: Significant but different associations of NC, HC, and WrC with obesity phenotypes were documented in the entire population. Significant but different associations of NC, HC, and WrC with metabolic phenotypes were also found in the entire population. In the multinomial logistic regression, the association of the different obesity phenotypes with the study anthropometric indices increased significantly with increasing NC, WrC, and HC. Also, per one unit increment in NC, HC, and WrC, the odds of MHO, MNHNO, and MNHO increased compared to that of the MHNO phenotype.
Conclusion: In children and adolescents, HC, NC, and WrC are significantly associated with obesity phenotypes and their metabolic status, and these metrics are suggested to be innovative, low-cost, and alternative tools for assessing them in different age and sex pediatric age groups.
Introduction
The prevalence of obesity is increasing to pandemic proportions in the world. In 2014, the WHO reported that 52% of adults worldwide are overweight and obese (1). Also, childhood obesity has become a public health priority worldwide. The prevalence of overweight and obesity is also rising among children and adolescents in developing countries, rising from 8.1 to 12.9% in boys and from 8.4 to 13.4% in girls in 2013 (2). Also, approximately one-fourth of children worldwide are obese or overweight (3).
The pathophysiology of obesity is complex and involves the interaction of various genetic, metabolic, environmental, and behavioral factors (4). Among these factors, environmental factors are the most common cause of the epidemic of obesity, for example, a sedentary lifestyle (computer games and watching TV) and nutritional disorders (consumption of high-calorie foods and inappropriate diets) (5, 6).
In an article published in 2017, the World Federation of Obesity claimed that “early diagnosis and treatment of childhood obesity should be regarded as similar to vaccination” (7).
Along with weight gain, fat accumulation also increases in the body and causes various illnesses (8). Similarly, the majority of obese people have type 2 diabetes, insulin resistance, high blood pressure, and dyslipidemia. However, about 10–25% of obese people are metabolically healthy. These subjects with excess body fat are free of metabolic abnormalities. Hence, people who are metabolically “unhealthy” should be distinguished from those with the “healthy” obese phenotype (9–12).
Different anthropometric indicators are used to determine general obesity and abdominal obesity.
Body mass index (BMI) is a common anthropometric indicator for assessing weight status in adults and children (6, 13). This indicator has advantages, including the ease of measuring and interpreting it; however, this indicator also has limitations. It cannot differentiate the fat mass (FM) from the free fat mass (FFM), cannot indicate body fat distribution, and requires some calculations, and excess FM may conceal FFM deficits (6, 14).
Hip circumference (HC) reflects the body composition to a certain extent (i.e., muscle mass and fat mass), but in childhood, its prognostic value for later health risks in adulthood is limited (15). Several studies have shown that some other anthropometric indices, including waist circumference (WC), waist-to-hip ratio (WHR), and waist-to-height ratio (WHtR), are useful for determining abdominal obesity (14). The use of WHtR for detecting central obesity and the health risks associated with it was first proposed in the mid-1990s (16). The WC has been criticized for not taking into account differences in body height, and the WHtR is a better predictor of cardiovascular risk, visceral fat, and mortality (17). It is important to note that there is a progressive increase in WHtR with increasing body fat so that the value of the WHtR alone will not work as a predictor of body fat. WHtR is a rapid and effective indicator of health risks of obesity. WHtR is more sensitive than BMI as an early warning of health risks and is easier and cheaper to measure and calculate than BMI (18).
The use of these indices has certain limitations. The first measurement should be without clothes. Secondly, their values may vary along with fasting or satiety during the day, and it is difficult to measure these indices and requires calculation (19). Also, measuring these anthropometric indices is not easy in large studies, and there may be errors in measuring two parts of the body and calculating their ratio. WHR is generally considered a good tool to distinguish between different types of fat distribution, as it is highly correlated with visceral fat and plasma lipid concentrations. One of the disadvantages of WHR is that a reduction in weight usually results in a reduction in both WC and HC, so that WHR may not decrease despite the leaner body composition. In addition, a decrease in WHR may not be related to a reduction in cardiovascular risk factors. Finally, the decrease of WHR with age, especially in girls, is due to an increase in pelvic diameter and predominant fat deposition in the gluteal area. Therefore, other indicators such as wrist circumference (WrC) and neck circumference (NC) are considered (20–22).
Nowadays, NC is considered an indicator of the distribution of subcutaneous fat in the body. This indicator is a simple, fast, and easy anthropometric measurement that saves measurement time in population-based studies (23). One of the benefits of measuring NC is that it does not change during the day (4). Also, this indicator is not affected by respiration (breathing) or stomach fullness (24). Some studies have shown that an increase in NC is associated with metabolic disorders (1).
The WrC is another simple anthropometric indicator that is easily measured and can show bone size without being severely confounded by other tissues. WrC is easy to detect without the need for calculation and without disturbing the clothing during measurement, and some studies have also shown a significant association between WrC and metabolic disorders. However, this association should be investigated in different age groups (25, 26).
The aim of this study was to determine the association of NC, HC, and WrC with obesity phenotypes and their metabolic status.
Methods
This study is part of the CASPIAN-V study conducted in 30 provinces of Iran in 2015; the details of the study protocol have been described previously (27). This study was conducted on 14,400 students at national level, from which 4,200 students were randomly selected for biochemical tests. The samples included students aged 7–18 years in primary and secondary schools in urban and rural areas throughout the country.
Subsequent to the selection of the qualified students, the aim of the study was explained to them. Also, their parents were invited to take a role after the study selection. Two sets of questionnaires were completed for students and their parents. The students' questionnaire was obtained from the World Health Organization–Global School Student Health Survey (WHO-GSHS) and was translated into Persian. The validity and reliability of the questionnaire were previously assessed (28, 29).
Weight was measured with minimal clothing, with 0.1 kg accuracy on a SECA digital weighing scale (SECA, Germany), and standing height was recorded without shoes, with 0.1 cm accuracy (SECA, Germany). Body mass index (BMI) was calculated by dividing weight (kg) by height squared (m2). WHO growth charts were used to categorize BMI. Waist circumference (WC) was measured using a non-elastic tape on the distance around the mid-point between the lower margin of the last palpable rib and the top of the iliac crest at the end of normal expiration, to the nearest 0.1 cm. The widest part of the buttocks was measured to obtain HC to the nearest 0.1 cm. WrC was measured by placing the superior border of the tape measure distal to the prominences of radial and ulnar bones, with 0.1 cm accuracy. NC was measured with the most prominent portion of the thyroid cartilage taken as a landmark, with 0.1 cm accuracy. Waist-to-height ratio was calculated as WC (cm) divided by height (cm) (29, 30).
Blood pressure (BP) was measured using a mercury sphygmomanometer on the right arm in a sitting position. It was measured twice at 5-min intervals, and the average was reported (31). High blood pressure is classed as a high measure in either systolic or diastolic pressure or both. The weekly frequency of physical activity (PA) was measured as the number of days on which the children reported that activity for at least 30 min outside of school had caused heavy sweating or large increases in breathing or heart rate. For the sake of statistical analysis, each weekly frequency received a classification [ <2 days per week (mild), 2–4 days per week (moderate), and >4 days (severe)].
To assess screen time (ST) behaviors, the students were asked to report how many hours per day they spent watching television, videos, or both, using their personal computer or playing electronic games. The total cumulative time spent for ST was calculated accordingly.
After a 12-h overnight fast, 6 ml of venous blood was collected and stored at −70°C. Fasting blood glucose (FBG), triglyceride (TG), total cholesterol (TC), low-density lipoprotein cholesterol (LDL-C), and high-density lipoprotein cholesterol (HDL-C) were measured enzymatically by Hitachi auto-analyzer (Tokyo, Japan).
In this study, we used the WHO growth curves to define BMI categories, i.e., an age- and sex-specific BMI in the 5th−85th percentile was considered normal weight, and a ≥95th percentile age- and sex-specific BMI was considered general obesity. Abdominal obesity was defined as waist-to-height ratio ≥0.5.
The subjects were classified into six groups according to general and abdominal obesity:
normal (5th < BMI < 85th percentile and WHtR < 0.5),
abdominal obesity (WHtR>0.5),
general obesity (BMI > 95th),
only abdominal obesity (WHtR > 0.5 and BMI < 95th percentile),
only general obesity (BMI > 95th and WHtR < 0.5),
and combined obesity (BMI > 95th and WHtR > 0.5).
The participants were classified as having metabolic syndrome (MetS) if they had three or more out of five criteria according to the Adult Treatment Panel III (ATP III) criteria modified for the pediatric age group (32, 33).
1. Abdominal obesity, as defined as waist-to-height ratio ≥ 0.5 (34).
2. FBG ≥ 100 mg/dL
3. Serum TG ≥ 100 mg/dL
4. HDL-C ≤ 40 mg/dL
5. BP > 90th age, sex and height specific percentile.
The participants were classified into four groups according to their weight and metabolic status:
Metabolically healthy obese (MHO): defined as “those not having metabolic syndrome (i.e., no more than two risk factors) and obese” (35).
Metabolically non-healthy non-obese (MNHNO): “non-obese and with metabolic syndrome).”
Metabolically non-healthy obese (MNHO): “both obese and with metabolic syndrome.”
Metabolically healthy non-obese (MHNO): “not having metabolic syndrome (i.e., no more than two risk factors) and non-obese)” (35).
Statistical Analysis
Qualitative variables were reported as numbers and percentages, and quantitative variables were reported as mean ± SD (standard deviation). The Chi-square test was used to analyze qualitative variables, and comparison of means of quantitative variables was performed by Student's t-test.
Crude and age–sex-adjusted mean values of NC, HC, and WrC across different phenotypes of obesity were assessed using analysis of variance (ANOVA) and analysis of covariance (ANCOVA), respectively.
Multinomial logistic regression analysis was performed to evaluate the association of HC, NC, and WrC with different phenotypes of obesity and metabolic syndrome. Two models were defined: Model I represented the crude association (without adjustment), and Model II was after adjustment for age, sex, PA, ST, socioeconomic status (SES), and living area.
Data were analyzed using the STATA package version 11.0 (Stata Statistical Software: Release 11. StataCorp LP. Package, College Station, TX, USA), and P < 0.05 was considered as statistically significant.
Results
In this study, 14,274 students (50.6% boys, 49.4% girls) and one parent of each performed the survey (out of 14,440). The participation rate was 91.5% for taking blood samples from students (3,843 out of 4,200 students selected for blood sampling). The mean ages of boys and girls were 12.4 (SD: 3.1) and 12.2 (SD: 3.2) years, respectively. 71.4% of students were from urban and 28.6% were from rural areas. Most students had low PA levels (58.2% of all students), which was different between boys and girls (56.2% boys and 60.4% girls) (P < 0.001) and also between urban and rural areas (58.8% in urban areas and 56.7% in rural areas) (P < 0.05). The prevalences of overweight (BMI > 85th), general obesity (BMI > 95th), and abdominal obesity (WHtR > 0.5) were 9.4, 11.4, and 21.1%, respectively. The prevalence of metabolic syndrome was 5%. Also, the prevalence of overweight in metabolic syndrome subjects was 8.3% (91.7% healthy subjects). The prevalences of only general (BMI > 95th and WHtR <0.5) and only abdominal obesity (WHtR > 0.5 and BMI <95th percentile) were 2.5 and 12.2%, respectively. Also, 9.8% of students had both general and abdominal obesity; the prevalences of MHO and MNHO were, respectively, 9.1 and 1.8%.
The characteristics of the participants, including their location of residence (urban-rural), physical activity, screen time, and socioeconomic status, according to age and sex are presented in Table 1. Physical activity levels were significantly higher in urban areas than in rural areas and were higher in boys than in girls (P < 0.001).
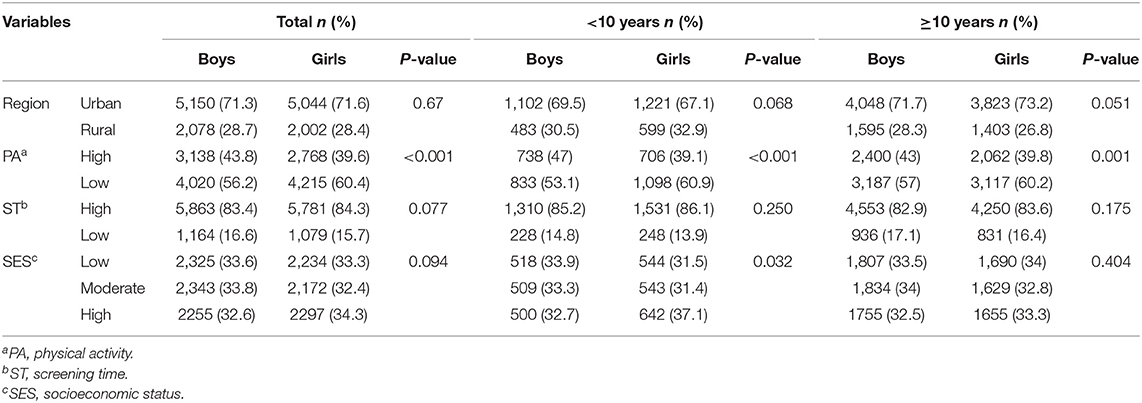
Table 1. Characteristics of participants according to sex and age: The CASPIAN-V study.
Table 2 shows the mean (95% CI) of HC, NC, and WrC according to general and abdominal obesity. According to this table, significant but different associations were observed of NC and HC with general and abdominal obesity in the entire population. The average values of NC, HC, and WrC were significantly higher among subjects with both abdominal obesity and general obesity. Also, in subjects with only general obesity, the average values of NC, HC, and WrC were higher than in those with only abdominal obesity.
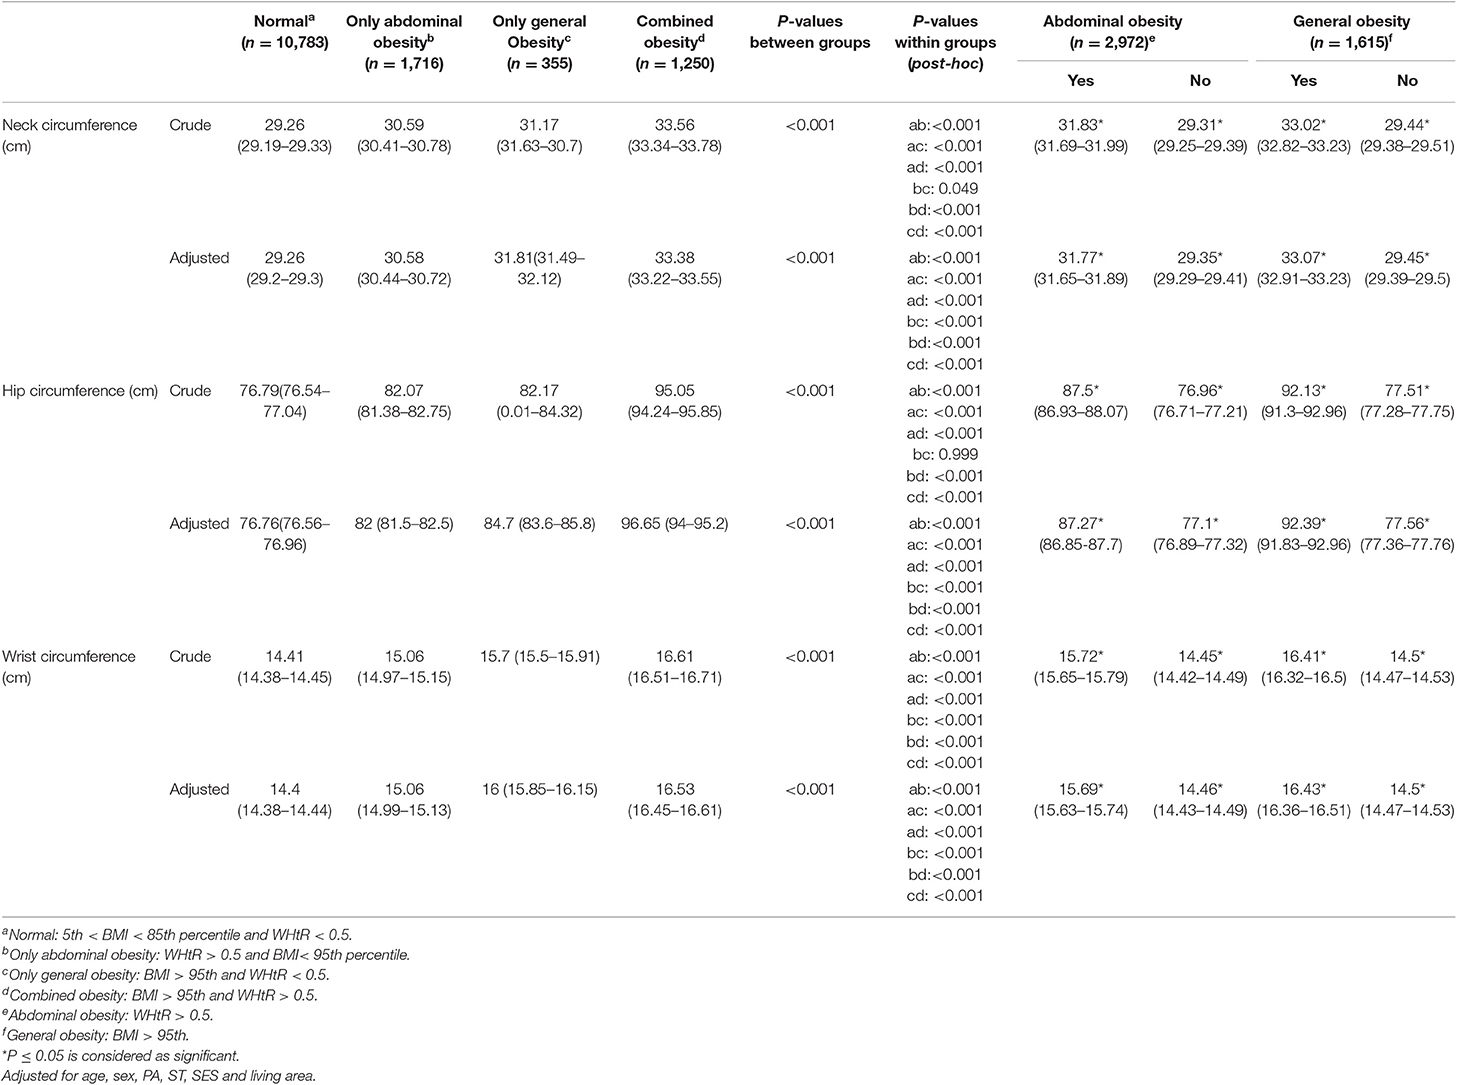
Table 2. Mean (95% CI) of hip, neck, and wrist circumference according to obesity phenotypes: the CASPIAN-V study.
Table 3 presents the mean values (95% CI) of HC, NC, and WrC according to metabolic status. Accordingly, a significant different association was reported between NC, HC, and WrC and metabolic phenotypes in the entire population. The average values of NC, HC, and WrC were significantly higher among students with the MNHO phenotype. Comparing the MHO and MNHNO phenotypes, the means of HC, NC, and WrC were higher in the MHO group. The highest means of NC, HC, and WrC were observed in the MNHO and MHO phenotypes, while the lowest means of NC, HC, and WrC were observed in the MHNO phenotype.
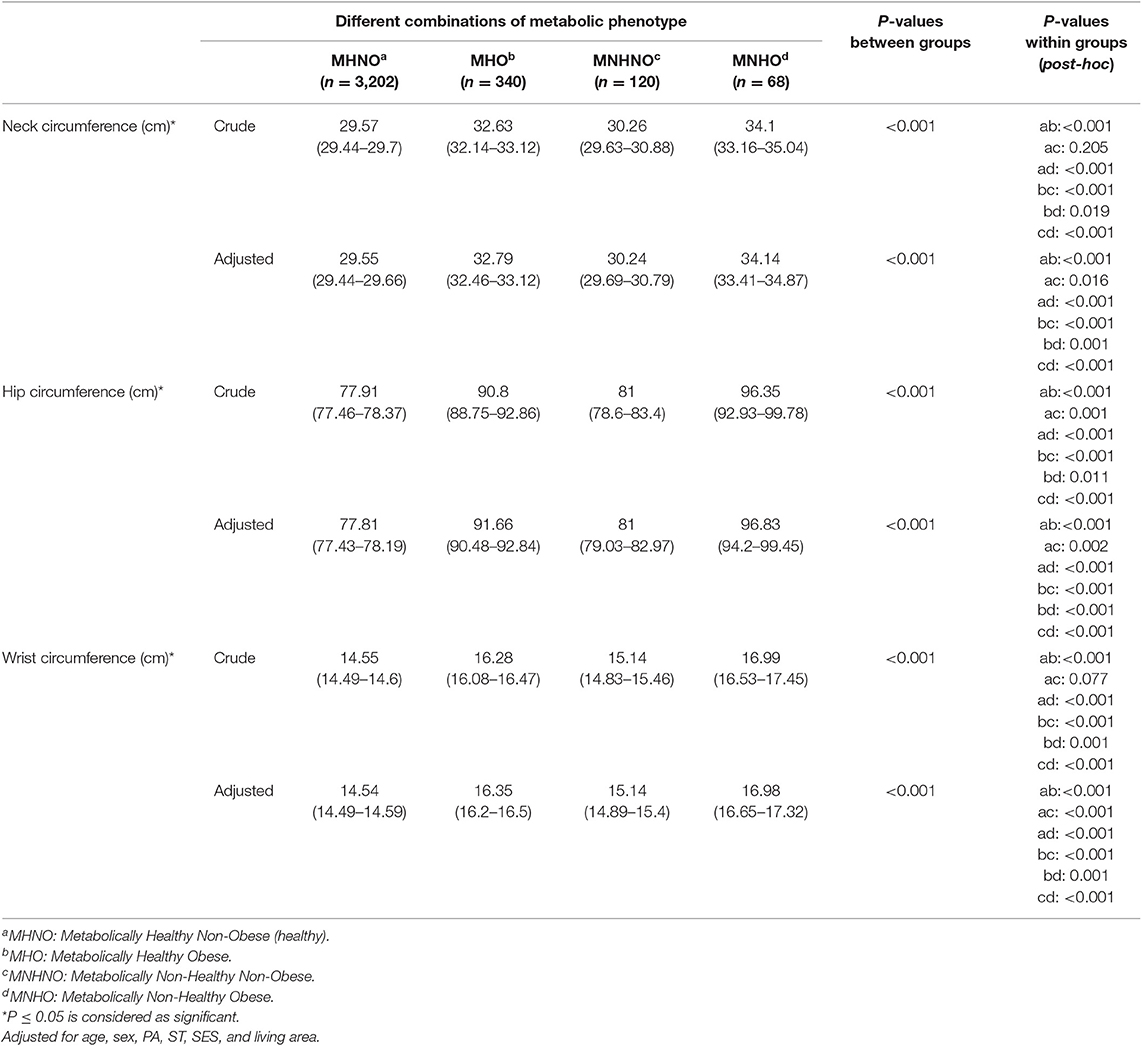
Table 3. Means (95%) of hip, neck, and wrist circumference according to metabolic status: the CASPIAN-V study.
Tables 4, 5 show the odds ratio in crude modeling and models adjusted for age, sex, physical activity, screening time, socioeconomic status, and living area. The association of HC, NC, and WrC with abdominal and general obesity in multinominal logistic regression models is presented in Table 4. The association of abdominal, general, and combined obesity with NC, WrC, and HC was statistically significant. According to Table 4, per one unit increment in NC, HC, and WrC, the odds of only abdominal obesity increased 17% (OR:1.17, CI: 1.15–1.2), 6% (OR:1.06, CI: 1.05–1.07), and 41% (OR:1.41,CI:1.36–1.47), respectively, compared to the normal subjects (adjusted for age, sex, PA, ST, SES, and living area). Also, per one unit increment in NC and HC, the odds of combined obesity increased 58% (OR: 1.58, CI: 1.54–1.62) and 24% (OR:1.24, CI: 1.23–1.25) compared to the normal subjects. Furthermore, in subjects with only general obesity, HC, NC, and WrC were 37% (OR: 1.37, 95% CI: 1.31–1.42), 10% (OR: 1.1, 95% CI: 1.08–1.12), and 2.14 times (OR: 2.14, 95% CI: 1.99–2.3) higher than in subjects who were normal, respectively (adjusted for age, sex, PA, ST, SES, and living area).
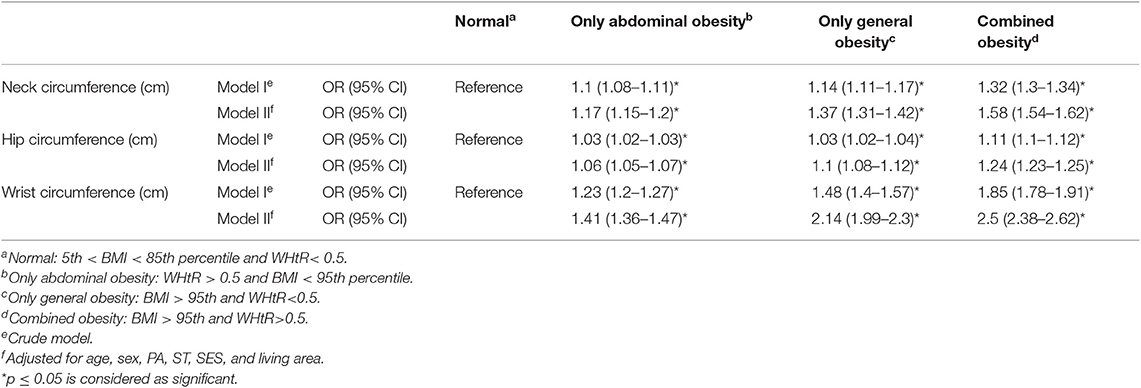
Table 4. Association of neck, hip, and wrist circumference with general, abdominal, and combined obesity in a multinomial logistic regression model.
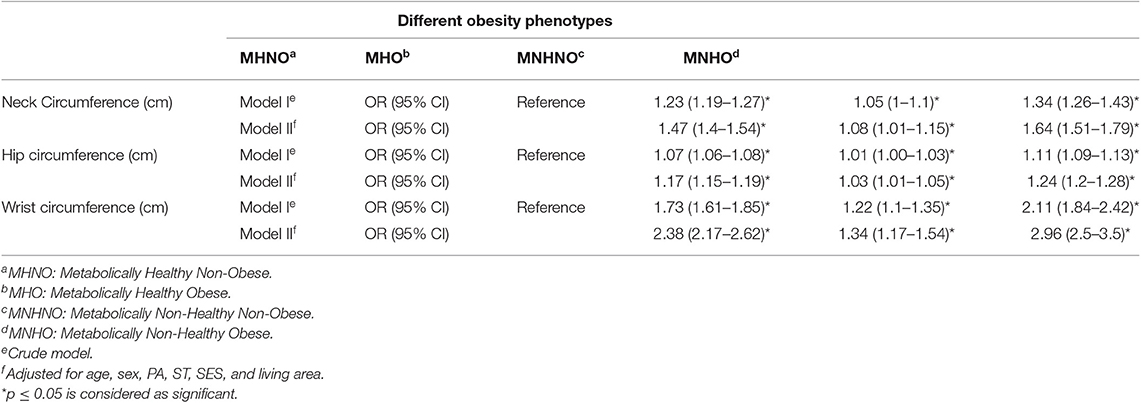
Table 5. Association of neck, hip, and wrist circumference with metabolic status in a multinomial logistic regression model.
The association of the different metabolic phenotypes with the study anthropometric indices became significantly greater with increased NC, WrC, and HC compared to the healthy group (MHNO). The strongest association was seen when comparing the MNHO group with the MHNO group. According to Table 5, per one unit increment in NC and HC, the odds of MHO increased 47% (OR: 1.47, CI: 1.4–1.54) and 17% (OR: 1.17, CI: 1.15–1.19) compared to MHNO, respectively, and also, per one unit increase in WrC, the odds of MHO was 2.38 times greater than in the MHNO group (adjusted for age, sex, PA, ST, SES, and living area).
Discussion
The findings of this study indicate that there are significant but different associations between the means of NC, HC, and WrC and the phenotypes of obesity and their metabolic status. Therefore, based on the collection of evidence from this relatively large sample, it can be stated that NC, HC, and WrC are probably predictors of obesity among the population.
Recently, NC, HC, and WrC have been reported as indicators of body fat distribution and to be simple and practical indices (36). Very limited studies are available that assess the association among NC, HC, WrC, and obesity phenoype or provide data for evaluating the potential of these indicators for obesity in the pediatric population (37–39).
The CASPIAN-IV Study shows that overweight students and those with general obesity and abdominal obesity had a relatively larger NC measurement than other students (37). The present study assessed individual groups of students with general as well as abdominal adiposity or both phenotypes. The results of our study demonstrated that students with both types of obesity had, on average, larger NC, HC, and WrC values than any of the other three types (normal, abdominally obese, and generally obese). Also, a comparison between the two types of obesity showed that students with general obesity had higher values for these indicators than those with abdominal obesity. Other studies have reported similar results, for example, the Framingham Heart Study (40) and the Turkish Adult Cohort Study (1). Considering the existence of a strong association between the WrC and other anthropometric measurements and also its association with both general obesity and abdominal obesity, it is possible to consider WrC as important as NC when predicting general and abdominal obesity (37).
Many studies conducted on the causes of the prevalence of obesity and metabolic syndrome disorder have indicated that the possibility of obesity in adulthood is higher among children who are not obese but suffer from metabolic syndrome disorder (41). These findings indicate the significance of protecting children and adolescents who are not obese but have metabolic syndrome disorders (MNHNO) against chronic metabolism-related diseases and also obesity, which will eventually lead to death in adulthood. Another conclusion derived from this study is that, regarding the higher NC, HC, and WrC values among non-obese students who suffer from metabolic syndrome compared MHO and also the higher values of these indicators among obese individuals with metabolic syndrome (MNHO) compared to other phenotypes, NC, HC, and WrC are probably strongly correlated with metabolic syndrome disorders. Also, another study has shown that individuals with metabolic syndrome have higher WrC than normal individuals (42). On the other hand, since WrC has a strong association with NC, weight, BMI, and body fat percentage, it can be generally concluded that people with higher NC are probably more at risk of being affected by metabolic syndrome disorder. There is a significant association between the results of this study and those of others conducted on children and adolescents, suggesting that the neck measurement is an acceptable predictor of higher BMI, obesity, and its related diseases (42, 43). Therefore, it can be said that NC, HC, and WrC are a low-cost, accessible, but valuable way of diagnosing obesity without metabolic syndrome (MHO) and metabolic syndrome without obesity (MNHNO). This finding can contribute to the prevention of serious diseases (e.g., cardiovascular diseases), decreasing the cost load on the health sector and reducing death rates.
Today, it is not possible to justify the increasing prevalence of obesity in adulthood only by genetic or lifestyle factors. Studies conducted in this area have indicated a combination of factors in childhood that affect obesity (12). The ease of taking measurements that can be predictive of obesity and its various phenotypes will be very helpful for recognizing children at high risk. The results of this study show that, considering normal students as a reference, students with comparatively NC and HC values are more susceptible to general obesity. Moreover, students with relatively high NC, HC, and WrC are more susceptible to obesity with metabolic syndrome (MNHO).
Due to its ease of measurement and interpretation, BMI is an indicator that is commonly used to evaluate weight status among children and adults; however, this method has certain limitations (44–46). WrC is a good indicator of the distribution of fat, skeletal structure, and also metabolic status in the body. Based on our findings, WrC is a better indicator of obesity phenotype and other metabolic and cardiovascular disorders among children and adolescents than BMI (43, 47, 48).
Based on the results of Capizzi et al., pubertal status could influence NC and WrC measurements as well as the metabolic parameters and bone component in overweight and obese children and adolescents (49); unfortunately, the pubertal status of the participants was not evaluated in the present study, which is one of its limitations. However, puberty and age are highly correlated with one another and can represent a reasonable proxy measure of maturity. Therefore, new measurements such as NC and WrC can be of great help in recognizing risk factors of cardiovascular diseases such as different types of general and abdominal obesity, metabolic syndrome disorders, and BMI during childhood or adolescence.
One of the strengths of this study, which is derived from the CASPIAN-V study, is its novelty in terms of including children and adolescents. No study has been conducted so far on the association of NC, HC, and WrC with different obesity phenotypes and their metabolic status in the population of Iranian students. However, the study had some limitations. Due to its cross-sectional nature, the causality could not be construed. Additionally, we were not able to measure fat mass.
Conclusion
The current study demonstrated that in children and adolescents, HC, NC, and WrC were significantly but differentially associated with obesity phenotypes and their metabolic status. These indicators are innovative, low-cost, and alternative tools for assessing obesity and metabolic syndrome in different age and sex pediatric populations.
Data Availability Statement
The datasets generated for this study are available on request to the corresponding author.
Ethics Statement
After complete explanation of the study objectives and methods, written informed consent and verbal consent were obtained from the parents and students, respectively. The study protocol was reviewed and approved by ethical committees and other relevant national regulatory organizations. The Research and Ethics Council of Isfahan University of Medical Sciences approved the study (Project Number: 194049).
Author Contributions
MP participated in the sequence alignment and drafted the manuscript. RK participated in the study design, final revision, and editing. NS participated in the sequence alignment and drafted the manuscript. MM and SH-R participated in the study design and interpretation. HZ, MAP, and GS participated in the data acquisition. MQ and RH participated in the design of the study and performed statistical analysis. All authors read and approved the final manuscript.
Conflict of Interest
The authors declare that the research was conducted in the absence of any commercial or financial relationships that could be construed as a potential conflict of interest.
Acknowledgments
This study was conducted as a part of a national surveillance program conducted in Iran.
References
1. Onat A, Hergenç G, Yüksel H, Can G, Ayhan E, Kaya Z, et al. Neck circumference as a measure of central obesity: associations with metabolic syndrome and obstructive sleep apnea syndrome beyond waist circumference. Clin Nutr. (2009) 28:46–51. doi: 10.1016/j.clnu.2008.10.006
2. Ng M, Fleming T, Robinson M, Thomson B, Graetz N, Margono C, et al. Global, regional, and national prevalence of overweight and obesity in children and adults during 1980–2013: a systematic analysis for the Global Burden of Disease Study 2013. Lancet. (2014) 384:766–81.
3. Olds T, Maher C, Zumin S, Péneau S, Lioret S, Castetbon K, et al. Evidence that the prevalence of childhood overweight is plateauing: data from nine countries. Int J Pediatr Obes. (2011) 6:342–60. doi: 10.3109/17477166.2011.605895
4. Hoebel S, Malan L, de Ridder JH. Determining cut-off values for neck circumference as a measure of the metabolic syndrome amongst a South African cohort: the SABPA study. Endocrine. (2012) 42:335–42. doi: 10.1007/s12020-012-9642-y
5. Payab M, Kelishadi R, Qorbani M, Motlagh ME, Hasani-Ranjbar S, Ejtahed HS, et al. Association of healthy foods intake with anthropometric measures and blood pressure in a national sample of Iranian children and adolescents: the CASPIAN- IV study. Minerva Pediatr. (2019) 71:420–30. doi: 10.23736/S0026-4946.16.04337-1
6. Payab M, Kelishadi R, Qorbani M, Motlagh ME, Ranjbar SH, Ardalan G, et al. Association of junk food consumption with high blood pressure and obesity in Iranian children and adolescents: the CASPIAN-IV study. J Pediatr. (2015) 91:196–205. doi: 10.1016/j.jpedp.2014.07.008
7. The Lancet Diabetes E. Should we officially recognise obesity as a disease? Lancet Diabetes Endocrinol. (2017) 5:483. doi: 10.1016/S2213-8587(17)30191-2
8. Ozkaya I, Tunckale A. Neck circumference positively related with central obesity and overweight in Turkish University students: a preliminary study. Cent Eur J Public Health. (2016) 24:91–4. doi: 10.21101/cejph.a4555
9. Blüher M. The distinction of metabolically 'healthy' from 'unhealthy' obese individuals. Curr Opin Lipidol. (2010) 21:38–43. doi: 10.1097/MOL.0b013e3283346ccc
10. Heshmat R, Hemati Z, Payab M, Hamzeh SS, Motlagh ME, Shafiee G, et al. Prevalence of different metabolic phenotypes of obesity in Iranian children and adolescents: the CASPIAN V study. J Diabetes Metab Disord. (2018) 17:211–21. doi: 10.1007/s40200-018-0363-5
11. Payab M, Hasani-Ranjbar S, Larijani B. Whether all obese subjects both in metabolic groups and non-metabolic groups should be treated or not. J Diabetes Metab Disord. (2014) 13:21. doi: 10.1186/2251-6581-13-21
12. Phillips CM. Metabolically healthy obesity across the life course: epidemiology, determinants, and implications. Ann N Y Acad Sci. (2017) 1391:85–100. doi: 10.1111/nyas.13230
13. World Health Organization. Obesity: Preventing and Managing the Global Epidemic. Report of a WHO consultation. World Health Organ Tech Rep Ser 894. (2000) 1–253.
14. Li M, McDermott RA. Using anthropometric indices to predict cardio-metabolic risk factors in Australian indigenous populations. Diabetes Res Clin Pract. (2010) 87:401–6. doi: 10.1016/j.diabres.2009.12.004
15. Freedman DS, Serdula MK, Srinivasan SR, Berenson GS. Relation of circumferences and skinfold thicknesses to lipid and insulin concentrations in children and adolescents: the Bogalusa Heart Study. Am J Clin Nutr. (1999). 69:308–17. doi: 10.1093/ajcn/69.2.308
16. Hsieh SD, Yoshinaga H. Abdominal fat distribution and coronary heart disease risk factors in men-waist/height ratio as a simple and useful predictor. Int J Obes Relat Metab Disord. (1995) 19:585–9.
17. Ashwell M, Mayhew L, Richardson J, Rickayzen B. Waist-to-height ratio is more predictive of years of life lost than body mass index. PLoS ONE. (2014) 9:e103483. doi: 10.1371/journal.pone.0103483
18. Ashwell M, Hsieh SD. Six reasons why the waist-to-height ratio is a rapid and effective global indicator for health risks of obesity and how its use could simplify the international public health message on obesity. Int J Food Sci Nutr. (2005) 56:303–7. doi: 10.1080/09637480500195066
19. Wang J, Thornton JC, Bari S, Williamson B, Gallagher D, Heymsfield SB, et al. Comparisons of waist circumferences measured at 4 sites. Am J Clin Nutr. (2003) 77:379–84. doi: 10.1093/ajcn/77.2.379
20. Gomez-Arbelaez D, Camacho PA, Cohen DD, Saavedra-Cortes S, Lopez-Lopez C, Lopez-Jaramillo P. Neck circumference as a predictor of metabolic syndrome, insulin resistance and low-grade systemic inflammation in children: the ACFIES study. BMC Pediatr. (2016) 16:31. doi: 10.1186/s12887-016-0566-1
21. Hosseini M, Motlagh ME, Yousefifard M, Qorbani M, Ataei N, Asayesh H, et al. Neck circumference percentiles of iranian children and adolescents: the weight disorders survey of CASPIAN IV study. Int J Endocrinol Metab. (2017) 15:e13569. doi: 10.5812/ijem.13569
22. Namazi N, Djalalinia S, Mahdavi-Gorabi A, Asayesh H, Mansourian M, Noroozi M, et al. Association of wrist circumference with cardio-metabolic risk factors: a systematic review and meta-analysis. Eat Weight Disord. (2018). doi: 10.1007/s40519-018-0534-x. [Epub ahead of print].
23. Androutsos O, Grammatikaki E, Moschonis G, Roma-Giannikou E, Chrousos GP, Manios Y, et al. Neck circumference: a useful screening tool of cardiovascular risk in children. Pediatr Obes. (2012) 7:187–95. doi: 10.1111/j.2047-6310.2012.00052.x
24. Hingorjo MR, Zehra S, Imran E, Qureshi MA. Neck circumference: a supplemental tool for the diagnosis of metabolic syndrome. J Pak Med Assoc. (2016) 66:1221–6.
25. Derakhshan A, Eslami A, Bozorgmanesh M, Sheikholeslami F, Azizi F, Hadaegh F. Wrist circumference as a novel negative risk factor for cardiovascular disease among adult men: a median follow-up of 9 years. J Endocrinol Invest. (2016) 39:763–8. doi: 10.1007/s40618-016-0431-y
26. Wills SD, Bhopal RS. The challenges of accurate waist and hip measurement over clothing: pilot data. Obes Res Clin Pract. (2010) 4:e163–246. doi: 10.1016/j.orcp.2009.11.003
27. Motlagh ME, Ziaodini H, Qorbani M, Taheri M, Aminaei T, Goodarzi A, et al. Methodology and early findings of the fifth survey of childhood and adolescence surveillance and prevention of adult noncommunicable disease: the CASPIAN-V study. Int J Prev Med. (2017) 8:4. doi: 10.4103/2008-7802.198915
28. Kelishadi R, Motlagh ME, Roomizadeh P, Abtahi SH, Qorbani M, Taslimi M, et al. First report on path analysis for cardiometabolic components in a nationally representative sample of pediatric population in the Middle East and North Africa (MENA): the CASPIAN-III study. Ann Nutr Metab. (2013) 62:257–65. doi: 10.1159/000346489
29. Organization WH. Expert Committee on Physical Status. Physical Status: The Use and Interpretation of Anthropometry. WHO technical report 854. Geneva: World Health Organization (1995), p. 420.
30. WHO Multicentre Growth Reference Study Group. WHO Child Growth Standards based on length/height, weight and age. Acta Paediatrica. (2006). 450:76. doi: 10.1111/j.1651-2227.2006.tb02378.x
31. Task force report on high blood pressure in children and adolescents: a working group report from the national high blood pressure education program. National high blood pressure education program working group on hypertension control in children and adolescents. Pediatrics. (1996) 98(4 Pt 1):649–58.
32. Ford ES. Ajani UA, Mokdad AH. The metabolic syndrome and concentrations of C-reactive protein among U.S. youth. Diabetes Care. (2005) 28:878–81. doi: 10.2337/diacare.28.4.878
33. Zimmet P, Alberti G, Kaufman F, Tajima N, Silink M, Arslanian S, et al. The metabolic syndrome in children and adolescents. Lancet. (2007) 369:2059–61. doi: 10.1016/S0140-6736(07)60958-1
34. Ejtahed HS, Kelishadi R, Qorbani M, Motlagh ME, Hasani-Ranjbar S, Angoorani P, et al. Utility of waist circumference-to-height ratio as a screening tool for generalized and central obesity among Iranian children and adolescents: the CASPIAN-V study. Pediatr Diabetes. (2019) 20:530–7. doi: 10.1111/pedi.12855
35. Damanhoury S, Newton AS, Rashid M, Hartling L, Byrne JLS, Ball GDC. Defining metabolically healthy obesity in children: a scoping review. Obes Rev. (2018) 19:1476–91. doi: 10.1111/obr.12721
36. Zhou J-Y, Ge H, Zhu M-F, Wang L-J, Zhu M-F, Tan Y-Z, et al. Neck circumference as an independent predictive contributor to cardio-metabolic syndrome. Cardiovasc Diabetol. (2013). 12:76. doi: 10.1186/1475-2840-12-76
37. Kelishadi R, Djalalinia S, Motlagh ME, Rahimi A, Bahreynian M, Arefirad T, et al. Association of neck circumference with general and abdominal obesity in children and adolescents: the weight disorders survey of the CASPIAN-IV study. BMJ Open. (2016) 6:e011794. doi: 10.1136/bmjopen-2016-011794
38. Watkins AN, Kelly AS, Prineas RJ, Marlatt KL, Dengel DR, Sinaiko AR, et al. Childhood wrist circumference is not a predictor of insulin resistance in adulthood. J Pediatr. (2015) 166:1085–7. doi: 10.1016/j.jpeds.2014.12.011
39. Yang GR, Yuan SY, Fu HJ, Wan G, Zhu LX, Bu XL, et al. Neck circumference positively related with central obesity, overweight, and metabolic syndrome in Chinese subjects with type 2 diabetes: Beijing Community Diabetes Study 4. Diabetes Care. (2010) 33:2465–7. doi: 10.2337/dc10-0798
40. Preis SR, Pencina MJ. Neck circumference and the development of cardiovascular disease risk factors in the Framingham Heart Study. Diabetes Care. (2013) 36:e3. doi: 10.2337/dc12-0738
41. Bluher S, Schwarz P. Metabolically healthy obesity from childhood to adulthood–does weight status alone matter? Metabolism. (2014) 63:1084–92. doi: 10.1016/j.metabol.2014.06.009
42. Mahan LK, Raymond JL. Krause's Food & The Nutrition Care Process-e-Book. Elsevier Health Sciences (2016).
43. Kelishadi R, Heidari-Beni M, Qorbani M, Motamed-Gorji N, Motlagh ME, Ziaodini H, et al. Association between neck and wrist circumferences and cardiometabolic risk in children and adolescents: the CASPIAN-V study. Nutrition. (2017) 43–44:32–8. doi: 10.1016/j.nut.2017.06.009
44. Kosti RI, Panagiotakos DB. The epidemic of obesity in children and adolescents in the world. Cent Eur J Public Health. (2006) 14:151–9. doi: 10.21101/cejph.a3398
45. Rothman KJ. BMI-related errors in the measurement of obesity. Int J Obes. (2008) 32(Suppl 3):S56–9. doi: 10.1038/ijo.2008.87
46. Walton C, Lees B, Crook D, Worthington M, Godsland IF, Stevenson JC. Body fat distribution, rather than overall adiposity, influences serum lipids and lipoproteins in healthy men independently of age. Am J Med. (1995) 99:459–64. doi: 10.1016/S0002-9343(99)80220-4
47. Campagna G, Zampetti S, Gallozzi A, Giansanti S, Chiesa C, Pacifico L, et al. Excellent intra and inter-observer reproducibility of wrist circumference measurements in obese children and adolescents. PLoS ONE. (2016) 11:e0156646. doi: 10.1371/journal.pone.0156646
48. Shafiee G, Qorbani M, Heshmat R, Djalalinia S, Motlagh ME, Arefirad T, et al. Wrist circumference as a novel predictor of obesity in children and adolescents: the CASPIAN-IV study. J Pediatr Endocrinol Metab. (2018) 31:717–25. doi: 10.1515/jpem-2017-0206
Keywords: anthropometric indices, abdominal obesity, general obesity, metabolic syndrome, obesity
Citation: Payab M, Qorbani M, Shahbal N, Motlagh ME, Hasani-Ranjbar S, Zahedi H, Shafiee G, Ziaodini H, Pourmirzaiee MA, Heshmat R and Kelishadi R (2019) Association of Anthropometric Indices With Metabolic Phenotypes of Obesity in Children and Adolescents: The CASPIAN-V Study. Front. Endocrinol. 10:786. doi: 10.3389/fendo.2019.00786
Received: 25 June 2019; Accepted: 29 October 2019;
Published: 03 December 2019.
Edited by:
Claudio Chiesa, Italian National Research Council (CNR), ItalyReviewed by:
Raffaella Buzzetti, Sapienza University of Rome, ItalyIsmail Özkaya, Kirklareli University, Turkey
Mumtaz M. Mazicioglu, Erciyes University, Turkey
Copyright © 2019 Payab, Qorbani, Shahbal, Motlagh, Hasani-Ranjbar, Zahedi, Shafiee, Ziaodini, Pourmirzaiee, Heshmat and Kelishadi. This is an open-access article distributed under the terms of the Creative Commons Attribution License (CC BY). The use, distribution or reproduction in other forums is permitted, provided the original author(s) and the copyright owner(s) are credited and that the original publication in this journal is cited, in accordance with accepted academic practice. No use, distribution or reproduction is permitted which does not comply with these terms.
*Correspondence: Mostafa Qorbani, bXFvcmJhbmkxMzc5QHlhaG9vLmNvbQ==; Ramin Heshmat, cmhlc2htYXRAdHVtcy5hYy5pcg==
†These authors have contributed equally to this work