 Satu Seppä
 Sirpa Tenhola1,2
 Raimo Voutilainen
- 1Department of Pediatrics, Kuopio University Hospital and University of Eastern Finland, Kuopio, Finland
- 2Department of Pediatrics, Kymenlaakso Central Hospital, Kotka, Finland
Background: Osteocalcin (OC) is an osteoblast-derived marker of bone turnover that has recently been linked to glucose metabolism, glucocorticoid action, and cardiovascular risk.
Objective: We determined whether serum total OC (tOC) is associated with cardiometabolic factors, such as insulin sensitivity (IS) markers and endogenous glucocorticoids in 12-year-old children. In addition, we assessed whether low birth weight or exposure to maternal preeclampsia affect tOC concentrations.
Methods: In this cross-sectional study, 192 children (109 girls) were studied at 12 years of age. Seventy of them had been born small (SGA), 78 appropriate for gestational age (AGA), and 44 from preeclamptic pregnancies (PRE) as AGA. Blood pressure was measured, and fasting blood samples were collected for markers of glucose metabolism, osteoblast, adipocyte, and adrenocortical function. IS was estimated by Quantitative Insulin Sensitivity Check Index (QUICKI). Free cortisol index (FCI) was calculated as serum cortisol/corticosteroid binding globulin.
Results: The highest tOC concentrations were detected in midpubertal children (Tanner B/G stage 3). The children in the highest tOC quartile (n = 48) had lower body mass index (BMI), waist-to-height ratio, diastolic blood pressure, leptin, cortisol/cortisone ratio and FCI, and higher insulin-like growth factor I (IGF-I), IGF-binding protein-1 (IGFBP-1), IGFBP-3, and alkaline phosphatase (ALP) than those in the lower tOC quartiles (p < 0.02 for all). QUICKI was similar in these subgroups. In logistic regression analysis, pubertal developmental stages 2 and 3, high ALP, IGF-I, and low FCI and BMI (p < 0.02 for all) were associated independently with higher tOC. The means of serum tOC and IS markers were similar in the SGA, AGA, and PRE subgroups.
Conclusions: In both sexes, the highest tOC levels were detected in midpubertal children reflecting the fast pubertal growth phase. Higher tOC levels were associated with lower BMI and FCI, whereas no association was found with IS. Birth weight or exposure to preeclampsia had no effect on tOC concentrations.
Introduction
Osteocalcin (OC) is a commonly used marker of bone turnover (1, 2), which has recently been linked to glucose and energy metabolism (2). OC is a non-collagenous polypeptide existing abundantly in the mineralized bone matrix. After being synthetized by osteoblasts, it undergoes vitamin K-dependent carboxylation. The γ-carboxylation of OC increases its affinity for hydroxyapatite crystals; thus, most of the produced OC is embedded in the bone matrix (1–3). A small amount of OC abides undercarboxylated (ucOC) and is secreted into the circulation (1, 2). Therefore, both carboxylated and ucOC forms exist in the circulation (3). UcOC has been suggested to act as a hormone linking bone to the mediators of glucose homeostasis (4, 5). In animal models, circulating ucOC has been shown to regulate whole-body energy metabolism by increasing insulin sensitivity in peripheral tissues, enhancing insulin secretion from pancreatic beta cells and upregulating adiponectin secretion from fat cells (4–6).
In human studies, circulating total OC (tOC) concentrations were positively associated with markers of insulin sensitivity (IS) (7), and negatively with plasma glucose (3, 7, 8), insulin resistance (3, 7, 9), body mass index (BMI) (8–10), fat mass (8), and waist circumference (10). Adults with type 2 diabetes (3, 7, 8, 11–13) or the metabolic syndrome (7) had lower tOC concentrations compared with healthy subjects. In cross-sectional studies, tOC was inversely associated with the risk of type 2 diabetes, the metabolic syndrome (7) and cardiovascular mortality (3). Lower tOC levels were also found in overweight or obese adults (3, 10) and children (9). Furthermore, ucOC was inversely associated with measures of glycemia and diabetes risk even after adjustments for tOC in large epidemiological studies conducted in older men (3), and positively associated with beta cell function in children with prediabetes (14). However, some longitudinal studies in elderly or middle-aged adults showed no association between tOC or ucOC and glycemic control (3).
Serum tOC concentrations vary by age and sex (15–17). Throughout childhood, circulating tOC levels are higher than the adult reference range. The concentrations of tOC peak with the fast pubertal growth phase at Tanner stages 2–3 of breast development in girls and at Tanner stages 2–3 of genital development in boys. TOC concentrations decrease to adult level at the end of statural growth (17).
Glucocorticoids are known to induce insulin resistance, hyperglycemia and hyperlipidemia via multiple pathways. Glucocorticoid action in bone impairs osteoblast function and thus decreases OC synthesis, which in turn contributes to insulin resistance according to animal studies (18, 19). In patients with Cushing's syndrome (CS), bone formation is greatly suppressed. Sereg et al. found that subjects with overt CS had the lowest serum tOC concentrations when compared to subjects with subclinical CS, hormonally inactive adrenal adenomas or those without hypothalamo-pituitary-adrenal axis disturbances. Serum tOC concentrations correlated inversely with serum and salivary cortisol levels in overt CS. Thus, it was suggested that serum OC may sensitively reflect endogenous hypercortisolism (20).
The purpose of the present study was to evaluate, whether serum tOC concentrations associate with cardiometabolic factors, such as markers of IS, endogenous glucocorticoids, and blood pressure (BP) in children aged 12 years. Furthermore, we wanted to determine, whether tOC concentrations differ in children born small (SGA) or appropriate (AGA) for gestational age, or from preeclamptic pregnancies (PRE). Based on previous reports, we hypothesized that serum tOC would associate inversely with unfavorable cardiometabolic factors and that SGA and PRE children could have lower tOC concentrations than AGA-born ones, as low birth weight and maternal preeclampsia prompt independently later metabolic and cardiovascular disturbances (21, 22).
Materials and Methods
Study Design and Subjects
The design of this study was cross-sectional. The study population consisted of a cohort of 192 12-year-old children, who were recruited in the study investigating metabolic and cardiovascular consequences of either being born SGA or after PRE. Of this cohort 109 (57%) were females, 70 (36%) were born SGA, and 44 (23%) were born after PRE as AGA. 16 (23%) of the SGA subjects (8% of the cohort) were born after PRE. The median of the gestational ages was 38.0 weeks (range 28-42). The extremely preterm children born before the week 28 of gestation were excluded from the study. None of the participating children was exposed to exogenous glucocorticoids prenatally. All children were born at Kuopio University Hospital during a 22-months period between 1984 and 1986, and they were evaluated between 1996 and 1998. The study protocol was approved by the Research Ethics Committee of Kuopio University Hospital. Informed written consent was obtained from the child and the parents in accordance with the Declaration of Helsinki.
Variables of the Study
Early Life Variables
Preeclampsia was defined as the development of hypertension and proteinuria (>300 mg of urinary protein in 24 h) after 20 weeks of gestation (23). Hypertension was defined as BP >140/90 mmHg or a rise of ≥30/15 mmHg from the baseline level confirmed by two measurements at least 6 h apart. Full-term indicates babies born at or after week 37 and before the 42nd week of gestation, and preterm indicates babies born before the 37th week of gestation (calculated from the beginning of the last menstruation). SGA was defined as birth weight and/or length more than 2 SD scores below the respective mean for the gestational age and sex. AGA was defined as birth weight and birth length equal to or above −2 SD scores and equal to or below +2 SD scores of the respective mean for the gestational age and sex (24). The variables were collected from the medical reports of the mothers and study subjects.
Pubertal and Anthropometric Variables
The perinatal data and anthropometric measures at 12 years age have been described previously for the SGA (25, 26) and PRE children (27, 28). Pubertal development was classified as Tanner stages according to breast development (B) in girls and genital development (G) in boys. BMI (calculated as weight in kilograms divided by height in meters squared) and sex- and adult age -adjusted BMI [BMIadj; corresponding to the BMI values at the age of 18 years (29)] were calculated. Waist-to-height ratio (WHtR) was calculated by dividing waist circumference (in centimeters) by height (in centimeters). Perinatal characteristics, anthropometric measures, and pubertal development at the age of 12 years in the whole study population are presented in Table 1.
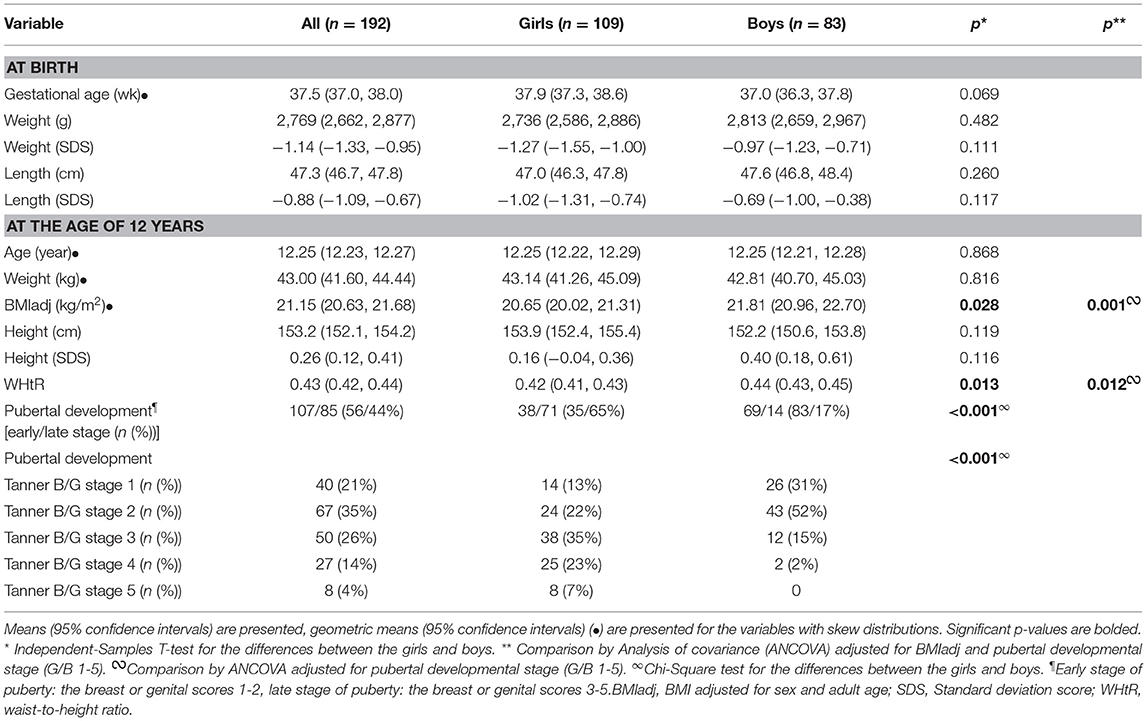
Table 1. Anthropometric characteristics of the study population at birth and at the age of 12 years.
Biochemical Variables
Blood samples were taken in the morning, between 9 AM and 10 AM, after an overnight fast. An intravenous cannula was placed in the antecubital vein for blood sampling. After the child had rested for 1 h in a recumbent position, blood samples were drawn through the cannula. Blood glucose concentrations were measured after sampling, plasma and serum specimens were immediately frozen and stored at −70°C until analyzed. The biochemical, hormonal, and adipocytokine analyses were performed later using previously unthawed serum aliquots.
Serum tOC concentrations were measured by enzyme-linked immunosorbent assay (ELISA) (N-MID Osteocalcin ELISA, Nordic Bioscience Diagnostics A/S, Herlev, Denmark). The intra- and interassay coefficients of variation (CV) for tOC were <2.2 and <5.1%, respectively, as reported by the manufacturer. Serum alkaline phosphatase (ALP) concentrations were analyzed by enzymatic photometric test (Konelab 20XT Clinical Chemistry Analyzer, Thermo Fisher Scientific, Vantaa, Finland), and the respective CVs were 4.0% and <5.7%. Serum calcium (Ca) concentrations were measured by Photometric colorimetric test, Arsenazo III (Konelab 20 XT, Clinical Chemistry Analyzer, Thermo Fisher Scientific) with its intra- and interassay CVs 1.7% and <2.0, respectively. Serum insulin concentrations were determined by radioimmunoassay (RIA) (Phadeseph Insulin RIA, Pharmacia & Upjohn Diagnostics AB, Uppsala, Sweden). The intra- and interassay CVs were 5.3 and 7.6%, respectively. Blood glucose concentrations were analyzed by a glucose oxidase method (Enzyme Electrode, Nova Biomedical, Waltham, MA), and the respective CVs were 3 and 5%. Serum insulin-like growth factor I (IGF-I) concentrations were analyzed by ELISA (DSL-10-5600 ACTIVE IGF-I ELISA; Diagnostic Systems Laboratories, Inc., Webster, TX) as described previously (30). The intra-assay CV for IGF-I was 6.5%, and the interassay CV was 6.4%, as reported by the manufacturer. Serum IGF-binding protein-1 (IGFBP-1) and IGFBP-3 concentrations were analyzed by ELISA (DSL-10-7800 ACTIVE Total IGFBP-1 ELISA, DSL-10-6600 ACTIVE IGFBP-3 ELISA, both from Diagnostic Systems Laboratories). The intra- and interassay CVs for IGFBP-1 were 2.5 and 6.8%, and for IGFBP-3 7.3 and 8.2%, respectively. Serum sex hormone binding globulin (SHBG) was measured by the AutoDELFIA SHBG time-resolved fluoroimmunoassay method (Perkin Elmer Life Sciences Wallac, Turku, Finland). The intra- and interassay CVs were 4.0 and 2.6%, respectively. Serum leptin and adiponectin concentrations were analyzed by ELISA (Quantikine DLP00; Quantikine DRP300, both from R&D Systems, Inc., Minneapolis, MN) with their intra- and interassay CVs 3.2 and 3.5% (leptin), and <4.7 and <6.9% (adiponectin), respectively. Serum cortisol and cortisone concentrations were analyzed by liquid chromatography tandem mass spectrometry as previously described (31). Serum corticosteroid binding globulin (CBG) was measured by RIA (CBG-RIA-100, Biosource Europe, Nivelles, Belgium), as described previously (32). Free cortisol index (FCI) was calculated as serum cortisol (nmol/L)/CBG (mg/L) (33). QUICKI (Quantitative Insulin Sensitivity Check Index) was calculated as 1/[log (fasting insulin, μU/mL) + log (fasting glucose, mg/dL)] (34).
Statistical Analyses
Data were analyzed using the statistical program SPSS for Macintosh, version 24.0 (SPSS, IBM Corp., Armonk, NY). All continuous variables were examined for normality with the Kolmogorov-Smirnov test. Skewed data were either logarithmically or square root -transformed before testing. Independent samples T-test, univariate analysis of variance (ANOVA) or analysis of covariance (ANCOVA) were used for comparisons between different groups. Sidak-correction was used for post hoc tests. Partial correlation coefficients were calculated. Most of the analyses were adjusted for BMIadj and pubertal stage in order to eliminate their confounding effect on the results. Logistic regression analysis was used to explore independent associating factors with serum tOC. In our model, the dependent variable was serum tOC concentration (the highest quartile) and the independent variables were pubertal stages B/G 1-5, BMIadj, ALP, IGF-I, IGFBP-1, FCI, sex, birth weight (SDS), and maternal preeclamptic history.
A p < 0.05 was accepted as significant in all analyses.
Results
Anthropometric Characteristics and Pubertal Development
The anthropometric characteristics and pubertal development of the study subjects are presented in Table 1. The mean age of the children at the examination was 12.25 years, and 56.8% of them were females. The means of birth weight and length were similar between the girls and boys. At 12 years of age, the boys had greater BMIadj and WHtR than the girls, whereas pubertal development was more advanced in the girls than boys (Table 1). Anthropometric characteristics and pubertal development of the SGA, AGA and PRE-AGA children were described recently (35).
Serum tOC, Glucocorticoid Parameters and Markers of IS
The mean concentrations of serum tOC, ALP, and IGFBP-3 did not differ between the sexes, whereas the means of serum IGF-I and leptin were higher in the girls than boys. At 12 years of age, the girls had lower means of QUICKI and IGFBP-1 than the boys. The serum concentrations of cortisol, cortisone, the cortisol/cortisone ratio and FCI were similar between the sexes. The mean of CBG was lower in the girls; however, after adjustment for BMIadj and pubertal developmental stage, the difference turned non-significant (Table 2). No differences were found in tOC, ALP, QUICKI, cortisol, and FCI between the AGA, SGA, and PRE-AGA subgroups (data not shown). The cortisol/cortisone ratio was higher in the PRE children (including both AGA and SGA subjects) compared with the non-PRE ones (2.99 vs. 2.72, p = 0.030 by ANCOVA adjusted for sex, pubertal developmental stage, and BMIadj).
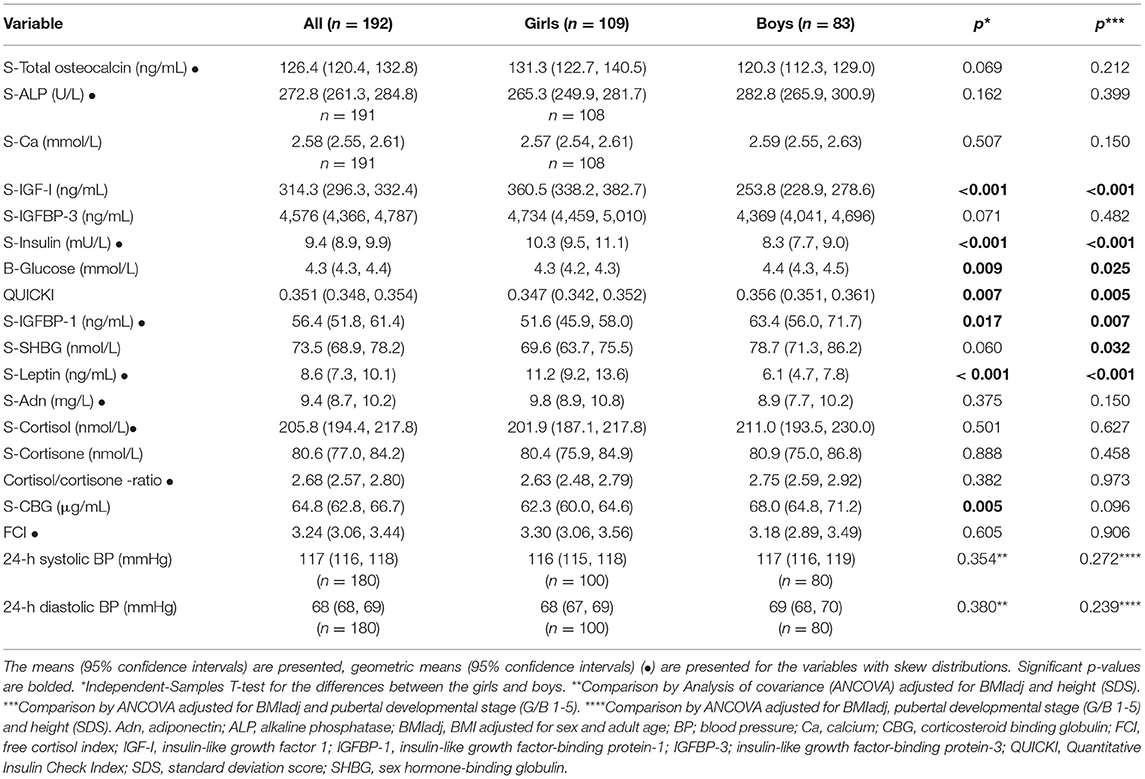
Table 2. Biochemical parameters in the study population (girls and boys separately).
Serum tOC in Relation to Anthropometric Measures, IS Markers, and Glucocorticoid Parameters
In the whole study population, serum tOC had a negative correlation with BMIadj and WHtR. When the sexes were analyzed separately, these correlations were significant only in the girls (Table 3). Serum tOC had no correlation with blood glucose, serum insulin, QUICKI and height SD scores. Serum tOC correlated positively with ALP and Ca in the whole study population and in the girls. Furthermore, positive correlations between serum tOC and IGF-I were observed in the whole study population and in sex-specific analyses, whereas the correlation between serum tOC and IGFBP-3 was significant in the whole study population and in the boys (Table 3). In the whole study population, serum tOC associated negatively with SHBG, leptin and adiponectin (Table 3). Finally, in the whole study population and in the girls, serum tOC correlated negatively with the cortisol/cortisone ratio. In the girls, serum tOC correlated inversely with cortisol and FCI (Table 3).
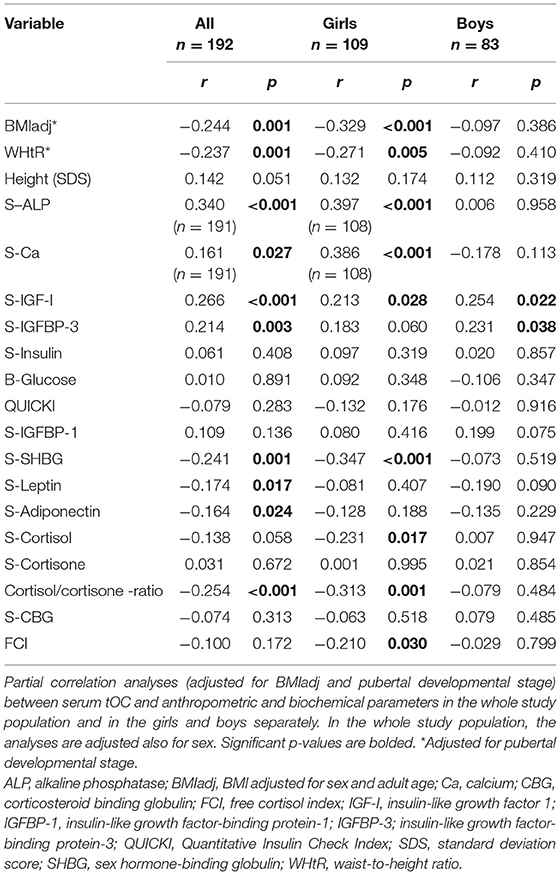
Table 3. Correlation analyses between serum total osteocalcin and anthropometric and biochemical parameters.
Serum OC, ALP, IGF-I, IGFBP-3, and Insulin Across Pubertal Stages
In both sexes, the highest tOC concentrations were found in midpubertal children, in Tanner stage B/G 3 (Figure 1). ALP concentrations were highest in Tanner stage G3 in the boys and B1 in the girls (Figure 1). In the girls, serum IGF-I peaked in Tanner stage B4 (Figure 1), whereas IGFBP-3 was highest in Tanner stage B3 without a significant difference to other stages (data not shown). In the boys, serum IGF-I (Figure 1) and IGFBP-3 increased during puberty achieving the highest levels in the Tanner stage G4; however, the IGFBP-3 levels were not significantly different between the Tanner stages (data not shown). Moreover, none of the male subjects had yet completed pubertal development (reached Tanner stage G5). The prepubertal (Tanner stage 1) girls had higher serum tOC and ALP concentrations than the prepubertal boys (Figure 1, p = 0.030, p = 0.015, respectively, by Independent-Samples T-test). Furthermore, IGF-I was higher in the girls than boys in Tanner stages 1 and 2 (Figure 1, p = 0.007 and p = 0.006, respectively, by Independent-Samples T-test). However, the boys had higher ALP values compared with the girls in Tanner stages 3 (Figure 1, p = 0.003) and 4 (Figure 1, p = 0.044, by Independent-Samples T-test). In the whole study population, serum insulin concentrations increased during puberty; however, the increases were not statistically significant, when the sexes were analyzed separately (Figure 1).
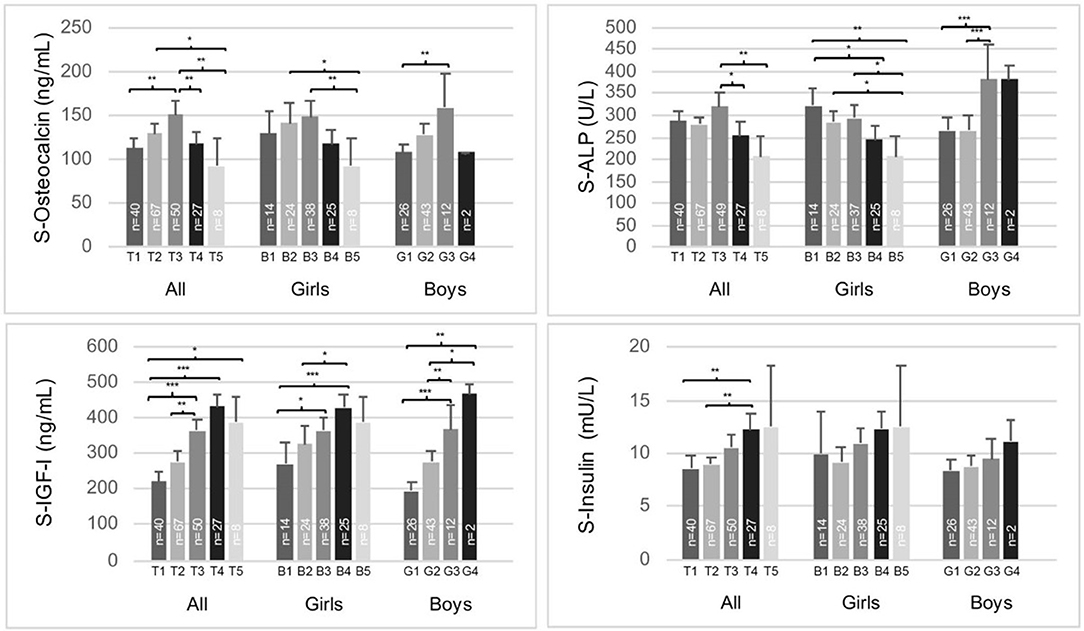
Figure 1. Serum total osteocalcin, alkaline phosphatase (ALP), IGF-I, and insulin concentrations according to Tanner stages B/G 1-5 in the whole study population (girls and boys separately). The means (95% CI) are presented. Analysis of covariance (adjusted for gender in the whole study population) were performed, Sidak-adjusted p-values are presented. *p < 0.05, **p < 0.01, ***p < 0.001.
Factors Associating With High Serum tOC Concentrations
The children in the highest tOC quartile were leaner in terms of BMIadj and WHtR, and they had lower leptin concentrations than the children in the lower tOC quartiles. No difference was found in height (SD scores), but the progression of pubertal development differed between these subgroups. In the highest tOC quartile, 44% of the subjects were in midpuberty (Tanner stage B/G 3), whereas in the three lower tOC quartiles the corresponding percentage was 20% (Table 4). The means of QUICKI, blood glucose and serum insulin concentrations were similar between the highest and three lower quartiles, whereas IGF-I, IGFBP-1, IGFBP-3, ALP, and Ca concentrations were higher in the children with the highest tOC levels than in those with lower tOC concentrations (Table 4). The observed differences in IGFBP-1 and IGFBP-3 concentrations between the tOC quartiles were diminished after adjustment for confounding factors BMIadj and pubertal developmental stage (Table 4). Furthermore, SHBG levels were lower in the highest tOC quartile compared with those in the lower quartiles in BMIadj-adjusted analyses (Table 4). Serum cortisol and cortisone concentrations were similar between the highest and the lower tOC quartiles. However, the mean of the cortisol/cortisone ratio was lower in the highest tOC quartile than in the three lower quartiles (Table 4) independently of gender, pubertal developmental stage and BMIadj. After adjustments for confounding factors, the subjects in the highest tOC quartile had lower FCI than those with lower tOC concentrations (Table 4). The difference remained even after adjustment for birth weight (SD scores) and maternal PRE history. The children in the highest tOC quartile had lower 24-h systolic and diastolic BP means compared with the children in the lower tOC quartiles. However, after additional adjustment for height (SD scores), the difference in 24-h systolic BP between the groups was attenuated.
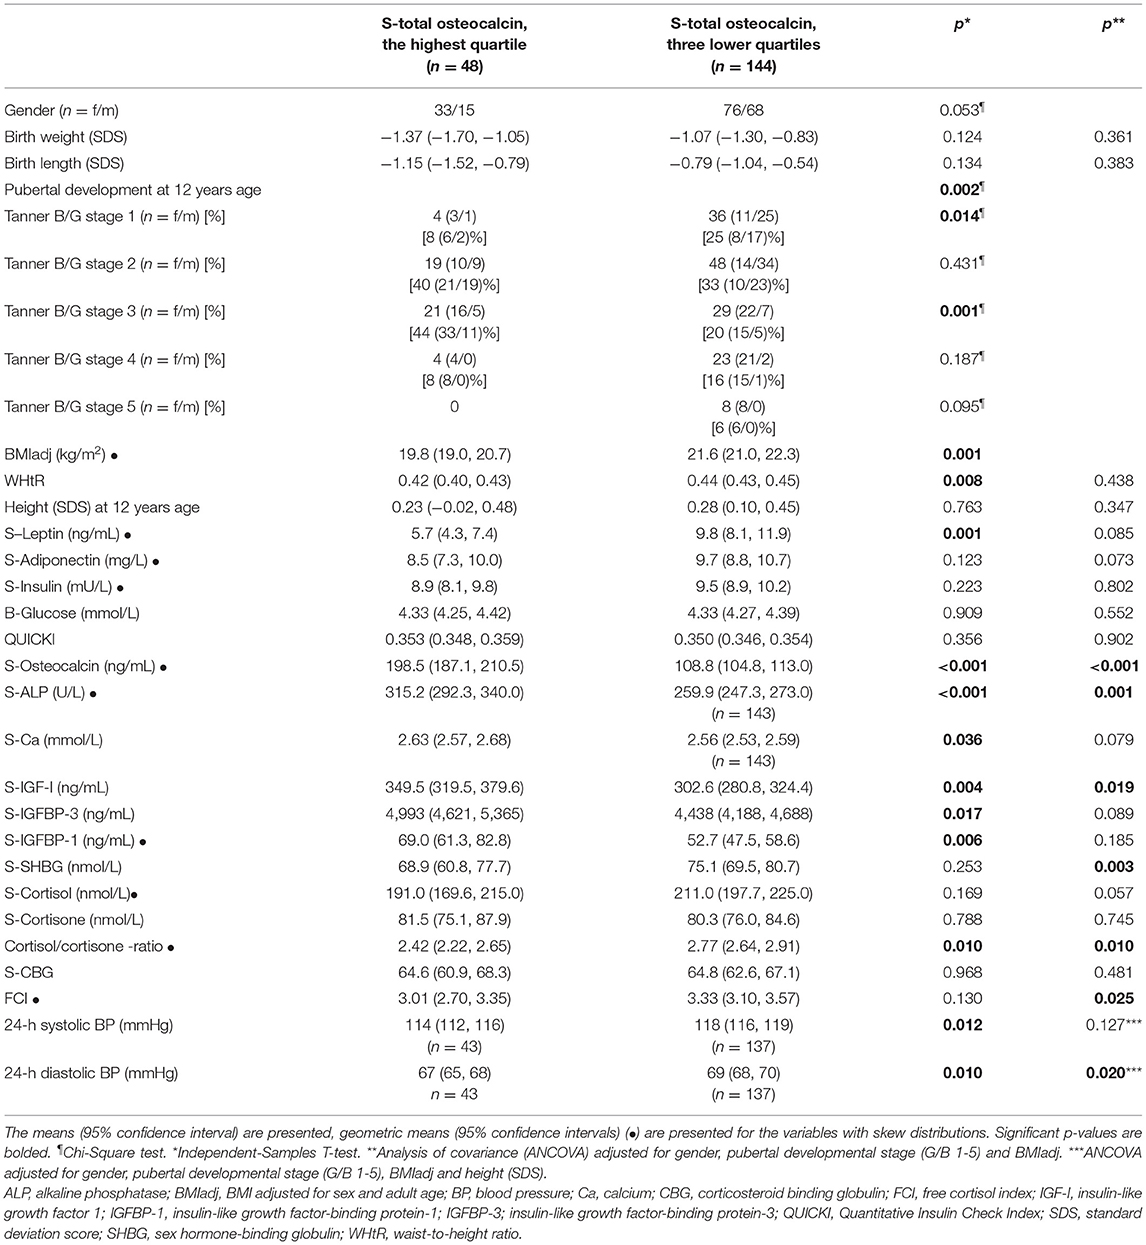
Table 4. Comparison between the highest and three lower osteocalcin quartiles.
In a binary logistic regression model adjusted for sex, birth weight (SD scores) and maternal PRE history, Tanner stages B/G 2-3, high serum IGF-I and ALP concentrations, and low FCI and BMIadj associated independently with higher tOC concentrations (Table 5).
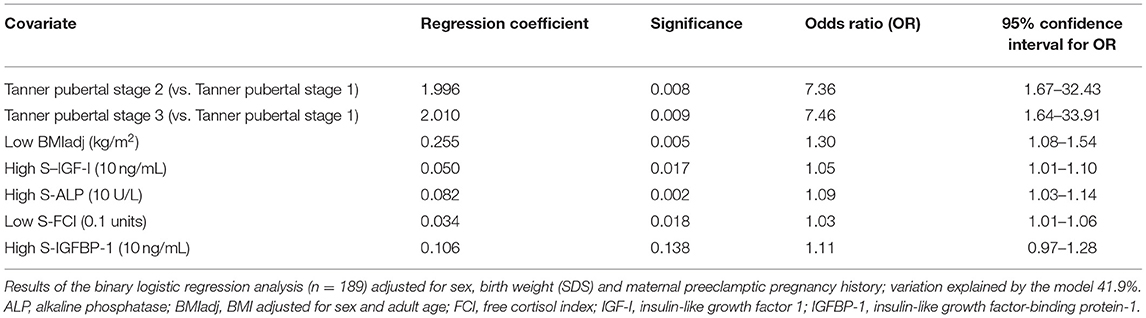
Table 5. Factors associating with high total osteocalcin (the highest osteocalcin quartile) in the whole study population.
Discussion
In this study, serum tOC was not associated with IS estimated by QUICKI in 12-year-old children. The highest tOC concentrations were detected in midpubertal children with high IGF-I, IGFBP-3, and ALP concentrations. Furthermore, higher tOC associated with lower FCI and cortisol/cortisone ratio. In binary logistic regression analysis, Tanner stages B/G 2-3, high IGF-I and ALP concentrations, and low FCI and BMIadj associated independently with a high tOC value. Being born SGA or prenatal exposure to maternal preeclampsia was not associated with tOC concentrations.
Cross-sectional human studies including subjects with variable age, sex and adiposity distribution have shown inverse associations between tOC or ucOC and adiposity, measures of glycemia and insulin resistance (3, 7–9, 36). However, many studies have found no association between tOC or ucOC and indices of glycemia cross-sectionally or over time (3, 37–39), or significant associations have been demonstrated only in subjects with metabolic dysregulation, such as impaired glucose tolerance or prediabetes (3, 14). Consequently, the association between tOC and ucOC and glucose metabolism has been suggested to be age-dependent and minor under normal glucose tolerance or BMI (37). On the contrary, circulating tOC has been reported to associate with IS and insulin secretion in lean adults (40). In longitudinal observational studies with elderly adults, higher serum tOC was associated with a lower rise in fasting plasma glucose, and increased serum tOC concentrations were associated with an increase in insulin secretion, whereas an increase in ucOC was associated with enhanced IS (3). Inconclusive findings have led to speculations that ucOC and carboxylated OC could have divergent roles in the human glucose-insulin axis (38). However, numerous confounding factors such as age and sex differences, vitamin K status, physical activity, BMI, IS, and renal function may explain the observed inconsistencies in different studies.
So far, relatively few studies on the relation between OC forms and IS have been performed in children or adolescents, and the results have been inconsistent. Reinehr et al. (9) reported in 11-year-old children a significant negative relationship between tOC and HOMA-IR. In another study with 5 to 9-year-old lean children, a higher ratio of ucOC to carboxylated OC associated with higher HOMA-β, but not with HOMA-IR (36). In 7–11-year-old prepubertal overweight children, carboxylated OC was associated with IS in both normal-glucose and prediabetic children, whereas ucOC was associated with beta cell function only in prediabetic subjects (14). A study of Polgreen et al. (10) performed in young (17–22 years old) adults showed only a non-significant borderline relation between tOC and insulin resistance estimated by euglycemic hyperinsulinemic clamp; no independent relationship between ucOC and insulin resistance was detected. Redondo et al. found an inverse correlation between ucOC and hemoglobin A1c shortly after diagnosis of pediatric diabetes (41). Furthermore, Jürimäe et al. reported a positive correlation between tOC and HOMA-IR in 11 to 12-years old normal-weight boys (42), whereas other studies have found no relationship in ucOC or tOC and markers of glucose metabolism in children or adolescents (43, 44). A study of Tubic et al. in 2 to 9-year-old children reported no correlation between OC forms and measured metabolic parameters (38). In accordance with these, we found no association between tOC and glucose homeostasis. The inconsistencies between the findings of different studies may be explained by the different methods used to assess OC, by the age of the study subjects or by different selection criteria of the study cohorts.
We found a negative correlation between tOC and BMIadj and WHtR in accordance with most previous studies in children or young adults (9, 10, 42–44). However, Tubic et al. (38) reported that only carboxylated OC was decreased in prepubertal overweight compared with normal-weight children, whereas a couple of studies have found no relationship between tOC concentrations and indicators of body weight (45, 46).
In young adults, serum tOC was inversely associated with systolic BP and a cardiovascular risk factor cluster score (10). In another study with prepubertal children at risk for cardiovascular disease, ucOC was positively related to cardiovascular risk markers (47), whereas in a recent meta-analysis serum tOC had no evident association with vascular calcification or atherosclerosis (48). In our study, 24-h systolic and diastolic BP means were significantly lower in the subjects in the highest tOC quartile; however, further adjustment for height (SD scores) attenuated the association between tOC and 24-h systolic BP.
The interaction between adipose and bone tissue has been speculated to be mediated partly by leptin and adiponectin (2). Experimental studies have shown that ucOC regulates IS by increasing adiponectin release from adipocytes (4). In contrast, leptin inhibits OC production by osteoblasts (2). Even in human studies, bone and glucose metabolism has been postulated to be connected through a complex pathway involving tOC, adiponectin and leptin (49). A positive association between serum carboxylated OC or tOC and adiponectin has been reported in adults (10, 13, 40), while the associations between tOC and insulin secretion, IS and glucose tolerance were independent of plasma adiponectin levels (13). Previous reports in children and adolescents (9, 42, 44, 45), and non-diabetic women (37) have reported no association between serum tOC and adiponectin, whereas we found a negative correlation when adjusted for BMIadj and pubertal developmental stage. In our study, tOC correlated negatively with leptin as reported previously (8, 9, 42, 44), although some studies have not found such an association in children or young adults (37, 39, 45).
The concentrations of circulating bone formation markers IGF-I, ALP, and tOC peak during the pubertal growth spurt and decline during late puberty (17, 45, 50–52). Thus, tOC levels are at their highest during the fast pubertal growth phase (17, 45, 50, 51, 53). TOC levels were previously described to rise at an earlier pubertal stage in females than males (47). We found the highest tOC concentrations in midpuberty in both sexes, and no difference was found in the mean tOC concentrations between girls and boys after the prepubertal phase. In most studies, boys are reported to have higher tOC concentrations than girls from midpuberty onwards (9, 45, 52, 53). In accordance with us, Yilmaz et al. (54) reported tOC concentrations to peak at Tanner stage 3; however, they observed no significant change in tOC concentrations across pubertal stages. The differences between the findings could be due to differences in methodology, or the selected cohorts. In our study, the mean serum IGF-I concentrations increased with pubertal stages in parallel with those of tOC until midpuberty; after that tOC levels started to decrease while IGF-I remained high as described by others (53). Furthermore, in our whole study population and in the girls, serum tOC correlated positively with ALP. However, no association was found between serum ALP and tOC in boys even after adjustments for BMIadj and pubertal developmental stage. This suggests that other factors, such as gonadal-skeletal axis is relevant in pubertal skeletal growth and metabolism as shown previously in experimental studies and in pubertal boys (42, 55, 56).
In mice, excessive glucocorticoids impair osteoblast function and lead to decreased circulating tOC and ucOC levels. Restoration of OC levels by gene transfer experiments prevented glucocorticoid-induced changes in energy metabolism and body composition (18). In humans, exogenous or endogenous glucocorticoid excess associates with adverse clinical features, such as osteoporosis, accumulation of visceral fat and insulin resistance, or diabetes. However, the significance of bone in glucocorticoid-induced changes in energy metabolism and body composition is unclear in humans (19). FCI, which eliminates the effect of CBG variation in cortisol values, correlates well with free serum cortisol considered the biologically active hormone (33). We showed that FCI was lower in the subjects of the highest tOC quartile compared with those of lower quartiles even after appropriate adjustments. This suggests that even individual physiological variation in serum cortisol may be reflected in circulating tOC levels. The high sensitivity of serum tOC concentrations to glucocorticoids was previously observed also in children receiving inhaled steroids for treatment of asthma (57).
Low birth weight and maternal preeclampsia predispose to later cardiometabolic diseases (21, 22). Altered activation of the hypothalamo-pituitary-adrenal axis has been proposed to play a role in intrauterine growth restriction (IUGR) (58). The cortisol/cortisone ratio has been used as an indirect measure of the enzyme activity of 11β-hydroxysteroid dehydrogenase type 2 (11β-HSD2) (59, 60), which converts cortisol to biologically inactive cortisone. In humans, reduced placental 11β-HSD2 gene expression has been reported in IUGR and PREs (61, 62). In the present cohort, tOC concentrations were similar in the SGA, AGA, and PRE children. However, the children born from PRE had a higher serum cortisol/cortisone ratio than those without exposure to maternal PRE.
The strengths of this study include detailed anthropometric data of the study population at birth and at 12 years of age, a careful examination of pubertal development and a large quantity of biochemical measurements. However, also potential limitations exist. The cross-sectional nature of this study allows evaluation of associations but not causality. The study age of 12 years is demanding due to the variable timing in pubertal development and transient hyperinsulinemia and insulin resistance occurring during midpuberty. We attempted to exclude the possible influence of these by adjusting the analyses for the pubertal developmental stage. Furthermore, the one-time measurement of IS could be a potential limitation in this study. Although fasting insulin alone or in combination with fasting glucose are not optimal measures for assessing individual IS, they are considered appropriate in studies with well-defined cohorts (63). QUICKI, which was used as a surrogate marker of IS in our study, correlates quite well with the glucose clamp method (64). Unfortunately, we had no data on the frequency and intensity of exercise and dietary habits, which could affect individual IS. Finally, we have no measurements of carboxylated and ucOC forms separately. UcOC and tOC correlate strongly; thus, tOC can still be considered a reliable bone turnover marker associating with parameters of energy metabolism (56).
In conclusion, at 12 years of age the highest tOC levels were observed in midpubertal children with high IGF-I, IGFBP-3 and ALP concentrations reflecting the fast pubertal growth phase. IS, being born SGA or prenatal exposure to maternal preeclampsia were not associated with tOC concentrations. Thus, tOC seems not to be associated with IS in normoglycemic children. However, higher tOC levels were associated with lower FCI indicating lower physiological glucocorticoid activity. The inverse association between tOC and FCI suggests that even the physiological variation in circulating endogenous glucocorticoid levels may influence osteoblast activity and circulating tOC concentrations.
Data Availability Statement
The datasets generated for this study are available on request to the corresponding author.
Ethics Statement
The studies involving human participants were reviewed and approved by Research Ethics Committee of Kuopio University Hospital Puijonlaaksontie 2, P.O. Box 100, FI-70029 Kuopio, Finland Written informed consent to participate in this study was provided by the participants' legal guardian/next of kin.
Author Contributions
RV and ST designed the study. ST and SS performed collection and handling of the data. SS analyzed the data and wrote the manuscript with contributions of all authors. All authors discussed the data and accepted the final draft.
Funding
This study was supported financially by the Sigrid Jusélius Foundation (to RV), the Pediatric Research Foundation, the Finnish Medical Foundation and the Finnish Medical Society Duodecim (all to SS), the Finnish Cultural Foundation's Kymenlaakso Regional Fund (to SS and ST), University of Eastern Finland, and Kuopio University Hospital (to SS and RV). The funders had no role in: (1) study design; (2) the collection, analysis and interpretation of data; (3) the writing of the report; and (4) the decision to submit the paper for publication.
Conflict of Interest
The authors declare that the research was conducted in the absence of any commercial or financial relationships that could be construed as a potential conflict of interest.
Acknowledgments
We thank Ms. Leila Antikainen for biochemical analyses and biostatistician Tuomas Selander for valuable advice on analyzing the data.
Abbreviations
AGA, appropriate for gestational age; ALP, alkaline phosphatase; ANCOVA, analysis of covariance; ANOVA, analysis of variance; B, breast development; BMI, body mass index; BMIadj, BMI adjusted for sex and adult age; BP, blood pressure; Ca, calcium; CBG, corticosteroid binding globulin; CS, Cushing's syndrome; CV, coefficient(s) of variation; ELISA, enzyme-linked immunosorbent assay; G, genital development; HOMA-IR, Homeostasis Model Assessment for Insulin Resistance; IGF-I, insulin-like growth factor I; IGFBP-1, IGF-binding protein-1; IGFBP-3, IGF-binding protein-3; IS, insulin sensitivity; IUGR, intrauterine growth restriction; OC, osteocalcin; PRE, preeclamptic pregnancy; QUICKI, Quantitative Insulin Sensitivity Check Index; RIA, radioimmunoassay; SGA, small for gestational age; tOC, total osteocalcin; ucOC, undercarboxylated osteocalcin; WHtR, waist-to-height ratio; 11β-HSD2, 11β-hydroxysteroid dehydrogenase type 2.
References
1. Hauschka PV, Lian JB, Cole DE, Gundberg CM. Osteocalcin and matrix gla protein: vitamin K-dependent proteins in bone. Physiol Rev. (1989) 69:990–1047. doi: 10.1152/physrev.1989.69.3.990
2. Liu JM, Rosen CJ, Ducy P, Kousteni S, Karsenty G. Regulation of glucose handling by the skeleton: Insights from mouse and human studies. Diabetes. (2016) 65:3225–32. doi: 10.2337/db16-0053
3. Lin X, Brennan-Speranza TC, Levinger I, Yeap BB. Undercarboxylated osteocalcin: experimental and human evidence for a role in glucose homeostasis and muscle regulation of insulin sensitivity. Nutrients. (2018) 10:847. doi: 10.3390/nu10070847
4. Lee NK, Sowa H, Hinoi E, Ferron M, Ahn JD, Confavreux C, et al. Endocrine regulation of energy metabolism by the skeleton. Cell. (2007)130:456–69. doi: 10.1016/j.cell.2007.05.047
5. Ferron M, Hinoi E, Karsenty G, Ducy P. Osteocalcin differentially regulates beta cell and adipocyte gene expression and affects the development of metabolic diseases in wild-type mice. Proc Natl Acad Sci USA. (2008) 105:5266–70. doi: 10.1073/pnas.0711119105
6. Fulzele K, Riddle RC, DiGirolamo DJ, Cao X, Wan C, Chen D, et al. Insulin receptor signaling in osteoblasts regulates postnatal bone acquisition and body composition. Cell. (2010)142:309–19. doi: 10.1016/j.cell.2010.06.002
7. Kunutsor SK, Apekey TA, Laukkanen JA. Association of serum total osteocalcin with type 2 diabetes and intermediate metabolic phenotypes: systematic review and meta-analysis of observational evidence. Eur J Epidemiol. (2015) 30:599–614. doi: 10.1007/s10654-015-0058-x
8. Kindblom JM, Ohlsson C, Ljunggren Ö, Karlsson MK, Tivesten Å, Smith U, et al. Plasma osteocalcin is inversely related to fat mass and plasma glucose in elderly Swedish men. J Bone Miner Res. (2009) 24:785–91. doi: 10.1359/jbmr.081234
9. Reinehr T, Roth CL. A new link between skeleton, obesity and insulin resistance: relationships between osteocalcin, leptin and insulin resistance in obese children before and after weight loss. Int J Obes. (2010) 34:852–8. doi: 10.1038/ijo.2009.282
10. Polgreen LE, Jacobs DR Jr, Nathan BM, Steinberger J, Moran A, Sinaiko AR. Association of osteocalcin with obesity, insulin resistance, and cardiovascular risk factors in young adults. Obesity. (2012) 20:2194–201. doi: 10.1038/oby.2012.108
11. Pietschmann P, Schernthaner G, Woloszczuk W. Serum osteocalcin levels in diabetes mellitus: analysis of the type of diabetes and microvascular complications. Diabetologia. (1988) 31:892–5. doi: 10.1007/BF00265373
12. Bouillon R, Bex M, Van Herck E, Laureys J, Dooms L, Lesaffre E, et al. Influence of age, sex, and insulin on osteoblast function: osteoblast dysfunction in diabetes mellitus. J Clin Endocrinol Metab. (1995) 80:1194–202. doi: 10.1210/jcem.80.4.7714089
13. Hwang YC, Jeong IK, Ahn KJ, Chung HY. Circulating osteocalcin level is associated with improved glucose tolerance, insulin secretion and sensitivity independent of the plasma adiponectin level. Osteoporos Int. (2012) 23:1337–42. doi: 10.1007/s00198-011-1679-x
14. Pollock NK, Bernard PJ, Gower BA, Gundberg CM, Wenger K, Misra S, et al. Lower uncarboxylated osteocalcin concentrations in children with prediabetes is associated with beta-cell function. J Clin Endocrinol Metab. (2011) 96:1092. doi: 10.1210/jc.2010-2731
15. Gundberg CM, Looker AC, Nieman SD, Calvo MS. Patterns of osteocalcin and bone specific alkaline phosphatase by age, gender, and race or ethnicity. Bone. (2002) 31:703–8. doi: 10.1016/S8756-3282(02)00902-X
16. Nimptsch K, Hailer S, Rohrmann S, Gedrich K, Wolfram G, Linseisen J. Determinants and correlates of serum undercarboxylated osteocalcin. Ann Nutr Metab. (2007) 51:563–70. doi: 10.1159/000114211
17. Bayer M. Reference values of osteocalcin and procollagen type I N-propeptide plasma levels in a healthy Central European population aged 0–18 years. Osteoporos Int. (2014) 25:729–36. doi: 10.1007/s00198-013-2485-4
18. Brennan-Speranza TC, Henneicke H, Gasparini SJ, Blankenstein KI, Heinevetter U, Coccer VC, et al. Osteoblasts mediate the adverse effects of glucocorticoids on fuel metabolism. J Clin Invest. (2012) 122:4172–89. doi: 10.1172/JCI63377
19. Cooper MS, Seibel MJ, Zhou H. Glucocorticoids, bone and energy metabolism. Bone. (2016) 82:64–8. doi: 10.1016/j.bone.2015.05.038
20. Sereg M, Töke J, Patócs A, Varga I, Igaz P, Szücs N, et al. Diagnostic performance of salivary cortisol and serum osteocalcin measurements in patients with overt and subclinical Cushing's syndrome. Steroids. (2011) 76:38–42. doi: 10.1016/j.steroids.2010.08.007
21. Barker DJ, Winter PD, Osmond C, Margetts B, Simmonds SJ. Weight in infancy and death from ischaemic heart disease. Lancet. (1989) 2:577–80. doi: 10.1016/S0140-6736(89)90710-1
22. Davis EF, Lazdam M, Lewandowski AJ, Worton SA, Kelly B, Kenworthy Y, et al. Cardiovascular risk factors in children and young adults born to preeclamptic pregnancies: a systematic review. Pediatrics. (2012) 129:1552. doi: 10.1542/peds.2011-3093
23. Davey DA, MacGillivray I. The classification and definition of the hypertensive disorders of pregnancy. Am J Obstet Gynecol. (1988) 158:892–8. doi: 10.1016/0002-9378(88)90090-7
24. Pihkala J, Hakala T, Voutilainen P, Raivio K. Characteristic of recent fetal growth curves in Finland (in Finnish). Duodecim. (1989) 105:1540–6.
25. Tenhola S, Martikainen A, Rahiala E, Herrgård E, Halonen P, Voutilainen R. Serum lipid concentrations and growth characteristics in 12-year-old children born small for gestational age. Pediatr Res. (2000) 48:623–8. doi: 10.1203/00006450-200011000-00012
26. Rahiala E, Tenhola S, Vanninen E, Herrgård E, Tikanoja T, Martikainen A. Ambulatory blood pressure in 12-year-old children born small for gestational age. Hypertension. (2002) 39:909–13. doi: 10.1161/01.HYP.0000013864.24138.A5
27. Tenhola S, Rahiala E, Martikainen A, Halonen P, Voutilainen R. Blood pressure, serum lipids, fasting insulin, and adrenal hormones in 12-year-old children born with maternal preeclampsia. J Clin Endocrinol Metab. (2003) 88:1217–22. doi: 10.1210/jc.2002-020903
28. Tenhola S, Rahiala E, Halonen P, Vanninen E, Voutilainen R. Maternal preeclampsia predicts elevated blood pressure in 12-year-old children: evaluation by ambulatory blood pressure monitoring. Pediatr Res. (2006) 59:320–4. doi: 10.1203/01.pdr.0000196734.54473.e3
29. Saari A, Sankilampi U, Hannila M, Kiviniemi V, Kesseli K, Dunkel L. New Finnish growth references for children and adolescents aged 0 to 20 years: length/height-for-age, weight-for-length/height, and body mass index-for-age. Ann Med. (2011) 43:235–48. doi: 10.3109/07853890.2010.515603
30. Tenhola S, Halonen P, Jääskeläinen J, Voutilainen R. Serum markers of GH and insulin action in 12-year-old children born small for gestational age. Eur J Endocrinol. (2005) 152:335–40. doi: 10.1530/eje.1.01869
31. Tenhola S, Turpeinen U, Halonen P, Hämäläinen E, Voutilainen R. Association of serum lipid concentrations, insulin resistance index and catch-up growth with serum cortisol/cortisone ratio by liquid chromatography tandem mass spectrometry in children born small for gestational age. Pediatr Res. (2005) 58:467–71. doi: 10.1203/01.pdr.0000176908.93031.97
32. Tenhola S, Todorova B, Jääskeläinen J, Jänne OA, Raivio T, Voutilainen R. Serum glucocorticoids and adiponectin associate with insulin resistance in children born small for gestational age. Eur J Endocrinol. (2010) 162:551–77. doi: 10.1530/EJE-09-1003
33. Le Roux CW, Sivakumaran S, Alaghband-Zadeh J, Dhillo W, Kong WM, Wheeler MJ. Free cortisol index as a surrogate marker for serum free cortisol. Ann Clin Biochem. (2002) 39(Pt 4):406–8. doi: 10.1258/000456302760042182
34. Muniyappa R, Lee S, Chen H, Quon MJ. Current approaches for assessing insulin sensitivity and resistance in vivo: advantages, limitations, and appropriate usage. Am J Physiol Endocrinol Metab. (2008) 294:15. doi: 10.1152/ajpendo.00645.2007
35. Seppä S, Tenhola S, Voutilainen R. Fibroblast growth factor 21, adiponectin and irisin as markers of unfavorable metabolic features in 12-year-old children. J Endocr Soc. (2019) 3:825–37. doi: 10.1210/js.2018-00399
36. Prats-Puig A, Mas-Parareda M, Riera-Pérez E, González-Forcadell D, Mier C, Mallol-Guisset M, et al. Carboxylation of osteocalcin affects its association with metabolic parameters in healthy children. Diabetes Care. (2010) 33:661–3. doi: 10.2337/dc09-1837
37. Lu C, Ivaska KK, Alen M, Wang Q, Törmäkangas T, Xu L, et al. Serum osteocalcin is not associated with glucose but is inversely associated with leptin across generations of non-diabetic women. J Clin Endocrinol Metab. (2012) 97:4106–14. doi: 10.1210/jc.2012-2045
38. Tubic B, Magnusson P, Mårild S, Leu M, Schwetz V, Sioen I, et al. Different osteocalcin forms, markers of metabolic syndrome and anthropometric measures in children within the IDEFICS cohort. Bone. (2016) 84:230–6. doi: 10.1016/j.bone.2016.01.008
39. Giudici KV, Kindler JM, Martin BR, Laing EM, McCabe GP, McCabe LD, et al. Associations among osteocalcin, leptin and metabolic health in children ages 9-13 years in the United States. Nutr Metab. (2017) 14:9. doi: 10.1186/s12986-017-0171-9
40. Fernández-Real JM, Izquierdo M, Ortega F, Gorostiaga E, Gómez-Ambrosi J, Moreno-Navarrete JM, et al. The relationship of serum osteocalcin concentration to insulin secretion, sensitivity, and disposal with hypocaloric diet and resistance training. J Clin Endocrinol Metab. (2009) 94:237–45. doi: 10.1210/jc.2008-0270
41. Redondo MJ, Shirkey BA, Fraga DW, Gaber AO, Sabek OM. Serum undercarboxylated osteocalcin correlates with hemoglobin A1c in children with recently diagnosed pediatric diabetes. Pediatr Diabetes. (2017) 8:869–73. doi: 10.1111/pedi.12501
42. Jürimäe J, Lätt E, Remmel L, Purge P, Tillmann V. Longitudinal changes in bone-testis axis and their associations with insulin resistance in 11- to 12-year-old boys. Bone. (2018) 108:115–20. doi: 10.1016/j.bone.2018.01.005
43. Giudici KV, Fisberg RM, Marchioni DM, Peters BS, Martini LA. Crosstalk between bone and fat tissue: associations between vitamin d, osteocalcin, adipokines, and markers of glucose metabolism among adolescents. J Am Coll Nutr. (2017) 36:273–80. doi: 10.1080/07315724.2016.1274923
44. Jürimäe J, Lätt E, Mäestu J, Saar M, Purge P, Maasalu K, et al. Osteocalcin is inversely associated with adiposity and leptin in adolescent boys. J Pediatr Endocrinol Metab. (2015) 28:571–7. doi: 10.1515/jpem-2014-0432
45. Flemming GMC, Petzol S, Meigen C, Körner A, Kiess W, Kratzsch J. Is circulating osteocalcin related to adipokines and overweight/obesity in children and adolescents? Exp Clin Endocrinol Diabetes. (2012) 120:383–7. doi: 10.1055/s-0032-1306287
46. Wedrychowicz A, Sztefko K, Starzyk JB. Sclerostin and its association with insulin resistance in children and adolescents. Bone. (2019) 120:232–8. doi: 10.1016/j.bone.2018.07.021
47. Prats-Puig A, Osiniri I, Soriano-Rodríguez P, Carreras-Badosa G, Buñuel-Álvarez JC, Vila-Pablos C, et al. Undercarboxylated osteocalcin relates to cardiovascular risk markers in offspring of families with metabolic syndrome. Atherosclerosis. (2014) 233:272–7. doi: 10.1016/j.atherosclerosis.2014.01.002
48. Millar SA, Patel H, Anderson SI, England TJ, O'Sullivan SE. Osteocalcin, vascular calcification, and atherosclerosis: a systematic review and meta-analysis. Front Endocrinol. (2017) 8:183. doi: 10.3389/fendo.2017.00183
49. Gravenstein KS, Napora JK, Short RG, Ramachandran R, Carlson OD, Metter EJ, et al. Cross-sectional evidence of a signaling pathway from bone homeostasis to glucose metabolism. J Clin Endocrinol Metab. (2011) 96:E884–90. doi: 10.1210/jc.2010-2589
50. Mora S, Pitukcheewanont P, Kaufman FR, Nelson JC, Gilsanz V. Biochemical markers of bone turnover and the volume and the density of bone in children at different stages of sexual development. J Bone Miner Res. (1999) 14:1664–71. doi: 10.1359/jbmr.1999.14.10.1664
51. Szulc P, Seeman E, Delmas PD. Biochemical measurements of bone turnover in children and adolescents. Osteoporos Int. (2000) 11:281–94. doi: 10.1007/s001980070116
52. Gracia-Marco L, Vicente-Rodríguez G, Valtueña J, Rey-López JP, Díaz Martínez AE, Mesana MI, et al. Bone mass and bone metabolism markers during adolescence: the HELENA study. Horm Res Paediatr. (2010) 74:339–50. doi: 10.1159/000314965
53. Matar M, Al-Shaar L, Maalouf J, Nabulsi M, Arabi A, Choucair M, et al. The relationship between calciotropic hormones, IGF-1, and bone mass across pubertal stages. J Clin Endocrinol Metab. (2016) 101:4860–70. doi: 10.1210/jc.2016-3071
54. Yilmaz D, Ersoy B, Bilgin E, Gumuser G, Onur E, Pinar ED. Bone mineral density in girls and boys at different pubertal stages: relation with gonadal steroids, bone formation markers, and growth parameters. J Bone Miner Metab. (2005) 23:476–82. doi: 10.1007/s00774-005-0631-6
55. Oury F, Sumara G, Sumara O, Ferron M, Chang H, Smith CE, et al. Endocrine regulation of male fertility by the skeleton. Cell. (2011) 144:796–809. doi: 10.1016/j.cell.2011.02.004
56. Kirmani S, Atkinson EJ, Melton LJ III, Riggs BL, Amin S, Khosla S. Relationship of testosterone and osteocalcin levels during growth. J Bone Miner Res. (2011) 26:2212–6. doi: 10.1002/jbmr.421
57. Kannisto S, Korppi M, Arikoski P, Remes K, Voutilainen R. Biochemical markers of bone metabolism in relation to adrenocortical and growth suppression during the initiation phase of inhaled steroid therapy. Pediatr Res. (2002) 52:258–62. doi: 10.1203/00006450-200208000-00019
58. Togher KL, O'Keeffe MM, Khashan AS, Gutierrez H, Kenny LC, O'Keeffe GW. Epigenetic regulation of the placental HSD11B2 barrier and its role as a critical regulator of fetal development. Epigenetics. (2014) 9:816–22. doi: 10.4161/epi.28703
59. Houang M, Morineau G, le Bouc Y, Fiet J, Gourmelen M. The cortisol-cortisone shuttle in children born with intrauterine growth retardation. Pediatr Res. (1999) 46:189–93. doi: 10.1203/00006450-199908000-00011
60. Dötsch J, Hohenberger I, Peter M, Sippell W, Dörr HG. Evidence for change of 11beta-hydroxysteroid dehydrogenase activity during infancy and childhood. Pediatr Res. (2000) 48:697–700. doi: 10.1203/00006450-200011000-00024
61. McTernan CL, Draper N, Nicholson H, Chalder SM, Driver P, Hewison M, et al. Reduced placental 11beta-hydroxysteroid dehydrogenase type 2 mRNA levels in human pregnancies complicated by intrauterine growth restriction: an analysis of possible mechanisms. J Clin Endocrinol Metab. (2001) 86:4979–83. doi: 10.1210/jcem.86.10.7893
62. Schoof E, Girstl M, Frobenius W, Kirschbaum M, Dörr HG, Rascher W, et al. Decreased gene expression of 11beta-hydroxysteroid dehydrogenase type 2 and 15-hydroxyprostaglandin dehydrogenase in human placenta of patients with preeclampsia. J Clin Endocrinol Metab. (2001) 86:1313–7. doi: 10.1210/jcem.86.3.7311
63. Levy-Marchal C, Arslanian S, Cutfield W, Sinaiko A, Druet C, Loredana Marcovecchio M, et al. Insulin resistance in children: consensus, perspective, and future directions. J Clin Endocrinol Metab. (2010) 95:5189–98. doi: 10.1210/jc.2010-1047
Keywords: bone, cortisol, child, insulin, glucocorticoid, glucose metabolism, growth spurt, puberty
Citation: Seppä S, Tenhola S and Voutilainen R (2019) Association of Serum Total Osteocalcin Concentrations With Endogenous Glucocorticoids and Insulin Sensitivity Markers in 12-Year-Old Children: A Cross-Sectional Study. Front. Endocrinol. 10:798. doi: 10.3389/fendo.2019.00798
Received: 13 July 2019; Accepted: 01 November 2019;
Published: 19 November 2019.
Edited by:
Madhusmita Misra, Harvard Medical School, United StatesReviewed by:
Maurizio Delvecchio, Giovanni XXIII Children's Hospital, ItalyKelly Virecoulon Giudici, Université Toulouse III Paul Sabatier, France
Copyright © 2019 Seppä, Tenhola and Voutilainen. This is an open-access article distributed under the terms of the Creative Commons Attribution License (CC BY). The use, distribution or reproduction in other forums is permitted, provided the original author(s) and the copyright owner(s) are credited and that the original publication in this journal is cited, in accordance with accepted academic practice. No use, distribution or reproduction is permitted which does not comply with these terms.
*Correspondence: Satu Seppä, c2F0dS5zZXBwYUBrdWguZmk=