 Francesca Cirillo1†Cecilia Catellani1†Pietro Lazzeroni1Chiara Sartori1Alessia Nicoli2Sergio Amarri1Giovanni Battista La Sala2
 Maria Elisabeth Street1*
- 1Division of Pediatric Endocrinology and Diabetology, Department of Mother and Child, Azienda USL–IRCCS di Reggio Emilia, Reggio Emilia, Italy
- 2Center of Reproductive Medicine and Surgery, Department Mother and Child, Azienda USL–IRCCS di Reggio Emilia, Reggio Emilia, Italy
Objective: MicroRNAs (miRNAs) are gene expression regulators. Altered miRNA levels are associated with diabetes, insulin resistance, and inflammation. Insulin resistance and inflammation are both features of Polycystic ovary syndrome (PCOS). The aim of this study was first to assess differences in selected miRNAs (miR-146a, miR-155, miR-320, miR-370, miR-486), involved in insulin sensitivity regulation and inflammation, in women with or without PCOS. Second, to investigate relationships among these miRNAs, insulin, High mobility group box 1 (HMGB1), and IL-6 in follicular fluid (FF), serum 17-beta estradiol (E2), and the number of dominant follicles.
Methods: Thirty PCOS and thirty-six non-PCOS women undergoing in vitro fertilization were enrolled. RNA from granulosa cells (GC) and FF was extracted and the specific miRNAs were evaluated using qRT-PCR. HMGB1, insulin, and IL-6 in FF, and serum E2 were assayed using specific kits.
Results: MiR-146a, miR-155, miR-486 were upregulated and miR-320 and miR-370 were downregulated in GC from the PCOS patients. In FF, miR-146a, miR-155, and miR-486 showed lower levels in PCOS, whereas miR-320 and miR-370 showed an opposite trend but no significant changes were observed. These miRNAs showed relationships with Body Mass Index (BMI), age, E2, number of dominant follicles, insulin, and HMGB1.
Conclusion: In conclusion, the miRNAs analyzed showed changes in PCOS ovaries and had relationships with indices of inflammation and insulin sensitivity within the ovary, providing evidence for new regulatory mechanisms.
Introduction
Polycystic ovary syndrome (PCOS) is a common multifactorial and heterogeneous endocrine disorder affecting women of reproductive age (1). Although its etiology remains unclear, environmental, genetic and epi-genetic factors contribute to this disorder.
PCOS is characterized by hyperandrogenism, ovulatory dysfunction, and polycystic ovarian morphology (1). Although insulin resistance (IR) is not considered as a diagnostic criterion, it underpins the disease in 50–70% of women independent of Body Mass Index (BMI) (2). Furthermore, insulin sensitizing treatments, as metformin, have often proved to be effective (3) and in recent years inositol derivatives (4, 5) and alpha lipoic acid have shown positive effects besides being safe (6, 7). The mechanisms related with the regulation of insulin sensitivity at the ovarian level are not fully elucidated yet. Definitely an important role has been described relative to Peroxisome proliferator-activated receptors (PPARs) (8–10).
In recent years, it has been reported that PCOS is associated with systemic low-grade inflammation (LGI) (11–14). Recent evidence reports that intrafollicular inflammatory mediators are enhanced in periovulatory follicles of PCOS women (15), and chronic LGI might be a precursor of ovarian dysfunction in PCOS. In addition, High mobility group box 1 (HMGB1), a small protein with cytokine activity (16), is increased in follicular fluid (FF) from ovaries of PCOS women (17) in relationship with decreased Cystic fibrosis transmembrane conductance regulator (CFTR) expression in granulosa cells (17), as previously described in Cystic Fibrosis (CF) (18, 19). Serum HMGB1 levels have been reported to be higher in PCOS women with IR (17, 20).
MicroRNAs (miRNAs) represent a recent chapter of epigenetics and have become useful for the comprehension of multiple diseases offering new insights into the molecular mechanisms. They consist in endogenous small single stranded non-coding RNAs, ~22 nucleotides long, which act as post transcriptional regulators. A single miRNA can act on several hundreds of target mRNAs and each mRNA can be the target of many miRNAs (21, 22). Upon biosynthesis, they can be released into the extracellular space and appear remarkably stable in various bodily fluid such as FF, which reflects the secretory and metabolic activities of oocytes and follicle niche (23). Therefore, altered levels of miRNAs could affect/reflect ovarian insulin sensitivity, hormone synthesis, and inflammation. However, few studies, and with contradictory results, have been conducted in humans relative to miRNAs in the different ovarian compartments (24).
We selected miR-146a, miR-155, miR-320, miR-370, and miR-486 involved both in insulin sensitivity and in chronic inflammation and regulated in serum of CF patients at onset of CF related diabetes (25).
MiR-146a is increased in vitro under inflammatory stimulation (26), and is involved in insulin resistance in type 2 diabetic patients (27). MiR-155 has a well-documented role in autoimmune and other chronic inflammatory diseases (28–31). Furthermore, miR-155 has been demonstrated to regulate insulin sensitivity in vitro (32) and in vivo in mice (32, 33). MiR-320 is currently considered as a potential target for type 2 diabetes mellitus therapy (34, 35) since it regulates the expression of phosphoinositide-3-kinase (PI3K), a downstream mediator of insulin signaling. Moreover, miR-320 regulates the expression of NOD2 a cytosolic receptor involved in the proinflammatory cascades in chronic inflammatory bowel diseases (36). MiR-370 is a modulator of IRS1 expression, a scaffold protein involved in the insulin pathway (37, 38). MiR-486 directly targets mediators of insulin-like growth factor (IGF) signaling including IGF-I, IGF-I receptor (IGF1R), and PI3K regulatory subunit 1 (alpha) (PIK3R1) and is reduced in plasma of diabetic patients (39, 40).
The aim of this study was first to assess differences in the selected miRNAs, in women with or without PCOS undergoing in vitro fertilization (IVF); second to investigate relationships among these miRNAs, HMGB1, insulin, IL6 in FF, and 17-beta estradiol (E2) in serum.
Subjects and Methods
Patients
In the present study we enrolled 30 female patients with PCOS and 36 regularly cycling women as controls (CTRL) matched for age and BMI as previously described (17). All subjects were enrolled at the time of oocyte retrieval at IVF center of our Institution. Details concerning the hormonal stimulation protocol are specified below. PCOS patients (CA: 34.43 ± 0.84 yr; BMI: 25.92 ± 132 0.99 kg/m2; hirsute N.12; with amenorrhea N.2, oligomenorrhoea N.13, regular cycles N.15) were diagnosed according to the Rotterdam ESHRE/ASRM 2003 criteria: presence of amenorrhea or oligomenorrhoea (<10 cycles/year), polycystic ovaries on ultrasonography, and hirsutism which was assessed according to Ferriman–Gallwey score (>8) (41). CTRL subjects (CA: 35.72 ± 0.55 yr; BMI: 24.08 ± 0.79 kg/m2) were women undergoing IVF because of tubal or unknown infertility causes, with normal endocrine exams and regular menstrual cycles. Exclusion criteria were the presence of tumors, endometriosis, coeliac disease, genetic or chronic diseases, Cushing syndrome, changes in thyroid function, hyperprolactinemia, and dysmorphisms. BMI was calculated as weight/height2 (kg/m2). All subjects were monitored by transvaginal ultrasonography (US) before oocyte retrieval according to the standard protocol in use at our Institution and the number of dominant follicles (diameter >17 mm) was recorded. All participants did not receive any additional treatment for at least 2 months before IVF, except for the ovarian stimulation therapy. Clinical details of PCOS and CTRL are reported in Table 1.
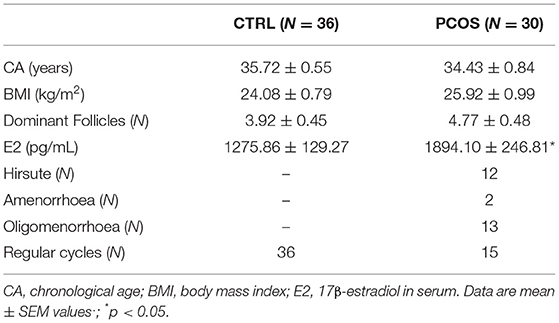
Table 1. Clinical features of subjects enrolled in the study.
Hormonal Stimulation
Ovarian hormonal stimulation was conducted according to a long luteal gonadotropin-releasing hormone (GnRH) agonist depot protocol in order to obtain ovarian downregulation in all patients. After biochemical and instrumental confirmation of complete down-regulation (E2 concentrations <30 pg/ml and endometrial thickness ≤5 mm at transvaginal ultrasonography), recombinant FSH (rFSH) was administrated using a starting dose (first 5 days) tailored according to the patient's age and antral follicle count. From day 6 of ovarian stimulation, the dose of rFSH was adjusted according to ovarian response (monitored by transvaginal US and serum E2 concentrations). In case of appearance of leading follicles (of 17 mm and above), ovulation was triggered by injection of 10,000 IU human chorionic gonadotropin (hCG), 24 h after the last injection of rFSH, and 36 h later oocyte retrieval was performed by US-guided transvaginal aspiration.
Collection of Follicular Fluid Samples and Granulosa Cell Isolation
FF was aspirated from follicles (14–22 mm in diameter) during the oocyte retrieval and was processed immediately after oocyte pickup. FF samples were centrifuged for 10 min at 1,500 × g at room temperature and then for 10 min at 3,000 × g at room temperature to completely remove red blood cells or detriments, then stored at −80°C for subsequent analyses. GC were isolated from the pellet obtained after the first centrifugation step which was resuspended in 10 mL of a 1:1 ratio mixture of Medium 199 (Sigma Aldrich, Inc., USA) and Hanks' balanced salt solution (Euroclone S.p.A., Italy). Then it was slowly layered on 10 mL of Lymphocyte separation medium (Ficoll-Paque Plus, GE Healthcare, UK) and centrifuged at 600 × g for 30 min at room temperature. The granulosa cells, collected at the interface, were drawn off using a sterile Pasteur pipette, then washed three times with Hanks' balanced salt solution and stored at −20°C until the RNA extraction.
RNA Isolation and Reverse Transcription
Total RNA enriched in small RNAs was extracted from GC lysates and FF using the miRVana™ PARIS miRNA isolation Kit (Thermo Fisher Scientific, USA) according to the manufacturer's protocol. The RNA concentration of all samples was quantified by NanoDrop 1000 (Thermo Fisher Scientific, USA). The miRNAs from GC lysates and FF were reverse transcribed using the TaqMan® MicroRNA Reverse Transcription Kit (Thermo Fisher Scientific, USA) using a miRNA primer pool (see below) according to the manufacturer's protocol and the thermo-cycler T100 (Bio-Rad Laboratories, Inc., USA).
RT-qPCR
Quantitative reverse transcription PCR (RT-qPCR) was performed in real-time using specific TaqMan® probes 20x (Thermo Fisher Scientific, USA) for hsa-miR146a (assay ID 000468), hsa-miR155 (assay ID 002623), hsa-miR320-3p (assay ID 002277), hsa-miR370-3p (assay ID 002275), hsa-miR486-5p (assay ID 478128_mir), U6 snRNA (assay ID 001973), and RNU48 (assay ID 001006) for the amplification of the endogenous controls. The small nuclear RNAs U6 and U48 were selected as reference genes. Experiments were performed in triplicate in optical 96-well reaction plates on the CFX96 Touch™ (Bio-Rad Laboratories, Inc. USA) thermo-cycler with TaqMan™ Universal Master Mix II, no UNG. Expression levels of the selected miRNA genes were normalized with respect to snU6 and snU48 expression levels in the same sample. Melting curves were analyzed to ensure that fluorescence signals reflected solely specific amplicons. The relative quantification analysis was determined using the 2−ΔCt method (42).
Biochemical Assays
HMGB1 concentrations in FF were assayed using a specific research ELISA kit (HMGB1 ELISA, Tecan Trading AG, Switzerland). The intra-assay coefficient of variation (CV) was 5.4%, and the inter-assay CV was 8.2%. The sensitivity of the method was <0.15 ng/mL. Insulin was measured in FF using a specific ultrasensitive ELISA kit (Mercodia Ultrasensitive Insulin ELISA, Mercodia AB, Sweden); the intra-assay CV was 6.5 and the inter-assay CV 7.1%. IL-6 was quantified in FF using an ultrasensitive ELISA method (Human IL6 Quantikine ELISA kit, R&D Systems, Inc. USA) according to the manufacturer's protocol; the intra-assay CV was 3.8% and the inter-assay CV 9.9%. The sensitivity of the method was <0.11 pg/mL. E2 concentrations, obtained from venous blood samples taken the same day as oocyte retrieval, were assayed with the ADVIA Centaur® Enhanced Estradiol Assay (Siemens AG 2010 2018, Germany), an automated, monoclonal, competitive, chemiluminescent immunoassay.
miRNA-Target Gene Analysis
A list of experimentally validated direct target genes for each miRNA was obtained from an in silico analysis conducted on miRTarBase database (http://mirtarbase.mbc.nctu.edu.tw/php/index.php) in order to have confirmed that the miRNAs selected were tightly connected with the regulation of insulin sensitivity. Among the experimentally validated direct target genes of the analyzed miRNAs, those documented in the Literature to be related with insulin sensitivity have been reported in Table 2.
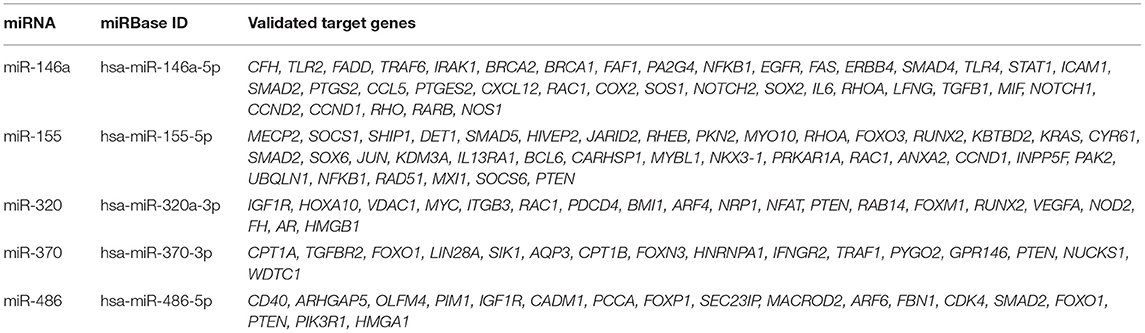
Table 2. miRNAs and their validated target genes related with insulin sensitivity obtained using miRTarBase.
Statistical Analysis
Standard statistical analysis was performed using the statistical package SPSS 24.0 for Windows (IBM Analytics, IBM Corporation 1994, 2017, USA) as appropriate. The Mann-Whitney U test for independent samples was used to study differences in miRNA levels between PCOS and CTRL. Pearson's linear regression or Spearman's rank were used for correlation analysis to investigate relationships among miRNAs, HMGB1, insulin, number of dominant follicles, E2, CA, BMI as appropriate. Only significant data are reported in the text. MiRNAs showing a p ≤ 0.05 were considered as differentially expressed. Data relative to miRNA are expressed as median and 25th-75th percentile, unless otherwise stated.
Ethical Approval
The study was approved by the Ethical Committee of Reggio Emilia (Prot. No. PCOS2_15_17). All participants gave written informed consent in accordance with the Declaration of Helsinki.
Results
Analysis of miRNAs Levels in Granulosa Cells and Follicular Fluids
Changes in miRNAs expression levels from GC of PCOS ovaries with respect to CTRL are reported in Figure 1A. MiR-146a and miR-155 were significantly upregulated, whereas miR-320 and miR-370 were downregulated in PCOS. MiR-486 did not differ significantly between the two groups but its expression level was increased in PCOS.
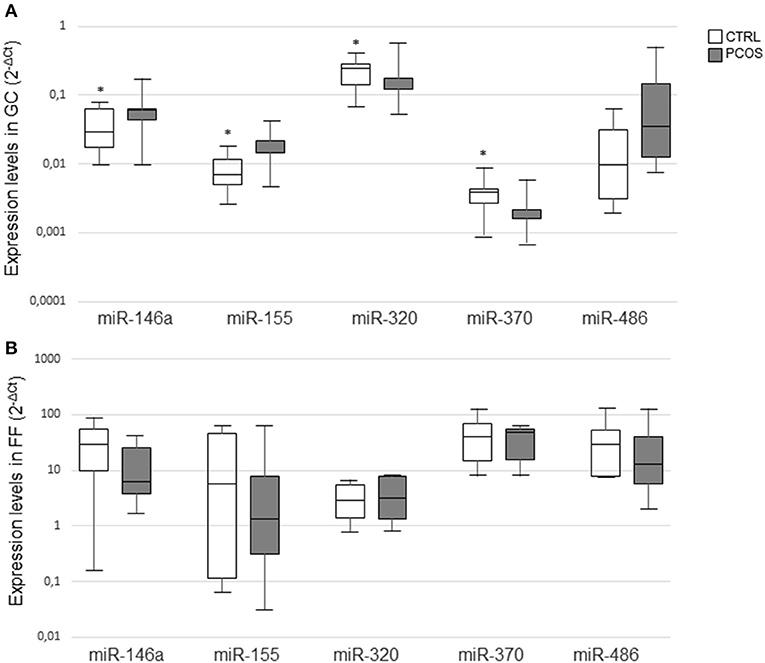
Figure 1. MiRNA expression levels in granulosa cells (A) and follicular fluids (B) from CTRL and PCOS. Results in box plots are shown as normalized expression (2−ΔCt) and the band inside the box is the median. The upper and lower whiskers represent the maximum and minimum values among data respectively. Data were compared using the Mann–Whitney U-test (*P ≤ 0.05).
Changes in miRNAs from FF are represented in Figure 1B. In detail, miR-146a, miR-155, and miR-486 showed a trend to lower expression levels in PCOS, whereas miR-320 and miR-370 levels exhibited an opposite trend. However, none of these changes was statistically significant.
Overall, levels were lower in FF compared with those detected in GC lysates.
Correlation Analyses in GC and in FF
Correlations Among miRNAs in GC
Within GC, significant correlations of miRNAs with other miRNAs are reported in Table 3.
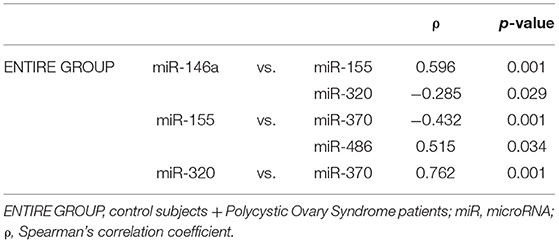
Table 3. Significant correlations among miRNAs in granulosa cells in the entire group.
In the entire group of subjects (PCOS and CTRL) miR-146a correlated positively with miR-155 (ρ = 0.596; P < 0.001) and negatively with miR-320 (ρ = −0.285; P = 0.029). MiR-155 correlated with miR-370 (ρ = −0.432; P = 0.001) and miR-486 (ρ = 0.515; P = 0.034). MiR-320 correlated miR-370 (ρ = 0.762; P < 0.001).
In the CTRL group, miR-320 correlated with miR-370 (ρ = 0.557; P = 0.002).
In PCOS, miR-146a correlated with miR-155 (ρ = 0.562; P = 0.001), and miR-320 with miR-370 (ρ = 0.491; P = 0.006).
Correlations of miRNAs in GC With Clinical Parameters and Biochemical Data
In the entire group of subjects (PCOS and CTRL) miR-486 correlated with BMI (R = −0.671; P = 0.003) (Figure 2A), and both miR-155 (R = −0.259; P = 0.047) and miR-370 (R = 0.260; P = 0.047) correlated with the number of dominant follicles. MiR-155 correlated negatively with HMGB1 (R = −0.258; P = 0.048) in FF (Figure 2B). MiR-155 (R = 0.411; P = 0.001), miR-320 (R = −0.406; P = 0.001), and miR-370 (R = −0.510; P < 0.001) correlated all with insulin concentrations. MiR-320 correlated with serum E2 concentrations (R = 0.272; P = 0.037) (Figure 2C).
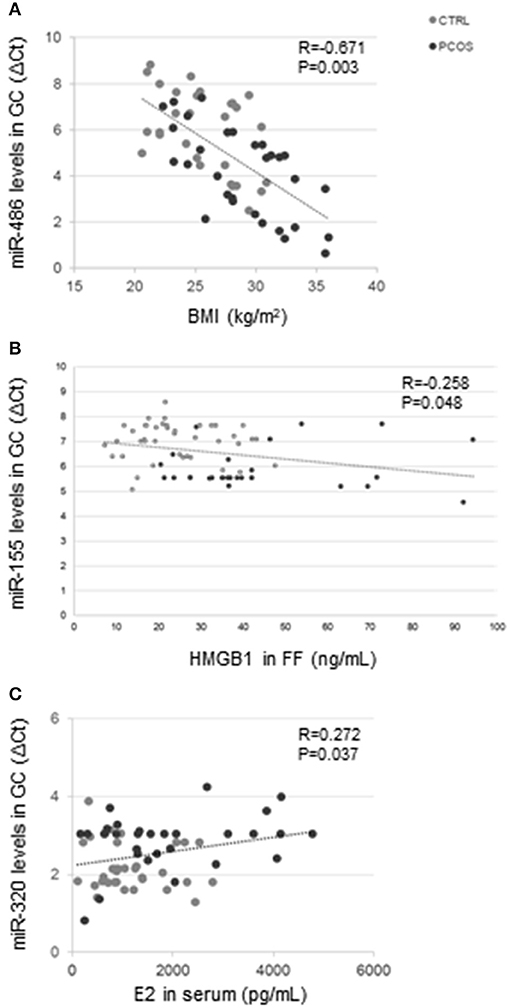
Figure 2. Correlation analysis in the entire group. MiR-486 levels in GC correlated with BMI (R = −0.671; P = 0.003) (A). MiR-155 levels in GC correlated with HMGB1 concentrations (R = −0.258; P = 0.048) (B), and miR-320 levels in GC correlated with serum E2 concentrations (R = 0.272; P = 0.037) (C).
In PCOS, miR-486 correlated both with chronological age (R = −0.676; P = 0.032), BMI (R = −0.644; P = 0.045), and serum E2 concentrations (R = 0.741; P = 0.014). MiR-146a correlated with HMGB1 (R = 0.333; P = 0.072) in FF.
Correlations Among miRNAs in FF
In the entire group of subjects miR-155 positively correlated with miR-370 (R = 0.611; P = 0.027). MiR-320 correlated both with miR-370 (R = 0.727; P = 0.005) and miR-486 (R = 0.827; P = 0.001); miR-370 correlated with miR-486 (R = 0.781; P = 0.002).
In the CTRL group miR-370 correlated both with miR-155 (R = 0.910; P = 0.032), and miR-486 (R = 0.985; P = 0.002).
In PCOS, miR-320 correlated both with miR-370 (R = 0.800; P = 0.017) and miR-486 (R = 0.956; P = 0.001). MiR-486 and miR-370 were also related (R = 0.740; P = 0.036).
Correlations of miRNAs With Clinical Parameters in FF
In the entire group, miR-155 correlated with BMI (R = 0.366; P = 0.039).
In the CTRL group, miR-155 correlated both with CA (R = 0.512; P = 0.030) and BMI (R = 0.492; P = 0.038).
In PCOS, miR-486 correlated with E2 (R = −0.661; P = 0.038), miR-146a with insulin concentrations (R = 0.548; P = 0.042), and miR-155 correlated with IL6 (R = −0.587; P = 0.027).
Discussion
This study showed an upregulation of miR-146a, miR-155, miR-486 levels and a downregulation of miR-320 and miR-370 levels in GC from PCOS patients compared with a CTRL population. Although no significant changes were found in FF, miR-146a, miR-155, and miR-486 showed lower levels in PCOS, whereas miR-320 and miR-370 levels exhibited an opposite trend. These miRNAs showed relationships with BMI, serum E2 concentrations, number of dominant follicles, insulin, and HMGB1 concentrations in FF.
We are aware that this study has some limitations. In particular, the fact that all analyses were performed after ovarian hormonal stimulation that might induce changes; however, both PCOS and CTRL subjects underwent the same stimulation protocol, thus differences between the two groups must be considered as such. Furthermore, for ethical reasons, GC and FF can be easy to obtain as a secondary product during IVF procedures.
The finding of increased miR-146a in GC from PCOS is consistent with reports under conditions of insulin resistance in pancreatic β-cells after exposure to saturated fatty acids (43) and in serum from type 2 diabetic patients (44). In the miRTarBase database it is reported that about 54% of the experimentally validated direct target genes for miR-146a are related with insulin sensitivity (Table 2). A downregulation of miR-146a has been associated with increased protein-tyrosine phosphatase non-receptor-type 1 (PTPN1), an inhibitor of the insulin receptor (45). As we previously described reduced insulin content in FF in PCOS (17), it could be speculated that insulin uptake might be enhanced in GC in PCOS women, due to enhanced insulin sensitivity possibly associated with reduced PTPN1. Interestingly, miR-146a upregulation was reported in patients with premature ovarian failure, and associated with enhanced ovarian GC apoptosis (46). This could be further supported by our finding of a positive correlation between miR-146a and HMGB1, as HMGB1 has been described to be released during apoptosis (47). Furthermore, we previously described relationships of HMGB1 with glucose metabolism and inflammation both in cystic fibrosis and PCOS (17, 18). Interestingly, miR-146a was found to be positively correlated also with miR-155. Both these miRNAs are recognized as possible regulators of the FOXO1 gene, a key downstream mediator of the insulin signaling cascade (25).
MiR-155 is considered a multifunctional miRNA and is strongly related with inflammation, insulin resistance, obesity, and steroidogenesis (33, 48, 49) reflecting the main features of PCOS. Furthermore, following in-silico analysis using miRTarBase, about 21% of experimentally validated direct target genes of miR-155 are related with insulin sensitivity (see Table 2). In this study miR-155 was found upregulated in PCOS and correlated with both HMGB1 and insulin concentrations in FF, supporting a possible involvement of miR-155 in the regulation of inflammation and ovarian insulin sensitivity. As mentioned above, miR-155 is predicted to target the FOXO1 gene (25), which also controls genes involved in gluconeogenesis and adipogenesis, metabolic processes related with insulin sensitivity. The correlation with BMI, CA and IL-6 is in agreement with inflammation increasing with BMI and age (50, 51). The correlations with other miRNAs confirm the existence of a network of miRNAs regulating a network of corresponding genes involving in the regulation of insulin sensitivity within the ovary.
MiR-320 and miR-370 were decreased in GC from PCOS and correlated with insulin concentrations. In serum these miRNAs are known to regulate insulin sensitivity (38, 52). Within miRTarBase database, ~14–43% of validated target genes for these miRNAs are found among genes known to regulate insulin sensitivity (see Table 2). Our data suggested also that they play a role in regulating insulin sensitivity within the ovary. The relationships of miR-320 with E2 and of miR-370 with the number of dominant follicles suggests a role in ovarian function. Interestingly, miR-320 and miR-370 have been described to regulate mediators downstream the follicle-stimulating hormone (FSH) receptor that plays a key role in folliculogenesis, and oocyte maturation (53). Some of these mediators are shared by the insulin receptor signaling pathway, therefore, a cross talk between the two receptors could be hypothesized.
MiR-320 is currently considered as a promising target for the treatment of type-2 diabetes mellitus (34) and regulates the expression levels of the p85 subunit of the PI3K which enhances adipocyte insulin sensitivity in obesity (52). Furthermore, miR-320 has been described to downregulate the expression of IGF-1 and its receptor (52, 54). MiR-370 has been shown to be a FOXO1 gene regulator in prostatic cancer cells (55, 56). It is also described as a regulator of Insulin receptor substrate 1 (IRS1), an insulin-signaling scaffold-protein (37, 38, 55).
MiR-486 has been previously described as a FOXO1 gene regulator and thus is related with insulin sensitivity (34, 57, 58). Furthermore, following in-silico analysis using miRTarBase, about 27% of validated target genes of miR-486 are related with insulin sensitivity (see Table 2). Changes were not significant in PCOS, although it was increased with respect to controls both in GC and in FF levels. MiR-486 was correlated with BMI, chronological age, and serum E2 concentration in PCOS, thus suggesting that aging and adiposity were related with ovarian function.
In conclusion, this study highlighted that some miRNAs are of importance in PCOS within the ovary, and show relationships with insulin levels, ovarian insulin sensitivity and inflammation. GC and FF, due to their close proximity with the oocyte and its nurse cells reflect the secretory and metabolic activities of oocytes and follicle niche. Overall this study offers new knowledge on PCOS within the ovarian microenvironment, providing a new insight into insulin sensitivity even if insulin per se and insulin sensitivity need to be further investigated and understood within the ovary.
Data Availability Statement
The datasets generated for this study are available on request to the corresponding author.
Ethics Statement
The studies involving human participants were reviewed and approved by the Local Ethical Committee of Reggio Emilia (Prot. No. PCOS2_15_17). Affiliation: AUSL-IRCCS di Reggio Emilia, Viale Umberto I n° 50, 42123, Reggio Emilia, Italy. The patients/participants provided their written informed consent to participate in this study.
Author Contributions
MS: conceptualization, supervision, and funding acquisition. MS, FC, CC, and GL: methodology. FC and CC: formal analysis and writing—original draft preparation. PL and CS: investigation. SA, MS, and AN: resources. PL, CS, FC, CC, and AN: data curation. MS and SA: visualization. FC, CC, MS, and AN: project administration.
Funding
We wish to thank Dr. S. Maramotti for her help. We are indebted to Laborest Italia S.r.l. for their unconditioned support to this research which allowed us to buy some reagents and to contribute to a salary. The funder had no role in the study design, data collection and analysis, decision to publish, or preparation of the manuscript.
Conflict of Interest
The authors declare that the research was conducted in the absence of any commercial or financial relationships that could be construed as a potential conflict of interest.
References
1. Azziz R, Carmina E, Chen Z, Dunaif A, Laven JS, Legro RS, et al. Polycystic ovary syndrome. Nat Rev Dis Primers. (2016) 11:16057. doi: 10.1038/nrdp.2016.57
2. Sirmans SM, Pate KA. Epidemiology, diagnosis, and management of polycystic ovary syndrome. Clin Epidemiol. (2014) 6:1–13. doi: 10.2147/CLEP.S37559
3. Lashen H. Role of metformin in the management of polycystic ovary syndrome. Ther Adv Endocrinol Metab. (2010) 1:117–28. doi: 10.1177/2042018810380215
4. Reyes-Muñoz E, Sathyapalan T, Rossetti P, Shah M, Long M, Buscema M, et al. Polycystic ovary syndrome: implication for drug metabolism on assisted reproductive techniques-A literature review. Adv Ther. (2018) 35:1805–15. doi: 10.1007/s12325-018-0810-1
5. Unfer V, Porcaro G. Updates on the myo-inositol plus D-chiro-inositol combined therapy in polycystic ovary syndrome. Expert Rev Clin Pharmacol. (2014) 7:623–31. doi: 10.1586/17512433.2014.925795
6. Genazzani AD, Shefer K, Della Casa D, Prati A, Napolitano A, Manzo A, et al. Modulatory effects of alpha-lipoic acid (ALA) administration on insulin sensitivity in obese PCOS patients. J Endocrinol Invest. (2018) 41:583–90. doi: 10.1007/s40618-017-0782-z
7. De Cicco S, Immediata V, Romualdi D, Policola C, Tropea A, Di Florio C, et al. Myoinositol combined with alpha-lipoic acid may improve the clinical and endocrine features of polycystic ovary syndrome through an insulin-independent action. Gynecol Endocrinol. (2017) 33:698–701. doi: 10.1080/09513590.2017.1313972
8. Vitale SG, Laganà AS, Nigro A, La Rosa VL, Rossetti P, Rapisarda AM, et al. Peroxisome proliferator-activated receptor modulation during metabolic diseases and cancers: master and minions. PPAR Res. (2016) 2016:6517313. doi: 10.1155/2016/6517313
9. Laganà AS, Vitale SG, Nigro A, Sofo V, Salmeri FM, Rossetti P, et al. Pleiotropic actions of peroxisome proliferator-activated receptors (PPARs) in dysregulated metabolic homeostasis, inflammation and cancer: current evidence and future perspectives. Int J Mol Sci. (2016) 17:999. doi: 10.3390/ijms17070999
10. Berger JP, Akiyama TE, Meinke PT. PPARs: therapeutic targets for metabolic disease. Trends Pharmacol Sci. (2005) 26:244–51. doi: 10.1016/j.tips.2005.03.003
11. Seyam E, Hasan M, Khalifa EM, Ramadan A, Hefzy E. Evaluation of tumor necrosis factor alpha serum level in obese and lean women with clomiphene citrate-resistant polycystic ovary disease. Gynecol Endocrinol. (2017) 33:892–8. doi: 10.1080/09513590.2017.1320383
12. Peng Z, Sun Y, Lv X, Zhang H, Liu C, Dai S. Interleukin-6 levels in women with polycystic ovary syndrome: a systematic review and meta-analysis. PLoS ONE. (2016) 5:e0148531. doi: 10.1371/journal.pone.0148531
13. Boulman N, Levy Y, Leiba R, Shachar S, Linn R, Zinder O, et al. Increased C-reactive protein levels in the polycystic ovary syndrome: a marker of cardiovascular disease. J Clin Endocrinol Metab. (2004) 89:2160–5. doi: 10.1210/jc.2003-031096
14. Kelly CC, Lyall H, Petrie JR, Gould GW, Connell JM, Sattar N. Low grade chronic inflammation in women with polycystic ovarian syndrome. J Clin Endocrinol Metab. (2001) 86:2453–5. doi: 10.1210/jcem.86.6.7580
15. Adams J, Liu Z, Ren YA, Wun WS, Zhou W, Kenigsberg S, et al. Enhanced inflammatory transcriptome in the granulosa cells of women with polycystic ovarian syndrome. J Clin Endocrinol Metab. (2016) 101:3459–68. doi: 10.1210/jc.2015-4275
16. Luan ZG, Zhang H, Ma XC, Zhang C, Guo RX. Role of high-mobility group box 1 protein in the pathogenesis of intestinal barrier injury in rats with severe acute pancreatitis. Pancreas. (2010) 39:216–23. doi: 10.1097/MPA.0b013e3181bab5c5
17. Cirillo F, Catellani C, Sartori C, Lazzeroni P, Morini D, Nicoli A, et al. CFTR and FOXO1 gene expression are reduced and High Mobility Group Box 1 (HMGB1) is increased in the ovaries and serum of women with Polycystic Ovarian Syndrome. Gynecol Endocrinol. (2019) 35: 842–46. doi: 10.1080/09513590.2019.1599349
18. Montanini L, Cirillo F, Smerieri A, Pisi G, Giardino I, d'Apolito M, et al. HMGB1 is increased by CFTR loss of function, is lowered by insulin, and increases in vivo at onset of CFRD. J Clin Endocrinol Metab. (2016) 101:1274–81. doi: 10.1210/jc.2015-3730
19. Smerieri A, Montanini L, Maiuri L, Bernasconi S, Street ME. FOXO1 content is reduced in cystic fibrosis and increases with IGF-I treatment. Int J Mol Sci. (2014) 15:18000–22. doi: 10.3390/ijms151018000
20. Wang H, Qu H, Deng H. Plasma HMGB-1 levels in subjects with obesity and type 2 diabetes: a cross-sectional study in China. PLoS ONE. (2015) 10:e0136564. doi: 10.1371/journal.pone.0136564
21. Cirillo F, Lazzeroni P, Catellani C, Sartori C, Amarri S, Street ME. MicroRNAs link chronic inflammation in childhood to growth impairment and insulin-resistance. Cytokine Growth Factor Rev. (2018) 39:1–18. doi: 10.1016/j.cytogfr.2017.12.004
22. Bartel DP. MicroRNAs: genomics, biogenesis, mechanism, and function. Cell. (2004) 116:281–97. doi: 10.1016/S0092-8674(04)00045-5
23. Cortez MA, Bueso-Ramos C, Ferdin J, Lopez-Berestein G, Sood AK, Calin GA. MicroRNAs in body fluids–the mix of hormones and biomarkers. Nat Rev Clin Oncol. (2011) 8:467–77. doi: 10.1038/nrclinonc.2011.76
24. Sørensen AE, Wissing ML, Englund AL, Dalgaard LT. MicroRNA species in follicular fluid associating with polycystic ovary syndrome and related intermediary phenotypes. J Clin Endocrinol Metab. (2016) 101:1579–89. doi: 10.1210/jc.2015-3588
25. Montanini L, Smerieri A, Gullì M, Cirillo F, Pisi G, Sartori C, et al. miR-146a, miR-155, miR-370, and miR-708 Are CFTR-dependent, predicted FOXO1 regulators and change at onset of CFRDs. J Clin Endocrinol Metab. (2016) 101:4955–63. doi: 10.1210/jc.2016-2431
26. Duan Q, Mao X, Xiao Y, Liu Z, Wang Y, Zhou H, et al. Super enhancers at the miR-146a and miR-155 genes contribute to self-regulation of inflammation. Biochim Biophys Acta. (2016) 1859:564–71. doi: 10.1016/j.bbagrm.2016.02.004
27. Balasubramanyam M, Aravind S, Gokulakrishnan K, Prabu P, Sathishkumar C, Ranjani H, et al. Impaired miR-146a expression links subclinical inflammation and insulin resistance in type 2 diabetes. Mol Cell Biochem. (2011) 1–2:197–205. doi: 10.1007/s11010-011-0727-3
28. Alivernini S, Gremese E, McSharry C, Tolusso B, Ferraccioli G, McInnes IB, et al. MicroRNA-155—at the critical interface of innate and adaptive immunity in arthritis. Front Immunol. (2017) 8:1932. doi: 10.3389/fimmu.2017.01932
29. Li X, Kong D, Chen H, Liu S, Hu H, Wu T, et al. miR-155 acts as an anti-inflammatory factor in atherosclerosis-associated foam cell formation by repressing calcium-regulated heat stable protein 1. Sci Rep. (2016) 6:21789. doi: 10.1038/srep21789
30. Huffaker TB, Hu R, Runtsch MC, Bake E, Chen X, Zhao J, et al. Epistasis between microRNAs 155 and 146a during T cell-mediated antitumor immunity. Cell Rep. (2012) 2:1697–709. doi: 10.1016/j.celrep.2012.10.025
31. O'Connell RM, Kahn D, Gibson WS, Round JL, Scholz RL, Chaudhuri AA, et al. MicroRNA-155 promotes autoimmune inflammation by enhancing inflammatory T cell development. Immunity. (2010) 33:607–19. doi: 10.1016/j.immuni.2010.09.009
32. Ying W, Riopel M, Bandyopadhyay G, Dong Y, Birmingham A, Seo JB, et al. Adipose tissue macrophage-derived exosomal miRNAs can modulate in vivo and in vitro insulin sensitivity. Cell. (2017) 171:372–384.e12. doi: 10.1016/j.cell.2017.08.035
33. Lin X, Qin Y, Jia J, Lin T, Lin X, Chen L, et al. MiR-155 enhances insulin sensitivity by coordinated regulation of multiple genes in mice. PLoS Genet. (2016) 12:e1006308. doi: 10.1371/journal.pgen.1006308
34. Flowers E, Aouizerat BE, Abbasi F, Lamendola C, Grove KM, Fukuoka Y, et al. Circulating microRNA-320a and microRNA-486 predict thiazolidinedione response: Moving towards precision health for diabetes prevention. Metabolism. (2015) 64:1051–9. doi: 10.1016/j.metabol.2015.05.013
35. Chakraborty C, Doss CG, Bandyopadhyay S, Agoramoorthy G. Influence of miRNA in insulin signaling pathway and insulin resistance: micro-molecules with a major role in type-2 diabetes. Wiley Interdiscip Rev RNA. (2014) 5:697–712. doi: 10.1002/wrna.1240
36. Pierdomenico M, Cesi V, Cucchiara S, Vitali R, Prete E, Costanzo M, et al. NOD2 is regulated by Mir-320 in physiological conditions but this control is altered in inflamed tissues of patients with inflammatory bowel disease. Inflamm Bowel Dis. (2016) 22:315–26. doi: 10.1097/MIB.0000000000000659
37. Fontés G, Ghislain J, Benterki I, Zarrouki B, Trudel D, Berthiaume Y, et al. The ΔF508 mutation in the cystic fibrosis transmembrane conductance regulator is associated with progressive insulin resistance and decreased functional β-cell mass in mice. Diabetes. (2015) 64:4112–22. doi: 10.2337/db14-0810
38. Chang KW, Chu TH, Gong NR, Chiang WF, Yang CC, Liu CJ, et al. miR-370 modulates insulin receptor substrate-1 expression and inhibits the tumor phenotypes of oral carcinoma. Oral Dis. (2013) 19:611–9. doi: 10.1111/odi.12046
39. Peng Y, Dai Y, Hitchcock C, Yang X, Kassis ES, Liu L, et al. Insulin growth factor signaling is regulated by microRNA-486, an underexpressed microRNA in lung cancer. Proc Natl Acad Sci USA. (2013) 110:15043–8. doi: 10.1073/pnas.1307107110
40. Williams MD, Mitchell GM. MicroRNAs in insulin resistance and obesity. Exp Diabetes Res. (2012) 484696. doi: 10.1155/2012/484696
41. Ferriman D, Gallwey JD. Clinical assessment of body hair growth in women. J Clin Endocrinol Metab. (1961) 21:1440–7. doi: 10.1210/jcem-21-11-1440
42. Pfaffl MW. A new mathematical model for relative quantification in real-time RT-PCR. Nucleic Acids Res. (2001) 29:e45. doi: 10.1093/nar/29.9.e45
43. Lovis P, Roggli E, Laybutt DR, Gattesco S, Yang JY, Widmann C, et al. Alterations in microRNA expression contribute to fatty acid-induced pancreatic beta-cell dysfunction. Diabetes. (2008) 57:2728–36. doi: 10.2337/db07-1252
44. Kong L, Zhu J, Han W, Jiang X, Xu M, Zhao Y, et al. Significance of serum microRNAs in pre-diabetes and newly diagnosed type 2 diabetes: a clinical study. Acta Diabetol. (2011) 48:61–9. doi: 10.1007/s00592-010-0226-0
45. Karolina DS, Armugam A, Tavintharan S, Wong MT, Lim SC, Sum CF, et al. MicroRNA 144 impairs insulin signaling by inhibiting the expression of insulin receptor substrate 1 in type 2 diabetes mellitus. PLoS ONE. (2011) 6:e22839. doi: 10.1371/journal.pone.0022839
46. Chen X, Xie M, Liu D, Shi K. Downregulation of microRNA-146a inhibits ovarian granulosa cell apoptosis by simultaneously targeting interleukin-1 receptor-associated kinase and tumor necrosis factor receptor-associated factor 6. Mol Med Rep. (2015) 12:5155–62. doi: 10.3892/mmr.2015.4036
47. Huang Q, Yang Z, Zhou JP, Luo Y. HMGB1 induces endothelial progenitor cells apoptosis via RAGE-dependent PERK/eIF2α pathway. Mol Cell Biochem. (2017) 431:67–74. doi: 10.1007/s11010-017-2976-2
48. O'Connell RM, Taganov KD, Boldin MP, Cheng G, Baltimore D. MicroRNA-155 is induced during the macrophage inflammatory response. Proc Natl Acad Sci USA. (2007) 104:1604–9. doi: 10.1073/pnas.0610731104
49. Murri M, Insenser M, Fernández-Durán E, San-Millán JL, Escobar-Morreale HF. Effects of polycystic ovary syndrome (PCOS), sex hormones, and obesity on circulating miRNA-21, miRNA-27b, miRNA-103, and miRNA-155 expression. J Clin Endocrinol Metab. (2013) 98:E1835–44. doi: 10.1210/jc.2013-2218
50. Mauer J, Chaurasia B, Goldau J, Vogt MC, Ruud J, Nguyen KD, et al. Signaling by IL-6 promotes alternative activation of macrophages to limit endotoxemia and obesity-associated resistance to insulin. Nat Immunol. (2014) 15:423–30. doi: 10.1038/ni.2865
51. Wei J, Xu H, Davies JL, Hemmings GP. Increase of plasma IL-6 concentration with age in healthy subjects. Life Sci. (1992) 51:1953–6. doi: 10.1016/0024-3205(92)90112-3
52. Ling HY, Ou HS, Feng SD, Zhang XY, Tuo QH, Chen LX, et al. Changes in microRNA (miR) profile and effects of miR-320 in insulin-resistant 3T3-L1 adipocytes. Clin Exp Pharmacol Physiol. (2009) 36:e32–e39. doi: 10.1111/j.1440-1681.2009.05207.x
53. Casarini L, Crépieux P. Molecular mechanisms of action of FSH. Front Endocrinol. (2019) 14:305. doi: 10.3389/fendo.2019.00305
54. Hewish M, Chau I, Cunningham D. Insulin-like growth factor 1 receptor targeted therapeutics: novel compounds and novel treatment strategies for cancer medicine. Recent Pat Anticancer Drug Discov. (2009) 4:54–72. doi: 10.2174/157489209787002515
55. Fan C, Liu S, Zhao Y, Han Y, Yang L, Tao G, et al. Upregulation of miR-370 contributes to the progression of gastric carcinoma via suppression of FOXO1. Biomed Pharmacother. (2013) 67:521–6. doi: 10.1016/j.biopha.2013.04.014
56. Wu Z, Sun H, Zeng W, He J, Mao X. Upregulation of mircoRNA-370 induces proliferation in human prostate cancer cells by downregulating the transcription factor FOXO1. PLoS ONE. (2012) 7:e45825. doi: 10.1371/journal.pone.0045825
57. Jung HJ, Suh Y. Regulation of IGF−1 signaling by microRNAs. Front Genet. (2014) 5:472. doi: 10.3389/fgene.2014.00472
Keywords: miRNA, PCOS, inflammation, HMGB1, insulin resistance, estradiol
Citation: Cirillo F, Catellani C, Lazzeroni P, Sartori C, Nicoli A, Amarri S, La Sala GB and Street ME (2019) MiRNAs Regulating Insulin Sensitivity Are Dysregulated in Polycystic Ovary Syndrome (PCOS) Ovaries and Are Associated With Markers of Inflammation and Insulin Sensitivity. Front. Endocrinol. 10:879. doi: 10.3389/fendo.2019.00879
Received: 10 July 2019; Accepted: 29 November 2019;
Published: 13 December 2019.
Edited by:
Katja Teerds, Wageningen University, NetherlandsReviewed by:
Rosita Angela Condorelli, University of Catania, ItalyJoAnne Richards, Baylor College of Medicine, United States
Copyright © 2019 Cirillo, Catellani, Lazzeroni, Sartori, Nicoli, Amarri, La Sala and Street. This is an open-access article distributed under the terms of the Creative Commons Attribution License (CC BY). The use, distribution or reproduction in other forums is permitted, provided the original author(s) and the copyright owner(s) are credited and that the original publication in this journal is cited, in accordance with accepted academic practice. No use, distribution or reproduction is permitted which does not comply with these terms.
*Correspondence: Maria Elisabeth Street, bWFyaWFlbGlzYWJldGguc3RyZWV0QGF1c2wucmUuaXQ=
†These authors have contributed equally to this work