 Lisa D. Yee
 Joanne E. Mortimer
 Rama Natarajan
 Eric C. Dietze
 Victoria L. Seewaldt
- City of Hope Comprehensive Cancer Center, Duarte, CA, United States
Studies investigating the potential link between adult pre-menopausal obesity [as measured by body mass index (BMI)] and triple-negative breast cancer have been inconsistent. Recent studies show that BMI is not an exact measure of metabolic health; individuals can be obese (BMI > 30 kg/m2) and metabolically healthy or lean (BMI < 25 kg/m2) and metabolically unhealthy. Consequently, there is a need to better understand the molecular signaling pathways that might be activated in individuals that are metabolically unhealthy and how these signaling pathways may drive biologically aggressive breast cancer. One key driver of both type-2 diabetes and cancer is insulin. Insulin is a potent hormone that activates many pathways that drive aggressive breast cancer biology. Here, we review (1) the controversial relationship between obesity and breast cancer, (2) the impact of insulin on organs, subcellular components, and cancer processes, (3) the potential link between insulin-signaling and cancer, and (4) consider time points during breast cancer prevention and treatment where insulin-signaling could be better controlled, with the ultimate goal of improving overall health, optimizing breast cancer prevention, and improving breast cancer survival.
Over the past 20 years, much of the world, has experienced a growing obesity epidemic. Once a disease of the wealthy, obesity now disproportionately effects women and the poor. Possible contributors include disparities in income that promote consumption of inexpensive high calorie foods with low nutritional value (1), lack of access to healthy food sources (food deserts) (2) (https://www.nap.edu/catalog/12623/the-public-health-effects-of-food-deserts-workshop-summary), and adoption of a sedentary lifestyle. Along with the rise in obesity, there has been a rise in gestational diabetes and type-2 diabetes. Much research is focusing on the potential link between obesity, type-2 diabetes, and breast cancer, as increasingly women who are at risk for type-2 diabetes are also at risk for breast cancer. There has been much work investigating the potential link between obesity [as measured by body mass index (BMI)] and breast cancer. Results have been conflicting, likely reflecting the complex relationship between BMI and metabolic health. Recent studies show that BMI is not an exact measure of metabolic health. Individuals can be obese (BMI > 35 kg/m2) and metabolically healthy or lean (BMI < 25 kg/m2) and metabolically unhealthy. Consequently, there have been efforts to better understand the molecular signaling pathways that might be activated in individuals that are metabolically unhealthy. One key driver of both type-2 diabetes and cancer is insulin. Insulin is a potent hormone that activates many pathways that drive aggressive breast cancer biology. Here, we aim to review (1) the controversial relationship between obesity and breast cancer, (2) the impact of insulin on organs, subcellular components, and cancer processes, (3) the potential link between insulin-signaling and cancer, and (4) consider time points during breast cancer prevention and treatment where insulin-signaling could be better controlled, with the ultimate goal of improving overall health, optimizing breast cancer prevention, and improving breast cancer survival.
Complex Relationship Between Obesity and Breast Cancer
Obesity and Breast Cancer
Increased adiposity in childhood has been consistently associated with a decreased risk of pre- and post-menopausal breast cancer. Conversely, increased adiposity after menopause is associated with increase of risk (3–26). However, the majority of these have been case-control studies and have not assessed breast cancer-subtype. Meta-analyses of aggregated studies were (1) not uniform in their age at BMI measurement, attained age of participants, and degree of adjustment for potential confounding factors, and (2) not stratified by other risk factors (4–7, 17–20, 27). A summary of trials testing for the association between obesity and breast cancer (and findings) is presented in Table 1A.
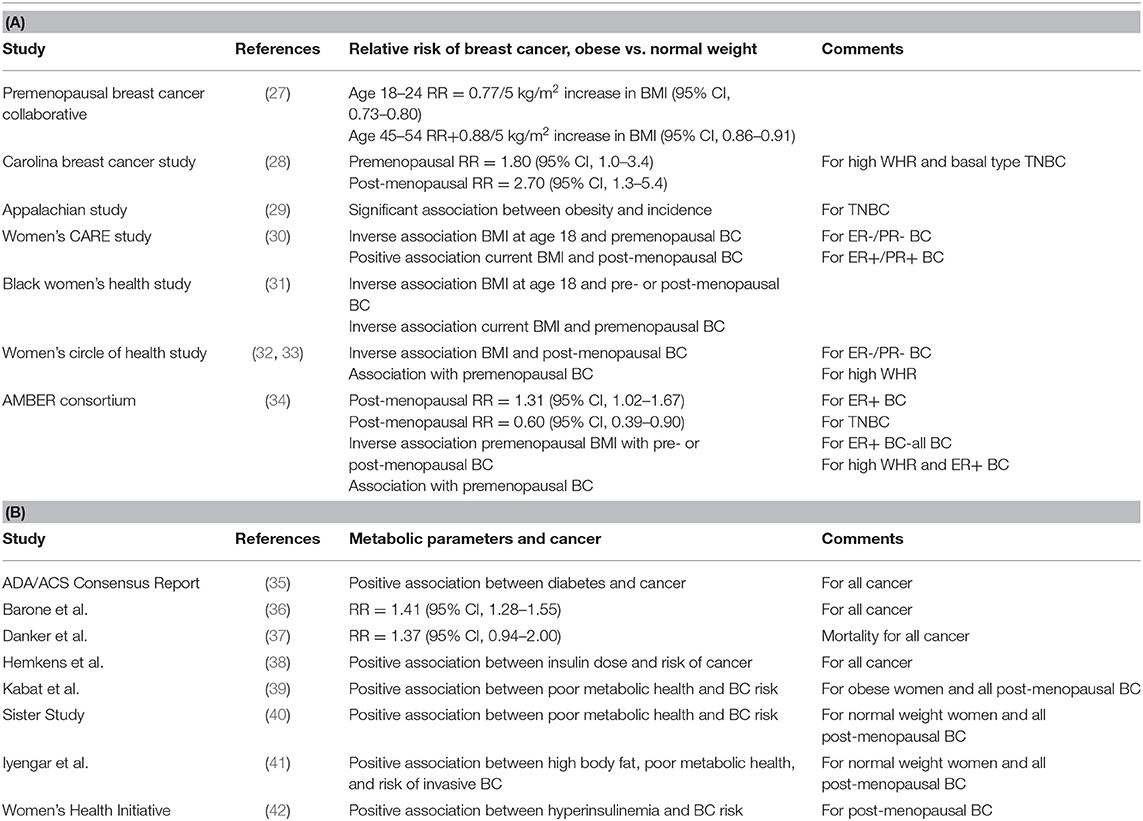
Table 1. The association between: (A) Obesity and ER+ or ER- Breast Cancer and (B) Metabolic Parameters and Cancer.
The Premenopausal Breast Cancer Collaborative group recently published a multicenter analysis used pooled individual-level data from 758,592 premenopausal women from 19 prospective cohorts to estimate hazard ratios (HRs) of premenopausal breast cancer in association with BMI from ages 18 through 54 years (27). Results of this study provide evidence increased adiposity was associated with a reduced risk of premenopausal breast cancer at a greater magnitude than previously shown and across the entire distribution of BMI. The strongest associations of risk were observed for BMI in early adulthood. Among the 758,592 premenopausal women (median age, 40.6) included in the analysis, inverse linear associations of BMI with breast cancer risk were higher for BMI age 18–24 years [HR per 5 kg/m2 (5.0-U) difference, 0.77; 95%CI, 0.73–0.80] than for BMI age 45–54 years (HR per 5.0-U difference, 0.88; 95%CI, 0.86–0.91). The investigators observed a 4.2-fold risk gradient between the highest and lowest BMI categories (BMI ≥35.0 vs. <17.0) at ages 18–24 years. Associations between BMI and breast cancer were stronger for estrogen receptor–positive (ER+) and/or progesterone receptor–positive (PR+) than for hormone receptor–negative (ER–) breast cancers.
Obesity and Triple Negative Breast Cancer (TNBC)
The potential association between obesity and TNBC has been a subject of intense research study. As outlined below, studies investigating the potential relationship between obesity and TNBC have been inconsistent. This is a summary of some of the key studies that have been recently published.
The Carolina Breast Cancer Study is a North Carolina population-based case-controlled study of breast cancer, conducted in three phases (28). The current study phase, Phase 3 (years 2008–2014), includes women resident in 44 North Carolina Counties (28), employing randomized recruitment to oversample African-American/Black women and women under age 50 (28). Waist to hip ratio (WHR) was compared between the highest (≥0.84) and lowest (<0.77) groups vs. the basal-type subset of TNBC. There was an increased risk [odds ratio (OR) = 2.3; 95% CI, 1.4–3.6] for basal-type TNBC in women with higher WHR (43). Premenopausal women (OR = 1.8; 95% CI, 1.0–3.4) and post-menopausal women (OR = 2.7; 95% CI, 1.3–5.4) with the highest WHR had increased risk of developing basal-type TNBC compared to the lowest WHR (43). Basal-type breast cancer was observed to be highest among premenopausal African-American/Black women (43). There was no significant association between increased BMI (defined as BMI ≥ 25 kg/m2) and basal-type TNBC.
The Appalachian Study investigated the potential association between obesity (defined as BMI ≥ 30 kg/m2) and TNBC in 620 predominantly non-Hispanic White women in rural Appalachia. This study reported a significant association between obesity and the incidence of TNBC (29).
Women's CARE study is a case-controlled study of BMI and breast cancer risk in non-Hispanic White women and African-American/Black women. The Women's CARE study reported (1) an inverse association between a woman's BMI at age 18 and premenopausal ER–/PR– breast cancer and (2) a positive association between current BMI and post-menopausal ER+/PR+ breast cancer (30).
The Black Women's Health Study (BWHS) is a prospective study among African-American/Black women across the United States (31). The study was established in 1995, with 59,000 African-American/Black women responding to a 14-page health questionnaire. The BWHS tested for the potential association between body size and breast cancer. In the BWHS, high BMI at age 18 was associated with reduced risk of both pre- and post-menopausal breast cancer, and current BMI was inversely associated with premenopausal cancer (13). There was also a trend toward a positive association between high BMI and ER+/PR+ breast cancer.
The Women's Circle of Health Study is a multi-site case–control study in New York City and New Jersey that aims to identify risk factors for early aggressive breast cancers in African-American/Black and non-Hispanic European-American women (32, 33). Recently, the Women's Circle of Health Study observed significant inverse associations of high BMI with ER–/PR– breast cancer among post-menopausal women. Similar to the Carolina Breast Study, increased WHR was associated with an increased risk of premenopausal breast cancer after adjustment for BMI (32, 33, 43).
The Premenopausal Breast Cancer Collaborative group (as described above) observed an inverse association between premenopausal obesity and ER+/PR+ breast cancer (27). In contrast, BMI at ages 25–54 years was not consistently associated with TNBC or ER- breast cancer (27).
The African-American Breast Cancer Epidemiology and Risk (AMBER) Consortium was formed, in part, to investigate the inconsistent and confusing results generated in individual studies testing for the potential association between obesity (measured by BMI and/or WHR) and TNBC. The AMBER Consortium (34) brings together four important, highly diverse cohorts: (1) Carolina Breast Cancer Study (43), (2) Women's Circle of Health Study (30), (3) Black Women's Health Study (31), and (4) Multiethnic Cohort Study (44). The AMBER Consortium found that the impact of general and central obesity varied by menopausal status and hormone receptor subtype in African-American/Black women (34). In post-menopausal women, higher recent BMI was associated with increased risk of ER+ cancer (OR: 1.31; 95% CI: 1.02–1.67 for BMI ≥ 35 vs. <25 kg/m2) and with a decreased risk of TNBC (OR: 0.60; 95% CI: 0.39–0.93 for BMI ≥ 35 vs. <25). Adult premenopausal women with increased BMI had a decreased incidence of (1) premenopausal ER+ breast cancer and (2) all subsequent post-menopausal breast cancer (all subtypes) (34). In adult premenopausal women, high WHR was associated with an increased risk of premenopausal ER+ breast cancer (OR: 1.35; 95% CI: 1.01–1.80) and all subsequent post-menopausal breast cancer (all subtypes) (OR: 1.26; 95% CI: 1.02–1.56 (34). The investigators concluded that in African-American/Black women, there were different mechanisms for the associations between adiposity and TNBC vs. ER+ breast cancers (34).
Insulin Overview, Target Organs, and Activation of Cellular Signaling
Insulin
Insulin is a peptide hormone that is produced by the pancreatic islet beta cells in response to an increase in serum glucose [for a comprehensive review, see Haeusler et al. (45)]. Insulin is a master regulator of energy storage and metabolism and has key and complex effects in the liver, muscle, brain, and fat (Figure 1) (45). Insulin stimulates glucose uptake by muscle and adipose tissue (45). In the liver, insulin inhibits gluconeogenesis and release of glucose (45). High insulin levels stimulate both the liver and muscle to store excess glucose (45). In addition to regulating the global glucose energy balance, in adipocytes, insulin promotes fatty acid transport from the blood stream, promotes storage of fat (lipogenesis), and inhibits fat breakdown (lipolysis) (45). Insulin facilitates storage of energy that can be mobilized when insulin levels are low (fasting) (45).
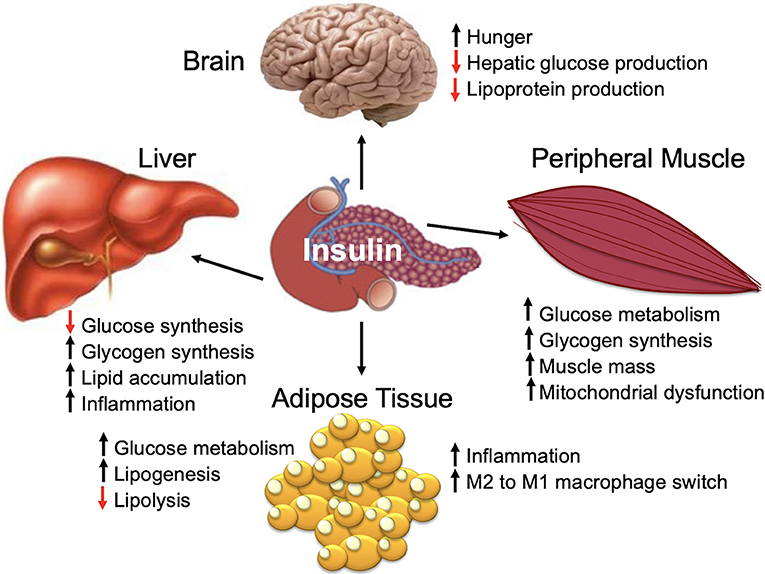
Figure 1. Insulin is a major regulator of metabolism and organ function.
Cellular Signaling
The majority of mammalian cell types express the insulin receptor and, consequently, are impacted by insulin-signaling (45). In addition to pancreatic islet beta cells, hepatocytes, and adipocytes, insulin also impacts neurons, endothelial cells, and immune cells (45).
Insulin binds to the insulin receptor and activates cell signaling pathways that are key regulators of cellular homeostasis. These signaling pathways are dysregulated in the majority of biologically aggressive cancers (45). Under nutrient-rich circumstances, insulin is released and binds to the insulin receptor (45). Binding of insulin promotes tyrosine phosphorylation of the insulin receptor and insulin receptor substrate (IRS) (45). IRS in turn phosphorylates phosphatidyl inositol-3-kinase (PI3K) and activates downstream AKT/mTOR-network signaling (45). Insulin also activates insulin/insulin-like growth factor-1 (IGF-1)-signaling (45). IGF-1 binds to the IGF-1 receptor (IGF-1R) leading to downstream phosphorylation cascades that activate: (1) PI3K/AKT/mTOR-network signaling and (2) RAS/RAF/mitogen activated protein kinase (MAPK) (Figure 2) (45).
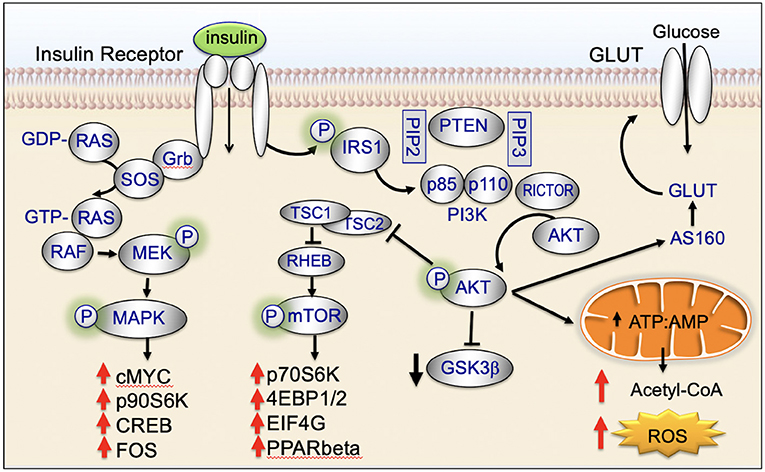
Figure 2. Insulin signaling, glucose uptake, and cancer processes.
Hyperinsulinemia, Insulin-Resistance, and Gestational Diabetes
Hyperinsulinemia
Chronic high caloric intake (overeating) disrupts the balance between energy storage and consumption resulting in pre-diabetes (insulin resistance) and, ultimately, type-2 diabetes (45). Overeating, results in chronically high serum insulin and desensitization of skeletal muscle to insulin (45). With progressive de-sensitization (insulin-resistance), the pancreas is required to produce increasingly higher levels of insulin (hyperinsulinemia) to achieve glucose homeostasis and prevent hyperglycemia (Figure 3A) (45).
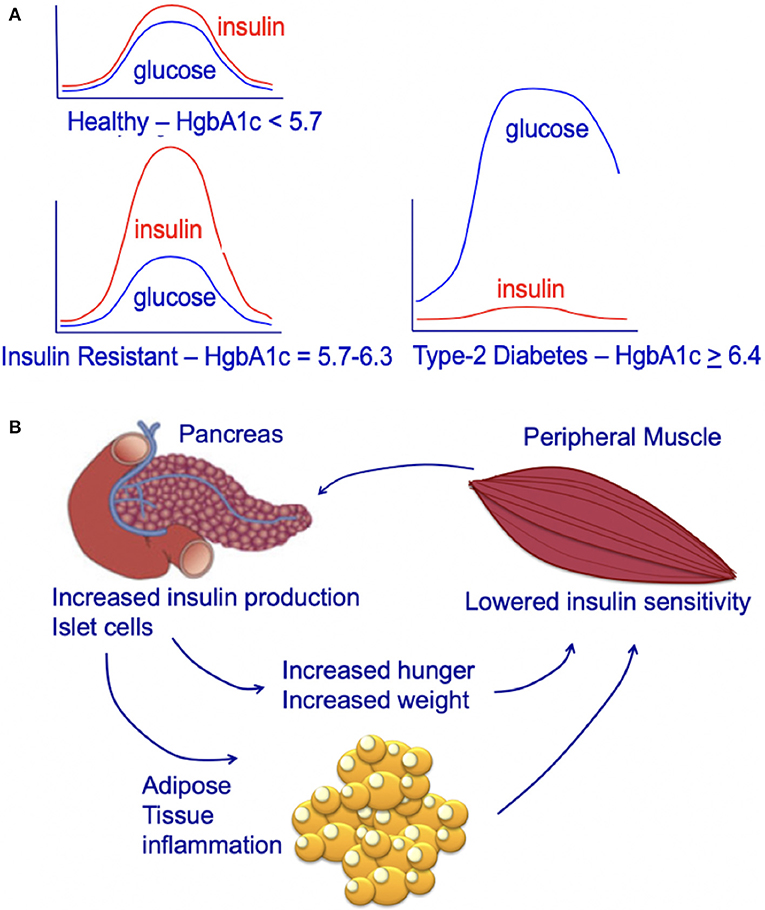
Figure 3. (A) Circulating insulin and glucose levels in healthy individuals (Healthy), insulin-resistant individuals (Resistant), and individuals with type-2 diabetes (Diabetes) at baseline and at 2 h after eating. Individuals with type-2 diabetes can experience beta-cell failure and an associated decline in serum insulin levels. This beta-cell failure/decline insulin is highly variable and time-dependent. For an excellent review see Roden and Shulman (46). (B) Impact of insulin-resistance on pancreatic islet cells, peripheral muscle, and individual. Insulin resistance in peripheral muscle tissue results in increased insulin demands from the pancreas. Increased circulating insulin drives hunger and increases weight, leading to a positive feedback loop that increases the chance of an individual developing type-2 diabetes.
The increasing demands on the pancreatic islet beta cells that occur during hyperinsulinemia (insulin-resistance) contribute to the subsequent development of type-2 diabetes (45). Obesity and insulin-resistance initially results in high fasting insulin; this high level of insulin is thought to be due to beta-cell compensation in the face of progressive insulin-resistance, resulting in hyperinsulinemia with normal glucose tolerance (47, 48). However, after type-2 diabetes develops, some individuals develop progressive beta-cell dysfunction and failure associated with a decrease in fasting insulin (Figure 3A) (48, 49). This decrease in fasting insulin is observed in both animal models (50, 51) and humans (46). In humans, the decrease in fasting insulin has been shown to be proportional to the number of years an individual has had type-2 diabetes (52, 53). However, not all individuals with type-2 diabetes develop beta-cell dysfunction/mass and insulin production; some individuals with type-2 diabetes may have higher than normal fasting insulin (despite this increased fasting insulin not matching physiologic needs) (54). Genetics and genetic ancestry are thought to play a key role in determining whether individuals with type-2 diabetes exhibit a progressive (1) loss or (2) increase in insulin production (47, 54, 55). For a further discussion of this complex emerging area of research see the excellent new review article by Roden and Schulman (46).
Insulin-Resistance and Gestational Diabetes
Insulin-resistance is diagnosed when an individual has impaired fasting glucose and/or impaired glucose tolerance that does not meet the threshold for diabetes (56). Insulin-resistance is diagnosed by (1) serum hemoglobin A1c (HgbA1c) of 5.7–6.3% or (2) the more complex glucose tolerance test (baseline serum glucose and insulin, oral glucose load, 2 h serum glucose and insulin (56). Measurement of serum glucose alone, is many times inadequate to detect insulin-resistance as serum glucose levels are typically only mildly elevated. The pathology of insulin-resistance lies in the high levels of insulin required to achieve these mildly elevated glucose levels. Unless treated, insulin-resistance frequently leads to type-2 diabetes (56). Type-2 diabetes occurs when the pancreas cannot keep up with demand for insulin; ultimately the pancreatic islet beta cells die, the pancreas fails (insulin-dependent type-2 diabetes), and glucose levels rise.
Gestational diabetes occurs during pregnancy when a woman is unable to make sufficient insulin for herself and her developing infant, resulting in glucose intolerance (56). Women with gestational diabetes have glucose tolerance that is impaired but does not meet the degree of impairment required for the diagnosis of diabetes (56). The diagnosis gestational diabetes is typically made by two step testing at approximately 24–28 weeks gestation (56). However, some women have insulin resistance before they become pregnant. While gestational diabetes is linked with obesity, it can occur in women who are normal weight (57, 58). Women with gestational diabetes are at increased risk for adverse pregnancy outcomes, including fetal macrosomia, pre-eclampsia/hypertensive disorders in pregnancy, and shoulder dystocia (https://extranet.who.int/rhl/topics/preconception-pregnancy-childbirth-and-postpartum-care/antenatal-care/who-recommendation-diagnosis-gestational-diabetes-pregnancy-0). Long-term, women with gestational diabetes are at risk for the subsequent development of type-2 diabetes (56).
World-Wide Increase in Obesity, Insulin-Resistance, and Gestational Diabetes
Obesity Epidemic
Over the past 20 years there has been a significant increase world-wide in obesity, type-2 diabetes, and gestational diabetes (59). Contributors include adoption of a Western diet, high in calories and low in nutritionals (1), lack of access to healthy foods (https://www.ncbi.nlm.nih.gov/pubmed/25032337) (2), and adoption of a sedentary lifestyle.
The National Health and Nutrition Examination Surveys (NHANES) study reported in 2014 that 40.4% of adult women were obese (Body Mass Index (BMI) ≥30 kg/m2) (60, 61). Between 2005 and 2014, there was an increased prevalence of obesity (from 35.3 to 40.4%) and severe obesity (from 7.4 to 9.9%) in women (60, 61) but no statistically significant increase was observed in men (60, 61). Obesity has steadily increased in adolescents 12–19 years of age; severe obesity increased in adolescents from 2.6% in 1988–1994 to 9.1% in 2013–2014 (60–62).
According to the United States Center for Disease Control (CDC), in 2015, 30.3 million people (12.2% all U.S. adults) across the United States are estimated to have type-2 diabetes (https://www.cdc.gov/diabetes/data/statistics/statistics-report.html); this total included 7.2 million (23.8% of total) who were not aware. Compared to non-Hispanic whites, the age-adjusted prevalence of diagnosed and undiagnosed diabetes was higher among Asians, non-Hispanic Blacks, and Hispanics during 2011–2014. The world-wide incidence of diabetes, insulin-resistance, and gestational diabetes is difficult to estimate as many cases are undiagnosed and unreported [see Ogurtsova et al., 2017 for a full review (63)]. However, it is clear that the incidence is increasing. According to Ogurtsova et al., in 2015 it was estimated that world-wide there were 415 million (CI: 340– 536 million) people with type-2 diabetes (63). The epidemic of type-2 diabetes disproportionately was felt by people living in poverty; 75% of individuals with type-2 diabetes were living in low- and middle-income countries. By 2040, the number of individuals living with type-2 diabetes is predicted to rise to 642 million world-wide (CI: 521–829 million) (63).
Achieving a healthy energy balance requires physical activity. Over the past 20 years, there has been a significant reduction in the number of hours individuals in both the United States and world-wide engage in exercise. This decrease in exercise has had important consequences; the decrease has worsened metabolic health and increased insulin-resistance of skeletal muscle.
Social inequities have contributed to a decrease in exercise in African-Americans/Blacks and Hispanic/Latinos. Access to public parks, public pools, and green space is much lower in African-American/Black and Latino/Hispanic neighborhoods. Sidewalks in African-American/Black neighborhoods are likely to be in poor condition (https://www.cdc.gov/mmwr/preview/mmwrhtml/ss6304a1.htm). The threat of violence strongly affects the willingness of mothers to let their children play outdoors (http://www.nrpa.org/publications-research/research-papers/archive/) (64). African-American/Black children in neighborhoods that lack access to parks, playgrounds, and recreation centers have a 20–45% greater risk of becoming overweight (https://theblackdetour.com/the-obesity-crisis-in-black-america/).
As the incidence of obesity and type-2 diabetes continues to rise, women of childbearing age are at increased risk for insulin-resistance and gestational diabetes. The CDC reported in 2014 that 29.3% of women in the United States had insulin-resistance; only 13.3% were aware of having insulin-resistance (https://www.cdc.gov/diabetes/data/statistics/statistics-report.html). The incidence of insulin-resistance was highest in Asians (35.7%) followed by non-Hispanic Blacks (36.3%), Hispanics (31.7%), and non-Hispanic Whites (31.5%) (https://www.cdc.gov/diabetes/data/statistics/statistics-report.html).
Hyperinsulinemia–Impact on Organs, Organelles, and Specific Tissue-Types
General Organ Effects
The majority of mammalian organs are impacted by hyperinsulinemia [Figure 3B; reviewed in Haeusler et al. (45)]. In the liver, hyperinsulinemia promotes dyslipidemia, and promotes the development fatty liver. In the brain, hyperinsulinemia stimulates appetite, increasing caloric intake, weight gain, and worsening of hyperinsulinemia (45). In skeletal muscle, hyperinsulinemia and insulin-resistance promotes decreased glucose uptake, increases fatigue, decreases physical activity, and subsequently increases insulin-resistance of muscle tissue (45). In adipose tissue, hyperinsulinemia increases lipid accumulation and promotes inflammation (45). In blood vessels and the kidney, insulin promotes damage to endothelial cells and renal dysfunction due to increased nitric oxide synthesis, increased production of reactive oxygen species, and decreased cell adhesion/increased mobility (45).
Organelles
While insulin signaling has been extensively studied, there remain many areas of active investigation. For a comprehensive review of insulin-signaling see Haeusler et al. (45).
Mitochondria
Mitochondria are key targets of insulin signaling (Figure 4). When insulin binds to the insulin receptor, there is downstream activation of IRS1/PI3K/AKT. Activation of AKT increases recruitment of the GLUT4 receptor to the plasma membrane, increases glucose uptake, stimulates glycolysis, and drives the TCA cycle and ATP production (45).
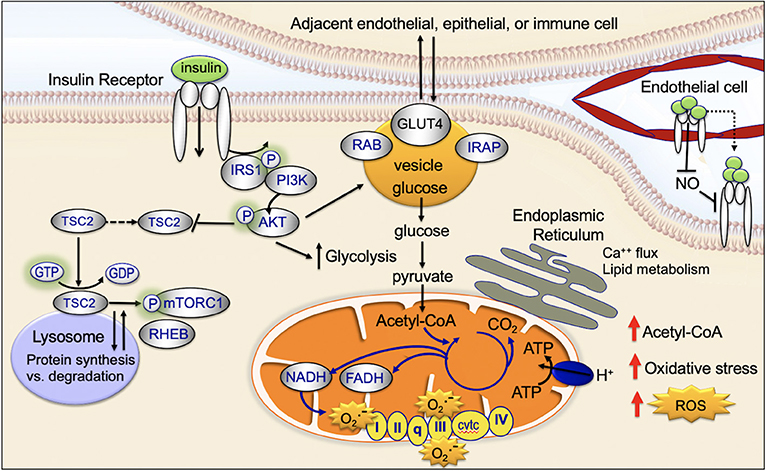
Figure 4. Impact of insulin signaling on subcellular components.
Lysosomes
Insulin binds to the cell surface insulin receptor, activating IRS and downstream PI3K/AKT/mTOR-network signaling (Figure 4). The mTORC1 complex is made up of the mTOR, Raptor, PRAS40, mLST8, and DEPTOR. mTORC1 activates key downstream regulatory proteins such as 4EBP1 and S6K1. mTORC1 is activated in the lysosome (45, 65). At the lysosomal membrane, mTORC1 interacts with RHEB. RHEB activates mTORC1 but only if insulin signaling is activated. When insulin signaling is not active, RHEB is bound to the TSC protein complex and is inactive (45, 66). GDP-bound TSC2 binds RHEB and inactivates it; GTP-bound TSC2 releases RHEB and allows it to be activated. Following insulin stimulation, AKT phosphorylation causes TSC2-bound GDP to be converted to GTP, allowing RHEB to be released and activated (45, 66, 67). AKT-mediated phosphorylation has been recently shown to promote dissociation of TSC2 from the lysosome, dissociation of RHEB, and activation of mTORC (45, 68).
Endoplasmic Reticulum
Mitochondria physically associate with the endoplasmic reticulum (mitochondrial associated membrane) (45). This association promotes transfer of calcium and lipids between the two organelles (69). There is emerging evidence the mitochondrial associated membranes are an important target site for insulin signaling (Figure 4) (70). The mTORC2 complex is composed of a group of proteins including mTOR, Rictor, mLST8, and mSIN1; mTORC2 activates downstream, FOXO and promotes apoptosis resistance (45). Insulin causes activated AKT and the mTORC2 complex to localize to the mitochondrial associated membranes (45, 71). An increase in mitochondrial associated membrane contacts has been recently shown to dysregulate insulin signaling and glucose metabolism (72).
Cell-Trafficking
After insulin binds to the insulin receptor, the insulin receptor is activated and then internalized within clathrin-coated vesicles (early endosomes; Figure 4) (45). Within these vesicles, insulin and the insulin receptor remain active for signaling and vesicles colocalize with downstream signaling targets (45, 73, 74). Recent studies provide evidence that endosomal insulin receptor signaling plays a role in the mitogenic but not metabolic effects of the insulin receptor (45, 73, 74).
The glucose transporter, GLUT4, is transported between the intracellular space and the plasma membrane (Figure 4). This transport plays a key role in regulating glucose uptake, particularly in adipose cells and muscle (45). In the absence of insulin-signaling, GLUT4 is present in the intracellular space. Insulin-signaling and downstream AKT-activation promotes translocation of GLUT4 to the plasma membrane; at the plasma membrane GLUT4 transports glucose into the cell (75, 76). When insulin-signaling is no longer active GLUT4 returns to the intracellular space (75, 77).
Key Insulin-Tissue Targets
Skeletal Muscle
It has been long known that obese individuals, type-2 diabetics, and individuals who are insulin-resistant have skeletal muscle mitochondrial-defects (Figure 5) (78, 79). Human studies in the 1990's showed that obese and insulin-resistant individuals had reduced muscle oxidative enzyme activity and decreased lipid metabolism compared with lean individuals (80–83); in 2002, it was shown that the skeletal muscle of obese individuals with type-2 diabetes (relative to lean normal controls) exhibited lower mitochondrial oxidoreductase activity and reduced mitochondrial number and size (84–86). In 2003, microarray studies showed mitochondrial muscle biogenesis and oxidative phosphorylation pathways were (1) downregulated in individuals with type-2 diabetes and non-diabetics with a family history of type-2 diabetes and (2) highlighted a key role of the peroxisome proliferator coactivator 1a (PGC1α) as a master regulator of mitochondrial metabolism (78). Subsequent human studies demonstrated similar downregulation of metabolic and mitochondrial pathways in the muscle of individuals with insulin-resistance; key findings were (1) defective expression of muscle mitochondrial genes (mRNA and protein), (2) decreased muscle mitochondrial oxidative enzyme activity, and (3) abnormal mitochondrial size and density [for a full review, see Montgomery and Turner (87)].
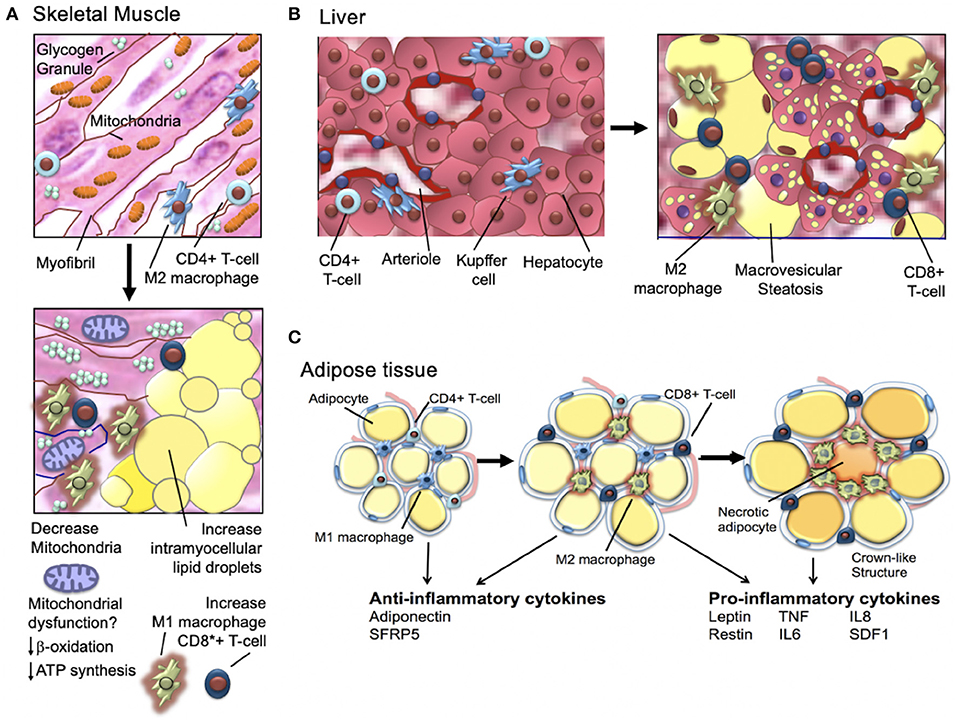
Figure 5. Hyperinsulinemia and (A) skeletal muscle, (B) liver, and (C) adipose tissue.
Adipose Tissue
For a comprehensive review, see Gastaldelli et al. (88). As discussed above, obesity and insulin-resistance are associated with chronic low-grade adipose tissue inflammation that in turn, promotes insulin-resistance and type-2 diabetes (Figure 5) (89). As hypertrophic adipocytes become insulin resistant and lipolytic activity increases, non-esterified fatty acids are shunted away from adipose tissue and deposited in liver and muscle tissue. These changes in the transport of non-esterified fatty acids are associated with increase local production of inflammatory cytokines (89, 90). The increase in inflammatory cytokines further increases lipolysis and promotes activation of macrophages and T cells that, in turn, produce additional high levels of inflammatory cytokines (91). Macrophage infiltration of adipocytes is observed in early insulin-resistance (92). Adipocyte cell death (necrosis) is also a feature of later-stage insulin-resistance (93). Activated macrophages are observed surrounding necrotic adipocytes and together these necrotic adipocytes and surrounding activated macrophages form “crown-like structures” (94). The tissue density of crown-like structures is positively related to adipocyte size, independent of the degree of obesity (93, 94). In a sentinel study, Camastra et al. (95) investigated the impact of bariatric surgery on (1) measured insulin-resistance (insulin clamp), (2) lipolysis (2H5-glycerol infusion), (3) ß-cell glucose-sensitivity (ß-GS, mathematical modeling), and (4) cellular substructure (electron microscopy). Investigators found that pre-surgical subcutaneous fat (SAT) and visceral fat (VAT) demonstrated fibrosis/necrosis, small mitochondria, free interstitial lipids, and a thickened capillary basement membrane (95). Skeletal muscle biopsy demonstrated increased fat infiltration and adipocyte hypertrophy and a reduction in the number and size of mitochondria. Individuals with type-2 diabetes (relative to obese individual without type-2 diabetes) demonstrated impaired ß-GS, intracapillary neutrophils, and higher intramyocellular fat, adipocyte hypertrophy, and crown-like structures in in both VAT and SAT (95). After bariatric surgery, insulin-resistance and lipolysis both decreased. ß-GS improved in individuals with previously diagnosed type-2 diabetes (1) skeletal muscle adipocyte infiltration was reduced, (2) interstitial lipid infiltration was reduced, and (3) the number of smooth muscle cell mitochondria increased (95). The investigators concluded that (1) insulin-resistance improves proportionally to weight loss but remains subnormal and (2) SAT and muscle changes disappear. In individuals with prior type-2 diabetes, after bariatric surgery (1) some VAT pathology persists and (2) beta-cell dysfunction improves but is not normalized (95).
Liver
The liver is a key target of insulin and plays an important role in the development of insulin-resistance and type-2 diabetes. Chronic overeating results in the liver (1) losing its ability to regulate and suppress gluconeogenesis but (2) retaining its ability to drive lipogenesis. This dual dysregulation/overproduction of glucose and lipids is characteristic of the hyperglycemia and hyperlipidemia observed in metabolic syndrome and type-2 diabetes (96–98). Chronic hyperglycemia and hyperlipidemia drive non-alcoholic fatty liver disease and atherogenic dyslipidemia (99–101). There has been a great deal of research investigating the molecular mechanism(s) that regulates insulin regulation of gluconeogenesis vs. triglyceride production.
Although the pathophysiology of selective insulin/insulin-receptor signaling remains unclear, it is generally acknowledged that the pathways to insulin regulation of glucose vs. triglyceride production diverge downstream of AKT (96, 102). However, it remains unclear why the divergence would promote, in the face of chronic nutrient overload, the selective inability to suppress gluconeogenesis vs. retention of lipogenesis-regulation. General consensus is that FoxO-signaling plays a key role to account for this dual abnormality (96, 102, 103).
In the liver, a key morphologic feature of chronic nutrient overload, hyperinsulinemia, and lipogenesis is steatosis. Steatosis, or fatty change, is the abnormal retention of lipids within cells. Excess lipid accumulates in hepatocyte vesicles, these vesicles displace the cytoplasm (microvesicular steatosis). When the vesicles are large enough to distort the nucleus, this is called macrovesicular steatosis. Macrovesicular steatosis is important for the development of hepatic fatty liver disease.
Wound Healing
Wound healing is impaired in individuals with type-2 diabetes and insulin resistance. Multiple components of wound healing are impaired including (1) neutrophil activation, (2) fibroblast migration and replication, and (3) abnormal angiogenesis. Insulin regulates VEGF expression and hyperinsulinemia is linked to decreased VEGF production (104–108). Reduction in VEGF production and efficacy is linked to increased oxidative stress and hypoxia (109–113). In addition, insulin activates IRS-1 signaling. IRS-1 has also been shown to similarly impair wound healing (114).
Cancer Processes
Glycolysis
The PI3K/AKT/mTOR-signaling pathway is a well-established regulator of central glucose metabolism and aerobic glycolysis (Figure 6) (115–117). Aggressive cancer cells are known to become glucose dependent and generate a larger proportion of their energy via aerobic glycolysis (Warburg effect) as opposed to mitochondrial oxidative phosphorylation (TCA cycle) (118). The Warburg effect directly contributes to the aggressive biology of cancers by increasing glycolysis/glucose uptake, which supplies anabolic precursors for rapid growth and promotes mitochondrial dysfunction that leads to apoptosis-resistance.
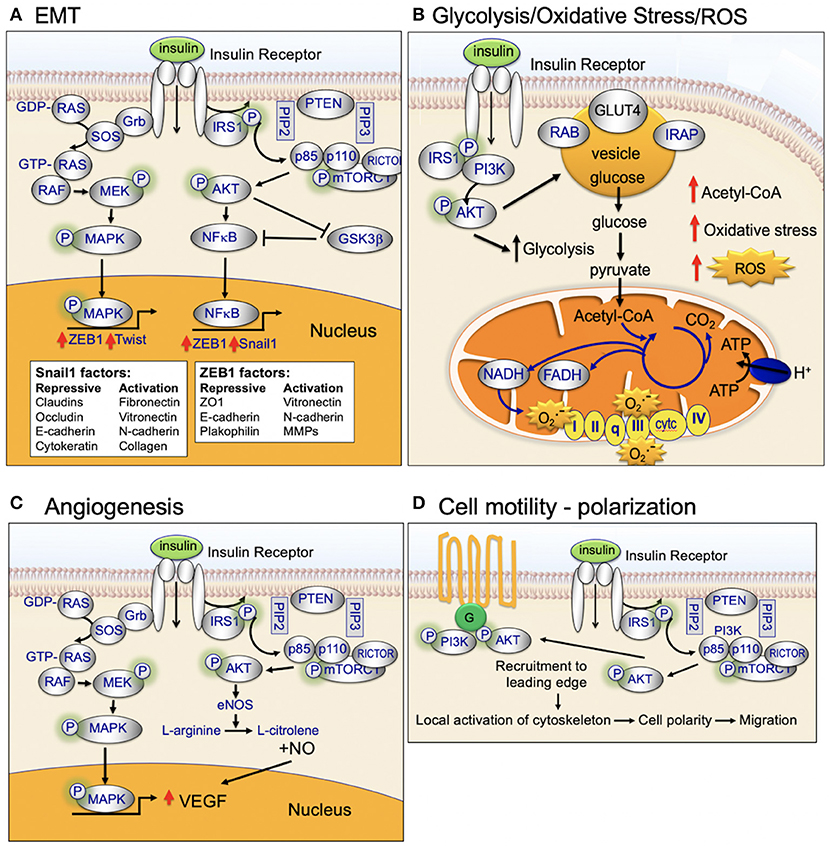
Figure 6. Insulin-signaling in (A) EMT, (B) Glycolysis, oxidative stress, and ROS, (C) Angiogenesis, and (D) Cell motility and polarization.
Oxidative Stress
Mitochondria are the major sites of cellular reactive oxygen species (ROS) production (Figure 4) (45). Mitochondrial ROS production primarily occurs at complex I (NADH CoQ reductase) and complex III (bc1 complex) (45). Increased ROS production occurs when excess electrons are provided to the mitochondrial respiratory chain: (1) excess electrons are transferred to oxygen and (2) oxygen is converted to superoxide and then to hydrogen peroxide (45). ROS production occurs when the TCA-driven/mitochondrial electron transport-driven proton gradient is high and oxygen consumption/ATP demand is low (45). High calorie intake combined with lack of exercise can (1) increase TCA-driven/mitochondrial electron transport, (2) reduce demand for ATP, and (3) increase ROS production. High levels of ROS damages DNA, proteins, and the lipid bilayer (119, 120).
High ROS production plays an important role in cancer initiation and progression (121). ROS activates pro-oncogenic signaling pathways that play a key role in aggressive breast cancer biology, include RAS, c-MYC, and Wnt/beta-catenin. High ROS production during cancer initiation is linked to high mitochondrial respiration/dysfunction and low coupling-efficiency of the mitochondrial electron transport chain (122). Cancer cells maintain their high energy levels through high aerobic glycolysis (Warburg effect; metabolic switch). This metabolic switch is required for the cancer cells to adapt to the hypoxic tumor microenvironment (123).
Cell Motility
Insulin activates both MAPK (RAS/RAF/mitogen activated protein kinase) and PI3K/AKT-signaling (Figure 2). This dual-pathway activation is important for insulin's ability to promote cellular motility and cancer cell invasion (Figure 6).
MAPK-signaling plays a key role in motility and invasion. Under nutrient-rich circumstances, IGF-1 binds to the IGF-1 receptor (IGF-1R) leading to downstream phosphorylation-cascades that activates RAS, RAF, ERK, and MAPK (Figure 2) (124).
Insulin activates AKT. AKT exhibits differential cellular localization in stationary vs. motile cells. Stationary epithelial cells display apical–basal polarity and exhibit an even distribution of basal level of phosphorylated AKT on the plasma membrane, overlapping with cortical actin filaments (125). Twist promotes cell motility through cleavage of intercellular junctions and alterations in cell polarity (apical–basal to front–rear polarity) (126). During Twist-regulated mobility, activated AKT colocalizes with strengthened actin bundles at the leading edge of mobile cells (125). Activated AKT at the leading edge participates in (1) regulation of cell polarity, (2) reorganization of the cytoskeleton, (3) contraction of the cellular body, and (4) thereby promotes cell migration (125).
There is emerging evidence that AKT activation promotes cell motility through direct modulation of cytoskeleton-proteins, including actin and vimentin. Cell motility requires the dynamic remodeling of the cytoskeleton resulting in changes in cell morphology and polarity. Actin has been shown to preferentially bind to phosphorylated AKT at pseudopodia with enhanced bundles (127, 128). The AKT phosphorylation enhancer (APE) protein, or girders of actin filaments (girdin), is an actin-binding protein that maintains the integrity of actin filaments. APE/girdin has been shown to regulate the actin cytoskeleton at the leading edge of migrating cells (125). Depletion of APE/girdin destabilizes actin bundles and depletes actin stress fibers, resulting in loss of directional migration (125). The cytoskeletal protein vimentin is also regulated by AKT1. Phosphorylated AKT1 phosphorylates vimentin at serine-39 (vimentin-pSer39) (129); vimentin-pSer39 is protected from degradation and has been shown to promote invasion (116).
Rho GTPases regulate cell cytoskeleton organization, migration, transcription, and proliferation (130). Rho proteins belong to the RAS superfamily and are activated when bound to GTP (130). Rho controls the stress fibers and focal adhesion formation. Rho downstream proteins Rac and Cdc42, regulate membrane ruffling and filopodium formation, respectively (130). Rho/Rac/Cdc42-signaing participates in dynamic reorganization of the actin cytoskeleton and promotes cell motility (130). Insulin activates AKT which, in turn, activates Rac signaling and promotes cellular motility and invasion (125, 131).
Epithelial to Mesenchymal Transition (EMT)
EMT is a cellular process critical for normal embryonic organogenesis. Dysregulation of EMT is frequently observed in biologically aggressive cancers, including breast cancer, and promotes invasion, metastasis, and poor survival (131). Key transcription factors that promote dysregulated EMT during cancer initiation and progression include Snail, Twist, and Zeb. Over the past 10 years, there have been many studies investigating the link between activated AKT and EMT-transcription factor signaling (Figure 6).
Snail is a transcription factor that promotes EMT, migration, and invasion. Snail is phosphorylated by GSK3β in normal epithelial cells. Snail is expressed at low levels in normal cells. Under normal cellular homeostasis, GSK3β phosphorylates Snail and thereby promotes continuous degradation (132, 133). However, in the presence of insulin signaling, active AKT phosphorylates GSK3β, inactivating GSK3β, and stabilizes Snail. Activated AKT2 has been shown to directly stabilize Snail1 binding to the CDH1 (E-cadherin gene) promoter through direct protein–protein interaction (134). A second EMT transcription factor, Twist, has been shown to bind directly to, and activate, AKT2 transcription in breast cancer cells (135, 136). AKT has been shown to phosphorylate and activate Twist1 (137–139). Recent data also provides evidence that the polycomb group protein, Bmi-1, is a downstream target of Twist1 and a key regulator of EMT and cancer metastasis (140). AKT has been shown to directly phosphorylate Bmi-1 (141). Taken together, these studies demonstrate an important role for insulin and activated AKT in regulating and interaction with EMT transcription factors and promoting EMT and invasion (125).
Hyperinsulinemia Promotes Tissue Inflammation
Insulin activates PI3K/AKT-signaling and downstream NFκB. NFκB is a major regulator of tissue inflammation. NFκB increases production of (1) inflammatory cytokines including interleukin-1 (IL-1), IL-2, IL-6, IL-8, IL-12, and TNF-α and (2) chemokines MCP-1, MCP-2, CXCL1, CXCL10, and RANTES (142). Together, these highly potent cytokines and chemokines promote tissue inflammation and angiogenesis. NFκB also plays an important role in immune cell activation, differentiation, and macrophage switching from an M2 to M1 phenotype (142). NFκB plays a central role in regulating T-cell differentiation. Upon activation, CD4+ T-cells differentiate into effector T-cells including Th1, Th2, and Th17 cells; Th1 and Th17 are inflammatory T-cells and secrete interferon-gamma (INF-γ) (142).
Hyperinsulinemia also promotes macrophage switching and macrophage-mediated inflammation (143). Activation of PI3K/AKT- and NFκB-signaling as well as generalized tissue inflammation promotes an increase in the ratio of M2 (anti-inflammatory) to M1 (pro-inflammatory) macrophages (144). This increase in the ratio of M2/M1 macrophages results in an increase in tissue inflammation, particularly in adipose tissue (144). There is also evidence that this increase further increases insulin resistance of muscle. There is also evidence that insulin has complex effects on macrophage polarization and function [for further discussion of this evolving area of research, see Kraakman et al. (144)].
Inflammation Promotes Insulin-Resistance
As early as the 1800's, physicians discovered that high dose (now known to be anti-inflammatory) salicylates (5.0–7.5 g/d) reduced glycosuria in diabetic patients (78, 79, 145, 146). Subsequently, Hotamisligil and Karasik (147–149) first showed that that the overproduction of the proinflammatory cytokine tumor necrosis factor-alpha (TNF-α) by adipocyte tissue could induce insulin-resistance. The concept that a substance overproduced by adipose could regulate glucose tolerance and metabolism was groundbreaking (78, 150, 151). Subsequent research identified adipose tissue as a key producer of inflammatory cytokines and chemokines that included, leptin, IL-6, resistin, monocyte chemoattractant protein-1 (MCP-1), PAI-1, angiotensinogen, visfatin, retinol-binding protein-4, and serum amyloid A (SAA) (78, 152–156).
Leptin and adiponectin are true adipokines that appear to be produced exclusively by adipocytes; leptin expression increases with increased adiposity; adiponectin expression decreases with increased adiposity (78, 157). The inflammatory cytokines TNF-α, IL-6, MCP-1, visfatin, and PAI-1 are produced in both adipocytes and activated macrophages found in obese and insulin-resistant individuals (78). Resistin production is less well-understood and includes macrophages in humans but both adipocytes and macrophages in rodents (78, 154). In obese individuals, TNF-α, IL-6, and resistin promote subacute inflammation and MCP-1 plays a role in recruiting macrophages to adipose tissue (78). Together, these inflammatory cytokines and chemokines activate intracellular pathways that promote insulin-resistance and, ultimately, type-2 diabetes (78).
Inflammation Promotes Atherosclerosis
Hyperinsulinemia and tissue inflammation is also closely linked to atherosclerosis (78). In obese individuals TNF-α, IL-6, and resistin promote subacute vascular inflammation associated with upregulation of cell adhesion molecules P- and E-selectin, ICAM-1, and VCAM-1, that (1) act to localize circulating immune cells, (78, 158, 159) and (2) increase local production of inflammatory cytokines and chemokines that include MCP-1 and macrophage inflammatory protein-1α (MIP-1α), MIP-1β, MIP-2, and MIP-3α (78, 160–162). T-cells are activated in this inflammatory pro-atherosclerosis microenvironment and produce IFN-γ and lymphotoxin. Activated macrophages, endothelial cells, and smooth muscle cells produce TNF-α (78, 160, 161). Together, these processes increase local production of IL-6 in the atheroma (162, 163). Engagement of CD40 and CD40 ligand increases local production of matrix-metalloproteases (MMPs) (164). MMPs in turn break down collagen and promote thrombosis (164, 165).
Angiogenesis
Angiogenesis is a key process in cancer initiation and metastasis. Endothelial cells and pericytes are two key cell types that participate in vessel formation and maturation and both endothelial cells and pericytes express the insulin receptor (166). Insulin, through insulin-receptor network signaling regulates endothelial cell migration, proliferation, and production of VEGF vascular growth factors (Figure 6) (166). Emerging evidence highlights an important role for insulin signaling in deregulation of normal angiogenesis [see Escudero et al. for a review of this topic (166)]. Insulin activates MAPK leading to increased endothelial cell survival and proliferation. In addition, insulin activation of PI3K/AKT signaling promotes increased nitric oxide release. Nitric oxide increases endothelial survival, migration, proliferation, and vascular permeability (166).
BMI Does Not Always Reflect Metabolic Health
BMI—An Inexact Measure
The most frequently used measure of adiposity is BMI ≥30 kg/m2 (Centers for Disease Control and Prevention, https://www.cdc.gov/obesity/adult/defining.html, accessed 4/3/2017). While BMI is a commonly used measure, the appropriateness of BMI as a phenotypic marker of adiposity across populations differing in race and ethnicity is highly controversial. BMI is an inexact measure of metabolic dysfunction; comparing BMI between individuals of different races and ethnicities has inherent problems (167, 168).
BMI is a measure of mass (kilograms or pounds) per area (meters-squared or inches-squared; BMI is not a direct measure of obesity. Muscle weighs more than fat; consequently lean, muscular individuals can be misclassified overweight or obese when BMI is used as the sole measure of adiposity (169, 170). Furthermore, the relationship between BMI and adiposity varies significantly between different races and ethnic groups. The relationship(s) between body shape/composition and disease is an inexact science and only beginning to be understood (59, 169, 170). It is well-recognized, however, that African-Americans/Blacks have higher muscle mass than non-Hispanic Whites and Asians (59).
There is a second problem with using BMI as a surrogate measure for metabolic health. The BMI threshold for type-2 diabetes risk markedly varies in individuals of different races and ethnicities (59). In a large multiethnic cohort study, for an equivalent incidence rate of type-2 diabetes conferred by a BMI of 30 kg/m2 in non-Hispanic Whites, the BMI was found to be 26 kg/m2 in African-Americans/Blacks, 25 kg/m2 in Chinese-Americans, and 24 kg/m2 in South Asians (171, 172). Consequently, a non-Hispanic White woman with a BMI of 25 mg/m2 is likely to be metabolically healthy, while an Asian woman with the same BMI has a high likelihood of being pre-diabetic or even diabetic (171, 172). Taken together, these studies provide evidence that body composition and/or the insulin-sensitivity of peripheral muscle tissue could play a role in determining metabolic health of individuals of diverse races and ethnicities.
Metabolically Unhealthy Normal-Weight and Metabolically Healthy Obese Individuals
Over the past 20 years, there is increasing recognition that obese individuals (BMI >30 kg/m2) can have normal metabolic profiles, “metabolically healthy obese” (173–176). While the precise definition of “metabolically healthy obese” varies, the generally accepted definition is individuals with a BMI > 30 kg/m2 who do not have insulin-resistance, type-2 diabetes, dyslipidemia, or hypertension (175–178).
In contrast to individuals who are obese but metabolically healthy, there are also individuals with a normal BMI (BMI < 25 kg/m2) who have abnormal metabolic profiles and increased cardiovascular risk. These individuals were first described by Ruderman et al. as hyperinsulinemic, insulin resistant, hypertriglyceridemic, and predisposed to subsequent development of type 2 diabetes mellitus and coronary artery disease (179). Currently there is no consistent definition, but the generally accepted definition includes (1) BMI < 25 kg/m2, (2) metabolic abnormalities that include insulin resistance, hypertriglyceridemia, (3) abdominal fat distribution, and (4) elevated blood pressure (179). Most studies set the cutoff as three or more metabolic derangements to fulfill “metabolically unhealthy” definition.
Racial and Ethnic Differences in Insulin-Sensitivity
Peripheral muscle tissue is the major determinant of insulin-sensitivity; this is why exercise is thought to have such a key impact on improving insulin-sensitivity and metabolic health in insulin resistant individuals. It is known that that African-Americans/Blacks have lower insulin sensitivity of their peripheral muscles than non-Hispanic White women (59, 180). Lower peripheral insulin sensitivity in African-American/Black women compared to non-Hispanic White women could account for these differences and, thus, make is difficult to determine “metabolically healthy” BMI cut off points (172).
Asians and Underdiagnosis of Insulin-Resistance
Asians have a disproportionately increased incidence of diabetes mellitus relative to other racial and ethnic groups, in the United States and worldwide. By the International Diabetes Federation estimates for 2017, China and India have the largest number of people 20–79 years old with diabetes at 114.4 and 72.9 million, respectively, compared to the next highest in the United States at 30.2 million (IDF Diabetes Atlas, 8th edition 2017, https://www.idf.org/e-library/epidemiology-research/diabetes-atlas/134-idf-diabetes-atlas-8th-edition.html). Western influences on lifestyle including diet and physical activity likely contribute this burgeoning problem in China, India, and other parts of Asia as well as in the United States for Asian-Americans.
Asians tend to have increased adiposity, and in particular higher visceral fat, relative to Caucasians and other non-Asians within the same range of body mass index (BMI). For a given BMI, Asian-Americans have a higher likelihood of developing diabetes compared to non-Hispanic whites (181). BMI does not accurately screen for visceral adiposity, such that standard BMI cut-off points based on non-Hispanic Caucasian populations underestimate obesity-related health risks in Asians (182). The international BMI cut-off points of the World Health Organization are not applicable to Asians for risk assessment and potential intervention to prevent and treat obesity-related diseases such as diabetes. In considering the different associations of BMI, body fat, and disease in Asians vs. Caucasians, coupled with highly heterogeneous Asian subpopulations, the WHO expert consultation of 2002 did not recommend a change in international standard cut-off points for BMI and instead identified public health action points along the BMI continuum for guidance in tailoring BMI cut-off points for a specific country (23). For Asian-Americans, the optimal BMI cut-off point may vary for different subpopulations (183). Based on consolidated data from multiple population and community-based studies of Asian-Americans, screening for BMI ≥ 25 kg/m2 would have missed 36% of diabetics; screening at a lower BMI ≥ 23 kg/m2 increased the sensitivity from 63.7 to 84.7% and missed 15% of diabetic Asian-Americans (184). For identifying Asian-Americans to screen for undiagnosed diabetes, Araneta et al. therefore suggest a BMI cut-off point of ≥23 and <25 kg/m2 (184). In 2015, the American Diabetes Association revised the BMI criteria for diabetes screening from ≥25 to ≥23 kg/m2 for all Asian-Americans <45 years of age; possibly a lower BMI cut-off is needed to screen for pre-diabetes (185). Notably, Asian-Americans are the least likely racial and ethnic group to undergo recommended diabetes screening, with 34% lower adjusted odds relative to non-Hispanic white Americans in the 2012–2014 Behavioral Risk Factor Surveillance System database (186).
Reduction in insulin secretory function in Asians relative to insulin resistance may contribute to increased risk of diabetes. In studies of Japanese patients, impaired insulin secretion seems the main driver of diabetes and prediabetes, with lesser role for insulin resistance (187, 188). Interestingly, in a study of pancreatic tissue obtained from diabetic and non-diabetic Korean patients, non-obese patients with type 2 diabetes had ~50% decreased volume of β-islet cells compared to BMI-matched patients without diabetes, raising the possibility that lower BMI and smaller β-islet cell mass might underlie the pathogenesis of diabetes in non-obese Koreans (189).
Standard screening tests may miss diagnoses of diabetes in Asians. In a study of 1214 Asian-American participants without prior diabetes diagnosis, HgbA1c failed to diagnose ~50% of Asian-Americans with diabetes; 44% of participants were diagnosed by post-prandial glucose levels (184).
Epidemiology Studies Supporting the Link Between Insulin and Breast Cancer
The majority of studies have focused on investigating the potential link between BMI and breast cancer subtypes. More recently, studies have investigated the potential link between parameters of metabolic health such as insulin and HgbA1c. The American Diabetes Association and the American Cancer Society issued a 2010 consensus report stating that type-2 diabetes was associate with cancers, including breast (35). A recent meta-analysis of 23 studies found diabetes to be associated with an increased mortality hazard ratio (HR) of 1.41 (95% CI 1.28–1.55) in individuals with cancer, including breast (36). A meta-analysis of Israeli non-diabetic women followed for over 35 years, investigated the potential link between basal- and fasting-insulin levels and risk for breast, colon/rectal, and bladder cancer (37). Basal insulin level was not significantly associated with cancer of the breast, colon/rectum, or bladder). Fasting insulin in the upper quartile conferred a 37% increased risk for total mortality among cancer patients, adjusting for age and ethnic origin (95% CI 0.94–2.00, P = 0.097) compared with that of the lower quartiles (37). This long-term cohort study may suggest a role for basal elevated insulin levels, mainly as a negative predictor in cancer prognosis (37). This is consistent with studies showing that individuals with type-2 diabetes who are treated with insulin have an increased risk for malignancies, including breast cancer (38).
Insulin-Signaling and Breast Cancer Biology
As discussed above (section Complex Relationship Between Obesity and Breast Cancer) BMI and obesity have not been consistently associated with increased risk with premenopausal TNBC. However, as also discussed above (section BMI Does not Always Reflect Metabolic Health), BMI and obesity do not consistently predict metabolic health; individuals can be normal weight and metabolically unhealthy; conversely individuals can be obese and metabolically healthy. Recent studies provide evidence that metabolic health (rather than BMI) may be a better predictor of breast cancer risk (Table 1B). Combined metabolic dysfunction and obesity in post-menopausal women have been shown to be a stronger predictor of breast cancer risk than obesity alone (39). In the Sister Study, women with BMI <25 kg/m2 and ≥1 metabolic abnormality (metabolically unhealthy; normal weight) vs. women BMI <25 kg/m2 and no metabolic abnormality (metabolically healthy; normal weight) had increased risk of post-menopausal breast cancer (40). In a third study, post-menopausal women with normal BMI, high body adipose tissue was associated with increased (1) metabolic dysfunction and circulating inflammatory factors and (2) risk of invasive breast cancer (41). In the Women's Health Initiative Observational Study, hyperinsulinemia was found to be an independent risk factor for post-menopausal breast cancer (42). These studies in post-menopausal women provide evidence that metabolic dysfunction, rather than BMI may be a better predictor of breast cancer risk; additional studies are needed to evaluate the potential relationship between metabolic dysfunction, insulin, and breast cancer risk in premenopausal women. Below are mechanisms that could account for a potential link between hyperinsulinemia and breast cancer risk.
PI3K/AKT/mTOR
As detailed above, insulin signaling activates PI3K/AKT/mTOR; PI3K/AKT/mTOR signaling promotes proliferation, apoptosis-resistance, and invasion (125, 190–194). TNBCs are ER-/PR- and HER2-not amplified. TNBC occur most frequently in BRCA1 mutation carriers and young African-American/Black women and frequently carry a poor prognosis (59). Basal-type breast cancers are a subtype of TNBC that are identified by specific gene expression patterning (59). In basal-type breast cancer, the Tumor Genome Atlas showed in basal-type breast cancer that the PI3K/AKT/mTOR-signaling pathway was frequently activated (192, 194). AKT activation (over expression of phosphorylated-AKT) predicts poor prognosis in women with breast cancers, but not all studies show a consistent association (193). A recent systematic review tested for the association of phospho-AKT expression in breast cancer with overall survival and disease-free survival (193). In this systematic review, 33 studies (9,836 women) were evaluated from three diverse electronic databases: (1) PubMed, (2) EMBASE, and (3) Chinese Biomedical. In women with breast cancer, overexpression of phosphorylated AKT was associated with worse overall survival and disease-free survival, respectively, 1.52 (95% CI: 1.29–1.78) and 1.28 (95% CI: 1.13–1.45) (193). Worse overall survival was predicted in all breast cancer subgroups (193). Taken together, these studies provide evidence that activation of AKT-signaling is an adverse prognostic factor in breast cancer and support the rational for normalizing insulin-driven PI3K/AKT/mTOR-signaling pathway in women with breast cancer and woman at risk for breast cancer.
Glycolysis
Biologically aggressive breast cancers, particularly TNBC and poor prognosis luminal B breast cancers (ER+/HER2-wt or -amplified, Ki67 ≥14%) frequently exhibit high glucose consumption and aerobic glycolysis (195, 196). Aggressive cancer cells are known to become glucose dependent and generate a larger proportion of their energy via aerobic glycolysis (Warburg effect) as opposed to mitochondrial oxidative phosphorylation (TCA cycle) (197). The Warburg effect directly contributes to the aggressive biology of cancers by increasing glycolysis/glucose uptake, which supplies anabolic precursors for rapid growth and promotes mitochondrial dysfunction that leads to apoptosis-resistance. Dysregulation of PI3K/AKT/mTOR-signaling is a regulator of aerobic glycolysis (194, 197–199) and provides scientific rational for controlling insulin-activation of PI3K/AKT/mTOR in both women with breast cancer and at-risk women.
Immune Cell Switching, and a Pro-tumorigenic Tissue Microenvironment
As discussed above, there is emerging evidence that insulin signaling plays a role in macrophage switching during cancer initiation and progression. In addition, there is increasing evidence that T-cell subsets and macrophages can promote the aggressive biology of TNBC. T-cells and macrophages can either inhibit or promote tumorigenesis. Classically activated macrophages (M1-type) are regulated by TH1 cytokines (e.g., IFNγ or TNFα); M1 macrophages possess enhanced cytotoxic activity and are anti-tumorigenic (200), however, when tissue is exposed to inflammatory cytokines (e.g., leptin, IL-6, IL-8, IL-12, CCL2, and IL-1β), there is a switch from M1 macrophages to alternatively activated macrophage (M2-type) (59, 200, 201). In non-cancerous tissue, M2 macrophages play a key role in tissue repair. However, there is increasing evidence that activated M2 macrophages promote the aggressive biology of TNBC. M2 macrophages are found in high numbers in stroma of TNBC (59, 202). M2 macrophages secrete epithelial growth factor (EGF) and tumor growth factor-beta (TGFβ). Poor prognosis TNBC is characterized by activation of EGF- and TGFβ-signaling. EGF and TGFβ both promote invasion, metastasis, and progenitor-cell turnover. Emerging evidence shows that EGF and TGFβ-signaling contributes to a pro-tumorigenic microenvironment that contributes to initiation and progression of TNBC (203, 204). Taken together, these observations underscore a potential mechanistic link between insulin, M2 macrophage production of EGF and TGFβ, and aggressive TNBC biology.
Treatment of Insulin-Resistance and Biology of Metformin
Treatment of obesity-related end-organ failure (type-2 diabetes) is expensive. However, much of our efforts in preventing diabetes through diet and exercise have not been successful and type-2 diabetes is frequently not diagnosed until complications occur. This has led to a call for early screening and treatment of individuals at high-risk for type-2 diabetes.
Metformin
Metformin (1,1-dimethylbiguanide hydrochloride) is a well-tolerated oral biguanide hypoglycemic agent that is prescribed to over 120 million type-2 diabetic patients worldwide (https://www.drugs.com/monograph/metformin-hydrochloride.html). Metformin is prescribed for first-line treatment of type-2 diabetes (https://www.drugs.com/monograph/metformin-hydrochloride.html) (56, 205–207) and is also approved for treatment of polycystic ovary syndrome and gestational diabetes (https://www.drugs.com/monograph/metformin-hydrochloride.html) (207). Metformin is generally well-tolerated (208). Common side effects include diarrhea, nausea, and epigastric pain (https://www.drugs.com/monograph/metformin-hydrochloride.html). Metformin inhibits hepatic gluconeogenesis and decreases intestinal absorption of glucose, secondarily decreasing circulating insulin (https://www.accessdata.fda.gov/drugsatfda_docs/label/2006/021748s002lbl.pdf). Metformin is also thought to indirectly increase insulin sensitivity by increasing peripheral glucose uptake and utilization (https://www.accessdata.fda.gov/drugsatfda_docs/label/2006/021748s002lbl.pdf). Given its efficacy and excellent safety profile, metformin is on the World Health's Organization list of essential medicines and has been used for glucose control since the 1960's (http://www.who.int/medicines/publications/essentialmedicines/EML_2015_FINAL_amended_NOV2015.pdf?ua=1).
Metformin Mechanism of Action
Despite its long history of clinical use, the precise molecular mechanism(s) underlying metformin's insulin-lowering effects, as well as its potential anti-neoplastic potential, are not completely understood. It is well-established that metformin inhibits hepatic gluconeogenesis and secondarily lowers circulating insulin levels (Figure 7) (209). The secondary lowering of insulin by metformin inhibits insulin/IGF-1-signaling and downstream (1) PI3K /AKT/mTOR-network signaling and (2) RAS/RAF/mitogen activated protein kinase (MAPK) (Figure 7) (210, 211). Metformin activation of AMPK (1) inhibits complex-I in the mitochondrial electron transport chain (210, 212, 213), (2) reduces ATP production and increases binding of AMP to AMPK, and (3) increases the substrate affinity of AMPK for LKB1 (214). Metformin activation of AMPK-LKB1 inhibits AKT/mTOR-network signaling leading to downstream inhibition of S6-Kinase (S6K) and 4E binding protein-1 (4EB-1) (210).
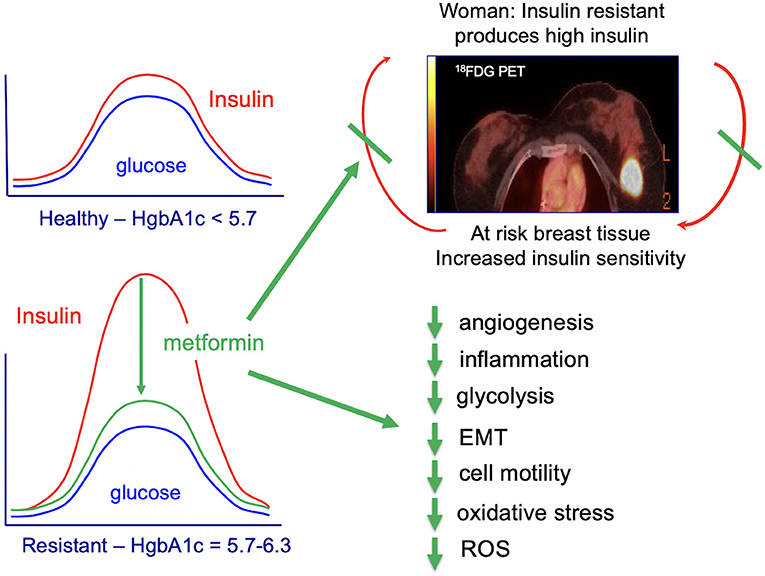
Figure 7. Impact of metformin on cancer processes.
Metformin Prevention of Type-2 Diabetes
There is increasing evidence that metformin, with or without lifestyle modification, in young, high-risk individuals can reverse and prevent type-2 diabetes. In the Diabetes Prevention Study (DPS), metformin was as effective as lifestyle modification in participants <60 years of age (208) and in women with a history of gestational diabetes metformin and intensive lifestyle modification led to a 50% reduction in the incidence of type-2 diabetes.
Several well-controlled studies show that it is possible to prevent type-2 diabetes through a combination of diet, exercise, and metformin. The Diabetes Prevention Program/Diabetes Prevention Program Outcomes Study (DPP/DPPOS) is the largest and longest clinical trial of metformin for the prevention of type-2 diabetes (215, 216). The DPP (1996–2001) was a randomized control trial that followed 3,234 adults from 1996 to 2001 who were, at baseline, at high-risk of developing diabetes. Participants were randomized to receive (1) placebo (n = 1,082), (2) metformin (n = 1,073) 850 mg twice daily, or (3) intensive lifestyle intervention (n = 1,079) (215, 216). The metformin/placebo intervention arm was terminated 1 year ahead of schedule because of demonstrated efficacy (215). The primary outcome was reported at 2.8 years. At the end of the DPP trial, 88% (n = 2,776) of the cohort elected to be evaluated in the DPPOS follow-up trial (215, 216).
Study participants in the DPP/DPPOS cohort have over 15 years prospective assessment of the impact of metformin and lifestyle modification on type-2 diabetes, cardiovascular events, and health, economic, and safety outcomes (215, 216). After an average follow-up of 2.8 years, metformin reduced the incidence of diabetes by 31% compared with placebo, with a greater effect in subjects who were obese or had a history of gestational diabetes (56). Analysis of the DPP/DPPOS trial showed that metformin was less effective than lifestyle modification in the DPP/DPPOS, but in obese individuals (body mass index >35 kg/m2), metformin was as effective a lifestyle modification (216). For women with a history of gestational diabetes, metformin and intensive lifestyle modification led to an equivalent 50% reduction in diabetes risk (217).
Based on findings from the DPP/DPPOS study, in 2014, the American Association of Diabetes published formal recommendations for prevention of type-2 diabetes (Table 2) (56). Recommendations included: individuals with impaired glucose tolerance or a HgbA1c 5.7–6.4% should be referred to a life-style modification to target 7% weight loss and moderate physical activity (e.g., walking) for 150 min/week. Metformin was recommended for prevention of type-2 diabetes in individuals with impaired glucose tolerance or HgbA1c 5.7–6.4%, especially in individuals with a BMI >35 kg/m2 and women with prior gestational diabetes. Treatment of insulin-resistance with metformin makes strong biological and economic sense. Metformin is cheap, safe (used routinely during pregnancy), and effective. Despite the fact that metformin prevention of type-2 diabetes in high-risk individuals is now standard of care in the United States, many clinicians continue to focus on exclusively on treatment of type-2 diabetes and not its prevention.
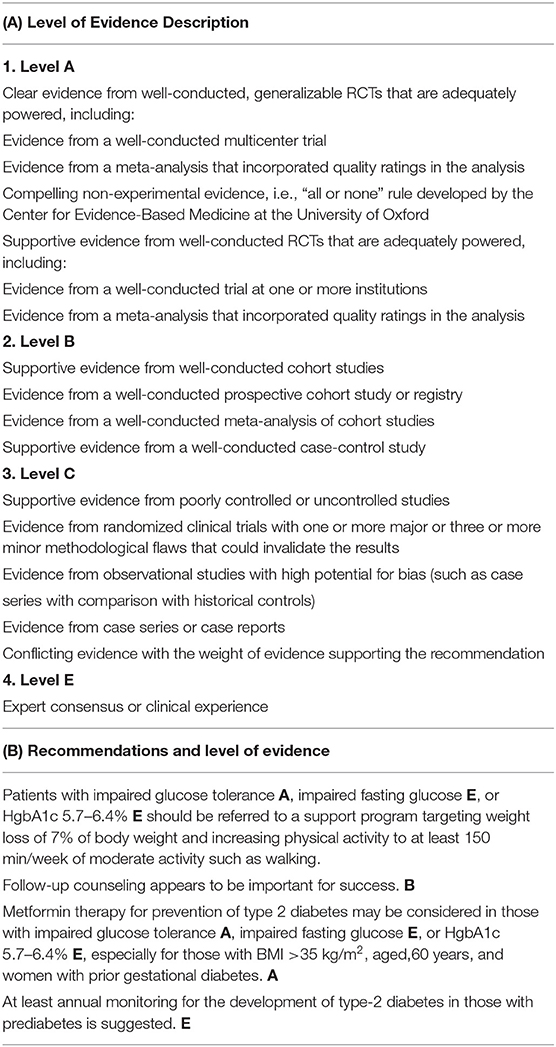
Table 2. American Diabetes Association for prevention of type-2 diabetes [summarized from ref (56)].
Time Points During Breast Cancer Prevention and Treatment Where Insulin Signaling Could be Better Controlled
Prevention—Current Opportunities
As discussed above, insulin activates many key-signaling pathways and cancer processes that are key for cancer initiation and progression including: EMT, cell migration and mobility, tissue inflammation, ROS production, glycolysis and, perhaps, angiogenesis (Figure 7). Metformin secondarily lowers circulating insulin and the many pro-cancer signaling pathways regulated by PI3K/AKT/mTOR (209). There are two major signaling pathways that are thought to account for metformin's potential anti-cancer activity: (1) AMPK (adenosine monophosphate (AMP)-activated protein kinase)-independent, driven by metformin's ability to secondarily lower serum insulin and (2) AMPK-dependent, regulated by metformin-suppression inhibition of mitochondrial complex-I (complex-I) (209); both pathways converge on mTOR; these actions support the use of metformin for prevention of biologically aggressive breast cancers (209).
Currently there is a lack of effective breast cancer prevention for women who are at risk for TNBC and women who carry germline BRCA1 mutations. Given that PI3K/AKT/mTOR is a key driver of the aggressive biology of TNBC and metformin inhibits PI3K/AKT/mTOR, there has been interest in testing whether metformin maybe effective for prevention of TNBC in BRCA1 germline mutation carriers. In addition to targeting PI3K/AKT/mTOR, metformin targets additional signaling networks regulated by AMPK. Metformin-targeting of AMPK for prevention of TNBC in BRCA1 mutation carriers has good rationale because of the dual signaling networks regulated by both AMPK and BRCA1, include acetyl coenzyme A carboxylase alpha (ACCA), p53, and PTEN (209, 218–220). AMPK regulates the phosphorylation/dephosphorylation cycles of ACCA (209). Given that AMPK and BRCA1 both inactivate ACCA, this provides a molecular mechanism by which metformin might substitute for loss of BRCA1 tumor suppressive function.
Over the past 10 years, there have been important efforts to repurpose drugs for breast cancer prevention. To this end, metformin is being actively tested for primary and secondary prevention of breast cancer [for a full review, see Heckman-Stoddard et al. (210) (Table 3)]. The largest adjuvant (secondary prevention) trial is NCIC MA.32, a phase III adjuvant breast cancer trial randomizing 3,649 women within 12 months of diagnosis to metformin 850 mg p.o. twice a day (850 mg/day during weeks 1–4) vs. placebo for 5 years (Table 3, NCT01101438) (http://clinicaltrials.gov/ct2/show/study/NCT01101438). The primary endpoint is invasive disease-free survival. Studies testing the impact of metformin in the unaffected breast include a study in women scheduled for a reduction mammoplasty that compares changes in LKB1 and AMPK signaling in women treated with metformin 500 mg twice a day (dose escalated) vs. no treatment (Table 3, ACTRN12610000219088) (http://apps.who.int/trialsearch/trial2.aspx?trialid=ACTRN12610000219088). There are two ongoing larger primary prevention studies one in overweight and obese premenopausal women with high breast density (Table 3, NCT01793948) and one testing metformin 850 mg bid in high-risk premenopausal women with cytologic atypia that allows for inclusion of women with germline BRCA1 and BRCA2 mutations (Table 3, NCT01905046) (210). Together, these trials will provide important evidence whether metformin is an effective agent for prevention of breast cancer.
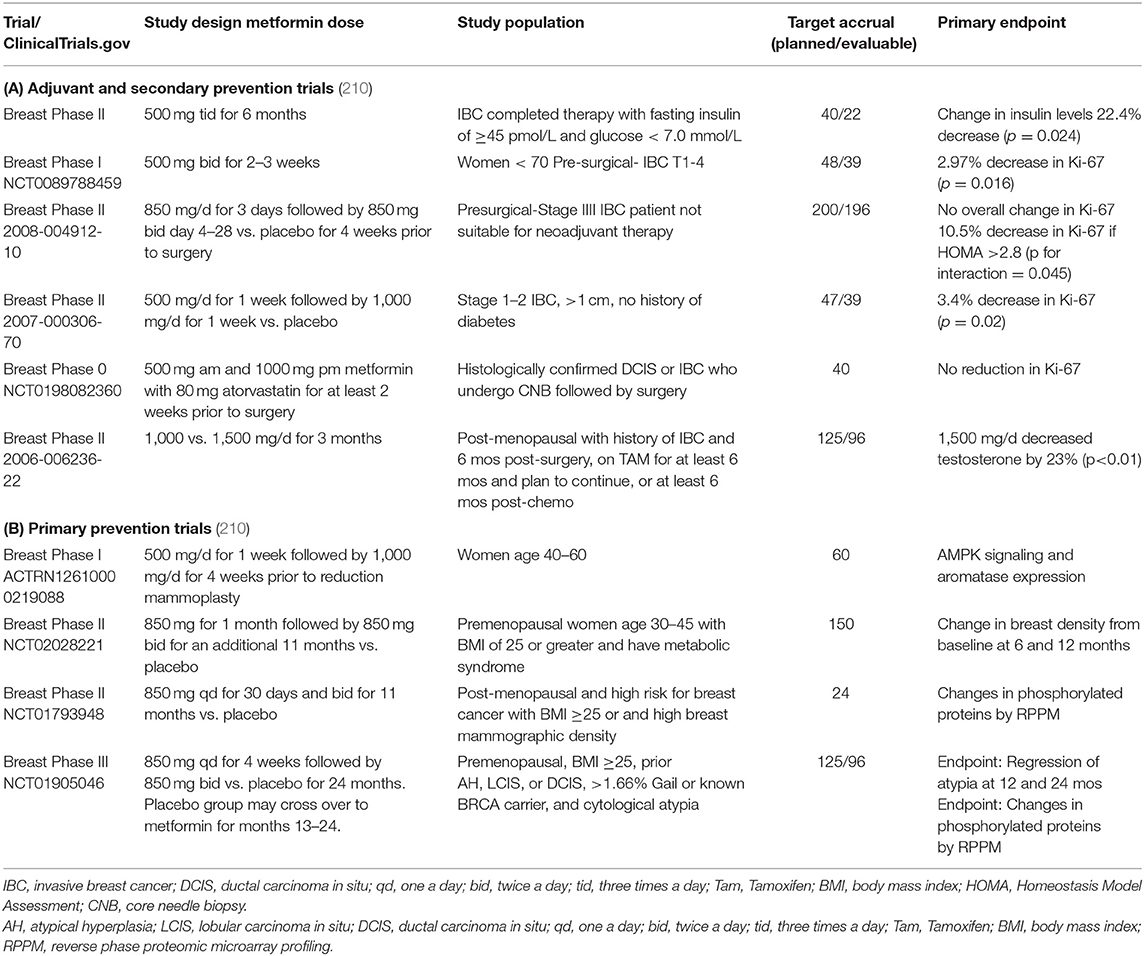
Table 3. Adjuvant, secondary prevention, and primary prevention trials utilizing metformin.
Pre-surgical Assessment
Hyperglycemia and insulin resistance are linked to increased perioperative morbidity in patients with and without diabetes mellitus. Surgery itself induces transient insulin resistance, which worsens with the extent and duration of the procedure, leads to hyperglycemia, and contributes to post-operative complications (221, 222). In comparison to diabetic patients with post-operative hyperglycemia, non-diabetic patients with post-operative hyperglycemia have worse post-operative outcomes including death (223, 224), which may relate to undiagnosed, uncontrolled diabetes mellitus and/or heightened stress response to surgery.
Based on analyses of the American College of Surgeons National Surgical Quality Improvement Program (NSQIP) database 2010–2015, diabetic patients undergoing partial, total, or subcutaneous mastectomy were at greater risk of early post-operative surgical site infection—both superficial (partial and total mastectomy) and deep (total and subcutaneous) tissue infections (225). For diabetic women undergoing breast reconstruction, NSQIP data showed increased superficial surgical site infection with delayed but not immediate implant based procedures (225) and increased deep incisional infection, wound dehiscence, and post-operative length of stay with free flap reconstruction (226). In a retrospective study of diabetes and impact on complications in breast cancer patients undergoing mastectomy with immediate reconstruction, women with diabetes had significantly increased incidence of delayed wound healing with implant-based reconstruction but not autologous procedures (227).
Given the high prevalence of undiagnosed pre-diabetes and diabetes in the United States and worldwide, preoperative screening to identify such patients prior to surgical intervention is warranted. Numerous studies have investigated the utility of preoperative testing via HgbA1c in addition to the usual practice of random or fasting blood glucose levels. An observational cohort study of inpatient gastrointestinal surgical procedures at Veterans Affairs hospitals from 2007 to 2014 suggested that knowledge of elevated preoperative HgbA1c led to greater perioperative vigilance in monitoring and treating hyperglycemia and improved clinical outcome (228). Using HgbA1c to categorize surgical patients as diabetic, prediabetic, or normoglycemic, Yong et al. demonstrated that diabetic patients (based on prior diagnosis or HgbA1c ≥ 6.5%) had increased post-operative complications including higher risk of mortality at 6 months; prediabetes (HgbA1c 5.7–6.4%) was not associated with increased risk for adverse surgical outcomes (229). In a prospective database study of emergency general surgery cases, patients with HgbA1c measurements ≥6% within the prior 3 months had increased risk for development of in-hospital complications (major 12% vs. 4%, minor 24% vs. 7%) irrespective pre-operative serum glucose or preexisting diagnosis of diabetes (230). The risk for developing major complications after emergency surgery was four times higher for patients presenting with both HgbA1c ≥ 6% and glucose ≥200 (230). Routine HgbA1c level screening has been adopted for high risk surgeries that involve a patient population at high risk for pre-diabetes/undiagnosed diabetes, such as joint arthroplasty (231).
In a review of 20 studies regarding perioperative glycemic control in diabetic patients and post-operative complications, elevated preoperative HgbA1c was not associated with increased post-operative morbidity and mortality in 20 selected studies; the authors, however, noted the need for good quality evidence in view of the heterogeneous, retrospective studies, and small patient numbers (232). To evaluate 2001–2013 evidence that preoperative testing of blood glucose and HgbA1c might affect outcome measures in elective non-cardiac surgery, a systematic review concluded that preoperative blood glucose and HgbA1c tests are only indicated in non-diabetic patients upon clinical situation of an abnormality or elevated risk such as vascular and orthopedic surgery (233). A systematic review of observational studies of non-diabetic patients with elevated preoperative HgbA1c showed increased post-operative complications in non-diabetic patients in four of the six reports, lending support for use of suboptimal HgbA1c levels as a modifiable marker of adverse post-operative outcomes (234). As noted by the authors of these systematic reviews, limitations relate to the paucity of high-quality studies, lack of randomized controlled trials, and high heterogeneity of available studies.
Factors That Promote Insulin-Resistance During Breast Cancer Chemotherapy
Women receiving breast cancer chemotherapy are extensively monitored for electrolyte and liver function abnormalities and neutropenia. While serum glucose is routinely tested, there is minimal attention to development of insulin-resistance during breast cancer treatment. This is a missed opportunity and represents an important opportunity for improving cancer care. Given the key role that insulin signaling plays in cancer processes, it is logical to ensure that women who are treated for breast cancer do not develop insulin-resistance.
Women who are treated for breast cancer experience stress, abnormal sleep patterns, overeating, administration of steroids, loss of body image, gastrointestinal disturbances, and immune suppression (235). Breast cancer survivors experience many treatment-associated changes, including weight gain, reduced physical activity levels, and metabolic syndrome (235–238). Metabolic syndrome is diagnosed when a woman has any three of the five following components: (1) waist circumference ≥80 cm (32 inches); (2) elevated triglycerides ≥150 mg/dL or on drug treatment for elevated hypertiglyceridemia; (3) reduced high-density lipoprotein cholesterol <40 mg/dL; (4) elevated blood pressure ≥130/85 mm Hg or on antihypertensive drug treatment; (5) elevated fasting blood glucose ≥100 mg/dL or on drug treatment for elevated glucose) (236–238). Metabolic syndrome and its associated factors, including obesity, physical inactivity, hyperinsulinemia, insulin resistance, elevated inflammatory biomarkers, and altered adipokines, are all linked with increased risks of breast cancer, all-cause mortality, and increased risk of breast cancer recurrence (236–238).
Joanne Mortimer's team from City of Hope prospectively investigated in pre- and post-menopausal women with Stage I–III breast cancer, the impact of neo-adjuvant chemotherapy on development of insulin-resistance and metabolic syndrome (235). A total of 86 previously healthy women (46 premenopausal; 40 post-menopausal) were tested for the components of metabolic syndrome before and after completion of neo-adjuvant chemotherapy. Also measured were HgbA1c, insulin-resistance, and C-reactive protein. The study demonstrated that all individual components of metabolic syndrome were statistically increased after chemotherapy (p < 0.01) (235). Body weight, percent body fat, fat mass, C-reactive protein, and HgbA1c were all increased as well (p < 0.01) (235). Taken together, this study highlights an important missed opportunity for optimizing cancer care and prevention of breast cancer recurrence.
Conclusions
While diabetes/insulin-resistance and breast cancer are distinct diseases, insulin-signaling plays a central role in both illnesses. Insulin activates key cancer processes including EMT, tissue inflammation, motility, and angiogenesis. There are key opportunities to impact and prevent hyperinsulinemia during breast cancer prevention, surgical assessment, and chemotherapy. While it is not standard of care to test for insulin-resistance during the course of breast cancer screening and treatment, it is standard of care to screen and test high risk women for insulin-resistance as part of whole woman care. Given the important role insulin signaling plays in driving signaling pathways that promote aggressive cancer biology, more attention should be paid by cancer physicians to screening and treating insulin resistance.
Author Contributions
VS organized the manuscript and wrote many of the sections. JM wrote the section on breast cancer medical oncology treatment and insulin resistance. LY wrote the sections on Asians and surgical complications and insulin resistance. RN cowrote the section on type 2 diabetes, progressive beta-cell failure, and decline in insulin production. ED cowrote the section on type 2 diabetes and progressive beta-cell failure.
Funding
This work was supported by National Institutes of Health/National Cancer Institute (NIH/NCI) grants R01CA155664, R01CA158668, R01CA170851, R01CA192914, and U01CA189283 (all to VS) and P30CA033572. The funders had no role in the manuscript design, data analysis, decision to publish, or preparation of the manuscript.
Conflict of Interest
The authors declare that the research was conducted in the absence of any commercial or financial relationships that could be construed as a potential conflict of interest.
References
1. Hawkes C. Uneven dietary development: linking the policies and processes of globalization with the nutrition transition, obesity and diet-related chronic diseases. Global Health. (2006) 2:4. doi: 10.1186/1744-8603-2-4
2. Cummins S, Macintyre S. “Food deserts”–evidence and assumption in health policy making. BMJ. (2002) 325:436–8. doi: 10.1136/bmj.325.7361.436
3. Torre LA, Islami F, Siegel RL, Ward EM, Jemal A. Global cancer in women: burden and trends. Cancer Epidemiol Biomarkers Prev. (2017) 26:444–57. doi: 10.1158/1055-9965.EPI-16-0858
4. Picon-Ruiz M, Morata-Tarifa C, Valle-Goffin JJ, Friedman ER, Slingerland JM. Obesity and adverse breast cancer risk and outcome: mechanistic insights and strategies for intervention. Cancer J Clin. (2017) 67:378–97. doi: 10.3322/caac.21405
5. Renehan AG, Tyson M, Egger M, Heller RF, Zwahlen M. Body-mass index and incidence of cancer: a systematic review and meta-analysis of prospective observational studies. Lancet. (2008) 371:569–78. doi: 10.1016/S0140-6736(08)60269-X
6. Cheraghi Z, Poorolajal J, Hashem T, Esmailnasab N, Doosti Irani A. Effect of body mass index on breast cancer during premenopausal and postmenopausal periods: a meta-analysis. PLoS ONE. (2012) 7:e51446. doi: 10.1371/journal.pone.0051446
7. Kyrgiou M, Kalliala I, Markozannes G, Gunter MJ, Paraskevaidis E, Gabra H, et al. Adiposity and cancer at major anatomical sites: umbrella review of the literature. BMJ. (2017) 356:j477. doi: 10.1136/bmj.j477
8. van den Brandt PA, Spiegelman D, Yaun SS, Adami HO, Beeson L, Folsom AR, et al. Pooled analysis of prospective cohort studies on height, weight, and breast cancer risk. Am J Epidemiol. (2000) 152:514–27. doi: 10.1093/aje/152.6.514
9. Warner ET, Hu R, Collins LC, Beck AH, Schnitt S, Rosner B, et al. Height and body size in childhood, adolescence, and young adulthood and breast cancer risk according to molecular subtype in the nurses' health studies. Cancer Prev Res. (2016) 9:732–8. doi: 10.1158/1940-6207.CAPR-16-0085
10. Baer HJ, Tworoger SS, Hankinson SE, Willett WC. Body fatness at young ages and risk of breast cancer throughout life. Am J Epidemiol. (2010) 171:1183–94. doi: 10.1093/aje/kwq045
11. Oh H, Boeke CE, Tamimi RM, Smith-Warner SA, Wang M, Willett WC, et al. The interaction between early-life body size and physical activity on risk of breast cancer. Int J Cancer. (2015) 137:571–81. doi: 10.1002/ijc.29272
12. Michels KB, Terry KL, Willett WC. Longitudinal study on the role of body size in premenopausal breast cancer. Arch Intern Med. (2006) 166:2395–402. doi: 10.1001/archinte.166.21.2395
13. Palmer JR, Adams-Campbell LL, Boggs DA, Wise LA, Rosenberg L. A prospective study of body size and breast cancer in black women. Cancer Epidemiol. Biomarkers Prev. (2007) 16:1795–802. doi: 10.1158/1055-9965.EPI-07-0336
14. Lee KR, Hwang IC, Han KD, Jung J, Seo MH. Waist circumference and risk of breast cancer in Korean women: a nationwide cohort study. Int J Cancer. (2018) 142:1554–9. doi: 10.1002/ijc.31180
15. Chen MJ, Wu WY, Yen AM, Fann JC, Chen SL, Chiu SY, et al. Body mass index and breast cancer: analysis of a nation-wide population-based prospective cohort study on 1 393 985 Taiwanese women. Int J Obesity. (2016) 40:524–30. doi: 10.1038/ijo.2015.205
16. Keinan-Boker L, Levine H, Derazne E, Molina-Hazan V, Kark JD. Measured adolescent body mass index and adult breast cancer in a cohort of 951,480 women. Breast Cancer Res Treatm. (2016) 158:157–67. doi: 10.1007/s10549-016-3860-6
17. Munsell MF, Sprague BL, Berry DA, Chisholm G, Trentham-Dietz A. Body mass index and breast cancer risk according to postmenopausal estrogen-progestin use and hormone receptor status. Epidemiol Rev. (2014) 36:114–36. doi: 10.1093/epirev/mxt010
18. Amadou A, Ferrari P, Muwonge R, Moskal A, Biessy C, Romieu I, et al. Overweight, obesity and risk of premenopausal breast cancer according to ethnicity: a systematic review and dose-response meta-analysis. Obesity Rev. (2013) 14:665–78. doi: 10.1111/obr.12028
19. Suzuki R, Orsini N, Saji S, Key TJ, Wolk A. Body weight and incidence of breast cancer defined by estrogen and progesterone receptor status–a meta-analysis. Int J Cancer. (2009) 124:698–712. doi: 10.1002/ijc.23943
20. Pierobon M, Frankenfeld CL. Obesity as a risk factor for triple-negative breast cancers: a systematic review and meta-analysis. Breast Cancer Res Treatm. (2013) 137:307–14. doi: 10.1007/s10549-012-2339-3
21. Yang XR, Chang-Claude J, Goode EL, Couch FJ, Nevanlinna H, Milne RL, et al. Associations of breast cancer risk factors with tumor subtypes: a pooled analysis from the Breast Cancer Association Consortium studies. J Natl Cancer Instit. (2011) 103:250–63. doi: 10.1093/jnci/djq526
22. Nichols HB, Schoemaker MJ, Wright LB, McGowan C, Brook MN, McClain KM, et al. The premenopausal breast cancer collaboration: a pooling project of studies participating in the National Cancer Institute Cohort Consortium. Cancer Epidemiol Biomarkers Prev. (2017) 26:1360–9. doi: 10.1158/1055-9965.EPI-17-0246
23. Consultation WHOE. Appropriate body-mass index for Asian populations and its implications for policy and intervention strategies. Lancet. (2004) 363:157–63. doi: 10.1016/S0140-6736(03)15268-3
24. Guo Y, Warren Andersen S, Shu XO, Michailidou K, Bolla MK, Wang Q, et al. Genetically predicted body mass index and breast cancer risk: mendelian randomization analyses of data from 145,000 women of European descent. PLoS Med. (2016) 13:e1002105. doi: 10.1371/journal.pmed.1002105
25. Collaborators GBDO, Afshin A, Forouzanfar MH, Reitsma MB, Sur P, Estep K, et al. Health effects of overweight and obesity in 195 countries over 25 years. N Engl J Med. (2017) 377:13–27. doi: 10.1056/NEJMoa1614362
26. Colditz GA, Frazier AL. Models of breast cancer show that risk is set by events of early life: prevention efforts must shift focus. Cancer Epidemiol Biomarkers Prev. (1995) 4:567–71.
27. Premenopausal Breast Cancer Collaborative G, Schoemaker MJ, Nichols HB, Wright LB, Brook MN, Jones ME, et al. Association of body mass index and age with subsequent breast cancer risk in premenopausal women. JAMA Oncol. (2018) 4:e181771. doi: 10.1001/jamaoncol.2018.1771
28. Newman B, Moorman PG, Millikan R, Qaqish BF, Geradts J, Aldrich TE, et al. The Carolina Breast Cancer Study: integrating population-based epidemiology and molecular biology. Breast Cancer Res Treatm. (1995) 35:51–60. doi: 10.1007/BF00694745
29. Vona-Davis L, Rose DP, Hazard H, Howard-McNatt M, Adkins F, Partin J, et al. Triple-negative breast cancer and obesity in a rural Appalachian population. Cancer Epidemiol Biomarkers Prev. (2008) 17:3319–24. doi: 10.1158/1055-9965.EPI-08-0544
30. Berstad P, Coates RJ, Bernstein L, Folger SG, Malone KE, Marchbanks PA, et al. A case-control study of body mass index and breast cancer risk in white and African-American women. Cancer Epidemiol Biomarkers Prev. (2010) 19:1532–44. doi: 10.1158/1055-9965.EPI-10-0025
31. Rosenberg L, Adams-Campbell L, Palmer JR. The Black Women's Health Study: a follow-up study for causes and preventions of illness. J Am Med Women Assoc. (1995) 50:56–8.
32. McGee SA, Durham DD, Tse CK, Millikan RC. Determinants of breast cancer treatment delay differ for African American and White women. Cancer Epidemiol Biomarkers Prev. (2013) 22:1227–38. doi: 10.1158/1055-9965.EPI-12-1432
33. Ambrosone CB, Ciupak GL, Bandera EV, Jandorf L, Bovbjerg DH, Zirpoli G, et al. Conducting molecular epidemiological research in the age of HIPAA: a multi-institutional case-control study of breast cancer in African-American and European-American women. J Oncol. (2009) 2009:871250. doi: 10.1155/2009/871250
34. Bandera EV, Chandran U, Hong CC, Troester MA, Bethea TN, Adams-Campbell LL, et al. Obesity, body fat distribution, and risk of breast cancer subtypes in African American women participating in the AMBER Consortium. Breast Cancer Res Treatm. (2015) 150:655–66. doi: 10.1007/s10549-015-3353-z
35. Giovannucci E, Harlan DM, Archer MC, Bergenstal RM, Gapstur SM, Habel LA, et al. Diabetes and cancer: a consensus report. Diab Care. (2010) 33:1674–85. doi: 10.2337/dc10-0666
36. Barone BB, Yeh HC, Snyder CF, Peairs KS, Stein KB, Derr RL, et al. Long-term all-cause mortality in cancer patients with preexisting diabetes mellitus: a systematic review and meta-analysis. JAMA. (2008) 300:2754–64. doi: 10.1001/jama.2008.824
37. Dankner R, Shanik MH, Keinan-Boker L, Cohen C, Chetrit A. Effect of elevated basal insulin on cancer incidence and mortality in cancer incident patients: the Israel GOH 29-year follow-up study. Diab Care. (2012) 35:1538–43. doi: 10.2337/dc11-1513
38. Hemkens LG, Grouven U, Bender R, Gunster C, Gutschmidt S, Selke GW, et al. Risk of malignancies in patients with diabetes treated with human insulin or insulin analogues: a cohort study. Diabetologia. (2009) 52:1732–44. doi: 10.1007/s00125-009-1418-4
39. Kabat GC, Kim MY, Lee JS, Ho GY, Going SB, Beebe-Dimmer J, et al. Metabolic obesity phenotypes and risk of breast cancer in postmenopausal women. Cancer Epidemiol Biomarkers Prev. (2017) 26:1730. doi: 10.1158/1055-9965.EPI-17-0495
40. Park Y-MM, White AJ, Nichols HB, O'Brien KM, Weinberg CR, Sandler DP. The association between metabolic health, obesity phenotype and the risk of breast cancer. Int J Cancer. (2017) 140:2657–66. doi: 10.1002/ijc.30684
41. Iyengar NM, Arthur R, Manson JE, Chlebowski RT, Kroenke CH, Peterson L, et al. Association of body fat and risk of breast cancer in postmenopausal women with normal body mass index: a secondary analysis of a randomized clinical trial and observational study. JAMA Oncol. (2019) 5:155–63. doi: 10.1001/jamaoncol.2018.5327
42. Gunter MJ, Hoover DR, Yu H, Wassertheil-Smoller S, Rohan TE, Manson JE, et al. Insulin, insulin-like growth factor-I, and risk of breast cancer in postmenopausal women. J Natl Cancer Instit. (2009) 101:48–60. doi: 10.1093/jnci/djn415
43. Millikan RC, Newman B, Tse CK, Moorman PG, Conway K, Dressler LG, et al. Epidemiology of basal-like breast cancer. Breast Cancer Res Treatm. (2008) 109:123–39. doi: 10.1007/s10549-007-9632-6
44. Kolonel LN, Henderson BE, Hankin JH, Nomura AM, Wilkens LR, Pike MC, et al. A multiethnic cohort in Hawaii and Los Angeles: baseline characteristics. Am J Epidemiol. (2000) 151:346–57. doi: 10.1093/oxfordjournals.aje.a010213
45. Haeusler RA, McGraw TE, Accili D. Biochemical and cellular properties of insulin receptor signalling. Nat Rev Mol Cell Biol. (2018) 19:31–44. doi: 10.1038/nrm.2017.89
46. Roden M, Shulman GI. The integrative biology of type 2 diabetes. Nature. (2019) 576:51–60. doi: 10.1038/s41586-019-1797-8
47. Tabak AG, Jokela M, Akbaraly TN, Brunner EJ, Kivimaki M, Witte DR. Trajectories of glycaemia, insulin sensitivity, and insulin secretion before diagnosis of type 2 diabetes: an analysis from the Whitehall II study. Lancet. (2009) 373:2215–21. doi: 10.1016/S0140-6736(09)60619-X
48. Kasuga M. Insulin resistance and pancreatic beta cell failure. J Clin Invest. (2006) 116:1756–60. doi: 10.1172/JCI29189
49. Kahn SE. The relative contributions of insulin resistance and beta-cell dysfunction to the pathophysiology of Type 2 diabetes. Diabetologia. (2003) 46:3–19. doi: 10.1007/s00125-002-1009-0
50. Bailey CJ, Flatt PR. Islet defects and insulin resistance in models of obese non-insulin-dependent diabetes. Diabetes Metab Rev. (1993) 9(Suppl 1):43S−50S. doi: 10.1002/dmr.5610090508
51. Singh MP, Pathak K. Animal models for biological screening of anti-dibetic drugs: an overview. Euro J Exp Biol. (2015) 5:37–48.
52. Matsuba I, Saito K, Takai M, Hirao K, Sone H, Japan Diabetes Clinical Data Management Study G. Fasting insulin levels and metabolic risk factors in type 2 diabetic patients at the first visit in Japan: a 10-year, nationwide, observational study (JDDM 28). Diab Care.. (2012) 35:1853–7. doi: 10.2337/dc12-0156
53. Kendall DM, Cuddihy RM, Bergenstal RM. Clinical application of incretin-based therapy: therapeutic potential, patient selection and clinical use. Eur J Intern Med. (2009) 20(Suppl 2):S329–39. doi: 10.1016/j.ejim.2009.05.009
54. Leibowitz G, Kaiser N, Cerasi E. beta-Cell failure in type 2 diabetes. J Diabetes Investig. (2011) 2:82–91. doi: 10.1111/j.2040-1124.2010.00094.x
55. Ahlqvist E, Ahluwalia TS, Groop L. Genetics of type 2 diabetes. Clin Chem. (2011) 57:241–54. doi: 10.1373/clinchem.2010.157016
56. American Diabetes Association. Standards of medical care in diabetes-2019. Diab Care. (2019) 42(Suppl 1):S1–1803. doi: 10.2337/dc19-Sint01
57. Solomon CG, Willett WC, Carey VJ, Rich-Edwards J, Hunter DJ, Colditz GA, et al. A prospective study of pregravid determinants of gestational diabetes mellitus. JAMA. (1997) 278:1078–83. doi: 10.1001/jama.1997.03550130052036
58. Hedderson MM, Gunderson EP, Ferrara A. Gestational weight gain and risk of gestational diabetes mellitus. Obstet Gynecol. (2010) 115:597–604. doi: 10.1097/AOG.0b013e3181cfce4f
59. Dietze EC, Chavez TA, Seewaldt VL. Obesity and triple-negative breast cancer: disparities, controversies, and biology. Am J Pathol. (2018) 188:280–90. doi: 10.1016/j.ajpath.2017.09.018
60. Flegal KM, Kruszon-Moran D, Carroll MD, Fryar CD, Ogden CL. Trends in obesity among adults in the United States, 2005 to 2014. JAMA. (2016) 315:2284–91. doi: 10.1001/jama.2016.6458
61. Seidell JC, Halberstadt J. Obesity: the obesity epidemic in the USA - no end in sight? Nature Rev Endocrinol. (2016) 12:499–500. doi: 10.1038/nrendo.2016.121
62. Ogden CL, Carroll MD, Lawman HG, Fryar CD, Kruszon-Moran D, Kit BK, et al. Trends in obesity prevalence among children and adolescents in the United States, 1988-1994 through 2013-2014. JAMA. (2016) 315:2292–9. doi: 10.1001/jama.2016.6361
63. Ogurtsova K, da Rocha Fernandes JD, Huang Y, Linnenkamp U, Guariguata L, Cho NH, et al. IDF Diabetes Atlas: global estimates for the prevalence of diabetes for 2015 and 2040. Diab Res Clin Pract. (2017) 128:40–50. doi: 10.1016/j.diabres.2017.03.024
64. Dias JJ, Whitaker RC. Black mothers' perceptions about urban neighborhood safety and outdoor play for their preadolescent daughters. J Health Care Poor Underserv. (2013) 24:206–19. doi: 10.1353/hpu.2013.0018
65. Betz C, Hall MN. Where is mTOR and what is it doing there? J Cell Biol. (2013) 203:563–74. doi: 10.1083/jcb.201306041
66. Inoki K, Li Y, Xu T, Guan KL. Rheb GTPase is a direct target of TSC2 GAP activity and regulates mTOR signaling. Genes Dev. (2003) 17:1829–34. doi: 10.1101/gad.1110003
67. Inoki K, Li Y, Zhu T, Wu J, Guan KL. TSC2 is phosphorylated and inhibited by Akt and suppresses mTOR signalling. Nat Cell Biol. (2002) 4:648–57. doi: 10.1038/ncb839
68. Menon S, Dibble CC, Talbott G, Hoxhaj G, Valvezan AJ, Takahashi H, et al. Spatial control of the TSC complex integrates insulin and nutrient regulation of mTORC1 at the lysosome. Cell. (2014) 156:771–85. doi: 10.1016/j.cell.2013.11.049
69. Phillips MJ, Voeltz GK. Structure and function of ER membrane contact sites with other organelles. Nat Rev Mol Cell Biol. (2016) 17:69–82. doi: 10.1038/nrm.2015.8
70. Rutter GA, Pinton P. Mitochondria-associated endoplasmic reticulum membranes in insulin signaling. Diabetes. (2014) 63:3163–5. doi: 10.2337/db14-0812
71. Sarbassov DD, Guertin DA, Ali SM, Sabatini DM. Phosphorylation and regulation of Akt/PKB by the rictor-mTOR complex. Science. (2005) 307:1098–101. doi: 10.1126/science.1106148
72. Arruda AP, Pers BM, Parlakgul G, Guney E, Inouye K, Hotamisligil GS. Chronic enrichment of hepatic endoplasmic reticulum-mitochondria contact leads to mitochondrial dysfunction in obesity. Nat Med. (2014) 20:1427–35. doi: 10.1038/nm.3735
73. Jensen M, De Meyts P. Molecular mechanisms of differential intracellular signaling from the insulin receptor. Vitamins Hormones. (2009) 80:51–75. doi: 10.1016/S0083-6729(08)00603-1
74. Bergeron JJ, Di Guglielmo GM, Dahan S, Dominguez M, Posner BI. Spatial and temporal regulation of receptor tyrosine kinase activation and intracellular signal transduction. Ann Rev Biochem. (2016) 85:573–97. doi: 10.1146/annurev-biochem-060815-014659
75. Foley K, Boguslavsky S, Klip A. Endocytosis, recycling, and regulated exocytosis of glucose transporter 4. Biochemistry. (2011) 50:3048–61. doi: 10.1021/bi2000356
76. Huang S, Czech MP. The GLUT4 glucose transporter. Cell Metab. (2007) 5:237–52. doi: 10.1016/j.cmet.2007.03.006
77. Suzuki K, Kono T. Evidence that insulin causes translocation of glucose transport activity to the plasma membrane from an intracellular storage site. Proc Natl Acad Sci USA. (1980) 77:2542–5. doi: 10.1073/pnas.77.5.2542
78. Shoelson SE, Lee J, Goldfine AB. Inflammation and insulin resistance. J Clin Investig. (2006) 116:1793–801. doi: 10.1172/JCI29069
79. Ebstein W. Zur therapie des Diabetes mellitus, insbesondere uber die Anwendung des salicylsauren Natron bei demselben. Berliner Klinische Wochenschrift. (1876) 13:337–40.
80. Gilgore SG. The influence of salicylate on hyperglycemia. Diabetes. (1960) 9:392–3. doi: 10.2337/diab.9.5.392
81. Baron SH. Salicylates as hypoglycemic agents. Diab Care.. (1982) 5:64–71. doi: 10.2337/diacare.5.1.64
82. Yuan M, Konstantopoulos N, Lee J, Hansen L, Li ZW, Karin M, et al. Reversal of obesity- and diet-induced insulin resistance with salicylates or targeted disruption of Ikkbeta. Science. (2001) 293:1673–7. doi: 10.1126/science.1061620
83. Hundal RS, Petersen KF, Mayerson AB, Randhawa PS, Inzucchi S, Shoelson SE, et al. Mechanism by which high-dose aspirin improves glucose metabolism in type 2 diabetes. J Clin Investig. (2002) 109:1321–6. doi: 10.1172/JCI0214955
84. Ritz P, Berrut G. Mitochondrial function, energy expenditure, aging and insulin resistance. Diab Metab. (2005) 31:67–73. doi: 10.1016/S1262-3636(05)73654-5
85. Morino K, Petersen KF, Dufour S, Befroy D, Frattini J, Shatzkes N, et al. Reduced mitochondrial density and increased IRS-1 serine phosphorylation in muscle of insulin-resistant offspring of type 2 diabetic parents. J Clin Investig. (2005) 115:3587–93. doi: 10.1172/JCI25151
86. Kelley DE, He J, Menshikova EV, Ritov VB. Dysfunction of mitochondria in human skeletal muscle in type 2 diabetes. Diabetes. (2002) 51:2944–50. doi: 10.2337/diabetes.51.10.2944
87. Montgomery MK, Turner N. Mitochondrial dysfunction and insulin resistance: an update. Endocr Connect. (2015) 4:R1–15. doi: 10.1530/EC-14-0092
88. Gastaldelli A, Gaggini M, DeFronzo RA. Role of adipose tissue insulin resistance in the natural history of type 2 diabetes: results from the San Antonio Metabolism Study. Diabetes. (2017) 66:815–22. doi: 10.2337/db16-1167
89. Hotamisligil GS. Inflammation and metabolic disorders. Nature. (2006) 444:860–7. doi: 10.1038/nature05485
90. Tchernof A, Despres JP. Pathophysiology of human visceral obesity: an update. Physiol Rev. (2013) 93:359–404. doi: 10.1152/physrev.00033.2011
91. Weisberg SP, McCann D, Desai M, Rosenbaum M, Leibel RL, Ferrante AW Jr. Obesity is associated with macrophage accumulation in adipose tissue. J Clin Investig. (2003) 112:1796–808. doi: 10.1172/JCI200319246
92. Lumeng CN, Deyoung SM, Saltiel AR. Macrophages block insulin action in adipocytes by altering expression of signaling and glucose transport proteins. Am J Physiol Endocrinol Metab. (2007) 292:E166–74. doi: 10.1152/ajpendo.00284.2006
93. Cinti S, Mitchell G, Barbatelli G, Murano I, Ceresi E, Faloia E, et al. Adipocyte death defines macrophage localization and function in adipose tissue of obese mice and humans. J Lipid Res. (2005) 46:2347–55. doi: 10.1194/jlr.M500294-JLR200
94. Iyengar NM, Hudis CA, Dannenberg AJ. Obesity and cancer: local and systemic mechanisms. Ann Rev Med. (2015) 66:297–309. doi: 10.1146/annurev-med-050913-022228
95. Camastra S, Vitali A, Anselmino M, Gastaldelli A, Bellini R, Berta R, et al. Muscle and adipose tissue morphology, insulin sensitivity and beta-cell function in diabetic and nondiabetic obese patients: effects of bariatric surgery. Sci Rep. (2017) 7:9007. doi: 10.1038/s41598-017-08444-6
96. Cook JR, Langlet F, Kido Y, Accili D. Pathogenesis of selective insulin resistance in isolated hepatocytes. J Biol Chem. (2015) 290:13972–80. doi: 10.1074/jbc.M115.638197
97. Brown MS, Goldstein JL. Selective versus total insulin resistance: a pathogenic paradox. Cell Metab. (2008) 7:95–6. doi: 10.1016/j.cmet.2007.12.009
98. Semple RK, Sleigh A, Murgatroyd PR, Adams CA, Bluck L, Jackson S, et al. Postreceptor insulin resistance contributes to human dyslipidemia and hepatic steatosis. J Clin Investig. (2009) 119:315–22. doi: 10.1172/JCI37432
99. Diraison F, Moulin P, Beylot M. Contribution of hepatic de novo lipogenesis and reesterification of plasma non esterified fatty acids to plasma triglyceride synthesis during non-alcoholic fatty liver disease. Diab Metab. (2003) 29:478–85. doi: 10.1016/S1262-3636(07)70061-7
100. Donnelly KL, Smith CI, Schwarzenberg SJ, Jessurun J, Boldt MD, Parks EJ. Sources of fatty acids stored in liver and secreted via lipoproteins in patients with nonalcoholic fatty liver disease. J Clin Investig. (2005) 115:1343–51. doi: 10.1172/JCI23621
101. Postic C, Girard J. Contribution of de novo fatty acid synthesis to hepatic steatosis and insulin resistance: lessons from genetically engineered mice. J Clin Investig. (2008) 118:829–38. doi: 10.1172/JCI34275
102. Haeusler RA, Accili D. The double life of Irs. Cell Metab. (2008) 8:7–9. doi: 10.1016/j.cmet.2008.06.010
103. Artunc F, Schleicher E, Weigert C, Fritsche A, Stefan N, Haring HU. The impact of insulin resistance on the kidney and vasculature. Nat Rev Nephrol. (2016) 12:721–37. doi: 10.1038/nrneph.2016.145
104. Boulton AJ, Vileikyte L, Ragnarson-Tennvall G, Apelqvist J. The global burden of diabetic foot disease. Lancet. (2005) 366:1719–24. doi: 10.1016/S0140-6736(05)67698-2
105. Brandner JM, Zacheja S, Houdek P, Moll I, Lobmann R. Expression of matrix metalloproteinases, cytokines, and connexins in diabetic and nondiabetic human keratinocytes before and after transplantation into an ex vivo wound-healing model. Diab Care. (2008) 31:114–20. doi: 10.2337/dc07-1304
106. Wetzler C, Kampfer H, Stallmeyer B, Pfeilschifter J, Frank S. Large and sustained induction of chemokines during impaired wound healing in the genetically diabetic mouse: prolonged persistence of neutrophils and macrophages during the late phase of repair. J Investig Dermatol. (2000) 115:245–53. doi: 10.1046/j.1523-1747.2000.00029.x
107. Lerman OZ, Galiano RD, Armour M, Levine JP, Gurtner GC. Cellular dysfunction in the diabetic fibroblast: impairment in migration, vascular endothelial growth factor production, and response to hypoxia. Am J Pathol. (2003) 162:303–12. doi: 10.1016/S0002-9440(10)63821-7
108. Falanga V. Wound healing and its impairment in the diabetic foot. Lancet. (2005) 366:1736–43. doi: 10.1016/S0140-6736(05)67700-8
109. Brem H, Tomic-Canic M. Cellular and molecular basis of wound healing in diabetes. J Clin Investig. (2007) 117:1219–22. doi: 10.1172/JCI32169
110. Thangapazham RL, Darling TN, Meyerle J. Alteration of skin properties with autologous dermal fibroblasts. Int J Mol Sci. (2014) 15:8407–27. doi: 10.3390/ijms15058407
111. Driskell RR, Lichtenberger BM, Hoste E, Kretzschmar K, Simons BD, Charalambous M, et al. Distinct fibroblast lineages determine dermal architecture in skin development and repair. Nature. (2013) 504:277–81. doi: 10.1038/nature12783
112. Thangarajah H, Yao D, Chang EI, Shi Y, Jazayeri L, Vial IN, et al. The molecular basis for impaired hypoxia-induced VEGF expression in diabetic tissues. Proc Natl Acad Sci USA. (2009) 106:13505–10. doi: 10.1073/pnas.0906670106
113. Brownlee M. Biochemistry and molecular cell biology of diabetic complications. Nature. (2001) 414:813–20. doi: 10.1038/414813a
114. Katagiri S, Park K, Maeda Y, Rao TN, Khamaisi M, Li Q, et al. Overexpressing IRS1 in endothelial cells enhances angioblast differentiation and wound healing in diabetes and insulin resistance. Diabetes. (2016) 65:2760–71. doi: 10.2337/db15-1721
115. Massihnia D, Galvano A, Fanale D, Perez A, Castiglia M, Incorvaia L, et al. Triple negative breast cancer: shedding light onto the role of pi3k/akt/mtor pathway. Oncotarget. (2016) 7:60712–22. doi: 10.18632/oncotarget.10858
116. McDaniel JM, Varley KE, Gertz J, Savic DS, Roberts BS, Bailey SK, et al. Genomic regulation of invasion by STAT3 in triple negative breast cancer. Oncotarget. (2017) 8:8226–38. doi: 10.18632/oncotarget.14153
117. Rangel MC, Bertolette D, Castro NP, Klauzinska M, Cuttitta F, Salomon DS. Developmental signaling pathways regulating mammary stem cells and contributing to the etiology of triple-negative breast cancer. Breast Cancer Res Treatm. (2016) 156:211–26. doi: 10.1007/s10549-016-3746-7
118. Sundaram S, Johnson AR, Makowski L. Obesity, metabolism and the microenvironment: links to cancer. J Carcinog. (2013) 12:19. doi: 10.4103/1477-3163.119606
119. Johnson TO, Ermolieff J, Jirousek MR. Protein tyrosine phosphatase 1B inhibitors for diabetes. Nat Rev Drug Disc. (2002) 1:696–709. doi: 10.1038/nrd895
120. Ukkola O, Santaniemi M. Protein tyrosine phosphatase 1B: a new target for the treatment of obesity and associated co-morbidities. J Intern Med. (2002) 251:467–75. doi: 10.1046/j.1365-2796.2002.00992.x
121. Kumari S, Badana AK, G MM, G S, Malla R. Reactive oxygen species: a key constituent in cancer survival. Biomarker Insights. (2018) 13:1177271918755391. doi: 10.1177/1177271918755391
122. Rohrmann S, Overvad K, Bueno-de-Mesquita HB, Jakobsen MU, Egeberg R, Tjonneland A, et al. Meat consumption and mortality–results from the European Prospective Investigation into Cancer and Nutrition. BMC Med. (2013) 11:63. doi: 10.1186/1741-7015-11-63
123. Semenza GL. Hypoxia-inducible factors in physiology and medicine. Cell. (2012) 148:399–408. doi: 10.1016/j.cell.2012.01.021
124. Li L, Zhao GD, Shi Z, Qi LL, Zhou LY, Fu ZX. The Ras/Raf/MEK/ERK signaling pathway and its role in the occurrence and development of HCC. Oncol Lett. (2016) 12:3045–50. doi: 10.3892/ol.2016.5110
125. Xue G, Hemmings BA. PKB/Akt-dependent regulation of cell motility. J Natl Cancer Instit. (2013) 105:393–404. doi: 10.1093/jnci/djs648
126. Chen ZF, Behringer RR. twist is required in head mesenchyme for cranial neural tube morphogenesis. Genes Dev. (1995) 9:686–99. doi: 10.1101/gad.9.6.686
127. Cenni V, Sirri A, Riccio M, Lattanzi G, Santi S, de Pol A, et al. Targeting of the Akt/PKB kinase to the actin skeleton. Cell Mol Life Sci. (2003) 60:2710–20. doi: 10.1007/s00018-003-3349-4
128. Amiri A, Noei F, Jeganathan S, Kulkarni G, Pinke DE, Lee JM. eEF1A2 activates Akt and stimulates Akt-dependent actin remodeling, invasion and migration. Oncogene. (2007) 26:3027–40. doi: 10.1038/sj.onc.1210101
129. Zhu QS, Rosenblatt K, Huang KL, Lahat G, Brobey R, Bolshakov S, et al. Vimentin is a novel AKT1 target mediating motility and invasion. Oncogene. (2011) 30:457–70. doi: 10.1038/onc.2010.421
130. Parri M, Chiarugi P. Rac and Rho GTPases in cancer cell motility control. Cell Commun Signal. (2010) 8:23. doi: 10.1186/1478-811X-8-23
131. Thiery JP, Acloque H, Huang RY, Nieto MA. Epithelial-mesenchymal transitions in development and disease. Cell. (2009) 139:871–90. doi: 10.1016/j.cell.2009.11.007
132. Zhou BP, Deng J, Xia W, Xu J, Li YM, Gunduz M, et al. Dual regulation of snail by GSK-3beta-mediated phosphorylation in control of epithelial-mesenchymal transition. Nature Cell Biol. (2004) 6:931–40. doi: 10.1038/ncb1173
133. Chen R, Yang Q, Lee JD. BMK1 kinase suppresses epithelial-mesenchymal transition through the Akt/GSK3beta signaling pathway. Cancer Res. (2012) 72:1579–87. doi: 10.1158/0008-5472.CAN-11-2055
134. Villagrasa P, Diaz VM, Vinas-Castells R, Peiro S, Del Valle-Perez B, Dave N, et al. Akt2 interacts with Snail1 in the E-cadherin promoter. Oncogene. (2012) 31:4022–33. doi: 10.1038/onc.2011.562
135. Cheng GZ, Chan J, Wang Q, Zhang W, Sun CD, Wang LH. Twist transcriptionally up-regulates AKT2 in breast cancer cells leading to increased migration, invasion, and resistance to paclitaxel. Cancer Res. (2007) 67:1979–87. doi: 10.1158/0008-5472.CAN-06-1479
136. Hong KO, Kim JH, Hong JS, Yoon HJ, Lee JI, Hong SP, et al. Inhibition of Akt activity induces the mesenchymal-to-epithelial reverting transition with restoring E-cadherin expression in KB and KOSCC-25B oral squamous cell carcinoma cells. J exp Clin Cancer Res. (2009) 28:28. doi: 10.1186/1756-9966-28-28
137. Xue G, Restuccia DF, Lan Q, Hynx D, Dirnhofer S, Hess D, et al. Akt/PKB-mediated phosphorylation of Twist1 promotes tumor metastasis via mediating cross-talk between PI3K/Akt and TGF-beta signaling axes. Cancer Disc. (2012) 2:248–59. doi: 10.1158/2159-8290.CD-11-0270
138. Yao K, Ye PP, Tan J, Tang XJ, Shen Tu XC. Involvement of PI3K/Akt pathway in TGF-beta2-mediated epithelial mesenchymal transition in human lens epithelial cells. Ophthal Res. (2008) 40:69–76. doi: 10.1159/000113884
139. Yokoyama K, Kimoto K, Itoh Y, Nakatsuka K, Matsuo N, Yoshioka H, et al. The PI3K/Akt pathway mediates the expression of type I collagen induced by TGF-beta2 in human retinal pigment epithelial cells. Graefe Arch Clin Exp Ophthalmol. (2012) 250:15–23. doi: 10.1007/s00417-011-1766-x
140. Yang MH, Hsu DS, Wang HW, Wang HJ, Lan HY, Yang WH, et al. Bmi1 is essential in Twist1-induced epithelial-mesenchymal transition. Nature Cell Biol. (2010) 12:982–92. doi: 10.1038/ncb2099
141. Nacerddine K, Beaudry JB, Ginjala V, Westerman B, Mattiroli F, Song JY, et al. Akt-mediated phosphorylation of Bmi1 modulates its oncogenic potential, E3 ligase activity, and DNA damage repair activity in mouse prostate cancer. J Clin Investig. (2012) 122:1920–32. doi: 10.1172/JCI57477
142. Liu T, Zhang L, Joo D, Sun SC. NF-kappaB signaling in inflammation. Signal Transduct Targeted Ther. (2017) 2:23. doi: 10.1038/sigtrans.2017.23
143. Chawla A, Nguyen KD, Goh YP. Macrophage-mediated inflammation in metabolic disease. Nat Rev Immunol. (2011) 11:738–49. doi: 10.1038/nri3071
144. Kraakman MJ, Murphy AJ, Jandeleit-Dahm K, Kammoun HL. Macrophage polarization in obesity and type 2 diabetes: weighing down our understanding of macrophage function? Front Immunol. (2014) 5:470. doi: 10.3389/fimmu.2014.00470
145. Williamson RT. On the treatment of glycosuria and diabetes mellituswith sodium salicylate. Br Med J. (1901) 1:760–2. doi: 10.1136/bmj.1.2100.760
146. Ebstein W. Invited comment on W. Ebstein: On the therapy of diabetes mellitus, in particular on the application of sodium salicylate. J Mol Med. (2002) 80:618–9. doi: 10.1007/s00109-002-0383-x
147. Hotamisligil GS, Shargill NS, Spiegelman BM. Adipose expression of tumor necrosis factor-alpha: direct role in obesity-linked insulin resistance. Science. (1993) 259:87–91. doi: 10.1126/science.7678183
148. Feinstein R, Kanety H, Papa MZ, Lunenfeld B, Karasik A. Tumor necrosis factor-alpha suppresses insulin-induced tyrosine phosphorylation of insulin receptor and its substrates. J Biol Chem. (1993) 268:26055–8.
149. Hotamisligil GS, Spiegelman BM. Tumor necrosis factor alpha: a key component of the obesity-diabetes link. Diabetes. (1994) 43:1271–8. doi: 10.2337/diab.43.11.1271
150. Pickup JC, Crook MA. Is type II diabetes mellitus a disease of the innate immune system? Diabetologia. (1998) 41:1241–8. doi: 10.1007/s001250051058
151. Kolb H, Mandrup-Poulsen T. An immune origin of type 2 diabetes? Diabetologia. (2005) 48:1038–50. doi: 10.1007/s00125-005-1764-9
152. Zhang Y, Proenca R, Maffei M, Barone M, Leopold L, Friedman JM. Positional cloning of the mouse obese gene and its human homologue. Nature. (1994) 372:425–32. doi: 10.1038/372425a0
153. Fried SK, Bunkin DA, Greenberg AS. Omental and subcutaneous adipose tissues of obese subjects release interleukin-6: depot difference and regulation by glucocorticoid. J Clin Endocrinol Metab. (1998) 83:847–50. doi: 10.1210/jc.83.3.847
154. Steppan CM, Bailey ST, Bhat S, Brown EJ, Banerjee RR, Wright CM, et al. The hormone resistin links obesity to diabetes. Nature. (2001) 409:307–12. doi: 10.1038/35053000
155. Shimomura I, Funahashi T, Takahashi M, Maeda K, Kotani K, Nakamura T, et al. Enhanced expression of PAI-1 in visceral fat: possible contributor to vascular disease in obesity. Nat Med. (1996) 2:800–3. doi: 10.1038/nm0796-800
156. Fukuhara A, Matsuda M, Nishizawa M, Segawa K, Tanaka M, Kishimoto K, et al. Visfatin: a protein secreted by visceral fat that mimics the effects of insulin. Science. (2005) 307:426–30. doi: 10.1126/science.1097243
157. Scherer PE, Williams S, Fogliano M, Baldini G, Lodish HF. A novel serum protein similar to C1q, produced exclusively in adipocytes. J Biol Chem. (1995) 270:26746–9. doi: 10.1074/jbc.270.45.26746
158. Tedder TF, Steeber DA, Chen A, Engel P. The selectins: vascular adhesion molecules. FASEB J. (1995) 9:866–73. doi: 10.1096/fasebj.9.10.7542213
159. Adams DH, Shaw S. Leucocyte-endothelial interactions and regulation of leucocyte migration. Lancet. (1994) 343:831–6. doi: 10.1016/S0140-6736(94)92029-X
160. Warner SJ, Libby P. Human vascular smooth muscle cells. Target for and source of tumor necrosis factor. J Immunol. (1989) 142:100–9.
161. Barath P, Fishbein MC, Cao J, Berenson J, Helfant RH, Forrester JS. Detection and localization of tumor necrosis factor in human atheroma. Am J Cardiol. (1990) 65:297–302. doi: 10.1016/0002-9149(90)90291-8
162. Seino Y, Ikeda U, Ikeda M, Yamamoto K, Misawa Y, Hasegawa T, et al. Interleukin 6 gene transcripts are expressed in human atherosclerotic lesions. Cytokine. (1994) 6:87–91. doi: 10.1016/1043-4666(94)90013-2
163. Rus HG, Vlaicu R, Niculescu F. Interleukin-6 and interleukin-8 protein and gene expression in human arterial atherosclerotic wall. Atherosclerosis. (1996) 127:263–71. doi: 10.1016/S0021-9150(96)05968-0
164. Schonbeck U, Libby P. CD40 signaling and plaque instability. Circ Res. (2001) 89:1092–103. doi: 10.1161/hh2401.101272
165. Mach F, Schonbeck U, Bonnefoy JY, Pober JS, Libby P. Activation of monocyte/macrophage functions related to acute atheroma complication by ligation of CD40: induction of collagenase, stromelysin, and tissue factor. Circulation. (1997) 96:396–9. doi: 10.1161/01.CIR.96.2.396
166. Escudero CA, Herlitz K, Troncoso F, Guevara K, Acurio J, Aguayo C, et al. Pro-angiogenic role of insulin: from physiology to pathology. Front Physiol. (2017) 8:204. doi: 10.3389/fphys.2017.00204
167. Heymsfield SB, Peterson CM, Thomas DM, Heo M, Schuna JM Jr. Why are there race/ethnic differences in adult body mass index-adiposity relationships? A quantitative critical review. Obesity Rev. (2016) 17:262–75. doi: 10.1111/obr.12358
168. Nelson DA, Feingold M, Bolin F, Parfitt AM. Principal components analysis of regional bone density in black and white women: relationship to body size and composition. Am J Phys Anthropol. (1991) 86:507–14. doi: 10.1002/ajpa.1330860406
169. Heo M, Kabat GC, Gallagher D, Heymsfield SB, Rohan TE. Optimal scaling of weight and waist circumference to height for maximal association with DXA-measured total body fat mass by sex, age and race/ethnicity. Int J Obesity. (2013) 37:1154–60. doi: 10.1038/ijo.2012.201
170. Wang Z, Heo M, Lee RC, Kotler DP, Withers RT, Heymsfield SB. Muscularity in adult humans: proportion of adipose tissue-free body mass as skeletal muscle. Am J Hum Biol. (2001) 13:612–9. doi: 10.1002/ajhb.1099
171. Kwan ML, John EM, Caan BJ, Lee VS, Bernstein L, Cheng I, et al. Obesity and mortality after breast cancer by race/ethnicity: the California Breast Cancer Survivorship Consortium. Am J Epidemiol. (2014) 179:95–111. doi: 10.1093/aje/kwt233
172. Chiu M, Austin PC, Manuel DG, Shah BR, Tu JV. Deriving ethnic-specific BMI cutoff points for assessing diabetes risk. Diab Care. (2011) 34:1741–8. doi: 10.2337/dc10-2300
173. Mathew H, Farr OM, Mantzoros CS. Metabolic health and weight: understanding metabolically unhealthy normal weight or metabolically healthy obese patients. Metabolism. (2016) 65:73–80. doi: 10.1016/j.metabol.2015.10.019
174. Herrmann W, Reuter W, Schutz C, Lindhofer HG, Wurzberger G, Schneider P. The behavior of specific parameters of lipid and lipoprotein metabolism in metabolically healthy and obese subjects. Z Gesamte Inn Med. (1982) 37:43–50.
175. Bluher S, Schwarz P. Metabolically healthy obesity from childhood to adulthood - Does weight status alone matter? Metabolism. (2014) 63:1084–92. doi: 10.1016/j.metabol.2014.06.009
176. Sims EA. Are there persons who are obese, but metabolically healthy? Metabolism. (2001) 50:1499–504. doi: 10.1053/meta.2001.27213
177. Phillips CM. Metabolically healthy obesity: definitions, determinants and clinical implications. Rev Endocr Metab Disord. (2013) 14:219–27. doi: 10.1007/s11154-013-9252-x
178. Velho S, Paccaud F, Waeber G, Vollenweider P, Marques-Vidal P. Metabolically healthy obesity: different prevalences using different criteria. Eur J Clin Nutr. (2010) 64:1043–51. doi: 10.1038/ejcn.2010.114
179. Ruderman NB, Schneider SH, Berchtold P. The “metabolically-obese,” normal-weight individual. Am J Clin Nutr. (1981) 34:1617–21. doi: 10.1093/ajcn/34.8.1617
180. Silva AM, Shen W, Heo M, Gallagher D, Wang Z, Sardinha LB, et al. Ethnicity-related skeletal muscle differences across the lifespan. Am J Hum Biol. (2010) 22:76–82. doi: 10.1002/ajhb.20956
181. McNeely MJ, Boyko EJ. Type 2 diabetes prevalence in Asian Americans: results of a national health survey. Diab Care. (2004) 27:66–9. doi: 10.2337/diacare.27.1.66
182. Low S, Chin MC, Ma S, Heng D, Deurenberg-Yap M. Rationale for redefining obesity in Asians. Ann Acad Med Singapore. (2009) 38:66–9.
183. Staimez LR, Weber MB, Narayan KM, Oza-Frank R. A systematic review of overweight, obesity, and type 2 diabetes among Asian American subgroups. Curr Diabetes Rev. (2013) 9:312–31. doi: 10.2174/15733998113099990061
184. Araneta MR, Kanaya AM, Hsu WC, Chang HK, Grandinetti A, Boyko EJ, et al. Optimum BMI cut points to screen asian americans for type 2 diabetes. Diab Care. (2015) 38:814–20. doi: 10.2337/dc14-2071
185. Hsia DS, Larrivee S, Cefalu WT, Johnson WD. Impact of lowering BMI cut points as recommended in the revised American Diabetes Association's standards of medical care in diabetes-2015 on diabetes screening in Asian Americans. Diab Care. (2015) 38:2166–8. doi: 10.2337/dc15-0299
186. Tung EL, Baig AA, Huang ES, Laiteerapong N, Chua KP. Racial and ethnic disparities in diabetes screening between Asian Americans and other adults: BRFSS 2012-2014. J Gen Intern Med. (2017) 32:423–9. doi: 10.1007/s11606-016-3913-x
187. Fukushima M, Suzuki H, Seino Y. Insulin secretion capacity in the development from normal glucose tolerance to type 2 diabetes. Diab Res Clin Pract. (2004) 66(Suppl 1):S37–43. doi: 10.1016/j.diabres.2003.11.024
188. Mitsui R, Fukushima M, Taniguchi A, Nakai Y, Aoyama S, Takahashi Y, et al. Insulin secretory capacity and insulin sensitivity in impaired fasting glucose in Japanese. J Diabetes Investig. (2012) 3:377–83. doi: 10.1111/j.2040-1124.2012.00201.x
189. Yoon KH, Ko SH, Cho JH, Lee JM, Ahn YB, Song KH, et al. Selective beta-cell loss and alpha-cell expansion in patients with type 2 diabetes mellitus in Korea. J Clin Endocrinol Metab. (2003) 88:2300–8. doi: 10.1210/jc.2002-020735
190. Nicholson KM, Anderson NG. The protein kinase B/Akt signalling pathway in human malignancy. Cell Signal. (2002) 14:381–95. doi: 10.1016/S0898-6568(01)00271-6
191. Altomare DA, Testa JR. Perturbations of the AKT signaling pathway in human cancer. Oncogene. (2005) 24:7455–64. doi: 10.1038/sj.onc.1209085
192. Cancer Genome Atlas N. Comprehensive molecular portraits of human breast tumours. Nature. (2012) 490:61–70. doi: 10.1038/nature11412
193. Yang ZY, Di MY, Yuan JQ, Shen WX, Zheng DY, Chen JZ, et al. The prognostic value of phosphorylated Akt in breast cancer: a systematic review. Sci Rep. (2015) 5:7758. doi: 10.1038/srep07758
194. Engelman JA. Targeting PI3K signalling in cancer: opportunities, challenges and limitations. Nat Rev Cancer. (2009) 9:550–62. doi: 10.1038/nrc2664
195. Serrano-Gomez SJ, Sanabria-Salas MC, Hernandez-Suarez G, Garcia O, Silva C, Romero A, et al. High prevalence of luminal B breast cancer intrinsic subtype in Colombian women. Carcinogenesis. (2016) 37:669–76. doi: 10.1093/carcin/bgw043
196. Howlader N, Altekruse SF, Li CI, Chen VW, Clarke CA, Ries LA, et al. US incidence of breast cancer subtypes defined by joint hormone receptor and HER2 status. J Natl Cancer Instit. (2014) 106:dju055. doi: 10.1093/jnci/dju055
197. Kim JW, Dang CV. Cancer's molecular sweet tooth and the Warburg effect. Cancer Res. (2006) 66:8927–30. doi: 10.1158/0008-5472.CAN-06-1501
198. Elstrom RL, Bauer DE, Buzzai M, Karnauskas R, Harris MH, Plas DR, et al. Akt stimulates aerobic glycolysis in cancer cells. Cancer Res. (2004) 64:3892–9. doi: 10.1158/0008-5472.CAN-03-2904
199. Robey RB, Hay N. Is Akt the “Warburg kinase”?-Akt-energy metabolism interactions and oncogenesis. Semin Cancer Biol. (2009) 19:25–31. doi: 10.1016/j.semcancer.2008.11.010
200. Mosser DM, Edwards JP. Exploring the full spectrum of macrophage activation. Nat Rev Immunol. (2008) 8:958–69. doi: 10.1038/nri2448
201. Qian BZ, Pollard JW. Macrophage diversity enhances tumor progression and metastasis. Cell. (2010) 141:39–51. doi: 10.1016/j.cell.2010.03.014
202. Medrek C, Ponten F, Jirstrom K, Leandersson K. The presence of tumor associated macrophages in tumor stroma as a prognostic marker for breast cancer patients. BMC Cancer. (2012) 12:306. doi: 10.1186/1471-2407-12-306
203. DeNardo DG, Brennan DJ, Rexhepaj E, Ruffell B, Shiao SL, Madden SF, et al. Leukocyte complexity predicts breast cancer survival and functionally regulates response to chemotherapy. Cancer Disc. (2011) 1:54–67. doi: 10.1158/2159-8274.CD-10-0028
204. Shree T, Olson OC, Elie BT, Kester JC, Garfall AL, Simpson K, et al. Macrophages and cathepsin proteases blunt chemotherapeutic response in breast cancer. Genes Dev. (2011) 25:2465–79. doi: 10.1101/gad.180331.111
205. Maruthur NM, Tseng E, Hutfless S, Wilson LM, Suarez-Cuervo C, Berger Z, et al. Diabetes medications as monotherapy or metformin-based combination therapy for type 2 diabetes: a systematic review and meta-analysis. Ann Intern Med. (2016) 164:740–51. doi: 10.7326/M15-2650
207. Lautatzis ME, Goulis DG, Vrontakis M. Efficacy and safety of metformin during pregnancy in women with gestational diabetes mellitus or polycystic ovary syndrome: a systematic review. Metabolism. (2013) 62:1522–34. doi: 10.1016/j.metabol.2013.06.006
208. Triggle CR, Ding H. Metformin is not just an antihyperglycaemic drug but also has protective effects on the vascular endothelium. Acta Physiol. (2017) 219:138–51. doi: 10.1111/apha.12644
209. Pernicova I, Korbonits M. Metformin–mode of action and clinical implications for diabetes and cancer. Nat Rev Endocrinol. (2014) 10:143–56. doi: 10.1038/nrendo.2013.256
210. Heckman-Stoddard BM, Gandini S, Puntoni M, Dunn BK, DeCensi A, Szabo E. Repurposing old drugs to chemoprevention: the case of metformin. Semin Oncol. (2016) 43:123–33. doi: 10.1053/j.seminoncol.2015.09.009
211. Savage DB, Choi CS, Samuel VT, Liu ZX, Zhang D, Wang A, et al. Reversal of diet-induced hepatic steatosis and hepatic insulin resistance by antisense oligonucleotide inhibitors of acetyl-CoA carboxylases 1 and 2. J Clin Investig. (2006) 116:817–24. doi: 10.1172/JCI27300
212. Shaw RJ, Lamia KA, Vasquez D, Koo SH, Bardeesy N, Depinho RA, et al. The kinase LKB1 mediates glucose homeostasis in liver and therapeutic effects of metformin. Science. (2005) 310:1642–6. doi: 10.1126/science.1120781
213. Madiraju AK, Erion DM, Rahimi Y, Zhang XM, Braddock DT, Albright RA, et al. Metformin suppresses gluconeogenesis by inhibiting mitochondrial glycerophosphate dehydrogenase. Nature. (2014) 510:542–6. doi: 10.1038/nature13270
214. Hardie DG. Neither LKB1 nor AMPK are the direct targets of metformin. Gastroenterology. (2006) 131:973. doi: 10.1053/j.gastro.2006.07.032
215. Aroda VR, Knowler WC, Crandall JP, Perreault L, Edelstein SL, Jeffries SL, et al. Metformin for diabetes prevention: insights gained from the Diabetes Prevention Program/Diabetes Prevention Program Outcomes Study. Diabetologia. (2017) 60:1601–11. doi: 10.1007/s00125-017-4361-9
216. Knowler WC, Barrett-Connor E, Fowler SE, Hamman RF, Lachin JM, Walker EA, et al. Reduction in the incidence of type 2 diabetes with lifestyle intervention or metformin. N Engl J Med. (2002) 346:393–403. doi: 10.1056/NEJMoa012512
217. Ratner RE, Christophi CA, Metzger BE, Dabelea D, Bennett PH, Pi-Sunyer X, et al. Prevention of diabetes in women with a history of gestational diabetes: effects of metformin and lifestyle interventions. J Clin Endocrinol Metab. (2008) 93:4774–9. doi: 10.1210/jc.2008-0772
218. Goetz MP, Knox SK, Suman VJ, Rae JM, Safgren SL, Ames MM, et al. The impact of cytochrome P450 2D6 metabolism in women receiving adjuvant tamoxifen. Breast Cancer Res Treatm. (2007) 101:113–21. doi: 10.1007/s10549-006-9428-0
219. Brown PH, Lippman SM. Chemoprevention of breast cancer. Breast Cancer Res Treatm. (2000) 62:1–17. doi: 10.1023/A:1006484604454
220. Fabian CJ, Kimler BF. Chemoprevention for high-risk women: tamoxifen and beyond. Breast J. (2001) 7:311–20. doi: 10.1046/j.1524-4741.2001.21570.x
221. Thorell A, Nygren J, Ljungqvist O. Insulin resistance: a marker of surgical stress. Curr Opin Clin Nutr Metab Care. (1999) 2:69–78. doi: 10.1097/00075197-199901000-00012
222. Sato H, Carvalho G, Sato T, Lattermann R, Matsukawa T, Schricker T. The association of preoperative glycemic control, intraoperative insulin sensitivity, and outcomes after cardiac surgery. J Clin Endocrinol Metab. (2010) 95:4338–44. doi: 10.1210/jc.2010-0135
223. Frisch A, Chandra P, Smiley D, Peng L, Rizzo M, Gatcliffe C, et al. Prevalence and clinical outcome of hyperglycemia in the perioperative period in noncardiac surgery. Diab Care. (2010) 33:1783–8. doi: 10.2337/dc10-0304
224. Kotagal M, Symons RG, Hirsch IB, Umpierrez GE, Dellinger EP, Farrokhi ET, et al. Perioperative hyperglycemia and risk of adverse events among patients with and without diabetes. Ann Surg. (2015) 261:97–103. doi: 10.1097/SLA.0000000000000688
225. Rifkin WJ, Kantar RS, Cammarata MJ, Wilson SC, Diaz-Siso JR, Golas AR, et al. Impact of diabetes on 30-day complications in mastectomy and implant-based breast reconstruction. J Surg Res. (2019) 235:148–59. doi: 10.1016/j.jss.2018.09.063
226. Kantar RS, Rifkin WJ, David JA, Cammarata MJ, Diaz-Siso JR, Levine JP, et al. Diabetes is not associated with increased rates of free flap failure: Analysis of outcomes in 6030 patients from the ACS-NSQIP database. Microsurgery. (2019) 39:14–23. doi: 10.1002/micr.30332
227. Hart A, Funderburk CD, Chu CK, Pinell-White X, Halgopian T, Manning-Geist B, et al. The impact of diabetes mellitus on wound healing in breast reconstruction. Ann Plast Surg. (2017) 78:260–3. doi: 10.1097/SAP.0000000000000881
228. Jones CE, Graham LA, Morris MS, Richman JS, Hollis RH, Wahl TS, et al. Association between preoperative hemoglobin a1c levels, postoperative hyperglycemia, and readmissions following gastrointestinal surgery. JAMA Surg. (2017) 152:1031–8. doi: 10.1001/jamasurg.2017.2350
229. Yong PH, Weinberg L, Torkamani N, Churilov L, Robbins RJ, Ma R, et al. The presence of diabetes and higher HbA1c are independently associated with adverse outcomes after surgery. Diab Care. (2018) 41:1172–9. doi: 10.2337/dc17-2304
230. Jehan F, Khan M, Sakran JV, Khreiss M, O'Keeffe T, Chi A, et al. Perioperative glycemic control and postoperative complications in patients undergoing emergency general surgery: what is the role of Plasma Hemoglobin A1c? J Trauma Acute Care Surg. (2018) 84:112–7. doi: 10.1097/TA.0000000000001724
231. Capozzi JD, Lepkowsky ER, Callari MM, Jordan ET, Koenig JA, Sirounian GH. The prevalence of diabetes mellitus and routine hemoglobin a1c screening in elective total joint arthroplasty patients. J Arthroplasty. (2017) 32:304–8. doi: 10.1016/j.arth.2016.06.025
232. Rollins KE, Varadhan KK, Dhatariya K, Lobo DN. Systematic review of the impact of HbA1c on outcomes following surgery in patients with diabetes mellitus. Clin Nutr. (2016) 35:308–16. doi: 10.1016/j.clnu.2015.03.007
233. Bock M, Johansson T, Fritsch G, Flamm M, Hansbauer B, Mann E, et al. The impact of preoperative testing for blood glucose concentration and haemoglobin A1c on mortality, changes in management and complications in noncardiac elective surgery: a systematic review. Eur J Anaesthesiol. (2015) 32:152–9. doi: 10.1097/EJA.0000000000000117
234. Karimian N, Niculiseanu P, Amar-Zifkin A, Carli F, Feldman LS. Association of elevated pre-operative hemoglobin A1c and post-operative complications in non-diabetic patients: a systematic review. World J Surg. (2018) 42:61–72. doi: 10.1007/s00268-017-4106-4
235. Dieli-Conwright CM, Wong L, Waliany S, Bernstein L, Salehian B, Mortimer JE. An observational study to examine changes in metabolic syndrome components in patients with breast cancer receiving neoadjuvant or adjuvant chemotherapy. Cancer. (2016) 122:2646–53. doi: 10.1002/cncr.30104
236. Demark-Wahnefried W, Peterson BL, Winer EP, Marks L, Aziz N, Marcom PK, et al. Changes in weight, body composition, and factors influencing energy balance among premenopausal breast cancer patients receiving adjuvant chemotherapy. J Clin Oncol. (2001) 19:2381–9. doi: 10.1200/JCO.2001.19.9.2381
237. Irwin ML, Crumley D, McTiernan A, Bernstein L, Baumgartner R, Gilliland FD, et al. Physical activity levels before and after a diagnosis of breast carcinoma: the Health, Eating, Activity, and Lifestyle (HEAL) study. Cancer. (2003) 97:1746–57. doi: 10.1002/cncr.11227
Keywords: breast cancer, insulin, metabolic health, metformin, TNBC (Triple negative breast cancer)
Citation: Yee LD, Mortimer JE, Natarajan R, Dietze EC and Seewaldt VL (2020) Metabolic Health, Insulin, and Breast Cancer: Why Oncologists Should Care About Insulin. Front. Endocrinol. 11:58. doi: 10.3389/fendo.2020.00058
Received: 17 March 2019; Accepted: 29 January 2020;
Published: 20 February 2020.
Edited by:
Mei Kong, University of California, Irvine, United StatesReviewed by:
Songhai Chen, The University of Iowa, United StatesYong-Moon Park, National Institute of Environmental Health Sciences (NIEHS), United States
Copyright © 2020 Yee, Mortimer, Natarajan, Dietze and Seewaldt. This is an open-access article distributed under the terms of the Creative Commons Attribution License (CC BY). The use, distribution or reproduction in other forums is permitted, provided the original author(s) and the copyright owner(s) are credited and that the original publication in this journal is cited, in accordance with accepted academic practice. No use, distribution or reproduction is permitted which does not comply with these terms.
*Correspondence: Victoria L. Seewaldt, dnNlZXdhbGR0QGNvaC5vcmc=