 Josefine Tratwal1
 Rossella Labella2
 Nathalie Bravenboer3,4
 Greet Kerckhofs5,6
 Eleni Douni7,8
 Erica L. Scheller9
 Sammy Badr10,11
 Dimitrios C. Karampinos12
 Sarah Beck-Cormier13,14
 Biagio Palmisano15Antonella Poloni16
 Maria J. Moreno-Aliaga17,18,19
 Jackie Fretz20Matthew S. Rodeheffer21
 Parastoo Boroumand22
 Clifford J. Rosen23Mark C. Horowitz24
 Bram C. J. van der Eerden25
 Annegreet G. Veldhuis-Vlug4,23,26*†
 Olaia Naveiras1,27*† on behalf of the Methodologies Working Group for the International Bone Marrow Adiposity Society (BMAS)
- 1Laboratory of Regenerative Hematopoiesis, Institute of Bioengineering and Swiss Institute for Experimental Cancer Research, Polytechnique Fédérale de Lausanne, Lausanne, Switzerland
- 2Tissue and Tumour Microenvironments Lab, The Kennedy Institute of Rheumatology, University of Oxford, Oxford, United Kingdom
- 3Department of Clinical Chemistry, Amsterdam University Medical Centers, Vrije Universiteit, Amsterdam Movement Sciences, Amsterdam, Netherlands
- 4Section of Endocrinology, Department of Internal Medicine, Center for Bone Quality, Leiden University Medical Center, Leiden, Netherlands
- 5Biomechanics Lab, Institute of Mechanics, Materials and Civil Engineering, UCLouvain, Louvain-la-Neuve, Belgium
- 6Department Materials Engineering, KU Leuven, Leuven, Belgium
- 7Laboratory of Genetics, Department of Biotechnology, Agricultural University of Athens, Athens, Greece
- 8Institute for Bioinnovation, Biomedical Sciences Research Center Alexander Fleming, Athens, Greece
- 9Division of Bone and Mineral Diseases, Department of Medicine, Washington University, St. Louis, MO, United States
- 10Univ. Lille, EA 4490 - PMOI - Physiopathologie des Maladies Osseuses Inflammatoires, Lille, France
- 11CHU Lille, Service de Radiologie et Imagerie Musculosquelettique, Lille, France
- 12Department of Diagnostic and Interventional Radiology, Technical University of Munich, Munich, Germany
- 13Inserm, UMR 1229, RMeS, Regenerative Medicine and Skeleton, Université de Nantes, ONIRIS, Nantes, France
- 14Université de Nantes, UFR Odontologie, Nantes, France
- 15Department of Genetics and Development, Columbia University Irving Medical Center, New York, NY, United States
- 16Hematology, Department of Clinic and Molecular Science, Università Politecnica Marche-AOU Ospedali Riuniti, Ancona, Italy
- 17Centre for Nutrition Research and Department of Nutrition, Food Science and Physiology, School of Pharmacy and Nutrition, University of Navarra, Pamplona, Spain
- 18IdiSNA, Navarra's Health Research Institute, Pamplona, Spain
- 19CIBERobn Physiopathology of Obesity and Nutrition, Centre of Biomedical Research Network, ISCIII, Madrid, Spain
- 20Department of Orthopaedics and Rehabilitation, Cellular and Developmental Biology, Yale University School of Medicine, New Haven, CT, United States
- 21Department of Comparative Medicine and Molecular, Cellular and Developmental Biology, Yale University School of Medicine, New Haven, CT, United States
- 22Cell Biology Program, The Hospital for Sick Children, Toronto, ON, Canada
- 23Maine Medical Center Research Institute, Center for Clinical and Translational Research, Scarborough, ME, United States
- 24Department of Orthopaedics and Rehabilitation, Yale University School of Medicine, New Haven, CT, United States
- 25Laboratory for Calcium and Bone Metabolism, Department of Internal Medicine, Erasmus University Medical Center, Rotterdam, Netherlands
- 26Jan van Goyen Medical Center/OLVG Hospital, Department of Internal Medicine, Amsterdam, Netherlands
- 27Hematology Service, Departments of Oncology and Laboratory Medicine, Centre Hospitalier Universitaire Vaudois, Lausanne, Switzerland
The interest in bone marrow adiposity (BMA) has increased over the last decade due to its association with, and potential role, in a range of diseases (osteoporosis, diabetes, anorexia, cancer) as well as treatments (corticosteroid, radiation, chemotherapy, thiazolidinediones). However, to advance the field of BMA research, standardization of methods is desirable to increase comparability of study outcomes and foster collaboration. Therefore, at the 2017 annual BMA meeting, the International Bone Marrow Adiposity Society (BMAS) founded a working group to evaluate methodologies in BMA research. All BMAS members could volunteer to participate. The working group members, who are all active preclinical or clinical BMA researchers, searched the literature for articles investigating BMA and discussed the results during personal and telephone conferences. According to the consensus opinion, both based on the review of the literature and on expert opinion, we describe existing methodologies and discuss the challenges and future directions for (1) histomorphometry of bone marrow adipocytes, (2) ex vivo BMA imaging, (3) in vivo BMA imaging, (4) cell isolation, culture, differentiation and in vitro modulation of primary bone marrow adipocytes and bone marrow stromal cell precursors, (5) lineage tracing and in vivo BMA modulation, and (6) BMA biobanking. We identify as accepted standards in BMA research: manual histomorphometry and osmium tetroxide 3D contrast-enhanced μCT for ex vivo quantification, specific MRI sequences (WFI and H-MRS) for in vivo studies, and RT-qPCR with a minimal four gene panel or lipid-based assays for in vitro quantification of bone marrow adipogenesis. Emerging techniques are described which may soon come to complement or substitute these gold standards. Known confounding factors and minimal reporting standards are presented, and their use is encouraged to facilitate comparison across studies. In conclusion, specific BMA methodologies have been developed. However, important challenges remain. In particular, we advocate for the harmonization of methodologies, the precise reporting of known confounding factors, and the identification of methods to modulate BMA independently from other tissues. Wider use of existing animal models with impaired BMA production (e.g., Pfrt−/−, KitW/W−v) and development of specific BMA deletion models would be highly desirable for this purpose.
Introduction
Bone marrow adipocytes (BMAds) reside in the bone marrow (BM) in close contact with bone, hematopoietic cells, marrow stromal cells, nerves, and blood vessels. Bone marrow adipose tissue (BMAT) thus refers to BM areas where BMAds are the predominant cell type, and BMA refers more broadly to BMAT across all skeletal locations and metabolic states. Over the last decades, interest in the functional role of BMAds has gradually increased and it is now evident that BMAds are actively involved in bone metabolism, hematopoiesis, and energy metabolism (1, 2). In addition, a possible role for BMAds in many diseases has emerged (3), and research groups all over the world are investigating the origin, function, and interaction of BMAds. However, different methods, models, and techniques are being used, which creates a challenge to compare or combine the results. Therefore, the International BMAS initiated a Methodologies Working Group to describe the existing methodologies, to identify associated challenges, and to establish standards in reporting as guidance for future studies in the field.
BMAT encompasses a heterogeneous population of mature adipocytes and preadipocytes, with distinct morphologies, lipid content, gene expression and function. Committed preadipocytes have a fibroblast-like morphology when observed in vitro, and are therefore morphologically indistinguishable from the progenitor populations encompassed within the term bone marrow stromal cells (BMSCs). However, preadipocytes are phenotypically very different from mature adipocytes. Preadipocytes are defined as cells committed through adipogenesis and characterized by the expression of early adipogenic genes (PPARy and CEBPa) (4, 5). Mature BMAds express late adipogenic genes (AdipoQ, Glut4, FABP4, LPL, PLIN1, ZFP423) and contain a single large lipid droplet, therefore resembling white adipocytes in appearance. In particular, adiponectin (AdipoQ) expression is already present in BM preadipocytes and stromal precursors, then increases with differentiation (6). Additionally, Krings et al. (7) have revealed that BMAT from whole tibiae in C57BL/6 mice possibly have a distinctive phenotype, expressing genes characteristic of both white and brown adipose tissue (WAT and BAT, respectively), congruent with the expression pattern of purified, primary human BMAds (7–9).
Indeed, Tavassoli et al. identified in 1976 two distinct populations of BMAds: after treatment with hemolytic anemia-inducing agent phenylhydrazine (10) one population remained stable while another population disappeared, and was described as labile BMAds. These two different “stable” and “labile” BMAd populations could be distinguished using performic acid Schiff (PFAS) staining (11). The presence of two different populations of BMAds localized to different regions of the skeleton was also more recently shown by Scheller et al. In mice, smaller BMAds (31–33 μm cell diameter) are interspersed between hematopoietic cells in the femur, the proximal portion of the tibia, and almost all skeletal segments that contain hematopoietic BM, while larger BMAds (38–39 um) are localized in the distal portion of the tibiae and phalanx [(12); Figure 1]. When challenged with cold exposure, BMAds interspersed in the red/hematopoietic marrow decreased in size and number, while the adipocytes localized in the yellow/adipocytic marrow did not change. The terms “regulated” and “constitutive” BMAT, respectively, have thus been proposed.
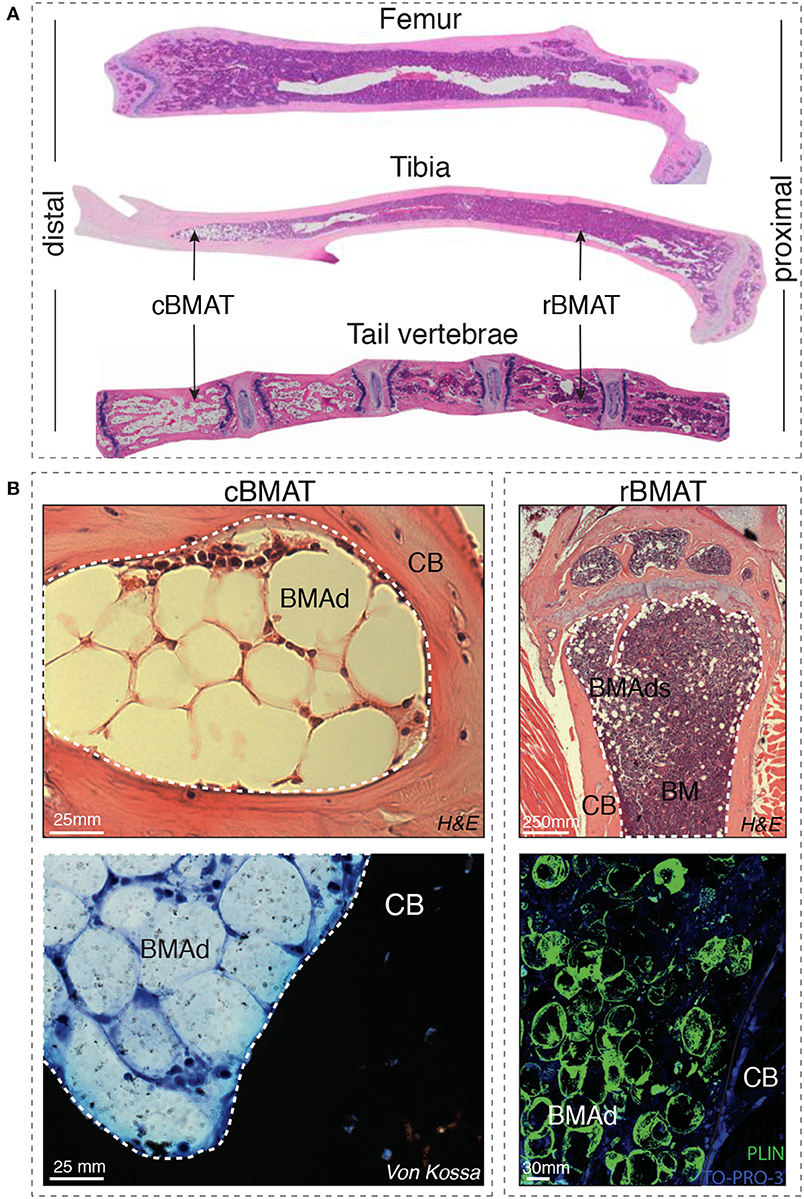
Figure 1. (A) Distal-proximal representative images in Hematoxylin & Eosin (H&E) stain of 4μm paraffin sections of femur, tibia and tail of 8-week-old mice. Note that the artefactually empty region in the center of tibia and femur corresponds to the expansion of the central vein lumen due to fixation-mediated retraction. (B) Left panels: Murine bone marrow adipocytes in the tail vertebrae of 24-week-old mice (cBMAT) of 3μm paraffin sections stained with H&E (top) and 6μm sections stained with von Kossa/Methylene Blue (bottom). Right panels: murine bone marrow adipocytes in the proximal tibia of 24 weeks-old mice (rBMAT) of 3μm paraffin sections stained with H&E (top) and 100μm sections stained with perilipin immunofluorescence (bottom, Perilipin in green and TO-PRO-3 nuclear counterstain) of 50-week-old mice. All images correspond to C57BL/6 female mice housed at room temperature fed ad libitum standard diet. BM, bone marrow; BMAd, bone marrow adipocyte; CB, cortical bone; cBMAT, constitutive bone marrow adipose tissue; H&E, hematoxylin and eosin; rBMAT, regulated bone marrow adipose tissue.
BMSCs and committed BM pre-adipocytes are more easily isolated and have seen a larger number of in vitro assays developed than mature BMAds, which are more difficult to handle in culture or to process in whole bone samples. In vivo lineage tracing models have started to pave the way, while specific markers for BMAd maturation remain to be identified. If successful, identification of specific biomarkers at the different stages of BM adipogenesis in both mouse and human will provide tools to dissect the impact of BMA in physiology and disease. In vivo imaging technologies are being adapted from studies of different tissues (e.g., peripheral adipose tissue) and species (e.g., human to mouse), while novel ex vivo imaging techniques are being adapted and developed specifically for BMAds and BM stromal imaging. All such techniques and their limitations and challenges are reviewed in the six sections that constitute this review, and guidelines for reporting of BMA-related results to maximize comparability are proposed in the concluding remarks (Table 1). For clarity, an abbreviation table is provided the manuscript (Table 2).
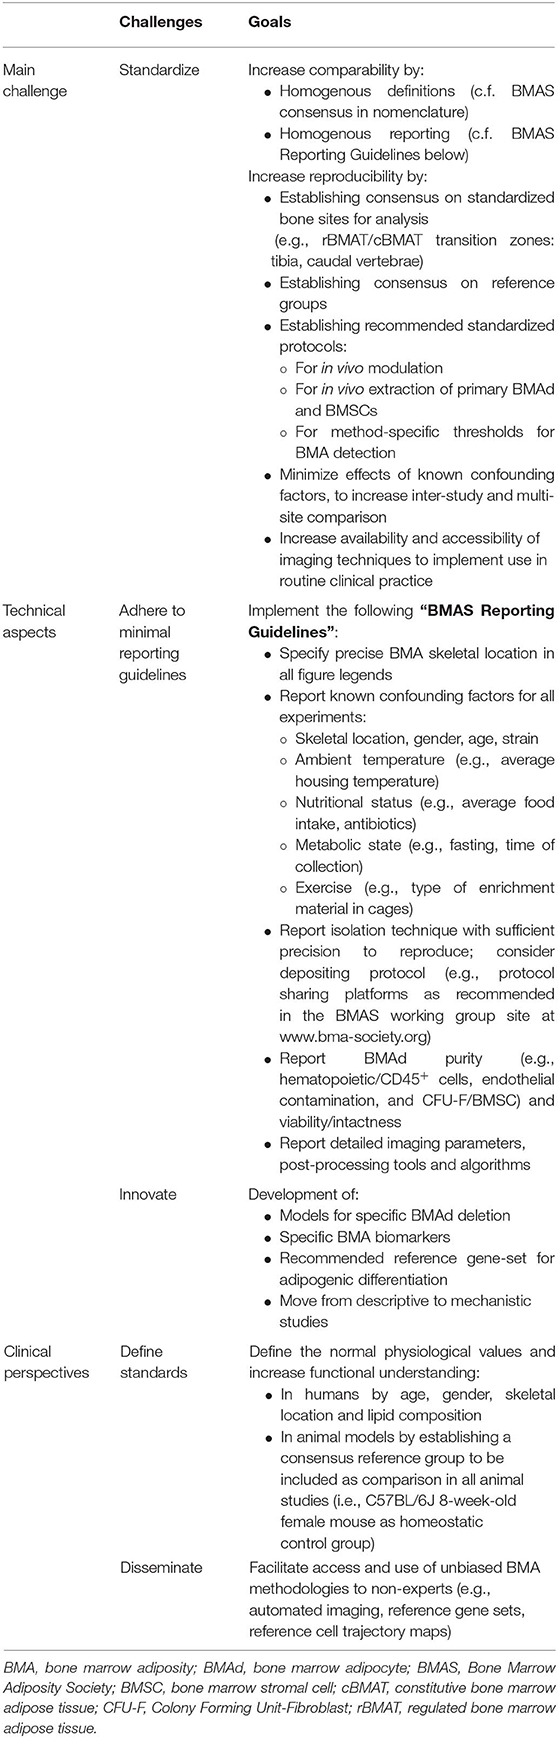
Table 1. Challenges and goals ahead for the BMA field and the BMAS WG in methodologies.
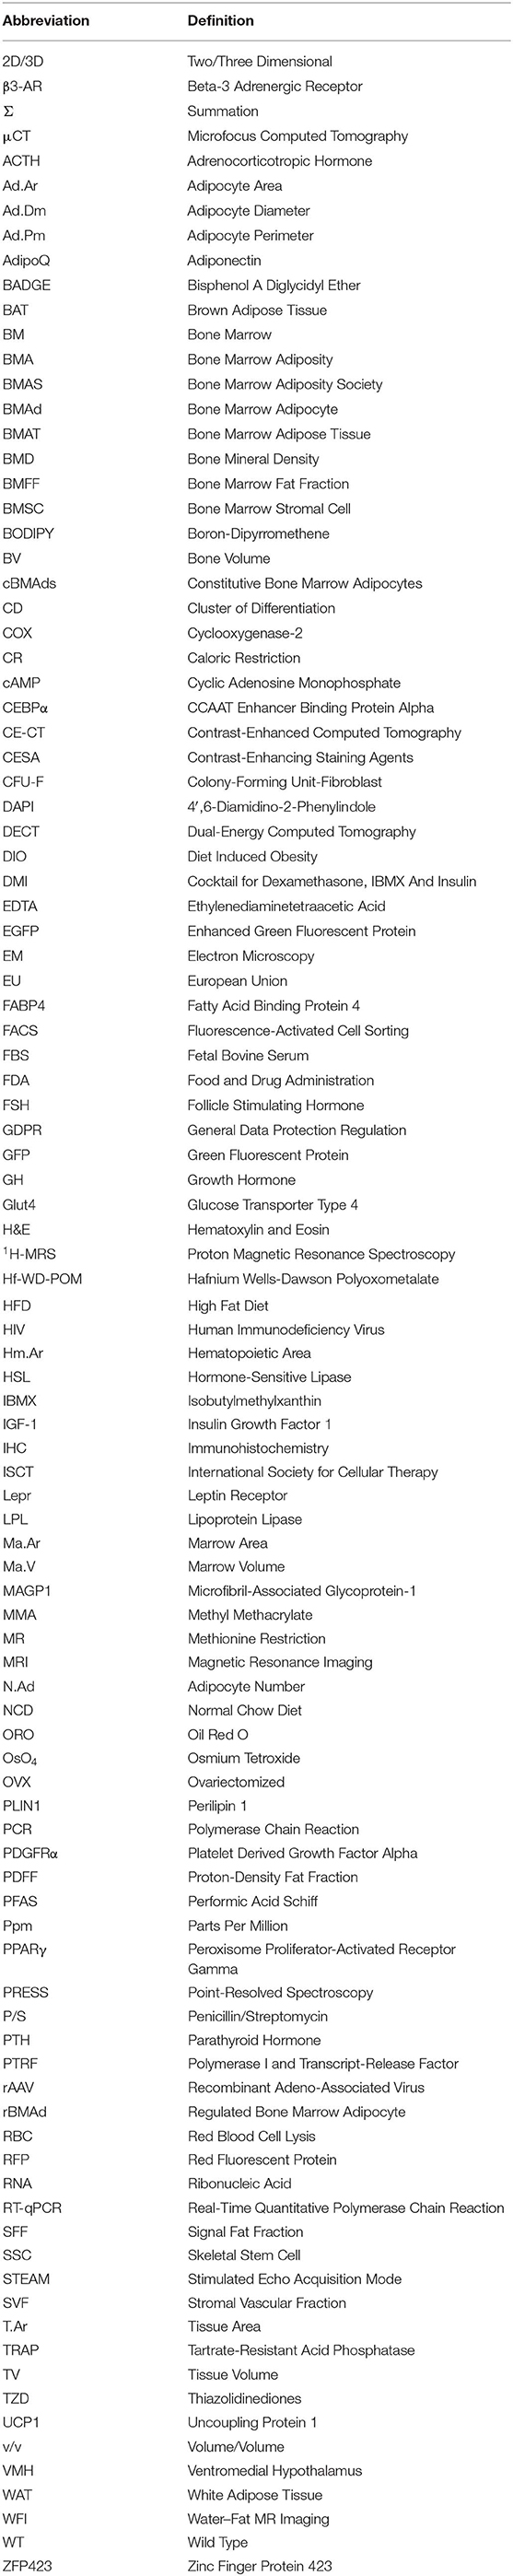
Table 2. List of abbreviations.
Of note, even with such significant technological advances over the last decade, histological analysis has been a historical contributor in the understanding of BM composition and architecture, and is rapidly evolving through automatization via Digital Pathology. Histomorphometry therefore remains an important aspect of standard methodological practices in basic or translational research as well as clinical laboratories.
In addition, although rats and non-rodent animal models are recommended by the food and drug administration (FDA) or European Union as a model for osteoporosis, the field of BMA extends beyond bone health itself to the study of energy metabolism, hematopoiesis and metastatic bone disease, amongst other subfields. Mice constitute very important models for these other aspects of BMA research, especially in their quality of premier animal for genetic studies, and are thus recognized as preclinical model in this context. Nonetheless, we would like to encourage the study of BMA in larger animals and other rodents, especially when bone health and biomechanical properties of bone are being assessed.
Histomorphometry
The field of bone histomorphometry was accelerated in 1976 when Dr. Parfitt published “Terminology and symbols in bone morphometry” which lay the foundation for the first Guideline on Bone histomorphometry (13). We can now build on this important consensus to establish additional guidelines on histomorphometry of BMAT. In 1987 Parfitt et al. listed three different meanings for bone; mineralized bone matrix, bone matrix, and bone tissue (14). Bone tissue encompasses bone and a soft tissue within it, the BM. The BM includes hematopoietic cells and its precursors, physically and functionally supported by diverse BM stromal cell populations [reviewed in (15)]. The latter is a three-dimensional network of cells in contact with developing blood cells in the extravascular space. The known main cell types that constitute this network are: osteogenic cells near bone surfaces, perivascular cells associated to sinusoids, and adipocytes. As discussed in this first section, methods to quantify marrow components via histomorphometry are based on different sample preparation, embedding and staining techniques, most requiring an intermediate step of decalcification and some allowing for epitope conservation for immunostaining. Paraffin-embedded samples have the advantage of access to large retrospective collections and potential comparability across sites, especially for the clinical setting where paraffin-embedding is standard. Other conservation procedures allow for more precise histomorphometric quantification, and some do not require decalcification [methyl methacrylate (MMA), or resin embedding, including technovit 900].
Sample Preparation
Histomorphometric analysis relies predominantly on the quality of the sample. Therefore, careful consideration of the sample preparation is important. To prepare a BM sample, either calcified or decalcified bone samples can be embedded in paraffin or plastic, depending on the desired staining procedure (16, 17). For both procedures, the BM sample is regularly fixed in 4% Paraformaldehyde. Afterwards, the sample can be sectioned in conventionally 4–5 μm sections.
Decalcification
Several options of decalcifying agents are available, though Ethylenediaminetetraacetic acid (EDTA) is advised as compared to acid-based decalcification to enable most enzymatic and immunohistochemical stainings (18). Different factors can control the rate of the decalcification process: concentration of decalcifying agent, temperature, density of the sample, agitation and thickness of the tissue. In general, a large volume (e.g., 20x that of the sample), a high concentration of decalcifying agent and a high temperature (e.g., 20–37°C) during decalcification can speed up the reaction process. In contrast, increase of the size, density, and thickness of the sample may require longer decalcification time (17, 18). For an optimal immunostaining, an uniform decalcification of the sample is important, and we recommend decalcification at room temperature or 4°C on constant shaking, a large volume of EDTA to sample (at least 10:1 v/v) and several refreshments of the solution (every 3–4 days) to prevent calcium saturation (19).
Decalcification can also be performed using acidic agents to dissolve the calcium salts from the bone. This group of agents includes strong and weak acids. However, strong acid agents (nitric and hydrochloric acid) should be avoided in order to preserve the integrity of the cells and the enzymatic activity if subsequent immunostainings are desired (20). Among the group of weak acids (picric, acetic, and formic acid), decalcification performed with Morse's solution (50% formic acid and 20% sodium citrate) can also preserve the integrity of the sample for immunohistochemistry while allowing for high quality architectural evaluation with Hematoxylin and Eosin (H&E) staining (21). Dehydration is required prior to embedding. Ethanol dehydration in graded increases of ethanol and xylene, can allow for long-term storage of bones in 70% ethanol prior to embedding (22).
Embedding
To embed the samples after dehydration, several options exist. Most common and available is paraffin embedding. Decalcification is, however, necessary. This protocol is very useful to perform immunostaining, but the integrity of BM content, due to the juxtaposition of hard (decalcified bone) vs. soft (marrow) tissue is not guaranteed. Alternatives to paraffin are MMA or technovit 900 embedding. These do not require decalcification and allow for better preservation of the adipocyte morphology. However MMA and technovit 900 are less available in most laboratories and immunohistochemical staining becomes a challenge due to the destruction of the antigen presentation with the conventional MMA embedding protocols (23). With all embedding methods the histological procedure dissolves all the lipids in the vacuole, therefore the adipocytes are referred to as “ghosts,” which makes it impossible to investigate lipid content and composition in combination with histology.
To resolve this issue, Erben et al. developed an alternative protocol for plastic embedding, that avoids the complete loss of enzymatic activity in the tissue by adding methylbenzoate during the infiltration process and polymerization of the plastic (24). Here, cold embedding seems to be crucial for antigen presentation in the immunohistochemical procedure. Enzymatic activity is also preserved by using another resin embedding system (e.g., Technovit 9100) that contains methyl methacrylate and catalysators that allow the polymerization at low temperature (4°C) (25).
Staining
Although the adipocyte lipid vacuole is empty due to the ethanol-based dehydration necessary for histological procedures, these mature adipocyte ghosts are easily identifiable with several standardized staining procedures. The most frequently used in paraffin embedded bone is the H&E stain. Standardized staining procedures for plastic embedded bone, such as Goldner's trichrome, toluidine blue and Von Kossa staining can also be used to identify mature adipocyte ghost cells (24).
The discrimination between BMAds and blood vessels in a cross section can be difficult since the BM microenvironment is densely populated by blood vessels of different types and diameter and the endothelial wall is not always identifiable (26). Immunohistochemistry for Perilipin (27), a marker of mature adipocytes, is therefore useful for identification of BMAds in both human and murine tissues (Figure 1). Alternatively, immunostaining for Endomucin and/or CD31, markers for endothelial cells can be used to discriminate between blood vessels and adipocytes (28).
Quantification
Two types of dimensional quantification are possible: two dimensional in terms of perimeter, diameter and area, and three dimensional in terms of volume and surface (29). Moreover, as described in the consensus on bone histomorphometry (30) and extensively discussed in the accompanying BMAS nomenclature position paper, BMA parameters should be presented in relation to a reference region (31). By using a common referent, it is possible to assess changes in the number or percentage of adipocytes following an intervention or comparing physiological and pathological states. For histological measures of BMAT, two-dimensional measurements of BMAT are applicable and two reference areas should be used: Marrow area (Ma.Ar) and total tissue area (T.Ar). It is important to distinguish between these two areas since the interpretation is notably different. When bone mass is lost and replaced by other marrow tissue, the Ma.Ar is increased while T.Ar remains similar. Marrow adiposity increases only when the area of BMAds increases relative to the marrow space. For three-dimensional ex vivo or in vivo measurement, Marrow volume (Ma.V) and Total tissue Volume (TV) should be used. A priori, two-dimensional measures should be used in standard bone histomorphometry and three-dimensional measures should be reserved for techniques which rely on 3D measurements, as discussed in the ex vivo or in vivo sections. Three-dimensional measurements may be used in histomorphometry when analysis of serial sections is performed to approximate volumes.
Additionally, measurement of the size of individual adipocytes is important in the analysis of BMAT, since the changes in total adipose tissue can be due to either an increase in the number of adipocytes or an increase in the size of the adipocytes. This distinction is important since the mechanism behind these changes can reveal both differences in adipogenic differentiation (affecting the number) or in lipolysis (affecting the size). In consensus with the Nomenclature working group of the BMAS, we suggest to use the terms Perimeter (Ad.Pm), Diameter (Ad.Dm), and mean Adipocyte Area (Ad.Ar) to address adipocyte size. Adipocyte areas can be reported for individual BMAds, giving rise to the frequency distribution of BMAd areas and corresponding measurement of mean or median Ad.Ar. In addition, adipocyte area can be reported at the tissue level as % of total adipocyte area relative to hematopoietic area (ΣAd.Ar/Hm.Ar), tissue area (ΣAd.Ar/T.Ar) or, most commonly, to marrow area (ΣAd.Ar/Ma.Ar) also commonly reported as “marrow adipose area” or less precisely as “marrow adiposity.” Hematopoietic area is defined either by CD45 positivity in immunohistochemistry or, morphologically, by the areas defined by the high density of hematopoietic cell nuclei within the marrow space. Exhaustive recommendations on BMA nomenclature are available in the accompanying white paper authored by the BMAS Working Group in Nomenclature (31).
Another important histological measure for adipocytes is the density of adipocytes. This is also used to differentiate between adipogenesis or enlargement of the adipocyte due to lipid storage. Adipocyte density can be measured as number of adipocytes per marrow area (N.Ad/Ma.Ar), number of adipocytes per hematopoietic area (N.Ad/Hm.Ar) or as number of adipocytes per tissue area (N.Ad/T.Ar). Adipocyte density varies greatly in the endocortical vs. trabecular regions of the bone, and thus detailed annotation and standardization of the quantified region is paramount, as detailed in the BMAS reporting guidelines (Table 1).
Software
To quantify these parameters, a selection of software packages are available. Some have been developed for extramedullary adipose tissue and require manual adipocyte measurements, while others are designed for assessment of BM sections and are semi-automated, with a few entirely automated (listed in Table 3). Automated or semi-automated detection programs use shape (roundness, circularity) and the absence of color within the lipid vacuole for detection of BMAds. While such software packages are not yet routine, most laboratories have developed them in-house in order to perform adipocyte histomorphometry. Some of these software packages are freely available online (peerJ, fathisto, and MarrowQuant, see Table 3).
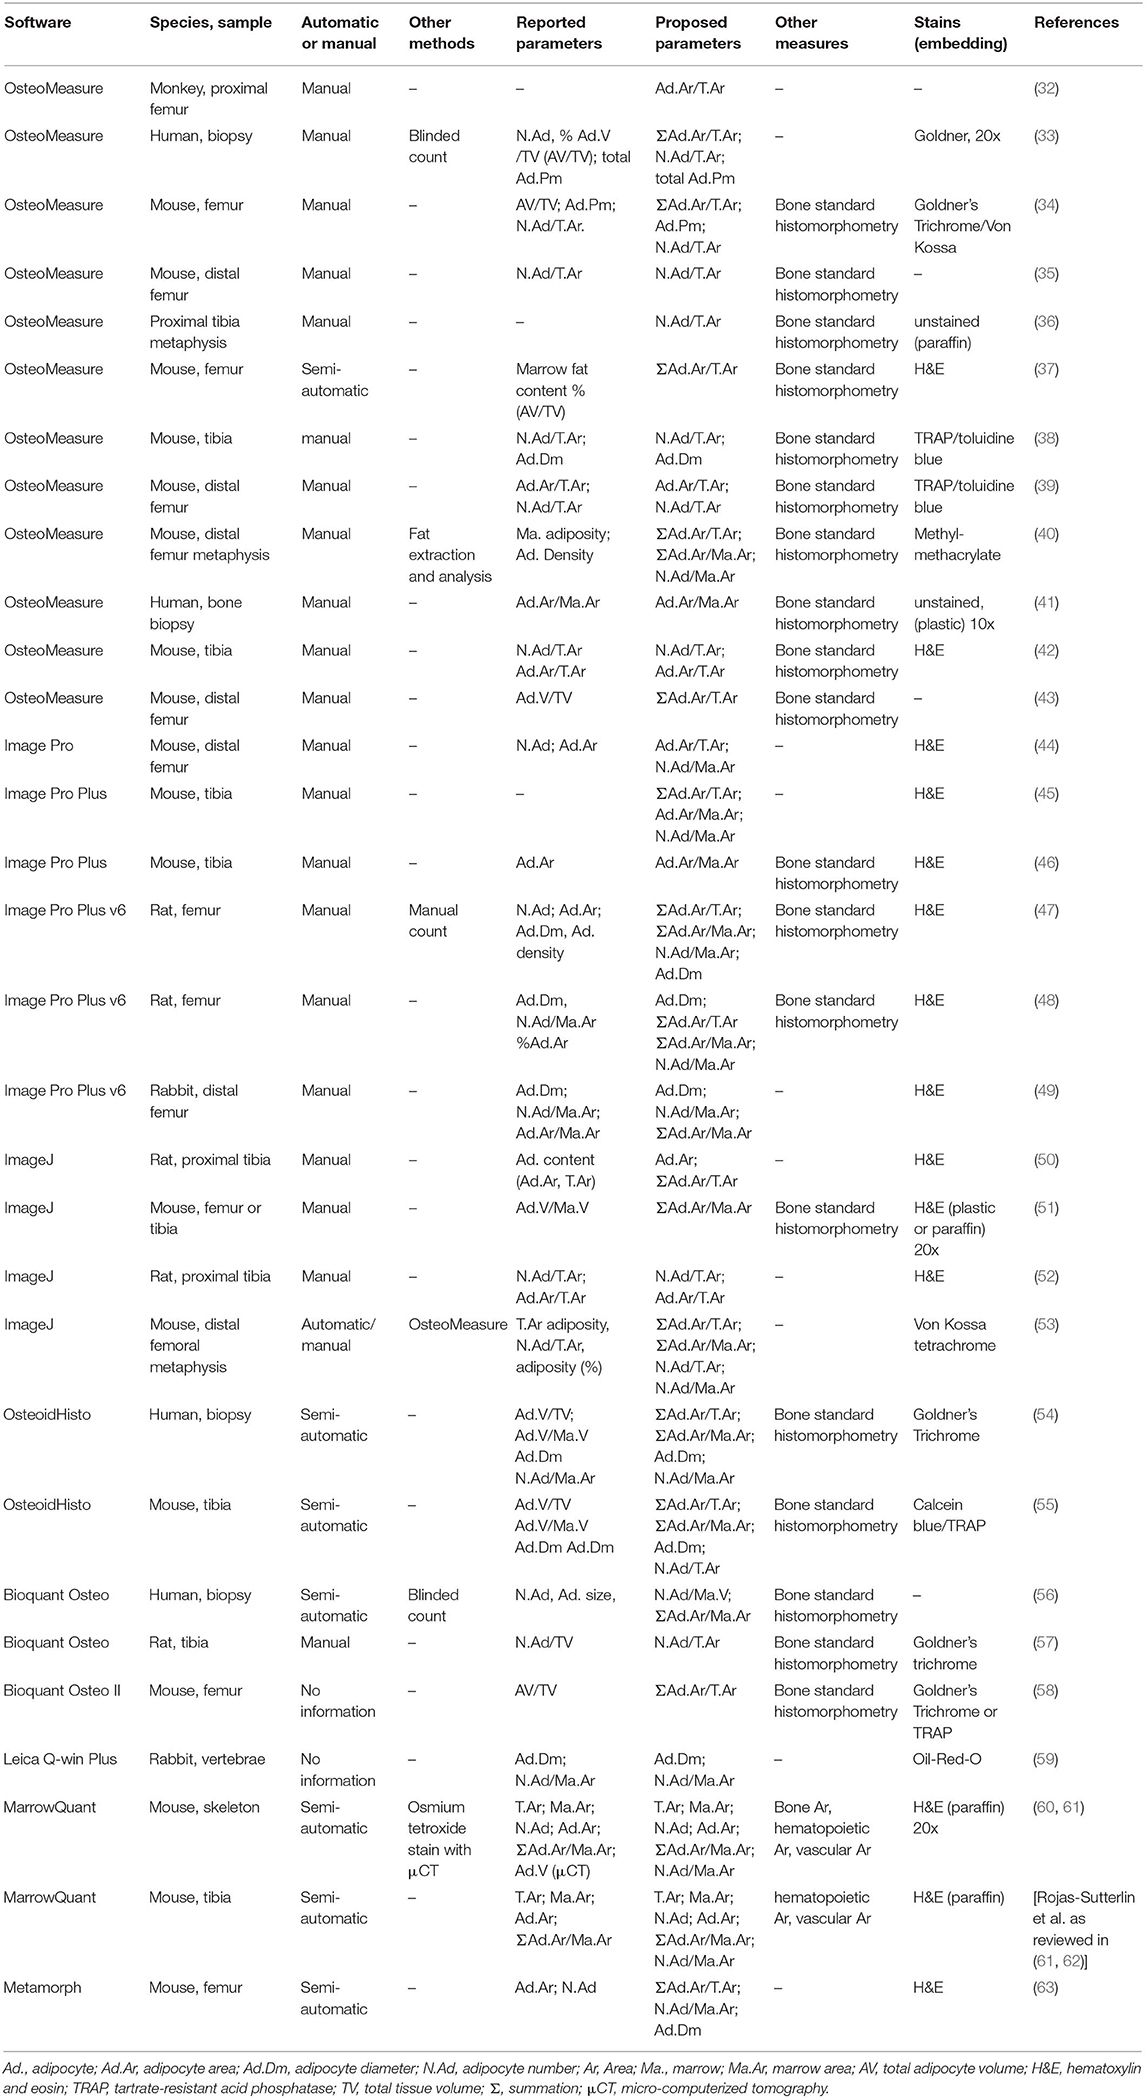
Table 3. Description of the most used software for bone marrow histomorphometry.
Challenges and Limitations
Histomorphometric analysis is a very useful tool to determine the quality of bone and assess changes in the number and size of cells. One of the limitations is that histomorphometry is a time-consuming technique requiring microscopy, software and/or manual quantification. In addition, it is a technique that until now has relied on the interpretation of the single investigator, and therefore demands a solid quality control system. The detection of BMAds can be hampered by the close connection of adipocytes in yellow/adipocytic areas, making the separation and adequate counting of clustered adipocytes a big challenge, in particular if membranes are not intact. In mice, the number of adipocytes in long bones tends to be lower in sites of regulated BMAT, and thus separate adipocytes can be more easily discerned and counted in the red/hematopoietic marrow.
However, the distinction of adipocytes from small blood vessels can be a challenge, whether for manual quantification or automated algorithms, especially in the younger animals or in the context of marrow regeneration. Additional immunostains to discern microvasculature from adipocyte ghosts are thus highly recommended as a validation step. Moreover, one must keep in mind that histological sections are a cross-section of the bone/marrow organ and thus of the BMAd itself. In general, validation of automatic detection of adipocytes is not described, neither by presenting data on quality control measurements nor by comparison with a manual method. We therefore consider manual detection of adipocytes the gold standard for histomorphometry until automated software packages have been validated. Annotation and standardization of the quantified region, as well as reporting of the experimental parameters as detailed in the BMAS reporting guidelines (Table 1) cannot be emphasized enough. Additionally, correlation of histomorphometry findings with ex vivo or in vivo bone measurements of lipid content to calcified tissue constitutes a much-valued biological validation of findings. Finally, a recommendation on which bone may be considered as standard for reporting is premature, but we agree that choosing areas of transition between regulated and constitutive BMAT is most informative (e.g., tibia and/or caudal tail for mice).
Ex vivo Whole-Bone Imaging
Histological slicing and histomorphometry remain the gold standard for the ex vivo evaluation and characterization of biological tissues in general, and BMAT in particular, by measuring adipocyte cell size and cell number. However, histological assessment (sectioning, staining, imaging, and analysis) remains a challenging, time-consuming, and often costly technique (29). Moreover, spatial patterns as well as the spatial inter-relationship between different tissues within one sample (for example BMAT in relation to bone and vasculature) can be inaccurate or impossible. To overcome some of the limitations of 2D analyses, several 3D imaging techniques have emerged to quantify the morphometry, spatial distribution of BMAT and its inter-relationship with other tissues in the marrow. In addition, mass spectrometry and high-profile liquid chromatography remain complementary standard methods to dissect lipid composition upon extraction (64, 65).
Contrast-Enhanced Microfocus Computed Tomography
X-ray microfocus computed tomography (μCT) is a very powerful tool for 3D imaging of mineralized tissues (66). High-resolution μCT (<2 μm voxel size) and nanoCT [down to 150 nm (67)] scans are achievable and a high field of view to voxel size ratio can be obtained (68). While one of the biggest advantages of μCT is its non-destructive character, a considerable limitation of this technology is its lack of specificity for soft tissues. Phase contrast μCT is a possible solution, as it can be used to, for example, enhance edges, which allows a better visualization of soft tissues (69). Indeed, it provides information concerning changes in the phase of an X-ray beam that passes through an object. Moreover, it uses monochromatic X-rays, resulting in accurate measures of the attenuation coefficient, and thus enabling quantitative μCT imaging. This technique requires, however, highly dedicated hard- and software, and is not readily available. In addition, to the best of our knowledge, phase contrast imaging has so far not been used to visualize BMAT. Therefore, the focus of this review is rather on desktop single energy, polychromatic absorption contrast-enhanced μCT (CE-CT) imaging. Although having its limitations in the cone-beam shape of the X-ray bundle and the lower X-ray flux compared to synchrotron μCT, scanning times down to 15 min for high-resolution imaging can be achieved nowadays. For this kind of CE-CT, typically, there are two kinds of contrast agents used for the visualization of soft tissues: perfusion contrast agents, mostly used for in vivo or ex vivo indirect imaging of vasculature, and contrast agents that bind to the tissues for ex vivo imaging, further referred to as contrast-enhancing staining agents (CESAs). Here, we will focus on CESAs, which have proven to allow CE-CT imaging of BMAT.
The introduction of CESAs has enabled contrast-enhanced CE-CT to become a very important tool in biomedical imaging. CESAs bind to tissues of interest, increasing the X-ray attenuation coefficient (70). The very first reports on the use of CESAs for CE-CT imaging of soft tissues go back to only about a decade ago. Indeed, several groups (71–73) used osmium tetroxide (OsO4) on mouse embryos, pig lungs, and honeybees, respectively, to enable virtual 3D anatomical analyses using CE-CT. Although in these studies OsO4 was used for general tissue staining, it is well-known for its specific binding to unsaturated lipids (74, 75). Consequently, several years later, Scheller et al. reported the use of OsO4 for 3D CE-CT visualization of BMAT and quantification of its amount and distribution in long bones of mice using standard μCT (12, 76) and subsequently, ultrahigh-resolution μCT (77).
OsO4-based BMAT characterization requires a two-step scanning protocol: first, bones are detached and thoroughly cleaned from soft tissues, fixed, and scanned to enable characterization of 3D calcified bone parameters. The fixed bones are subsequently decalcified and then stained with OsO4 for 48 h (76) or longer if the mouse models develop severe BMAT accumulation. Subsequently, OsO4-stained bones are rescanned. These images provide 3D quantification of BMAT structural properties, such as adipocyte volume/total volume (Ad.V/TV), adipocyte volume/marrow volume (Ad.V/Ma.V), and adipocyte volume/bone volume (Ad.V/BV), which are quantified based on the amount of osmium-bound lipid. When combining OsO4 staining with high-resolution μCT imaging, individual adipocytes can be distinguished (Figures 2A,C,E) and a distribution of diameter can be calculated. When combined with image coordinate registration, this technique allows alignment of both the BMAT distribution and bone micro-architecture, as well as calculation of the distance of the BMAds from the bone surface (80). Some studies have also used this approach to measure BMAd density (cells/mm2 Ma.V) (81). The use of OsO4 for CE-CT-based BMAT visualization in mouse bones has quickly become widespread due to its compatibility with existing μCT infrastructure, ease of use, and reasonable cost (63, 82–84). As with most techniques, a high level of standardization is needed for each step in the procedure (fixation, decalcification, OsO4 staining, imaging, and analysis). For example, insufficient decalcification can lead to problematic osmium penetration and staining (85). Indeed, the limited tissue penetration capability makes staining of dense regions of adipocytes or larger bones problematic, restricting this technique primarily to whole bones in mice. Moreover, OsO4 staining is highly toxic, needing careful handling within a fume hood and appropriate disposal (86, 87).
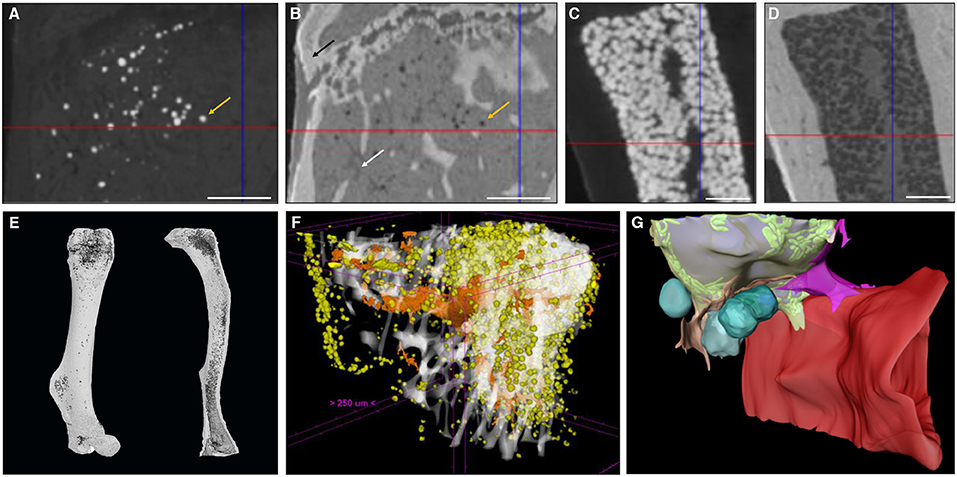
Figure 2. Zoom of a longitudinal CE-CT cross-section of the metaphysis of a murine tibia from a 16-week-old C57BL/6Rj male mouse fed ad libitum standard diet, using (A) osmium tetroxide and (B) Hf-WD POM staining, on the same sample. The orange arrows indicate the same adipocyte. The black arrow in (B) indicates the bone and the white arrow indicates a blood vessel. Zoom of a longitudinal CE-CT cross-section of the diaphysis of a murine long bone using (C) osmium tetroxide and (D) Hf-WD POM staining on the same sample. Scale bars = 250 μm. 3D rendering of (E) an osmium tetroxide stained murine femur (left) and tibia (right) from an 11-week-old C57BL/6J male fed ad libitum standard diet at room temperature, where adipocytes are presented in dark gray and bone in light gray. (F) Hf-WD POM stained murine tibia from a 30-week-old C57BL/6Rj male mouse fed high fat diet for 22 weeks [reprinted with permission from (78)], where white represents the bone, orange the blood vessels and yellow the marrow adipocytes. (G) 3D EM image of an adipocyte [reprinted with permission from (79)]. Lipid is shown in gray, mitochondria in green, cytoplasm in semi-transparent yellow, vascular sinusoid in red, perivascular cells in pink and orange, and blood cells in turquoise.
To overcome these limitations, a recent study by Kerckhofs et al. reported the simultaneous visualization of mineralized and soft tissue structures within bones (Figure 2F) utilizing Hafnium Wells-Dawson polyoxometalate (Hf-WD-POM) as CESA (78). For this technique, murine long bones are incubated in POM powder dissolved in phosphate buffered saline while shaking gently for 48-h to 5-days. Samples are then scanned in the staining solution, or wrapped in parafilm and put in a sample holder for scanning. Thanks to the combination of the hydrophobic behavior of adipocytes and the binding of Hf-WD-POM to the BM tissue, visualization of the adipocytes is possible. When combining this CESA with high-resolution scanning (about 2 μm voxel size, maximum total image volume about 6 × 4.8 × 6 mm3), BMAds can be imaged at the single cell level (Figures 2B,D,F). This not only facilitates measurement of the volume fraction of BMAT within the bone (Ad.V), but also enables the quantification of the BMAd Number (N.Ad), density (N.Ad/TV), and Diameter (Ad.Dm). Additionally, with sufficient contrast, the vascular network can be discriminated from the other marrow tissues. This allows for full 3D blood vessel network assessment (i.e., branching and spatial distribution). Hence, Hf-WD POM-based CE-CT provides complementary data to standard histomorphometry, with enhanced 3D spatial information and inter-relation between different tissues in the BM compartment (Figure 2F). This was recently used to show that BMAT increased after menopause, and that increased BMAT was associated with osteoporosis and prevalent vertebral fractures (55). It should be highlighted that Hf-WD POM is non-invasive and non-toxic, and does not interfere with subsequent histological processing and immunostaining. A limitation of Hf-WD POM, however, is that it is not yet commercially available, although it can be requested in the frame of a collaboration.
When making a direct comparison between Hf-WD POM and OsO4 using high-resolution CE-CT, it was observed that both CESAs performed equally well for detecting BMAds (Figure 2). For locations with a low to medium BMAT amount, however, OsO4 staining was more sensitive in visualizing the sparsely distributed adipocytes (Figures 2A,B). For medium to high BMAT content, OsO4 tended to overestimate the adipocyte size due to high contrast difference between stained adipocytes and background, and thus contributed to the partial volume effect (Figures 2C,D). For this condition, Hf-WD POM allowed more accurate separation of individual adipocytes. Advantages and disadvantages of these ex vivo techniques are summarized in Table 4.
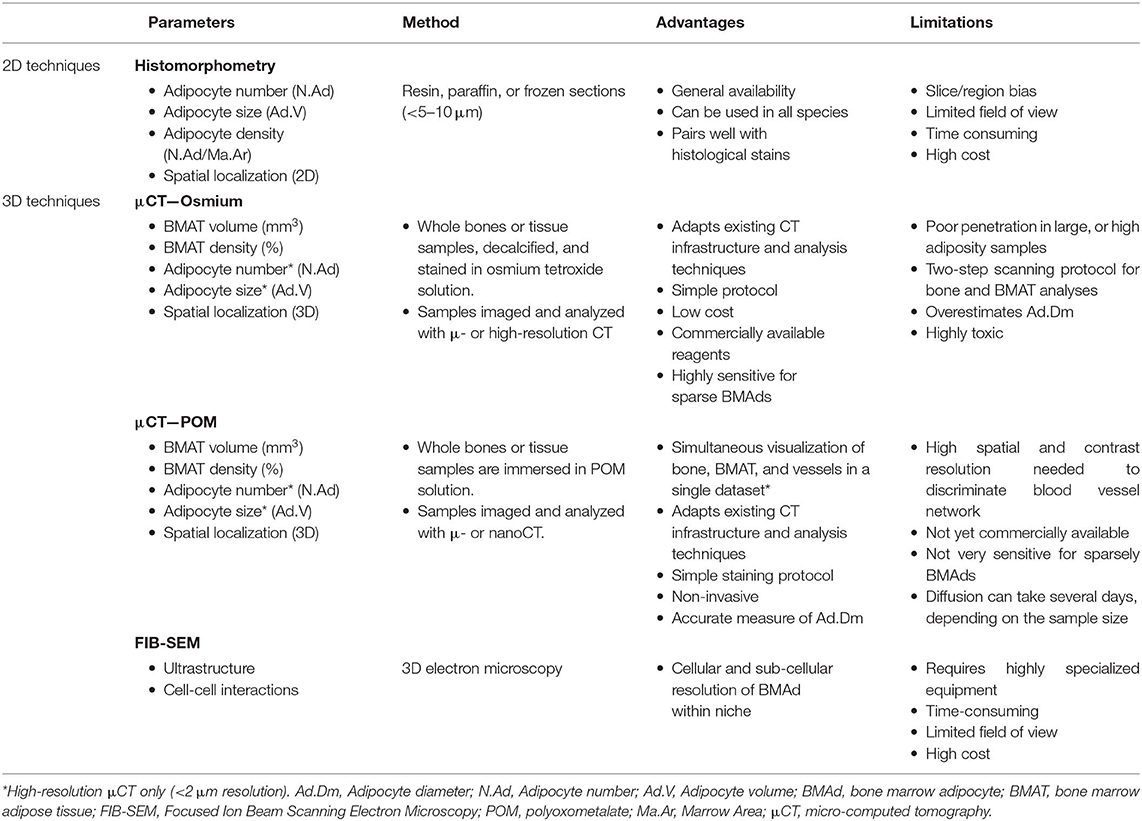
Table 4. Main quantitative parameters assessed when using ex vivo imaging techniques to explore bone marrow adipose tissue.
Future Challenges: 3D Microscopy
In recent years, standard microscopy techniques have also been optimized to gain 3D information about whole-bone cellular networks and nanoscale insight into the microenvironment of single cells. For example, tissue clearing strategies in skeletal tissues allow mapping of vascular networks and cell distributions in whole bones using light-sheet or two-photon microscopy (88, 89). Similarly, >50 μm-thick section immunohistochemistry can provide ex vivo insight into cell localization in 3D via conventional confocal microscopy (90). Though not yet published, we anticipate that clearing techniques described for marrow tissue will be used to provide novel information about BMAT localization and function. A key advantage relative to CT-based analyses is the ability to interrogate local cells and pathways that are defined based on expression of specific proteins and biomolecules using antibodies or genetically modified rodents.
At the nanoscale, focused ion beam scanning electron microscopy (EM), a form of serial EM that allows for 3D reconstructions at subcellular resolution, was recently applied to the BMAT adipocyte niche (79). This work builds upon previous 2D EM analyses of BMAT (11) and has helped to define interactions of BMAT with surrounding cells at the endothelial interface, within the hematopoietic milieu, and at the bone surface (Figure 2G). The major limitation of all of these techniques is the need for specialized imaging equipment. In many instances, data handling and analysis paradigms, which require very sophisticated statistical analysis to correct for the boundaries imposed by the confined bone architecture (91), are also just beginning to emerge. In any case, the development of regularly revised common standards and the commitment to BMAS reporting guidelines, as specified in Table 1, will increase comparability and pave the way for the comparative studies necessary to determine future gold standards in this rapidly evolving field.
In vivo Imaging
While ex-vivo techniques provide ample information of structures and allow for specific quantification of tissues, non-invasive imaging tools are essential when it comes to clinical studies so as to better understand the pathological processes that affect the BM in situ. To date, magnetic resonance imaging (MRI) is considered as the reference imaging modality to appraise in vivo BMA (92, 93). This powerful imaging tool has been used in animals, for example to follow the effects of zoledronic acid treatment on marrow adipogenesis in ovariectomized rats (47), to quantify the decrease in BMAT volume in obese exercising mice (63), and to follow the progression of BMA in murine hematopoietic recovery [(60, 61); Figures 3C,D]. Due to their small size, such measurements are not straightforward in rodents, as they require very strong magnetic fields for meaningful BMA signal detection, and dual-energy μCT is a valid alternative. MRI techniques are primarily applied in vivo in humans (Figures 3A,B). Indeed, the growing interest in BMA in relation with post-menopausal osteoporosis, fractures, metabolic perturbations, as well as over- or undernutrition states, opens up potential exciting perspectives for clinicians (94). However, the multiple interfaces between trabecular bone and bone marrow foster local magnetic inhomogeneities and challenge the accuracy and precision of BMAT quantification.
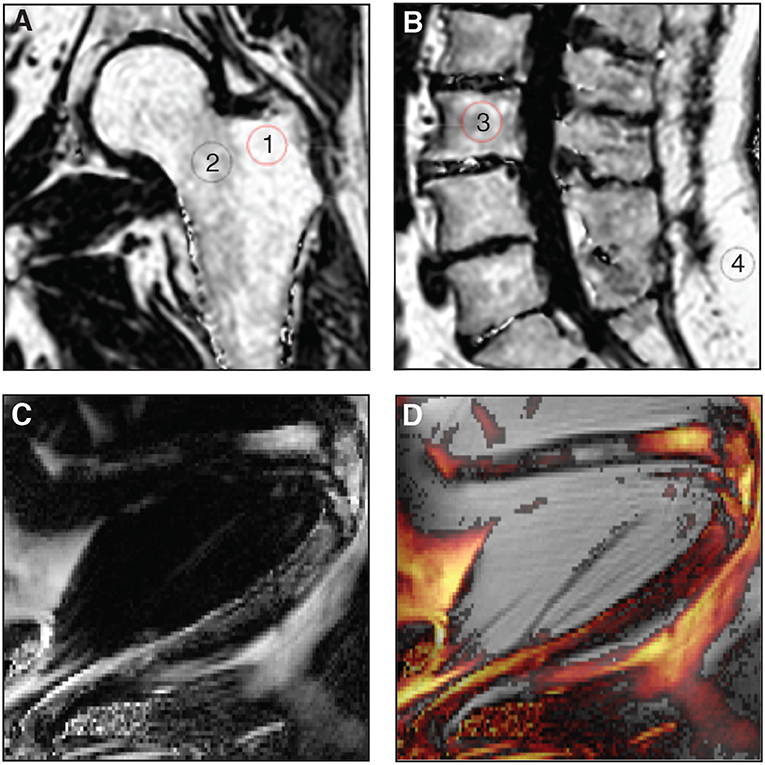
Figure 3. (A,B) Proton-density fat fraction (PDFF) maps generated using chemical shift encoding-based water-fat imaging from a commercially available sequence on a 3 Tesla magnetic resonance scanner. Coronal oblique acquisition of the left hip (A) and sagittal acquisition of the lumbar spine (B) of a 69-year-old woman with chronic lumbar and inguinal pain. Regions of interest can be drawn to assess bone marrow adiposity [(1) 94%, (2) 77%, (3) 71%, (4) 96%] at different anatomical sites through the PDFF parameter. (C,D) A three-point Dixon acquisition using a spin-echo based sequence and chemical shift encoding-based water-fat separation was conducted on a 9.4 Tesla horizontal magnet, to assess BMAT in vivo at the peak of aplasia after irradiation and bone marrow transplant in an 8-week-old C57BL6 female mice housed at room temperature fed ad libitum standard diet with antibiotics supplemented in the drinking water. The lower limb is shown as imaged in maximal flexion (61). Normalized fat content map (C) and fat content overlaid a magnitude image, red 10% - yellow 100% (D) show high BMAT content in the distal femur and also some BMAT in the proximal femur (horizontal, top of image) and throughout the tibia (diagonally across the image), in comparison to fat signal of surrounding extramedullary adipose tissue.
What Can We Measure?
Main MR Imaging Biomarkers
The most relevant imaging biomarker used to quantitatively assess BMAT using MRI is the proton-density fat fraction (PDFF), which is the ratio of unconfounded fat signal to the sum of the unconfounded fat and water signals [(92, 92, 95, 96); Table 5]. As a result, the main challenge and limitation with quantitative BMAT assessment using MRI is to minimize the confounding factors to measure only signals coming from lipid protons. Interestingly, PDFF assessment of BMAT has benefited from technical developments in abdominal imaging. These technological improvements have been crucial for the emergence of reliable and non-invasive approaches to quantify adipose tissue in a standardized manner, especially through single-voxel proton spectroscopy (1H-MRS) and chemical shift encoding-based water-fat imaging (WFI) techniques (95).
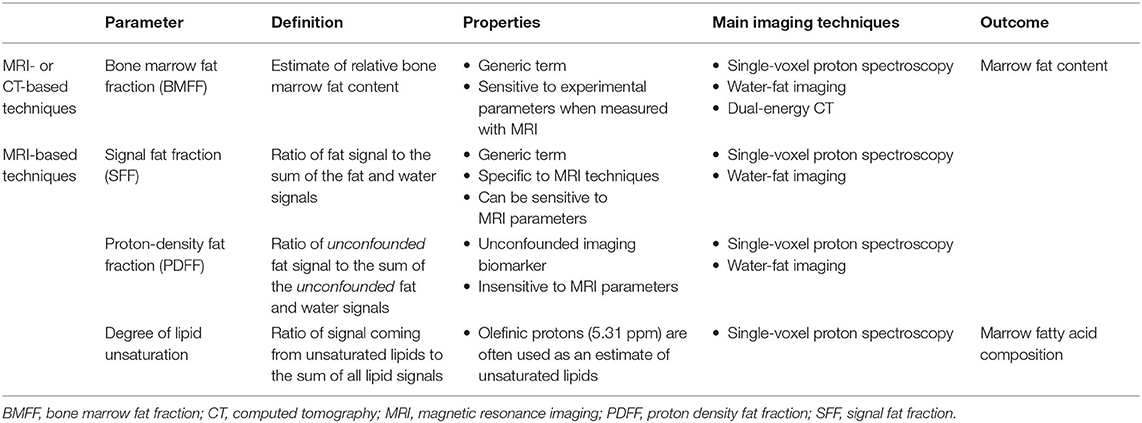
Table 5. Main quantitative parameters assessed when using in vivo imaging techniques to explore bone marrow adipose tissue.
The second most common quantitative parameter reported in the literature reflects BMAT fatty acid composition. This specific evaluation is a topic of growing interest, as saturated fatty acids may have deleterious effects on the osteoblast lineage and may play a role in multiple inflammatory processes along with certain polyunsaturated fatty acids, affecting bone health (97). Fat composition assessment can be performed through an expression of its degree of unsaturation or polyunsaturation, calculated, respectively as the ratio of signal coming from the olefinic protons at 5.31 ppm or diallylic protons at 2.8 ppm on 1H-MRS acquisitions, to the sum of all lipid signals (Table 5), as discussed in detail in section Single-Voxel Proton Spectroscopy (93).
Robustness of 1H-MRS and WFI Methodologies
When the main biases are taken into account, WFI sequences appear to be robust in quantifying PDFF against changes in experimental parameters, in good agreement with 1H-MRS [r = 0.979 reported by (98), and R2 = 0.92 by (99)], using calibration constructs [BM phantoms: R2 = 0.97; (100)], and in agreement with histology using excised lumbar vertebrae [r = 0.72; (101)]. The intraclass correlation coefficients for repeatability and reproducibility of WFI were, respectively 0.997 and 0.984 (102), and the coefficient of variation in the quantification of PDFF varied from 0.69 to 1.70% (103). Moreover, a negative correlation (r = −0.77; 77) was demonstrated between 1H-MRS-based PDFF and ex vivo biomechanical vertebral properties (failure load), highlighting the relevancy of this parameter in bone strength (104). The reproducibility of 1H-MRS is known to be excellent, especially when assessing the lumbar spine in vivo, with an average coefficient of variation of vertebral bone marrow content of 1.7% (93, 105). Although 1H-MRS has long been considered the gold standard (105), WFI seems therefore to be a relevant and efficient alternative due to its ability to derive spatially resolved PDFF maps, with an absolute precision error of 1.7% between C3 and L5 vertebrae (106), and no significant differences with spectroscopic assessment in children (99) or in adults (98).
With regard to BMAT composition, although similar values have been reported between measurements from high-resolution proton spectroscopy acquisitions on ex vivo specimen and in vivo imaging (R = 0.61; 71), the true BMAT unsaturation level is consistently underestimated in in vivo acquisitions because of the fewer visible peaks. As a result, Li et al. preferred the use of pseudo-unsaturation level to better discriminate the apparent BMAT composition assessment in in vivo studies from ex vivo measurements. This differentiation in terminology reflects well the need to bear in mind the technical limitations encountered when evaluating fat composition in vivo.
Toward a Better Standardization of MRI Techniques
Because 1H-MRS and WFI can be performed in most clinical facilities, their main technical limitations must be taken into account when assessing in vivo BMAT. A better standardization of the methodologies used to quantitatively assess BMAT would increase the accuracy of the reported PDFF in the literature, as well as the relevancy of inter-study comparisons.
Single-Voxel Proton Spectroscopy
Based on the frequency shift which exists between molecular groups, signals from water and lipid protons can be discriminated in a defined voxel of interest through 1H-MRS. However, although the area under each peak of the acquired spectrum is related to the number of protons of a specific chemical moiety, the MRS acquisition and post-processing analysis to calculate PDFF needs to consider the following confounding effects.
First, the water and fat components of BMAT have different T2 relaxation times. Therefore, in the absence of any T2-correction, the calculated signal fat fraction from 1H-MRS acquisitions is T2-weighted, depends on sequence parameters and overestimates the true PDFF. An 1H-MRS acquisition at different echo times combined with a T2 correction can removed T2-weighting effects (107, 108).
Second, even though initial 1H-MRS studies mainly considered the methylene group peak at 1.3 ppm to calculate bone marrow fat fraction or lipid/water ratio, adipose tissue has a complex spectrum made of multiple peaks. An oversimplification of the model used may reduce the accuracy of the qualitative and quantitative fat assessment. However, the trabecular microarchitecture promotes broad spectral peaks which make peak fitting challenging (93). Nevertheless, constrained peak fitting methodologies have been depicted and performed successfully at the hip and lumbar spine (107, 108).
Third, the short T1 value of bone marrow fat compared to water induces a relative amplification of the measured signal. PDFF calculations might be subsequently biased if T1 effects are not minimized. This effect can be minimized by using long repetition times for 1H-MRS acquisitions (93, 95, 109, 110).
Finally, the choice of the sequence mode is also of importance and depends on the employed echo times. By lowering J-coupling effects and being able to acquire spectra using shorter echo times, stimulated echo acquisition mode (STEAM) might offer a more accurate precise BMAT quantification compared to point-resolved spectroscopy (PRESS) sequences, despite its relatively noisier sensitivity (93).
The consideration of the above confounding effects is critical for assuring the robustness of MRS-based PDFF measurements across imaging protocols and imaging platforms, and essential toward the standardization of MRS-based PDFF measurements.
Water-Fat Imaging
Dedicated WFI techniques for BMAT assessment
WFI techniques share comparable confounding factors with 1H-MRS: there is a need for decay correction and T1 bias minimization, as well as a consideration of the multi-peak spectral characteristics of fat.
Indeed, due to the complex bone microarchitecture, the multiple interfaces between trabeculae and bone marrow induce an important but differential -shortening effect affecting both water and fat. decay effects have therefore to be considered in the estimation of PDFF based on WFI. Despite its theoretical justification, a dual- decay correction adjusting both water and fat relaxation times provides accurate bone marrow fat fractions at a nominal fat fraction close to 50% but noisy PDFF maps were reported in the spine in regions with lower values (104). Therefore, a single T2* decay model should be at least adopted in BMAT WFI (93).
Regarding the T1-effect, the relative signal amplification can be easily lessened by using low flip angles or predetermined calibration values on WFI acquisitions (93, 95, 109, 110).
Finally, concerning the multi-peak spectral characteristics of fat, one direct consequence in WFI that illustrates an oversimplification of the model used is the “grayish” appearance of adipose tissues on water-only images generated from WFI reconstructions considering a single fat peak. This residual fatty signal may come from an incomplete discrimination of fat and water signals, especially between olefinic fat protons and water (111). Although this simplification is acceptable for most clinical applications, a more advanced modeling of the fat spectrum is necessary for a quantitative purpose.
Commercially available WFI solutions
As mentioned above, the methodological improvements of fat quantification using MRI emerged mainly from abdominal imaging. Most MRI vendors have played an active role in the development of these sequences. Although these commercial quantitative WFI solutions aim to quantify liver PDFF, these techniques may be an easier and interesting alternative to 1H-MRS in quantifying BMAT. An approximation with the multi-peak liver fat spectrum can indeed be considered, as only a negligible difference between the total signal fat from the 3 main peaks was reported when comparing the proximal femoral bone marrow and the liver (87 vs. 90%, respectively) (93, 107, 112). In addition, these sequences implement de facto a decay correction, and because the T1-effect can be simply lowered through a low flip angle, these solutions might be performed for BMAT PDFF assessment.
Other Technical Considerations
Other confounding factors may also be taken into account, such as noise-related bias (especially when using complex-based methods), eddy currents effects, gradient timing mis-registrations, phase errors in WFI and correction of J-coupling effects and chemical shift displacement effects in 1H-MRS (99, 107, 110). Their description goes beyond the purpose of this review, but they are fundamental for the development of future techniques.
Current Challenges When Imaging In Vivo BMAT
A More Accurate Description of BMAT Fatty Acid Composition
Reporting of BMAT fatty acid composition through an expression of its degree of unsaturation constitutes the second most common quantitative parameter provided in the literature after PDFF-based quantification of total BMAT. Currently, only 1H-MRS can reliably assess BMAT composition.
However, contrary to PDFF assessment, there is not sufficient literature on the methodological considerations that should be followed in imaging studies. The importance of STEAM acquisitions over PRESS when assessing BMAT composition has been nevertheless highlighted, as a low reproducibility of unsaturation level measurements has been reported using the latter, with a reported coefficient of variation of 10.7% (105).
Moreover, the proximity and partial overlap of the olefinic peak with the water peak (present at 4.7 ppm) reduce the robustness of the peak fitting process. As a result, in addition to the previously described technical considerations, post-processing the spectra for this specific purpose is challenging, especially in young adults. Areas with low fat content, more frequently encountered in red bone marrow, limits the accuracy and precision of the reported measurements (93). The extraction of BMAT unsaturation levels is subsequently less prone to variations in yellow bone marrow or red marrow with elevated fat content.
Consequently, there is an urge to standardize and improve the reliability of this potential biomarker, as the degree of unsaturation of BMAT might have clinical implications, such as its potential role in the occurrence of fragility fractures (113, 114).
A Better Depiction of Physiological Values
To date, studies performed in healthy subjects have allowed for the description of physiological variations, especially in the spine. In children, WFI showed a decrease in PDFF measurements from the lumbar to the cervical spine, with a natural logarithmic increase with age but without sex difference (99). However, in adults, sex-related variations in addition to age-dependence of PDFF have been reported in the spine (106, 108). Regarding BMAT composition, differences in the degree of saturation have also been observed between adult males and females, with unsaturated lipids being higher in women (115).
Nonetheless, even though these physiological variations are critical for a better understanding of BMAT physiology, data is still insufficient in the literature to determine the exact normal values by age and gender, primarily due to the lack of standardization in methods used to assess BMAT.
Alternatives to 1H-MRS and WFI
Diffusion weighted-imaging, relaxometry, texture analysis, direct signal intensity, and dynamic contrast-enhanced imaging are alternative tools that have been performed to assess bone marrow adiposity. Although they provide interesting information, such as functional parameters related to bone marrow vascularization (116), these MRI techniques have not yet reached a consensus due to the insufficient number of relevant publications.
On the contrary, dual-energy computed tomography (DECT) is an emergent technique which may become a powerful alternative to MRI techniques as it can provide quantitative parameters representing both mineral and organic bone components (117). Consequently, whereas conventional single-energy quantitative computed tomography methods underestimate volumetric BMD measurements, DECT can correct for BMAT, resulting in more accurate densitometric measurements (118–120). Furthermore, BMAT content can be explored reliably, as good correlations have been reported with WFI and histology on cadavers (121, 122), and 1H-MRS in vivo (123). Potential interesting applications exist in oncology, to follow marrow fat expansion and BMD involution in patients after chemotherapy or radiotherapy (124). The main limitations of this modality are the radiation exposure, the need for prior phantom calibration, and the lack of standardization and data regarding reproducibility between different scanners and manufacturers.
In summary, MRI constitutes the current gold standard for in vivo imaging of BMAT in a clinical research setting, with current acquisition methods allowing for inter-center comparability. The field would however benefit from increased standardization, both in terms of reporting of confounding factors of the measured subjects as recommended in Table 1 and in terms of definition of standard sites of measurements, in order to increase comparability and to establish physiological reference ranges in humans and possibly larger mammals. The use of MRI for mouse models is only starting, due to the need for very strong magnetic fields for meaningful BMA signal detection; dual-energy μCT is a valid alternative for murine in vivo imaging.
From Cell Isolation to in vitro Modulation
BMAds exist in a complex microenvironment within the bone, embedded within the marrow tissue where access to live cells for functional analysis is not trivial. Complementary to the above discussed challenges associated to BMAd imaging within their native environment, in vitro systems and ex vivo assays are crucial for understanding of the BMAd and its subtypes at the cellular level. The difficulty in isolating and handling primary mature adipocytes from the BM has led to the use of in vitro adipogenic differentiation assays from BM stromal cells as a surrogate method to study BMAd, an approach widely used in the field of peripheral adipocyte biology. This approach relies on the isolation of a stromal vascular fraction (SVF) from adipose tissue which is then plated and expanded in tissue culture plastic. The resulting adherent monolayer of stromal cells isolated from the BM, the so-called BMSC fraction, acquires the phenotype of multilocular and sometimes fully mature unilocular adipocytes in the presence of specific differentiation cocktails in standard 2D cultures. Mature BMAds, which in vivo develop only after birth (125), most likely originate from a specific subset of progenitor cells present within the BMSC fraction. This biological sequence thus supports, in part, the use of differentiated BMSCs to model BM adipogenesis. In vitro differentiation assays, however, reveal a cellular response to chemical stimuli resulting in a sum of specific phenotypes which describe in vitro plasticity, but do not necessarily reflect their native in vivo differentiation potential. The in vitro plasticity of BMSCs is in fact often larger than the plasticity revealed by in vivo readouts in native or injury-repair conditions, highlighting the importance of complementary in vitro assays and in vivo readouts to establish cell fate mapping within the BM, as described below and extensively reviewed elsewhere (126, 127). The sections below summarize key challenges and practical considerations to minimize variability and increase comparability in future BMAT cell-based studies, whether based on the isolation of primary BMAds or in vitro adipogenesis from BMSCs.
BMAT: Location and Isolation
The BM is a soft tissue within the medullary cavity of compact bone. A mixture of hematopoietic precursors and differentiated cells, adipocytic cells, stromal cells, blood vessels, and nerve fibers occupy the marrow space within a complex network of extracellular matrix. Several techniques to isolate BMAT have been developed, all of which require invasive procedures to extract different populations from the encompassing bone.
In juvenile (age 8 to 12-week-old) mice, yellow/adipocytic marrow is present essentially in the distal tibia (filling up about one third of the total shaft length), the tail vertebrae and phalanx. Of the mouse strains systematically compared, BMAT is maximal in these locations in C3H/HeJ mice, and minimal in C57BL6/J mice (12). Older mice show a progressive increase in BMAT from distal to proximal, gradually gaining mature adipocytes in most skeletal sites of red/hematopoietic marrow. BMAT development and progression varies with strain and gender (128). Sites of murine BMAT for isolation in steady-state are thus small, and obtaining sufficient number of cells for cell sorting or cell culture purposes requires in most cases pooling samples from several animals.
It is important to note, as discussed in the in vivo modulation and in vivo tracing sections, that there may be differences in developmental origin according to the site of BMAT isolation. Due to the high degree of yellow/adipocytic marrow in the distal tibia, which also contains less trabecular bone than the caudal vertebrae, isolation of intact BMAT is relatively straightforward from the tibia after section at the epiphyses followed by gentle flushing or centrifugation. Contrarily, enzymatic digestion or mechanical disruption provides a higher yield of primary adipocytes from the tail due to the high number of caudal vertebrae and the predictable yellow/adipocytic marrow transition in the murine tail from the non-weight bearing segments. It is particularly important to note, however, that the fibrous tissue surrounding tail vertebrae is very rich in subcutaneous and periosteal adipocytes which require extensive mechanical removal or enzymatic digestion prior to isolation of BMAds to avoid contamination from subcutaneous adipocytes. One should also be aware that crushing bones can result in high cell death of BMAds and BMSCs, and it is thus to be avoided. Extraction of the intact BM plug or gentle mechanical disruption of the bone by fragmentation with a scalpel or scissors is thus preferred. Alternatively, a disrupted marrow plug can be obtained from smaller bones by removing the epiphysis and placing the open shaft in a PCR tube with a pierced bottom inside an Eppendorf tube containing a small amount of media (e.g., 200 μl), then gently centrifuging (e.g., 1 s at 500 g). BMAd markers are present in the top buoyant layer, while hematopoietic markers are only present in the pellet fraction upon RNA transcription analysis.
The long bones of mice are of similar size than human iliac crest biopsies, also called trephine biopsies, which involve the spongy bone and are performed for diagnostic purposes in hematology (1–2 cm long and 0.2–0.4 cm in diameter). Isolation and mounting approaches are thus often appropriate for both murine and human samples. Bone marrow aspirates are in most instances performed in parallel to trephine biopsies. In pediatric practice, BM aspirates are often performed from the sternum. Either are excellent sources of BMAT for research purposes after appropriate ethical approval. Debris from hip- or knee-replacement surgeries, including limb amputations, as well as spine neurosurgery also provide material rich in BMAds, as these are skeletal sites of abundant yellow/adipocytic marrow in the human adult.
Due to physiological BMAT specific variations according to species, strain, age, gender and skeletal site, as well as variations imposed by the isolation technique (flushing, spin-down, direct collagenase digestion, other enzymatic digestion), it is extremely important that researchers detail these parameters and indicate yield of primary BMAds or BMSC populations to favor comparisons across groups. Future efforts of the field should include evidence-based recommendations on extraction protocols that best preserve the heterogeneity of BMAd and their precursors. Other factors that may influence BMAT quality, and therefore yield, are related to body weight, bone weight or length and presence of metabolic perturbations or disease. BMAT obtained from human samples may be normalized to weight (μg) of tissue. Weight-based normalization remains however challenging for the small murine samples, where normalization per bone or “per leg” (e.g., tibia and femur) is standard (129).
Mature BMAds: Isolation and Culture
Isolation of primary mature BMAds has been done to high purity by multiple gentle centrifugation steps (9, 56, 130, 131) and may include enzymatic digestion to aid dissociation of BMAds from their surrounding connective tissue. BMAds, just like visceral adipocytes, are fragile cells that are very sensitive to the strains of handling and temperature gradients. Samples must be manipulated gently and typically at 17–37°C to avoid lipid droplets from bursting. Generally, BMAd numbers obtained from murine bones are low due to the small volumes and their affinity to plastic and proneness to floatation or bursting, which encumbers handling. Cell counting of mature adipocytes by hemocytometer or flow cytometry is not representative of the sample at hand, and quality controls for purity and viability need to be devised through other methods including, for example, immunofluorescence for adipocyte yield and quantification of hematopoietic cell contamination (e.g., DAPI, phalloidin, LipidTox-DR and anti-CD45) or nuclei counting coupled to ceiling culture for quantification of yield of viable mature adipocytes. For claims on purified BMAds, especially those that refer to population based transcriptional analysis or proteomics/lipidomics, it is paramount that researchers specify the degree of hematopoietic and undifferentiated BMA cell contamination in both mouse and human BMAT. Single cell RNA sequencing techniques will facilitate BMAT studies, albeit at a high cost.
The possibility of fluorescence activated cell sorting (FACS)-based purification of mature adipocytes for downstream studies has been recently described for extramedullary adipocytes, based on forward/side scatter light signal and viability ensured by manual adjustments to the sorting pressure (132). It is to be demonstrated whether this approach may be compatible with primary BMAd isolation.
Regardless of the isolation approach, a large number of primary BMAds must be initially isolated for most downstream assays (see section on BMAd assessment in vitro). On successful isolation of mature BMAds, their culture is delicate and short-lived. Ceiling culture in 2D allows for maintenance of BMAds for about 1 week (Figure 4E), after which de-lipidation is often observed. To avoid de-lipidation, irradiation of the cells has proven to be technically beneficial prior to culture (9). The recent description of protective 3D BMAd cultures in engineered devices or silk scaffolds holds great promise to recapitulate important clues for their behavior in vivo (133–135), but raises new challenges to develop efficient cell extraction protocols for endpoint analysis and 3D imaging techniques compatible with these set-ups.
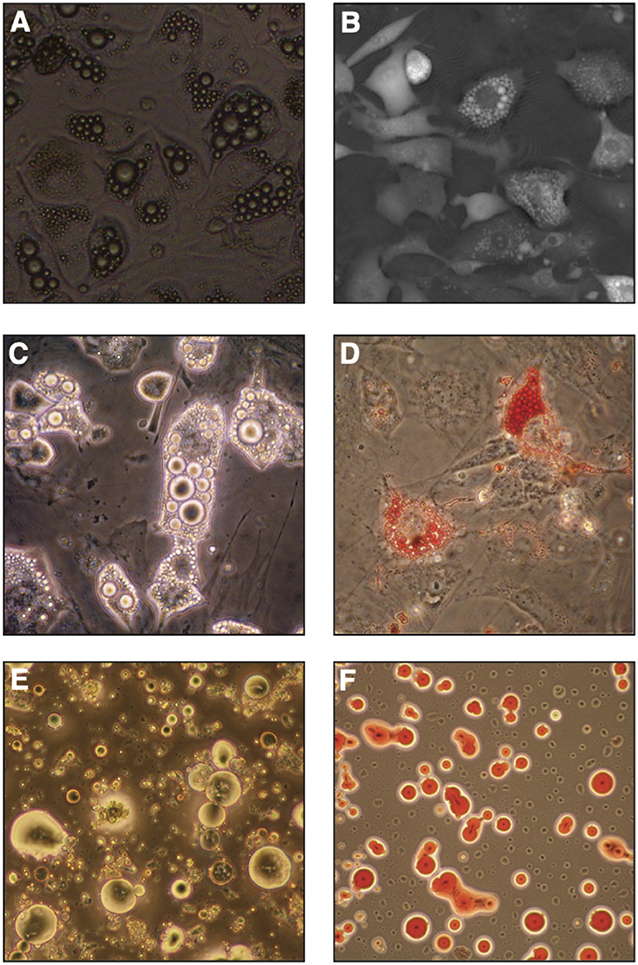
Figure 4. In vitro bone marrow adipocyte differentiation. (A) Bright field image (objective 10x) of OP9 cells differentiated in presence of serum, dexamethasone, insulin and IBMX (DMI cocktail) for 6 days, (B) Digital Holographic Microscopy (DHM) image of OP9 cells differentiated in DMI for 7 days. (C,D) Primary murine bone marrow stromal cells after in vitro differentiation in similar conditions imaged by light-transmission microscopy, where lipid droplets show a high refractive index (C) or stained with neutral lipid oil-soluble colorant Oil Red O (D). (E,F) Primary murine BMAds from 2-month-old FVB female mice as seen by light-transmission microscopy (E) or stained with Oil Red O (F).
BMAd Progenitors: Isolation, Culture, and Modulation in vitro
Mature BMAds coexist hand-in-hand with their immature progenitors, which constitute a subset of the total BMSC fraction. The BMSC fraction has been defined by either (i) exclusion of endothelial and hematopoietic markers [typically CD31 to exclude endothelial components, CD45 to exclude hematopoietic components, and either murine Ter119 or human Glycophorine A to exclude nucleated erythroid lineage cells which lost CD45 expression, as discussed in Boulais et al. (136)], or (ii) by adherence and expansion in tissue culture plastic. Specific subpopulations with functionally validated in vivo stem cell or progenitor function, the so-called skeletal stem cells (SSCs) and their downstream committed or partially committed stromal, bone and cartilage progenitors have been recently described in mouse and human BM (137, 138). They present in vitro adipogenic potential and different degrees of in vivo adipogenesis, with human CD146 constituting the best functionally characterized marker for prospective isolation of SSCs (139, 140). Other skeletal multi-potent populations have been identified within the BM, including PαS (CD45−Ter119−PDGFRα+Sca1+) (141, 142), although care must be taken when defining clonal multi-potency (125, 140). Specific markers to prospectively isolate intermediate steps within the stromal to adipocyte commitment axis have also recently been identified in mice by Ambrosi et al. Namely, a tri-potent bone/cartilage/adipocytic perivascular CD45−CD31−Sca1+CD24+ stem-cell like population, a CD45−CD31−Sca1+CD24− adipocytic progenitor population and a more mature CD45−CD31−Sca1−Zfp423+ BMAd precursor population were identified in the context of aging, high-fat diet (HFD) induced obesity and bone regeneration (5). No equivalent adipocytic differentiation hierarchy has yet been described in the human BM.
Due to the difficulty in isolating and expanding highly purified BMAd progenitors in mice, and to the lack of specific prospective BMAd progenitor markers in human BM, most studies to date have used unfractionated murine BMSCs, or in vitro expanded human BMSCs complying with International Society for Cellular Therapy (ISCT) standards (143) to produce in vitro differentiated BMAds for functional studies. ISCT standards provide a minimal set of surface markers and functional assays to validate human BMSC homogeneity. Standardized downstream functional assays have been proposed by the FDA (144–146). BMSC cultures rely on the rapid adherence of the cells to the culture dish, which allows exclusion of most hematopoietic cells from the culture. Nonetheless, passaging and sometimes sorting is necessary to eliminate macrophage contamination. As for primary isolated BMAds and to maximize comparability across studies, it is paramount to detail the source of BMSCs (gender, age, strain if applicable, metabolic diseases, skeletal location) and the method of isolation, such as specific enzymatic (e.g., collagenase-1,-2,-4, a combination thereof, trypsin) or mechanical dissociation as well as the specific expansion protocol, whose heterogeneity may explain some disparities in the field (summarized in Table 6, BMAS reporting guidelines as summarized in Table 1) (162). It is equally important to include quantification of contamination with hematopoietic or endothelial cells, and, specifically for BMSC populations, and to quantify the overall progenitor function of the primary isolate through fibroblastic colony forming unit assays (CFU-F) prior to adipocytic differentiation.
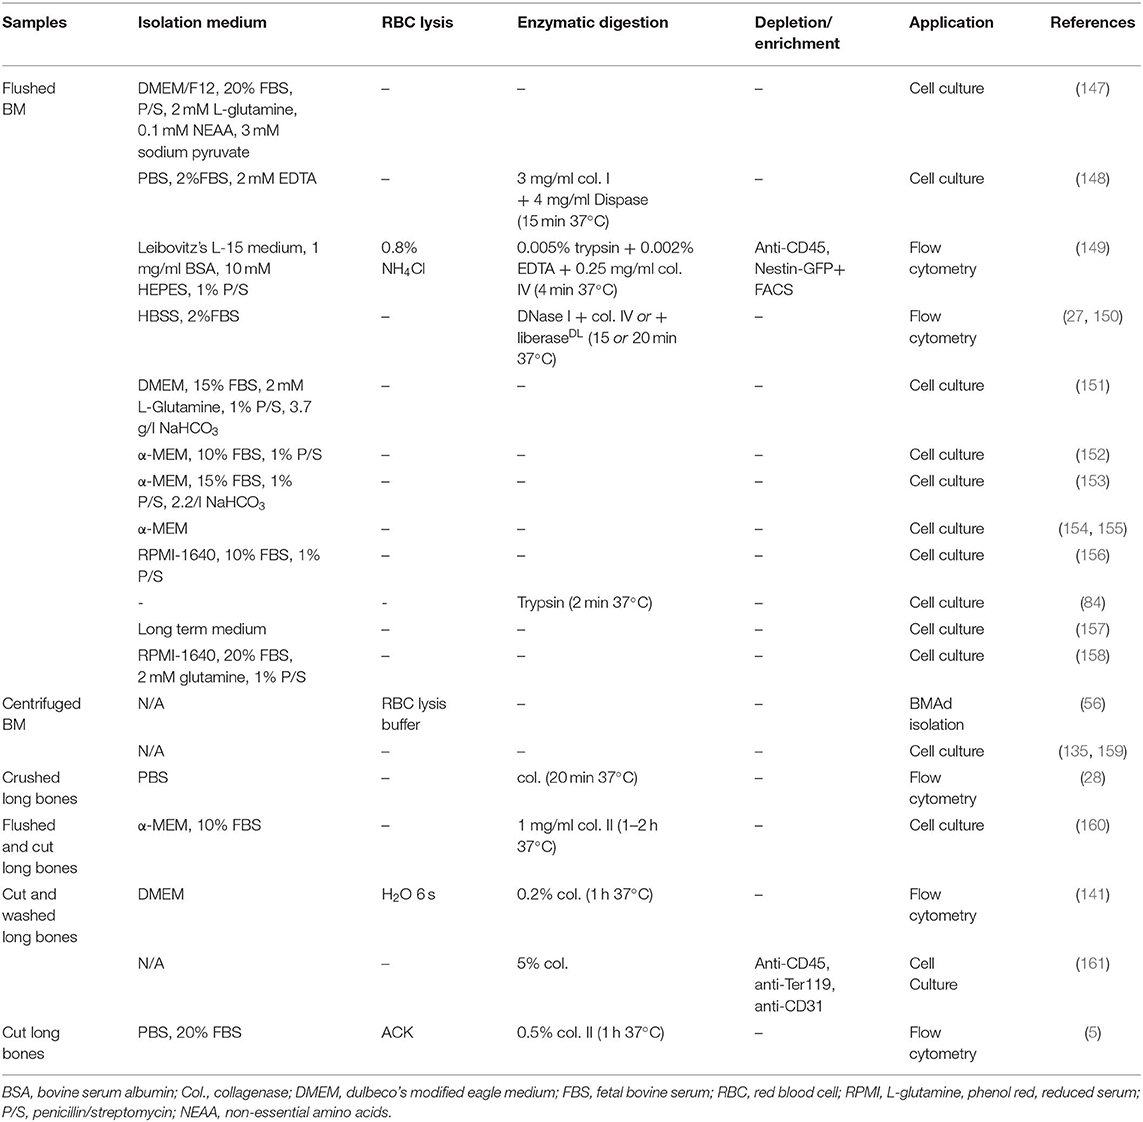
Table 6. Variability in murine bone marrow stromal cell isolation protocols.
Induction of adipogenesis from BMSCs in vitro has included a variety of inducers in standard 2D culture conditions, as summarized for primary murine samples in Table 7. Most differentiation techniques are based on methods developed for murine extramedullary pre/adipocytes (e.g., 3T3L1) or BMSCs primed for adipogenic differentiation (such as C3H10T1/2, 3T3-L1, or OP9). The common denominator includes a combination of the corticosteroid dexamethasone, which ultimately induces master transcriptional regulator of adipogenesis C/EBP-α, and phosphodiesterase inhibitor isobutylmethylxanthine (IBMX), which leads to cAMP accumulation, protein kinase A activation and thus PPAR-γ expression. The cocktail is classically accompanied by insulin exposure, whether from the serum or exogenously administered. Thus the acronym “DMI” cocktail for Dexamethasone, IBMX and insulin (163). In addition, adipogenesis can be further boosted through the use of cyclooxygenase-2 (COX) inhibitor indomethacin or PPAR-γ agonist rosiglitazone. Of note, the mechanical properties of the substrate are also determinant for BMSC differentiation, and even dominant to exogenous biochemical signaling (164), with softer matrixes favoring adipogenesis. The role of extracellular matrix components in this context, and its rate of degradation, has been however largely understudied in this context.
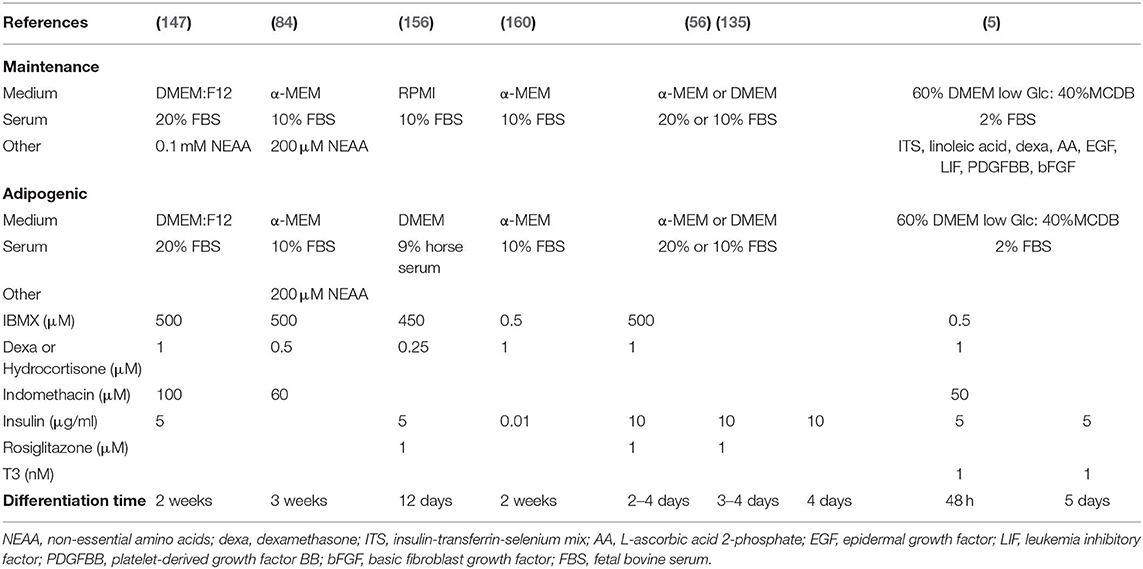
Table 7. Variability of in vitro murine bone marrow stromal cell adipogenic differentiation protocols.
BMAd Differentiation Assessment: In Vitro Assays and Applications
Multiple different cell types have the ability to accumulate lipid droplets, and thus we must evaluate the criteria with which we distinguish BMAds from other cells of the BM. In the context of extramedullary stromal differentiation, some groups have adopted the criteria of presence of at least four lipid droplets to define an adipocyte (165). This is especially useful as a threshold in imaging techniques where lipid droplets are visible (Figures 4A,C,E). As such, each investigator should critically evaluate what threshold is used as a definition.
Adipocytic differentiation is not completely efficient from primary BMSCs obtained on isolation, and the heterogeneity in cultures is well-known (166). This may be due to undetected heterogeneity of the initial BMSC population and adipocyte progenitors therein, to paracrine signaling cues in the culture, or, possibly, to presence of stromal cells that actively inhibit adipogenesis as recently described for CD142+ SVF cells in murine extramedullary adipogenesis (167). Moreover, as discussed above, in vitro differentiation potential may not faithfully reflect in vivo potential. Stringent in vivo assays in the form of heterotopic marrow formation by in vivo transplant in permissive conditions should thus be the norm to reveal the true lineage potential (140, 168, 169). Researchers must therefore rely on genetically modified mouse models with differential donor/recipient marker expression, or, in the case of human samples, in xenotransplants into immune-deficient mice with species-specific surface marker, Alu sequence or mitochondrial DNA detection to determine donor vs. host BMAds.
Upon isolation and culture or differentiation in vitro, assessment of BMAd maturation relies on the definition of the BMSC-to-BMAd axis and on established or forthcoming readouts. Classical biochemical techniques (including western blot, real-time qPCR, flow cytometry, RNA sequencing, lipidomics) require relatively large cell numbers, thereby limiting assay performance for BMAds. Importantly, the cells on each extreme of the maturation spectrum vary greatly, as simply illustrated by the morphological changes when comparing the spindle-shaped BMSCs with large lipid-filled BMAds (Figure 4). This must be accounted for in the selection of suitable references, such as reference genes for RT-qPCR that do not change upon adipocytic differentiation. Thus, cytoskeletal or metabolic genes must strictly be avoided as reference genes, while at least two early/mid- (PPARγ, CEBPα) and two late- (AdipoQ, Glut4, FABP4, LPL, PLIN1) stage markers should be quantified as genes of interest to cover the adipocytic maturation spectrum. The stability of reference genes needs to be demonstrated upon differentiation in every experimental setting, but others have identified good reference gene in the context of adipocytic differentiation from peripheral stromal cultures human and rodent studies (170, 171).
In vitro microscopy-based readouts classically detect lipid droplet formation with fluorescent dyes (e.g., Nile Red, ORO, BODIPY) (Figure 4F), or use of cells from fluorescently-tagged reporter mice (e.g., tdTomato, RFP, GFP as extensively reviewed in section in vivo Lineage Tracing). Whether for microscopy or flow cytometric applications, careful interpretation of results is required, as most mature BMAds will be lost on liquid handling, and care must be taken not to count lipid vacuoles from broken cells as BMAds. More recently, label-free techniques such as digital holographic microscopy (Figure 4B) or Raman-based microspectroscopy have been developed for in vitro BMAd cultures with high resolution and potentially improved performance over classical techniques (172, 173). By preventing staining and liquid-handling biases, these methods provide additional information on lipid content along with quantification of morphological parameters. Additionally, microspectroscopy holds the promise to reveal information on chemical composition at the single cell level, which may reveal physiologically relevant heterogeneity.
Challenges in Cell-Based Assays
Isolation of primary BMAds remains challenging in both mouse and human. In vitro BMSC or BMAd precursor differentiation provides a valid alternative for studying the role of BMAds in cell-based assays, although potential differences with in vivo differentiated BMAds should always be acknowledged. This presents a challenge for normalization with age-matched control groups where the BMAds do not undergo similar changes. For appropriate normalization, it is thus important to account for both cell number and tissue weight, with pooling of control group mice to reach similar levels of BMAd isolation from the experimental and control groups for appropriate comparisons. For both primary BMAds and BMSCs, the cell mixtures obtained are highly dependent on the source and handling, and thus gender, age, skeletal location, metabolic perturbations, as well-extraction and culture methods should be thoroughly described as detailed in the recommended BMAS reporting guidelines (Table 1). With the application of in vivo BMA induction protocols (reviewed in Tables 8, 9), BMAds are modulated in cell size, number, and phenotypic/functional properties. Additionally, measures of BMAd purity and BMSC CFU-F progenitor function should be reported to increase comparability of results across different researchers. It is imperative that as the BMA field matures, so must the publication of consensus protocols as well as definitions for both BMAd and BMSC isolation and differentiation.
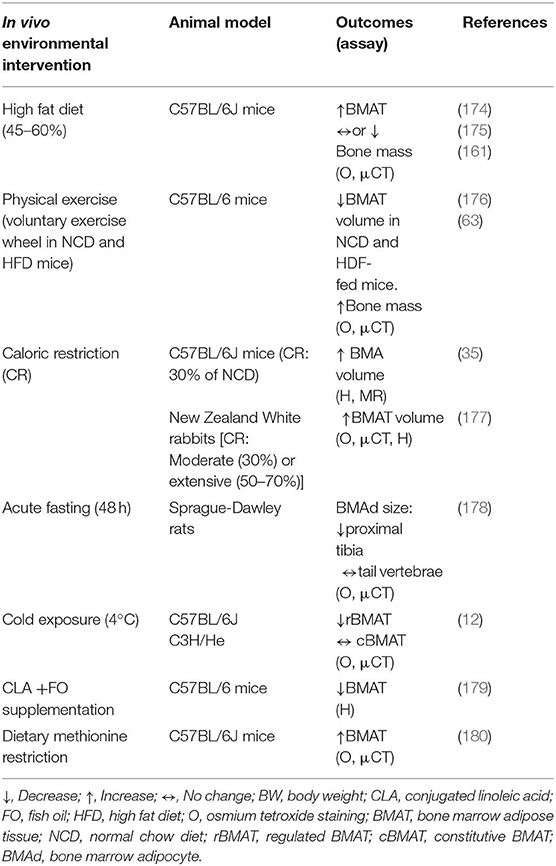
Table 8. In vivo modulation of bone marrow adipose tissue by dietary and environmental factors.
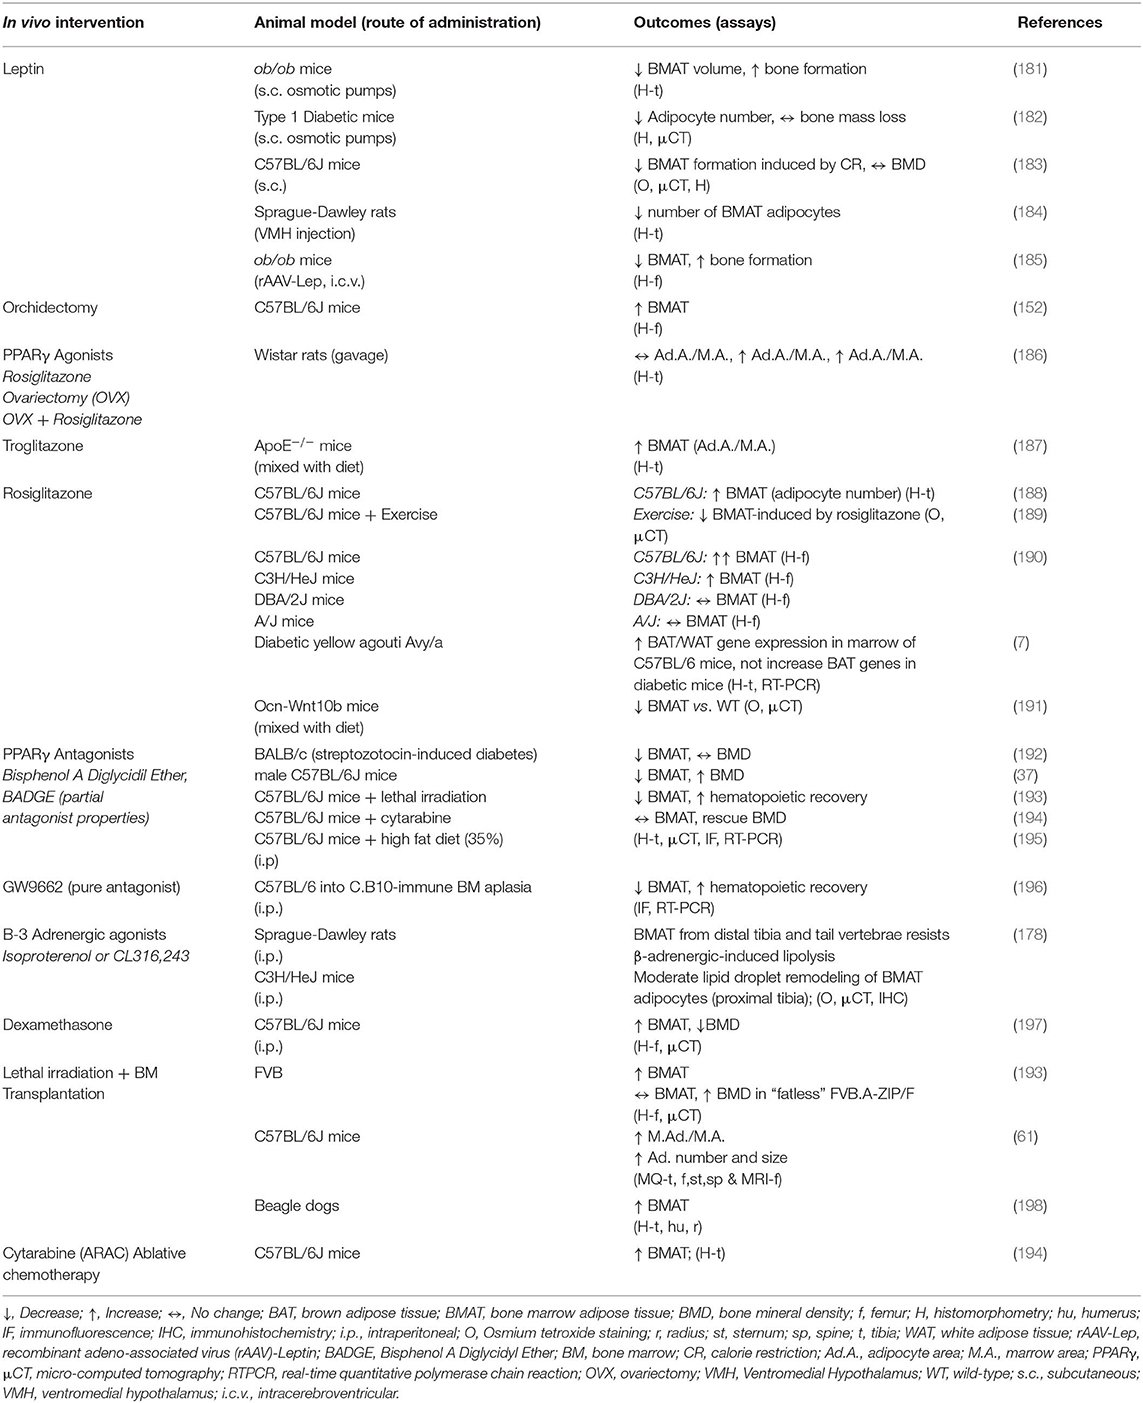
Table 9. In vivo modulation of bone marrow adipose tissue by hormonal and pharmacological treatments in animal models.
In vivo BMAT Modulation
In Vivo Lineage Tracing
It is now well-accepted that BMAds differentiate from a small number of radioresistant mesenchymal progenitor cells that reside in the bone marrow. The ability to identify these early progenitor cells, more mature precursor cells, mature marrow adipocytes, and other mesenchymal lineage derived cells (e.g., osteoblasts), has been accomplished by the advent of modern lineage tracing using relatively specific Cre-drivers and fluorescent reporters (5, 84, 137, 199–202). This approach has the added benefit of being able to compare marrow adipocytes to white, brown, and beige adipocytes, and adipocytes in different anatomical locations in vivo.
Today's lineage tracing consistently depends on the Cre/Lox system (203). In the standard Cre/Lox system, Cre recombinase is expressed under the control of a tissue-specific promoter to permanently activate a reporter gene that functions to mark the original Cre-expressing cell population and all daughter cells that develop. Therefore, it is paramount that one has a detailed understanding of the Cre driver's spatiotemporal expression. Lack of this understanding can result in false interpretations of the origin of the cells. As an example, PdgfRα-cre traces all the adipocytes in white adipose tissue, but within the bone marrow, it traces about 50% of the adipocytes (202). By contrast, Prx-1-cre traces all marrow adipocytes (202). It also traces posterior subcutaneous white adipose tissue, including beige adipocyte precursors, as the mesenchymal origin of this depot gets recombined during limb development. In contrast, Prx1 does not trace the majority of brown adipocytes or any visceral adipocytes (204). Thus, it is useful because of its relative specificity, especially compared to adiponectin-cre, which traces all adipocytes including marrow adipocytes (Figure 5A), and a range of BMSC precursors (6). Another advantage to this system are inducible Cres. As an example, Prx1-ER-cre, where Cre expression is activated in Prx1 positive cells by tamoxifen injection. These types of constructs allow for the timed induction of the reporter. A caveat to be considered when using tamoxifen and ER-inducible cre-drivers, however, is that the dose of tamoxifen required to efficiently activate Cre expression can be 100–1,000 times greater than required to activate estrogen receptors. A single dose of tamoxifen is reported to have irreversible effects on the uterus. Furthermore, tamoxifen crosses the blood brain barrier to regulate energy metabolism, is a potent immune modulator in mice, and can induce bone marrow failure (205–207). Investigators who choose to use tamoxifen in spite of its potent estrogen receptor-mediated actions, should be advised to include a no treatment control as well as a tamoxifen-treated/no Cre control. Equally important is the nature of the reporter gene used. For example, adipocytes possess little cytoplasm relative to other cell types, therefore cytoplasmic reporters such as LacZ are not optimal for tracing adipocytes. Instead, membrane-targeted reporters such as mT/mG (membrane Tomato/membrane GFP) provide superior results (208, 209). For extensive discussions on this topic see Jeffery et al. (210) and Sanchez-Gurmaches et al. (211).
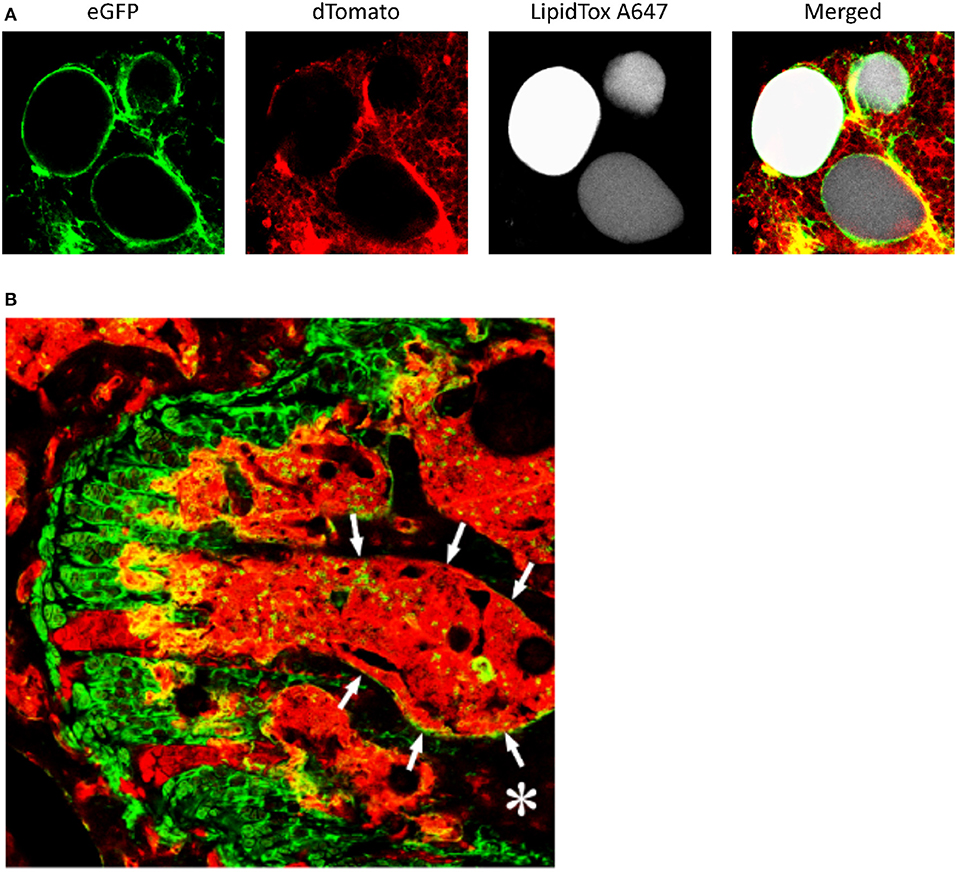
Figure 5. Lineage tracing of bone marrow adipocytes and bone marrow stromal cells. (A) Adiponectin-cre:mT/mG mice received a single dose of x-irradiation (1,000 rads) to induce bone marrow adipogenesis. Following irradiation, the mice were reconstituted by an intravenous. injection of 106 syngeneic bone marrow cells to prevent radiation induced bone marrow damage. Bone marrow was collected from the femur as an intact plug, stained with LipidTox (fluorescent lipophilic dye), and marrow adipocytes visualized by confocal microscopy. Greater than 95% of the cells were eGFP+ indicating they were traced by expression of Adiponectin. (B) The femur from Twist-2-cre:mT/mG mice was isolated, the femoral head removed and the bone fixed in 4% paraformaldehyde overnight. The bones were then immersed in 30% sucrose for 3–4 days, then placed in optimal cutting temperature compound, and frozen. Five to 10 μm thick-sections were imaged by confocal microscopy. Columns of growth plate cartilage cells were eGFP+. In the bone marrow (outlined by arrows and appearing red), a small number of eGFP+ cells can be seen. In addition, approximately 50% of osteocytes (*bone, appearing black) were also eGFP+. Cells that were eGFP+ were traced by the expression of Twist-2.
Once the Cre-reporter has been selected, which will be dictated by the demands of the experiment, either an ex-vivo or in situ approach can be taken.
The ex-vivo approach involves dissecting out the femur, cutting off the femoral head and removing the distal epiphysis above the growth plate. A 20-gauge needle can then be inserted down the medullary canal (from proximal to distal), and punching out the needle through the distal growth plate. Because the distal growth plate is intact this causes the bone marrow to fill the needle. The needle is then attached to a syringe and the marrow plug can then be deposited on a microscope slide by depressing the barrel of the syringe. The adipocytes in the marrow plug can then be prepared for imaging by confocal microscopy. Femora are preferred for this technique because they are fairly uniformly cylindrical along the length of the bone making them amenable to boring.
Advantages: (1) This is a straight forward simple method that requires no specialized equipment, with the exception of the confocal microscope; (2) The method is rapid. It avoids the requirement of decalcification or sectioning; (3) Using mT/mG reporter mice, in addition to tracing mature marrow adipocytes, will show whether marrow adipocyte precursors (GFP+) expressed the gene of interest; (4) The marrow adipocytes, in the marrow plug, can be stained with a fluorescent lipophilic dye (i.e., LipidTOX) allowing for easy identification of the mature adipocytes. This also allows for better determination of cell counts and size. This approach can be combined with immunofluorescence to co-stain for other cell markers if desired.
Challenges: (1) Because adult mice (C57BL/6 background) have few marrow adipocytes in the femur, induction of marrow adipogenesis is recommended. However, the choice of which induction protocol to be used (x-irradiation, high fat diet feeding, feeding with a methionine restricted diet or a rosiglitazone containing diet, see Tables 8, 9) will depend on the experimental design; (2) The femoral medullary canal in adult mice is the only site sufficiently large to collect a workable bone marrow plug; (3) Because the cells are removed from the marrow their anatomical location, especially as it relates to trabecular bone and the endosteum is lost.
The second, in situ, approach maintains anatomical location with respect to the growth plate and endosteum, but by maintaining the calcified bone matrix, introduces its own complications. Although the in situ approach involves collecting fresh femurs, from that point, the method varies significantly from investigator to investigator. The bones can be fixed in paraformaldehyde overnight and then given a partial decalcification in EDTA, sucrose incubation follows, and then embedding in either a cryomedia or carboxymethyl cellulose, followed by frozen sectioning (Figure 5B). Some of the best images have been acquired using a tape-transfer system and cutting 10–30 μm sections (137, 199–201). Other investigators have even used paraffin embedding instead of frozen sections, although this necessitates the use of antibodies, even in fluorescence reporter mice (5). After sectioning, the tissue can then be stained with the desired antibody-conjugate (direct i.e., GFP, or indirect using a secondary fluorescent antibody or biotin-avidin conjugate), and imaged by fluorescence or confocal microscopy. However, the fixation and decalcification can vary greatly form investigator to investigator, including some who use no fixation and rapid freezing (200). In addition, to immunofluorescent staining, transient fluorescent reporter mice (e.g., Zfp423-EGFP) or Cre/Lox lineage tracing fluorescent reporter mice can be used.
Advantages: (1) The major advantage to this method is that it allows for direct visualization of the cells within intact bone. Thus, the spatial relationship between marrow adipocytes, other cells, and bone is maintained; (2) Using mT/mG reporter mice can be a significant advantage; (3) Mature marrow adipocytes can be imaged.
Challenges: (1) This method requires expertise and experience in bone histology and specialized histologic equipment (e.g., tungsten-carbide knifes to section bone); (2) Sectioning small bones (e.g., distal tibia and caudal vertebrae) can be difficult; (3) Difficulties using the tape-transfer systems have been reported; (4) The embedding techniques and section preparation often exclude the combined use of lipid-tracing dyes.
It is clear that great progress in lineage tracing of marrow adipocytes has been made during the last few years, due to advances such as the Cre/Lox system. Our ability to delineate cells in the bone marrow adipocyte lineage will only get better with the advent of more specific Cre-drivers and more robust reporters. Refinements in our ability to process bone to make it more accessible to these methods will result in an even better understanding of the lineage, how it relates to other mesenchymal lineage cells, and the myriad of other cells in bone marrow.
In vivo Modulation of BMA
BMAT is a complex and dynamic depot that is highly regulated and can affect the function of other tissues/organs. Whether presence of BMAT is necessary for normal physiological responses is still controversial. While some studies have shown that BMAT negatively influences bone mass, a study in BMAT-deficient KitW/W−v (BMAT−) mice suggested that the absence of BMAT did not have any relevant effect on ovariectomy-induced bone loss (22). However, a recent study in BMAT− male mice has shown that absence of BMAT exacerbated bone loss during hindlimb unloading (212).
The expandability of BMAT is regulated by nutritional and environmental factors, aging, endocrine signals, and pharmacological agents. Here, we critically summarize experimental models used to study in vivo regulation of BMAT development and function.
Nutritional and Environmental Interventions
In C57BL/6J mice, a strain susceptible to obesity and diabetes, HFD feeding induces also BMAT expansion (174, 175). When diet-induced obesity (DIO) is reversed by switching to normal chow diet (NCD) to mimic weight loss, the HFD-induced BMAT recedes (175). Some of these alterations are microbiota-dependent (195). The alterations induced by the HFD on BMAT gene expression differ from that observed in peripheral adipose tissues. In contrast to visceral WAT, pro-inflammatory gene expression was decreased while the expression of genes of the insulin signaling pathway increased in BMAT of HFD-fed mice, suggesting a differential metabolic regulation of BMAT adipocytes (161). Walji et al. (213) used microfibril-associated glycoprotein-1 (MAGP1) deficient (Mfap2−/−) mice that develop adult-onset obesity that precedes insulin resistance. In these mice, BMAT increased relative to WT mice coincident with the development of insulin resistance, and not with excess peripheral adiposity, hyperglycemia, change in trabecular bone volume or hematopoiesis.
Exercise is a life-style intervention proposed to prevent/counteract obesity-associated BMAT expansion (Table 8). Voluntary wheel running in C57BL/6 fed NCD or HFD demonstrated that exercise prevented the increase in BMAT acquisition (176). Styner et al. (189) found that exercise (alone or in combination with rosiglitazone) reduced BMAT volume and upregulated UCP1 expression in whole tibia (Table 9). Exercise can also reverse the increase of BMAT observed in previously obese animals (HFD-fed for 3 months) by decreasing both adipocyte number and size (63). Exercise was associated with higher trabecular and cortical bone quantity in lean and obese mice, but HFD itself did not influence bone quantity. Importantly, a recent study, also provided evidence that physical exercise modulates vertebral BMAT in humans (214).
The differential in vivo regulation of BMAT by nutritional status also occurs in animal models of caloric restriction (CR). In contrast to what is observed in visceral or subcutaneous WAT, BMAT is preserved or even increased in states of CR [(35, 177, 178, 183); Tables 8, 9]. Indeed, CR (30%) in young growing mice alters bone formation, but despite having a lower body weight and body fat percentage, they exhibit a dramatic increase in BMAT (35). In patients with anorexia nervosa, CR is also associated with increased BMAT (215, 216). However, in New Zealand rabbits moderate or extensive CR did not cause BMAT expansion (177). It has been suggested that the increase in BMAT is especially prominent when nutrient deprivation occurs during periods of skeletal growth, such as childhood or adolescence (178). This period of rapid skeletal growth may already be poised for BMAT development as this is also a time of rapid baseline BMAT accumulation (217).
The expansion of BMAT during CR has also been associated with changes in several neuroendocrine factors that are modulated in response to energy deprivation. The decrease in leptin that occurs during CR-induced weight loss may account for the increased BMAT. Indeed, BMAT is increased in leptin-deficient ob/ob mice (218), and subcutaneous leptin treatment induces loss of BMAT adipocytes and increases bone formation in these mice (181). Moreover, peripheral leptin therapy is effective in reversing the increased BMAT observed in type 1 diabetic mice and CR models, but does not stop the bone loss that occurs concomitantly [(182, 183); Table 9]. Furthermore, central injections of leptin into the ventromedial hypothalamus (VMH) of Sprague-Dawley rats, as well as leptin gene therapy (intraventricular administration of recombinant adeno-associated virus (rAAV)-leptin gene) to ob/ob mice also reduced BMAT (184, 185). Interestingly, mice with selective deletion of the leptin receptor (Lepr) in limb bone marrow stromal cells (Prx1-Cre;Leprfl/fl mice) exhibited normal body mass and hematopoiesis, but have decreased BMAT, and increased osteogenesis (219). Moreover, Prx1-Cre;Leprfl/fl mice were protected from the HFD-increases in BMAT and reductions in osteogenesis. It therefore appears that hypothalamic and peripheral leptin signaling may have different or multiple effects on adipogenesis within bone marrow.
Aging
Increased BMAT is also observed during aging, and has been negatively correlated with bone health, and sometimes precipitates impaired hematopoiesis in animals (5, 220) and humans (221–223). Dietary strategies have also been proposed to counteract the increased BMAT associated with aging, and combination of conjugated linoleic acid with fish oil can decrease age-associated BMAT in C57BL/6J mice (179). Dietary methionine restriction (MR) increases longevity in rodent models, however MR promotes BMAT accumulation in contrast to WAT reduction (180).
Endocrine Regulation
From an endocrine perspective, bone and BMAT metabolism are tightly linked and therefore BMAT is under extensive hormonal regulation. First of all, already a long time ago it has been observed that ovariectomy increases BMAT in animals (224) and ovariectomy is now commonly used to induce BMAT in animal models. These observations have been extended to humans, as BMAT increases during aging and this increase is accelerated in women around the time of menopause (225). Post-menopausal hormonal replacement therapy with estradiol, both long term (1 year) and short term (2 weeks) decreases BMAT in women (33, 226), showing that indeed estradiol is an important regulator of BMAT. At the same time that estradiol secretion by the ovaries ceases, compensatory follicle stimulating hormone (FSH) secretion by the pituitary gland increases. In addition to the effect of hormonal replacement therapy, also FSH blocking therapy has been shown to decrease BMA in mice (83). In addition to gonadal hormones, glucocorticoids have a profound effect on adipose metabolism and this also holds true for bone marrow adiposity. Cushing's disease, defined by increased adrenocorticotropic hormone (ACTH) production by a pituitary adenoma and therefore hypercortisolemia, increases BMAT and this reverses again following surgical cure by removal of the pituitary adenoma (227). Also, long-term glucocorticoid treatment leads to increased BMAT (228) and can be used to induce BMAT in animal models. Finally, parathyroid hormone, an important regulator of bone metabolism and potent osteoanabolic drug, also has an effect on BMA. Teriparatide treatment in osteopenic women reduces BMAT (229) and animal studies showed that this effect can be recapitulated by genetic deletion of the parathyroid hormone receptor in skeletal stromal cells (56). Interestingly, additional studies from the Rosen lab showed that the effect of PTH is not only on the differentiation of the SSC into the adipocytic lineage, but that Parathyroid Hormone (PTH) can also induce lipolysis in BM adipocytes (230). In addition, growth hormone (GH) is an important regulator of skeletal growth and growth hormone deficiency or resistance has been associated with changes in BMAT. In growing rats, hypophysectomy dramatically increases BMAT and this could not be reversed by treatment with either estradiol, thyroid hormone, cortisol or Insulin Growth Factor-1 (IGF-1), but was completely reversed by treatment with GH (231). In healthy, premenopausal women, vertebral BMAT measured with 1H-MRS was inversely associated with IGF-1 concentrations, but not stimulated GH concentrations (232). However, treatment with recombinant GH for 6 months in premenopausal obese women, did not change BMAT, although there was a significant difference between the GH treated and placebo treated groups due to the decrease in BMAT in the placebo group (233). Therefore, the role of GH in the regulation of BMAT in adult humans remains uncertain and studies in children during growth have not been performed.
BMAT is not only regulated by hormones, but also acts as an important endocrine organ itself. Cawthorn et al. (234) found that increased BMAT significantly contributes to the higher circulating adiponectin levels during CR. Moreover, studies in Ocn-Wnt10b mice, which resist BMAT expansion during CR, demonstrated that increased BMAT is required for the elevated circulating adiponectin in this condition. Furthermore, BMAT and adiponectin levels increase in patients undergoing therapy for ovarian or endometrial cancer, despite no change in total fat mass (234). Increased adiponectin levels and BMAT volume were also observed in DIO WT (C57BL/6J) mice treated with Rosiglitazone. However, female Ocn-Wnt10b mice treated with Rosiglitazone had mildly blunted hyperadiponectinemia (191) while males did not, suggesting a sex-specific response.
Pharmacological Modulation
Several drugs also regulate BMAT. PPARγ is a master transcription factor for adipocyte differentiation, and treatment with the insulin-sensitizing drugs thiazolidinediones (TZDs), which are PPARγ agonists, affects marrow adiposity. As shown in Table 9, treatment with several PPARγ agonists such as Rosiglitazone and Troglitazone enhanced BMAT in different animal models (187, 188). However, the effects of TZDs on BMAT seem to be strain-specific (190) and age-dependent, favoring BMAT accumulation in older mice rather than in young-growing animals (188). In ovariectomized (OVX) rats, treatment with rosiglitazone (BRL49653) exacerbated bone loss and increased BMAT (186). On the other hand, several studies have shown that treatment with PPARγ agonists increased BMAT without affecting trabecular bone volume, suggesting that adipogenesis and osteogenesis can be regulated independently in vivo (187). Similarly, netoglitazone administered to 6-month-old C57BL/6 mice had a strong adipogenic induction with no change in the trabecular architecture and modest decreases in cortical bone mineralization (235). In contrast, a reduction in BMAT has been observed in all studies administering PPARγ antagonists after chemo/radiotherapy, which are potent inductors of BMAT [(37, 192–194, 196, 236); Table 8]. Moreover, genetic models of PPARγ loss show a pronounced increase in bone mass with extramedullary hematopoiesis (237, 238). The effects of BMAT in the recovering of hematopoietic compartment seem apparently contradictory, possibly due to the differential effects of distinct BMAd subtypes and differentiation stages in hematopoietic progenitor support [reviewed in (239, 240)]. Methodologically, it is to be noted that although effective in reducing BMAT, the most commonly used PPARγ “antagonist” for in vivo experimentation, Bisphenol A Diglycidyl Ether (BADGE), has partial PPARγ agonist effects and is a potential endocrine disruptor receptor anti-androgenic and pro-estrogenic properties (241–243). It is therefore recommended that future in vivo studies use a more specific PPARγ antagonist such as GW9662 (196).
BMAT thus accumulates following hematopoietic marrow ablation. A wave of BMAT precedes hematopoietic repopulation and peaks from 2 to 3 weeks after whole-body radiation depending on dose and recipient characteristics (700–1,000 Gy) (193, 202). BMAT is then lost and the timing of recovery depends on the radiation dose and on the number of hematopoietic cells used for the rescue. Sublethal models which do not require hematopoietic rescue have also been developed with 5-fluorouracil or cytarabine treatments (194, 236). Both radiation and chemotherapeutic treatments induce dramatic increases in BMAT also in patients (234, 244), whereas certain disorders of inefficient hematopoiesis (e.g., W/Wv mice) are associated with greatly reduced BMAT and a modified lipid composition of the stroma (245, 246). The biological implications of BMAT in neoplastic progression within the BM microenvironment are only beginning to unravel (247–251).
Sympathetic Regulation
A very important issue when studying the in vivo modulation of BMAT is to consider the region-specific variation in the properties of the skeletal adipocytes, as already discussed in the BMAT isolation section. The studies of Scheller et al. (12) in mice strongly support the existence of a constitutive (cBMAT) and a regulated (rBMAT) depot. cBMAT is in the distal long bones fills the medullary canal from the tibia-fibular junction into the malleolus and caudal vertebrae, histologically resembles WAT, appears rapidly in the early postnatal period, does not usually respond to stimuli or pathophysiological changes (202), though it can reduced over several months with thermoneutrality (252). In contrast, rBMAT is situated in the proximal regions of long bones and in spinal vertebrae, develops after cBMAT, and is interspersed with hematopoietic cells. rBMAT increases or decreases in various conditions (DIO, aging, CR, etc.) (253).
The study of Scheller et al. (12) also revealed that knockout of PTRF (Ptrf−/− mice, a model of congenital generalized lipodystrophy 4) selectively inhibits formation of rBMAT adipocytes without affecting cBMAT, which could be one step toward generation of a genetic model of rBMAT ablation (12).
The lack of response of BMAT adipocytes to lipolysis during energy deprivation has been attributed to resistance to β-adrenergic stimulation, but this effect also shows region-specific differences. Acute fasting (48 h) decreases cell size of BMAT adipocytes within the proximal tibia but not within the tail vertebrae in Sprague-Dawley rats (178). Moreover, BMAT from distal tibia and tail vertebrae of these rats resists β-adrenergic-induced phosphorylation of Hormone-Sensitive Lipase (HSL) and/or perilipin, which are required for stimulation of lipolysis. Furthermore, treatment of C3H/HeJ mice with CL316,243, a β3-AR agonist, caused remodeling/beigeing of WAT, but only moderate remodeling of lipid droplets in BMAT of proximal tibia without affecting mid or distal tibia (Table 9). Furthermore, β-adrenergic stimulation through cold exposure shows lipolytic response by rBMAT (decreased rBMAT in the tibial epiphysis and in the proximal tibia) while cBMAT remained unchanged (12). Therefore, these data suggest that the lipolytic response to β-adrenergic stimulation is more pronounced in rBMAT than in cBMAT (178).
Another important factor to take into account when designing and interpreting studies about in vivo BMAT regulation is the effect of housing temperature. Most of the studies in mouse models are performed at room temperature (RT, around 22°C), which is below the thermoneutral temperature for mice (around 32°C). Therefore, RT housing can increase non-shivering thermogenesis by the sympathetic outflow and the activation of UCP1 in BAT (254, 255) showed that thermoneutral housing not only reduces UCP1 expression in BAT, but also increase BMAT and the percentage of body fat as compared with RT-housed mice. Therefore, the mild cold stress induced by RT-housing could be a non-considered confounding factor in mice studies.
In vivo Modulation Challenges
All these studies have demonstrated that BMAT expansion accompanies metabolic dysfunction. However, many physiopathological changes take place in these processes, and dissecting the role of BMAT expansion from the role of peripheral adipocytes and other metabolic perturbations make mechanistic studies a challenge. Furthermore, the divergent BMAT responses to different strains/species suggest the existence of a strong genetic background effect, which should be considered when designing studies, highlighting once more the importance of adhering to the BMAS minimal reporting guidelines when communicating results (see Table 1). Possibly, standard in vivo experimental conditions need to be defined for inter-laboratory comparisons. As we continue to identify the physiological processes that underlie the formation of BMAT and the environmental and genetic cues that control its accumulation, it is becoming increasingly evident that BMAT may be heterogenous.
Finally, in spite of their limitations, wider use of available genetic models of non-selective BMAT depletion (e.g., Ptrf−/−, W/Wv), which have lesser metabolic phenotypes than severely lipodystrophic mice (e.g., A-ZIP/F), should advance the field until models of highly-specific BMAT depletion can be developed. Furthermore, it is paramount to consider that the BMA, bone, vascular and hematopoietic compartments are tightly interlinked within the BM, such that in vivo analysis requires functional measurements of all four compartments to reach mechanistic conclusions.
Biobanking
The BMAS Working Group on Biobanking has the ambition to generate standardized approaches toward isolation, characterization and long-term storage of tissues/cells related to BMA and their associated data and annotations. Although difficult to achieve due to several challenges (see below), creating minimal standards to isolate and characterize BMAds as well as freezing protocols for long-term storage should significantly reduce variability in outcomes between studies and laboratories. This is especially important to ensure viability and conservation of heterogeneity in cell-based assays, and to ensure sample stability for chemical analysis including mass spectrometry. Most importantly, unified biobanking standards along with the protection of associated data will enable responsible use and exchange of samples for comparative and larger-scale studies. Ultimately, the field will benefit from improved applicability of animal and human BMA-related samples, which may better facilitate the discovery of novel therapeutics to target BMA.
In a complementary fashion to the BMAS Working Group in Methodologies, one of the foci of the BMAS Biobanking Working Group will be to congregate methodologies related to the collection, freezing/thawing and long-term storage of BMAds. Additional aspects of biobanking that the working group will scrutinize are privacy regulations regarding participants/patients, data protection and ethical guidelines to facilitate collaborative efforts. Main challenges toward this objective are briefly introduced below.
Isolation of BMAds
Different types of materials have been and will be employed to study BMA, including BM aspirates, biopsies, specific cell types, BM plasma fraction, etc. After having defined these, recommended standard procedures are required regarding BMA isolation, processing and characterization. For example, isolation protocols vary substantially between laboratories (digestion with collagenase or other enzymes, incubation times, etc.). In addition, it is important to distinguish protocols for animal studies vs. human materials as BMA is different in composition, location, metabolism and regulation. For human bone marrow–related samples, recommended patient screening should be additionally established (HIV, Hepatitis B and C virus). Finally, minimal standards should also be established for sample annotation, which should include description of the site of collection, method of collection and isolation, including time and type of digestion, time from collection to freezing, etc.
Characterization of BMAds
One of the biggest challenges is to define a healthy control set, especially for human samples (see Table 1). What is regarded as normal population and a standard site of collection and how do we define this? What is the minimal set of parameters required to define such a set? One solution is to propose a minimal set of specific surface molecules, gene expression markers and/or other biomarkers (e.g., lipid profiles) to facilitate comparisons and thus also multicenter studies. Some specific markers have been proposed (adipokine markers, absence of hematopoietic, endothelial, and hematopoietic markers) but additional species-specific markers are needed to be able to characterize BMAds in a uniform and reliable fashion.
Long-Term Storage of BMA-Related Samples
To date it has proven impossible to freeze BMAds, and the only access point to retrospective samples relies on the identification of adipocyte ghosts in paraffin blocks. Tissue samples containing adipocytes are being collected but these require purification and/or digestion steps before freezing. On the other hand, storage of precursor cells (SSCs) may poorly reflect the BMA situation at the time of isolation, most often due to cellular expansion (and deviation) in vitro before or after freezing. In order to create as much homogeneity as possibly, it is vital to define freezing and thawing procedures employed with a minimum of interfering steps as well as viability and cell growth/differentiation characteristics of previously stored BMA samples. Non-frozen samples, including paraffin blocks, may pose less issues, but still homogeneity in tissue processing and database management are required to optimize storage and exchange of samples.
Ethical Issues and Data Protection
With the installment of the General Data Protection Regulation (GDPR) in 2018 (EU GDPR Portal (website), accessed August 27, 2019, http://eugdpr.org) the protection of people and data has become more stringent. Trying to come up with a standardized procedure toward biobanking will face challenges, including different national regulations, institutionalized rules, etc. Ethical guidelines varying between countries should be dealt with to assess the possibility to generalize ethical topics into one document for samples to be collected in the future. Related to this, a general template for informed consent and awareness of mutual use of obtained samples by all involved may improve standardization and the possibility to share samples, which is especially relevant in the context of rare diseases. A BMAS consortium-wide material transfer agreement may be instrumental for this.
Issues related to data protection include the assurance that participant/patient data remains anonymous at all costs. Although the consciousness around this subject is increasing, the working group will assess these issues in detail and will aim to propose a comprehensive recommended protocol to safeguard anonymity and data protection that originates from any of the laboratories. Data obtained in the European union (EU) often cannot be stored on servers outside the EU and similar regulations may apply to different continents as well. Therefore, a robust data management plan needs to be installed that can explore and potentially overcome challenges such as decentralized storage of samples and associated files.
In conclusion, biobanking, and methodological challenges are tightly linked. Minimal standards and international overarching ethical guidelines for BMA sample collection and data protection will be critical to increase the quality of fundamental and multicenter clinical studies, and interpret with greater confidence the outcome and impact of BMA research within the next few years.
Concluding Remarks
Specific methodologies for the study of BMA have been developed in the last decade, paralleling the increasing interest in the field. Gold standard methodologies currently exist for the assessment of BMA ex vivo, in vivo and in vitro (e.g., histomorphometry and OsO4− 3D contrast-enhanced μCT for ex vivo, WFI and 1H-MRS MRI sequences for in vivo studies, lipid-dye-based and RT-qPCR-based assessment for assessment of in vitro BM adipogenesis) and emerging techniques may soon come to complement or substitute these gold standards (i.e., digital pathology algorithms for histomorphometry, POM-based contrast-enhanced CT for ex vivo imaging, dual energy CT for in vivo imaging as well as more reproducible parameters for in vivo MRI spectroscopy, label-free or 3D microscopy and microspectroscopy for in vitro imaging, or 3D adipose organoids for in vitro cultures).
However, great challenges still remain. First, given the inherent fragility of BMAds and their difficult access within the bone, protocols for extraction, ex vivo handling, and in vitro culture/differentiation of BMAds or BMSC progenitors vary greatly. Thus, recommended standardized protocols for in vivo modulation and extraction, minimal standards for BMAd purity assessment, and standardization of method-specific thresholds for BMA detection would greatly increase inter-study comparison and multi-site collaborations. Second, given the number of factors that affect BMA mass, and possibly type (e.g., skeletal location, gender, age, strain, nutritional status, metabolic state, exercise, ambient temperature, isolation technique), great attention needs to be paid in careful annotation and reporting of these confounding factors for all BMA scientific output. Third, in order to move forward the functional understanding of BMA, tools for the specific ablation of BMAds are urgently needed to uncouple the local BMA-effects from the metabolic effects of systemic lipodystrophy.
The BMAS Working Group in Methodologies and the collaborative BMAS community at large present the opportunity to reach methodological consensus guidelines and propose minimal standards that would strengthen the quality of our scientific output, increase comparability and prepare the field for multi-site preclinical and clinical studies which can pave the way to sound clinical translation. As a first step, incorporation of the BMAS nomenclature guidelines presented in the accompanying piece of this issue (31) and adherence to the methodology reporting guidelines presented here (Table 1) will ensure a common language for our community. In addition, we would like to invite readers to contribute by commenting on this review in the comments section of the “Frontiers in Endocrinology” website.
Author Contributions
JT, AV-V, and ON conceptualized the manuscript, coordinated the writing, and edited the sections. JT, BP, RL, and PB mounted the manuscript and tables. RL, NB, JT, and AV-V wrote the histomorphometry section. GK, ED, and ES wrote the ex vivo imaging section. SB and DK wrote the in vivo imaging section. JT, SB-C, BP, AP, PB, and ON wrote the in vitro section. MM-A, JF, AV-V, and ON wrote the in vivo modulation section. JF, MR, CR, and MH wrote the in vivo reporter section. ON and BE wrote the biobanking section. All authors edited and approved the final version of the manuscript.
Funding
The BMA2017 annual meeting to constitute BMAS and its Working Groups was funded by Swiss National Science Foundation (SNSF) grant 31CO30_173949. ON and JT were founded by SNSF grants PP00P3_183725 and PP00P3_176990 and the Anna Fuller Fund. MM-A was founded by grant BFU2015-65937-R (MINECO/FEDER, Government of Spain). SB-C was founded by Université de Nantes, Regional's Pays de Loire and Société Française de Rhumatologie.
Conflict of Interest
AV-V and ON are co-chairs and JT is coordinator of the BMAS Working Group in methodologies. BP, BE, CR, ED, and ON are members of the BMAS Executive Board. AV-V, DK, ES, GK, and MH are members of the BMAS Scientific Board.
The remaining authors declare that the research was conducted in the absence of any commercial or financial relationships that could be construed as a potential conflict of interest.
Acknowledgments
A special thank you to William Cawthorn, University of Edinburgh, for help on aligning this manuscript with the accompanying BMAS nomenclature position paper. We thank Giulia Frangi, Université de Nantes for contributing to compilation of data for Tables 6, 7, Vasco Campos, EPFL, for the Digital Holographic Microscopy image on Figure 4, and Mara Riminucci, Sapienza University of Rome, for kindly providing the histological images for Figures 1, 4. We acknowledge the Medical Research Council (CDA: MR/P02209X/1) grant to Anjali Kusumbe, University of Oxford for providing the immunofluorescent staining in Figure 1.
References
1. Cawthorn WP, Scheller EL. Editorial: bone marrow adipose tissue: formation, function, and impact on health and disease. Front Endocrinol. (2017) 8:112. doi: 10.3389/fendo.2017.00112
2. Li Q, Wu Y, Kang N. Marrow adipose tissue: its origin, function, and regulation in bone remodeling and regeneration. Stem Cells International. (2018) 2018:7098456. doi: 10.1155/2018/7098456
3. Veldhuis-Vlug AG, Rosen CJ. Clinical implications of bone marrow adiposity. J Int Med. (2018) 283:121–39. doi: 10.1111/joim.12718
4. Raajendiran A, Tsiloulis T, Watt MJ. Adipose tissue development and the molecular regulation of lipid metabolism. Essays Biochem. (2016) 60:437–50. doi: 10.1042/EBC20160042
5. Ambrosi TH, Scialdone A, Graja A, Gohlke S, Jank AM, Bocian C, et al. Adipocyte accumulation in the bone marrow during obesity and aging impairs stem cell-based hematopoietic and bone regeneration. Cell Stem Cell. (2017) 20:771–84.6. doi: 10.1016/j.stem.2017.02.009
6. Mukohira H, Hara T, Abe S, Tani-Ichi S, Sehara-Fujisawa A, Nagasawa T, et al. Mesenchymal stromal cells in bone marrow express adiponectin and are efficiently targeted by an adiponectin promoter-driven cre transgene. Int Immunol. (2019). doi: 10.1093/intimm/dxz042
7. Krings A, Rahman S, Huang S, Lu Y, Czernik PJ, Lecka-Czernik B. Bone marrow fat has brown adipose tissue characteristics, which are attenuated with aging and diabetes. Bone. (2012) 50:546–52. doi: 10.1016/j.bone.2011.06.016
8. Lecka-Czernik B, Stechschulte LA, Czernik PJ, Sherman SB, Huang S, Krings A. Marrow adipose tissue: skeletal location, sexual dimorphism, and response to sex steroid deficiency. Front Endocrinol. (2017) 8:188. doi: 10.3389/fendo.2017.00188
9. Mattiucci D, Maurizi G, Izzi V, Cenci L, Ciarlantini M, Mancini S, et al. Bone marrow adipocytes support hematopoietic stem cell survival. J Cell Physiol. (2018) 233:1500–11. doi: 10.1002/jcp.26037
10. Jain SK, Subrahmanyam D. On the mechanism of phenylhydrazine-induced hemolytic anemia. Biochem Biophys Res Commun. (1978) 82:1320–4. doi: 10.1016/0006-291X(78)90332-7
11. Tavassoli M. Marrow adipose cells. Histochemical identification of labile and stable components. Arch Pathol Lab Med. (1976) 100:16–8.
12. Scheller EL, Doucette CR, Learman BS, Cawthorn WP, Khandaker S, Schell B, et al. Region-specific variation in the properties of skeletal adipocytes reveals regulated and constitutive marrow adipose tissues. Nat Commun. (2015) 6:7808. doi: 10.1038/ncomms8808
13. Parfitt AM. Terminology and symbols in bone morphometry. In: Zfg J, editor. Proceedings of the First International Workshop on Bone Morphometry. Ottawa, ON: Ottawa University Press. p. 331–5 (1976).
14. Parfitt AM, Drezner MK, Glorieux FH, Kanis JA, Malluche H, Meunier PJ, et al. Bone histomorphometry: standardization of nomenclature, symbols, and units. J Bone Min Metab. (1987) 2:595–610. doi: 10.1002/jbmr.5650020617
15. Mendelson A, Frenette PS. Hematopoietic stem cell niche maintenance during homeostasis and regeneration. Nat Med. (2014) 20:833–46. doi: 10.1038/nm.3647
16. Erben RG, Glosmann M. Histomorphometry in rodents. Methods Mol Biol. (2012) 816:279–303. doi: 10.1007/978-1-61779-415-5_19
17. Malhan D, Muelke M, Rosch S, Schaefer AB, Merboth F, Weisweiler D, et al. An optimized approach to perform bone histomorphometry. Front. Endocrinol. (2018) 9:666. doi: 10.3389/fendo.2018.00666
18. Prasad P, Donoghue M. A comparative study of various decalcification techniques. Indian J Dent Res. (2013) 24:302–8. doi: 10.4103/0970-9290.117991
19. Kusumbe AP, Ramasamy SK, Starsichova A, Adams RH. Sample preparation for high-resolution 3D confocal imaging of mouse skeletal tissue. Nature Protocols. (2015) 10:1904–14. doi: 10.1038/nprot.2015.125
20. Savi FM, Brierly GI, Baldwin J, Theodoropoulos C, Woodruff MA. Comparison of different decalcification methods using rat mandibles as a model. J Histochem Cytochem. (2017) 65:705–22. doi: 10.1369/0022155417733708
21. González-Chávez SA, Pacheco-Tena C, Macías-Vázquez CE, Luévano-Flores E. Assessment of different decalcifying protocols on osteopontin and osteocalcin immunostaining in whole bone specimens of arthritis rat model by confocal immunofluorescence. Int J Clin Exp Pathol. (2013) 6:1972–83.
22. Iwaniec UT, Turner RT. Failure to generate bone marrow adipocytes does not protect mice from ovariectomy-induced osteopenia. Bone. (2013) 53:145–53. doi: 10.1016/j.bone.2012.11.034
23. Yang R, Davies CM, Archer CW, Richards RG. Immunohistochemistry of matrix markers in Technovit 9100 New-embedded undecalcified bone sections. Eur Cells Mater. (2003) 6:57–71; discussion: 71. doi: 10.22203/eCM.v006a06
24. Erben RG. Embedding of bone samples in methylmethacrylate: an improved method suitable for bone histomorphometry, histochemistry, and immunohistochemistry. J Histochem Cytochem. (1997) 45:307–13. doi: 10.1177/002215549704500215
25. Beck-Cormier S, Lelliott CJ, Logan JG, Lafont DT, Merametdjian L, Leitch VD, et al. Slc20a2, encoding the phosphate transporter PiT2, is an important genetic determinant of bone quality and strength. J Bone Miner Res. (2019) 34:1101–14. doi: 10.1002/jbmr.3691
26. Bixel MG, Kusumbe AP, Ramasamy SK, Sivaraj KK, Butz S, Vestweber D, et al. Flow dynamics and HSPC homing in bone marrow microvessels. Cell Reports. (2017) 18:1804–16. doi: 10.1016/j.celrep.2017.01.042
27. Zhou BO, Yu H, Yue R, Zhao Z, Rios JJ, Naveiras O, et al. Bone marrow adipocytes promote the regeneration of stem cells and haematopoiesis by secreting SCF. Nat Cell Biol. (2017) 19:891–903. doi: 10.1038/ncb3570
28. Kusumbe AP, Ramasamy SK, Itkin T, Mäe MA, Langen UH, Betsholtz C, et al. Age-dependent modulation of vascular niches for haematopoietic stem cells. Nature. (2016) 532:380–4. doi: 10.1038/nature17638
29. Silva J, Zanette I, Noël PB, Cardoso MB, Kimm MA, Pfeiffer F. Three-dimensional non-destructive soft-tissue visualization with X-ray staining micro-tomography. Sci Rep. (2015) 5:14088. doi: 10.1038/srep14088
30. Dempster DW, Compston JE, Drezner MK, Glorieux FH, Kanis JA, Malluche H, et al. Standardized nomenclature, symbols, and units for bone histomorphometry: a 2012 update of the report of the ASBMR Histomorphometry Nomenclature Committee. J Bone Miner Res. (2013) 28:2–17. doi: 10.1002/jbmr.1805
31. Bravenboer N, Bredella MA, Chauveau C, Corsi A, Douni E, Ferris WF, et al. Standardized nomenclature, abbreviations, and units for the study of bone marrow adiposity: report of the nomenclature working group of the international bone marrow adiposity society. Front Endocrinol. (2019) 10:923. doi: 10.3389/fendo.2019.00923
32. Sato M, Westmore M, Ma YL, Schmidt A, Zeng QQ, Glass EV, et al. Teriparatide [PTH(1-34)] strengthens the proximal femur of ovariectomized nonhuman primates despite increasing porosity. J Bone Miner Res. (2004) 19:623–9. doi: 10.1359/JBMR.040112
33. Syed FA, Oursler MJ, Hefferanm TE, Peterson JM, Riggs BL, Khosla S. Effects of estrogen therapy on bone marrow adipocytes in postmenopausal osteoporotic women. Osteoporos Int. (2008) 19:1323–30. doi: 10.1007/s00198-008-0574-6
34. Razidlo DF, Whitney TJ, Casper ME, Mcgee-Lawrence ME, Stensgard BA, Li X, et al. Histone deacetylase 3 depletion in osteo/chondroprogenitor cells decreases bone density and increases marrow fat. PLoS ONE. (2010) 5:e11492. doi: 10.1371/journal.pone.0011492
35. Devlin MJ, Cloutier AM, Thomas NA, Panus DA, Lotinun S, Pinz I, et al. Caloric restriction leads to high marrow adiposity and low bone mass in growing mice. J Bone Miner Res. (2010) 25:2078–88. doi: 10.1002/jbmr.82
36. Motyl KJ, Dick-De-Paula I, Maloney AE, Lotinun S, Bornstein S, De Paula FJ, et al. Trabecular bone loss after administration of the second-generation antipsychotic risperidone is independent of weight gain. Bone. (2012) 50:490–8. doi: 10.1016/j.bone.2011.08.005
37. Duque G, Li W, Vidal C, Bermeo S, Rivas D, Henderson J. Pharmacological inhibition of PPARgamma increases osteoblastogenesis and bone mass in male C57BL/6 mice. J Bone Miner Res. (2013) 28:639–48. doi: 10.1002/jbmr.1782
38. Nallamshetty S, Wang H, Rhee EJ, Kiefer FW, Brown JD, Lotinun S, et al. Deficiency of retinaldehyde dehydrogenase 1 induces BMP2 and increases bone mass in vivo. PLoS ONE. (2013) 8:e71307. doi: 10.1371/journal.pone.0071307
39. Turner RT, Philbrick KA, Wong CP, Olson DA, Branscum AJ, Iwaniec UT. Morbid obesity attenuates the skeletal abnormalities associated with leptin deficiency in mice. J Endocrinol. (2014) 223:M1–15. doi: 10.1530/JOE-14-0224
40. Philbrick KA, Turner RT, Branscum AJ, Wong CP, Iwaniec UT. Paradoxical effects of partial leptin deficiency on bone in growing female mice. Anat Rec. (2015) 298:2018–29. doi: 10.1002/ar.23267
41. Wesseling-Perry K, Makitie RE, Valimaki VV, Laine T, Laine CM, Valimaki MJ, et al. Osteocyte protein expression is altered in low-turnover osteoporosis caused by mutations in WNT1 and PLS3. J Clin Endocrinol Metab. (2017) 102:2340–8. doi: 10.1210/jc.2017-00099
42. Le PT, Bishop KA, Maridas DE, Motyl KJ, Brooks DJ, Nagano K, et al. Spontaneous mutation of Dock7 results in lower trabecular bone mass and impaired periosteal expansion in aged female Misty mice. Bone. (2017) 105:103–14. doi: 10.1016/j.bone.2017.08.006
43. Devlin MJ, Robbins A, Cosman MN, Moursi CA, Cloutier AM, Louis L, et al. Differential effects of high fat diet and diet-induced obesity on skeletal acquisition in female C57BL/6J vs. FVB/NJ Mice Bone Rep. (2018) 8:204–14. doi: 10.1016/j.bonr.2018.04.003
44. Liu SH, Chen C, Yang RS, Yen YP, Yang YT, Tsai C. Caffeine enhances osteoclast differentiation from bone marrow hematopoietic cells and reduces bone mineral density in growing rats. J Orthop Res. (2011) 29:954–60. doi: 10.1002/jor.21326
45. Wang FS, Lian WS, Weng WT, Sun YC, Ke HJ, Chen YS, et al. Neuropeptide Y mediates glucocorticoid-induced osteoporosis and marrow adiposity in mice. Osteoporos Int. (2016) 27:2777–89. doi: 10.1007/s00198-016-3598-3
46. Zou Q, Hong W, Zhou Y, Ding Q, Wang J, Jin W, et al. Bone marrow stem cell dysfunction in radiation-induced abscopal bone loss. J Orthop Surg Res. (2016) 11:3. doi: 10.1186/s13018-015-0339-9
47. Li GW, Xu Z, Chang SX, Zhou L, Wang XY, Nian H, et al. Influence of early zoledronic acid administration on bone marrow fat in ovariectomized rats. Endocrinology. (2014) 155:4731–8. doi: 10.1210/en.2014-1359
48. Li G, Xu Z, Hou L, Li X, Li X, Yuan W, et al. Differential effects of bisphenol A diglicydyl ether on bone quality and marrow adiposity in ovary-intact and ovariectomized rats. Am J Physiol Endocrinol Metab. (2016) 311:E922–7. doi: 10.1152/ajpendo.00267.2016
49. Li G, Xu Z, Chen Y, Chang S, Calimente H, Hu J, et al. Longitudinal assessment of marrow fat content using three-point Dixon technique in osteoporotic rabbits. Menopause. (2016) 23, 1339–1344. doi: 10.1097/GME.0000000000000721
50. Kim HJ, Bae YC, Park RW, Choi SW, Cho SH, Choi YS, et al. Bone-protecting effect of safflower seeds in ovariectomized rats. Calcif Tissue Int. (2002) 71:88–94. doi: 10.1007/s00223-001-1080-4
51. Bornstein S, Moschetta M, Kawano Y, Sacco A, Huynh D, Brooks D, et al. Metformin affects cortical bone mass and marrow adiposity in diet-induced obesity in male mice. Endocrinology. (2017) 158:3369–85. doi: 10.1210/en.2017-00299
52. Yang YJ, Zhu Z, Wang DT, Zhang XL, Liu YY, Lai WX, et al. Tanshinol alleviates impaired bone formation by inhibiting adipogenesis via KLF15/PPARgamma2 signaling in GIO rats. Acta Pharmacol Sin. (2018) 39:633–41. doi: 10.1038/aps.2017.134
53. Costa S, Fairfield H, Reagan MR. Inverse correlation between trabecular bone volume and bone marrow adipose tissue in rats treated with osteoanabolic agents. Bone. (2019) 123:211–23. doi: 10.1016/j.bone.2019.03.038
54. Beekman KM, Veldhuis-Vlug AG, Den Heijer M, Maas M, Oleksik AM, Tanck MW, et al. The effect of raloxifene on bone marrow adipose tissue and bone turnover in postmenopausal women with osteoporosis. Bone. (2019) 118:62–8. doi: 10.1016/j.bone.2017.10.011
55. Beekman KM, Veldhuis-Vlug AG, Van Der Veen A, Den Heijer M, Maas M, Kerckhofs G, et al. The effect of PPARγ inhibition on bone marrow adipose tissue and bone in C3H/HeJ mice. Am J Physiol Endocrinol Metab. (2019) 316:E96–105. doi: 10.1152/ajpendo.00265.2018
56. Fan Y, Hanai JI, Le PT, Bi R, Maridas D, Demambro V, et al. Parathyroid hormone directs bone marrow mesenchymal cell fate. Cell Metab. (2017) 25:661–72. doi: 10.1016/j.cmet.2017.01.001
57. Chandra A, Lin T, Tribble MB, Zhu J, Altman AR, Tseng WJ, et al. PTH1-34 alleviates radiotherapy-induced local bone loss by improving osteoblast and osteocyte survival. Bone. (2014) 67:33–40. doi: 10.1016/j.bone.2014.06.030
58. Brennan TA, Egan KP, Lindborg CM, Chen Q, Sweetwyne MT, Hankenson KD, et al. Mouse models of telomere dysfunction phenocopy skeletal changes found in human age-related osteoporosis. Dis Model Mech. (2014) 7:583–92. doi: 10.1242/dmm.014928
59. Li GW, Chang SX, Fan JZ, Tian YN, Xu Z, He YM. Marrow adiposity recovery after early zoledronic acid treatment of glucocorticoid-induced bone loss in rabbits assessed by magnetic resonance spectroscopy. Bone. (2013) 52:668–75. doi: 10.1016/j.bone.2012.11.002
60. Tratwal J, Boussema C, Burri O, Koliqi T, Campos V, Nardi V, et al. A standardized quantification tool for bone marrow components in histological sections. Exp Hematol. (2017) 53:S62–3. doi: 10.1016/j.exphem.2017.06.112
61. Tratwal J. Quantitative approaches to unravel bone marrow adipocyte site-specificity and its implication in hematopoiesis (dissertation). Ecole Polytechnique Fédérale de Lausanne, Lausanne, Switzerland (2020).
62. Rodrigues AC, Leal TF, Costa A, Silva FJ, Soares LL, Brum PC, et al. Effects of aerobic exercise on the inflammatory cytokine profile and expression of lipolytic and thermogenic genes in beta1-AR(-/-) mice adipose tissue. Life Sci. (2019) 221:224–32. doi: 10.1016/j.lfs.2019.02.031
63. Styner M, Pagnotti GM, Mcgrath C, Wu X, Sen B, Uzer G, et al. Exercise decreases marrow adipose tissue through β-oxidation in obese running mice. J Bone Miner Res. (2017) 32:1692–702. doi: 10.1002/jbmr.3159
64. Poulsen RC, Gotlinger KH, Serhan CN, Kruger MC. Identification of inflammatory and proresolving lipid mediators in bone marrow and their lipidomic profiles with ovariectomy and omega-3 intake. Am J Hematol. (2008) 83:437–45. doi: 10.1002/ajh.21170
65. During A. Lipid determination in bone marrow and mineralized bone tissue: from sample preparation to improved high-performance thin-layer and liquid chromatographic approaches. J Chromatogr A. (2017) 1515:232–44. doi: 10.1016/j.chroma.2017.08.004
66. Neues F, Epple M. X-ray microcomputer tomography for the study of biomineralized endo- and exoskeletons of animals. Chem Rev. (2008) 108:4734–41. doi: 10.1021/cr078250m
67. Salmon LPS, Alexander Y. Application of Nano-CT and high-resolution micro-CT to study bone quality and ultrastructure, scaffold biomaterials and vascular networks. In: Qin L, Genant HK, Griffith JF, Leung KS, editors. Advanced Bioimaging Technologies in Assessment of the Quality of Bone and Scaffold Materials. Berlin;Heidelberg: Springer (2007). p. 323–31. doi: 10.1007/978-3-540-45456-4_19
68. Kerckhofs G, Durand M, Vangoitsenhoven R, Marin C, Van Der Schueren B, Carmeliet G, et al. Changes in bone macro-and microstructure in diabetic obese mice revealed by high resolution microfocus X-ray computed tomography. Sci Rep. (2016) 6:35517. doi: 10.1038/srep35517
69. Ritman EL. Current status of developments and applications of micro-CT. Ann Rev Biomed Eng. (2011) 13:531–52. doi: 10.1146/annurev-bioeng-071910-124717
70. De Bournonville S, Vangrunderbeeck S, Kerckhofs G. Contrast-enhanced microCT for virtual 3D anatomical pathology of biological tissues: a literature review. Contrast Media Mol Imaging. (2019) 2019:8617406. doi: 10.1155/2019/8617406
71. Johnson JT, Hansen MS, Wu I, Healy LJ, Johnson CR, Jones GM, et al. Virtual histology of transgenic mouse embryos for high-throughput phenotyping. PLoS Genet. (2006) 2:471–7. doi: 10.1371/journal.pgen.0020061
72. Litzlbauer HD, Neuhaeuser C, Moell A, Greschus S, Breithecker A, Franke FE, et al. Three-dimensional imaging and morphometric analysis of alveolar tissue from microfocal X-ray-computed tomography. Am J Physiol Lung Cell Mol Physiol. (2006) 291:L535–45. doi: 10.1152/ajplung.00088.2005
73. Ribi W, Senden TJ, Sakellariou A, Limaye A, Zhang S. Imaging honey bee brain anatomy with micro-X-ray-computed tomography. J Neurosci Methods. (2008) 171:93–7. doi: 10.1016/j.jneumeth.2008.02.010
74. Palade BYGE. A study of fixation for electron microscopy. J Exp Med. (1951) 95:285–307. doi: 10.1084/jem.95.3.285
75. Turello R, Snyder D, Hartman HA. A modification the osmium tetroxide post-fixation technique for the demonstration of extracellular lipid in paraffin-embedded tissue sections. J Histotechnol. (1984) 7:75–7. doi: 10.1179/his.1984.7.2.75
76. Scheller EL, Troiano N, Vanhoutan JN, Bouxsein MA, Fretz JA, Xi Y, et al. Use of osmium tetroxide staining with microcomputerized tomography to visualize and quantify bone marrow adipose tissue in vivo. Methods Enzymol. (2014) 537:123–39. doi: 10.1016/B978-0-12-411619-1.00007-0
77. Khoury BM, Bigelow EMR, Smith LM, Schlecht SH, Scheller EL, Andarawis-Puri N, et al. The use of nano-computed tomography to enhance musculoskeletal research. Connect Tissue Res. (2015) 56:106–19. doi: 10.3109/03008207.2015.1005211
78. Kerckhofs G, Stegen S, Van Gastel N, Sap A, Falgayrac G, Penel G, et al. Simultaneous three-dimensional visualization of mineralized and soft skeletal tissues by a novel microCT contrast agent with polyoxometalate structure. Biomaterials. (2018) 159:1–12. doi: 10.1016/j.biomaterials.2017.12.016
79. Robles H, Park SJ, Joens MS, Fitzpatrick JA J, Craft CS, Scheller EL. Characterization of the bone marrow adipocyte niche with three-dimensional electron microscopy. Bone. (2019) 118:89–98. doi: 10.1016/j.bone.2018.01.020
80. Coutel X, Olejnik C, Marchandise P, Delattre J, Behal H, Kerckhofs G, et al. A novel microCT method for bone and marrow adipose tissue alignment identifies key differences between mandible and tibia in rats. Calcified Tissue Int. (2018) 103:189–97. doi: 10.1007/s00223-018-0397-1
81. Xiao Z, Cao L, Liang Y, Huang J, Stern AR, Dallas M, et al. Osteoblast-specific deletion of Pkd2 leads to low-turnover osteopenia and reduced bone marrow adiposity. PLoS ONE. (2014) 9:e114198. doi: 10.1371/journal.pone.0114198
82. Balani DH, Ono N, Kronenberg HM. Parathyroid hormone regulates fates of murine osteoblast precursors in vivo. J Clin Investig. (2017) 127:3327–38. doi: 10.1172/JCI91699
83. Liu P, Ji Y, Yuen T, Rendina-Ruedy E, Demambro VE, Dhawan S, et al. Blocking FSH induces thermogenic adipose tissue and reduces body fat. Nature. (2017) 546:107–12. doi: 10.1038/nature22342
84. Yu B, Huo L, Liu Y, Deng P, Szymanski J, Li J, et al. PGC-1α controls skeletal stem cell fate and bone-fat balance in osteoporosis and skeletal aging by inducing TAZ. Cell Stem Cell. (2018) 23:193–209.e5. doi: 10.1016/j.stem.2018.09.001
85. Metscher BD. MicroCT for developmental biology: a versatile tool for high-contrast 3D imaging at histological resolutions. Dev Dyn. (2009) 238:632–40. doi: 10.1002/dvdy.21857
86. Makarovsky I, Markel G, Hoffman A, Schein O, Finkelstien A, Brosh-Nissimov T, et al. Osmium tetroxide: a new kind of weapon. Israel Med Assoc J. (2007) 9:750–2.
87. Nakakoshi M, Nishioka H, Katayama E. New versatile staining reagents for biological transmission electron microscopy that substitute for uranyl acetate. J Electr Microscopy. (2011) 60:401–7. doi: 10.1093/jmicro/dfr084
88. Greenbaum A, Chan KY, Dobreva T, Brown D, Balani DH, Boyce R, et al. Bone CLARITY: clearing, imaging, and computational analysis of osteoprogenitors within intact bone marrow. Sci Transl Med. (2017) 9:eaah6518. doi: 10.1126/scitranslmed.aah6518
89. Jing D, Zhang S, Luo W, Gao X, Men Y, Ma C, et al. Tissue clearing of both hard and soft tissue organs with the pegasos method. Cell Res. (2018) 28:803–18. doi: 10.1038/s41422-018-0049-z
90. Coutu DL, Kokkaliaris KD, Kunz L, Schroeder T. Three-dimensional map of nonhematopoietic bone and bone-marrow cells and molecules. Nat Biotechnol. (2017) 35:1202–10. doi: 10.1038/nbt.4006
91. Gomariz A, Helbling PM, Isringhausen S, Suessbier U, Becker A, Boss A, et al. Quantitative spatial analysis of haematopoiesis-regulating stromal cells in the bone marrow microenvironment by 3D microscopy. Nature Communications. (2018) 9:2532. doi: 10.1038/s41467-018-04770-z
92. Hu HH, Kan HE. Quantitative proton MR techniques for measuring fat. NMR Biomed. (2013) 26:1609–29. doi: 10.1002/nbm.3025
93. Karampinos DC, Ruschke S, Dieckmeyer M, Diefenbach M, Franz D, Gersing AS, et al. Quantitative MRI and spectroscopy of bone marrow. J Magn Reson Imaging. (2018) 47:332–53. doi: 10.1002/jmri.25769
94. Paccou J, Hardouin P, Cotten A, Penel G, Cortet B. The role of bone marrow fat in skeletal health: usefulness and perspectives for clinicians. J Clin Endocrinol Metab. (2015) 100:3613–21. doi: 10.1210/jc.2015-2338
95. Reeder SB, Cruite I, Hamilton G, Sirlin CB. Quantitative assessment of liver fat with magnetic resonance imaging and spectroscopy. J Magn Reson Imaging. (2011) 34:729–49. doi: 10.1002/jmri.22580
96. Reeder SB, Hu HH, Sirlin CB. Proton density fat-fraction: a standardized MR-based biomarker of tissue fat concentration. J Magn Reson Imaging. (2012) 36:1011–4. doi: 10.1002/jmri.23741
97. Pino AM, Rodríguez JP. Is fatty acid composition of human bone marrow significant to bone health? Bone. (2019) 118:53–61. doi: 10.1016/j.bone.2017.12.014
98. Li G, Xu Z, Gu H, Li X, Yuan W, Chang S, et al. Comparison of chemical shift-encoded water-fat MRI and MR spectroscopy in quantification of marrow fat in postmenopausal females. J Magn Reson Imaging. (2017) 45:66–73. doi: 10.1002/jmri.25351
99. Ruschke S, Pokorney A, Baum T, Eggers H, Miller JH, Hu HH, et al. Measurement of vertebral bone marrow proton density fat fraction in children using quantitative water-fat MRI. MAGMA. (2017) 30:449–60. doi: 10.1007/s10334-017-0617-0
100. Gee CS, Nguyen JT, Marquez CJ, Heunis J, Lai A, Wyatt C, et al. Validation of bone marrow fat quantification in the presence of trabecular bone using MRI. J Magn Reson Imaging. (2015) 42:539–44. doi: 10.1002/jmri.24795
101. Macewan IJ, Glembotski NE, D'lima D, Bae W, Masuda K, Rashidi HH, et al. Proton density water fraction as a biomarker of bone marrow cellularity: validation in ex vivo spine specimens. Magn Reson Imaging. (2014) 32:1097–101. doi: 10.1016/j.mri.2014.03.005
102. Zhang T, Duan Y, Ye J, Xu W, Shu N, Wang C, et al. Brain MRI characteristics of patients with anti-N-methyl-D-aspartate receptor encephalitis and their associations with 2-year clinical outcome. AJNR Am J Neuroradiol. (2018) 39:824–9. doi: 10.3174/ajnr.A5593
103. Aoki T, Yamaguchi S, Kinoshita S, Hayashida Y, Korogi Y. Quantification of bone marrow fat content using iterative decomposition of water and fat with echo asymmetry and least-squares estimation (IDEAL): reproducibility, site variation and correlation with age and menopause. Br J Radiol. (2016) 89:20150538. doi: 10.1259/bjr.20150538
104. Karampinos DC, Ruschke S, Gordijenko O, Grande Garcia E, Kooijman H, Burgkart R, et al. Association of MRS-based vertebral bone marrow fat fraction with bone strength in a human in vitro model. J Osteoporos. (2015) 2015:152349. doi: 10.1155/2015/152349
105. Li X, Kuo D, Schafer AL, Porzig A, Link TM, Black D, et al. Quantification of vertebral bone marrow fat content using 3 Tesla MR spectroscopy: reproducibility, vertebral variation, and applications in osteoporosis. J Magn Reson Imaging. (2011) 33:974–9. doi: 10.1002/jmri.22489
106. Baum T, Yap SP, Dieckmeyer M, Ruschke S, Eggers H, Kooijman H, et al. Assessment of whole spine vertebral bone marrow fat using chemical shift-encoding based water-fat MRI. J Magn Reson Imaging. (2015) 42:1018–23. doi: 10.1002/jmri.24854
107. Karampinos DC, Melkus G, Baum T, Bauer JS, Rummeny EJ, Krug R. Bone marrow fat quantification in the presence of trabecular bone: initial comparison between water-fat imaging and single-voxel MRS. Magn Reson Med. (2014) 71:1158–65. doi: 10.1002/mrm.24775
108. Dieckmeyer M, Ruschke S, Cordes C, Yap SP, Kooijman H, Hauner H, et al. The need for T(2) correction on MRS-based vertebral bone marrow fat quantification: implications for bone marrow fat fraction age dependence. NMR Biomed. (2015) 28:432–9. doi: 10.1002/nbm.3267
109. Liu CY, Mckenzie CA, Yu H, Brittain JH, Reeder SB. Fat quantification with IDEAL gradient echo imaging: correction of bias from T(1) and noise. Magn Reson Med. (2007) 58:354–64. doi: 10.1002/mrm.21301
110. Hu HH, Bornert P, Hernando D, Kellman P, Ma J, Reeder S, et al. ISMRM workshop on fat-water separation: insights, applications and progress in MRI. Magn Reson Med. (2012) 68:378–88. doi: 10.1002/mrm.24369
111. Yu H, Shimakawa A, Mckenzie CA, Brodsky E, Brittain JH, Reeder SB. Multiecho water-fat separation and simultaneous R2* estimation with multifrequency fat spectrum modeling. Magn Reson Med. (2008) 60:1122–34. doi: 10.1002/mrm.21737
112. Le Ster C, Gambarota G, Lasbleiz J, Guillin R, Decaux O, Saint-Jalmes H. Breath-hold MR measurements of fat fraction, T1, and T2 * of water and fat in vertebral bone marrow. J Magn Reson Imaging. (2016) 44:549–55. doi: 10.1002/jmri.25205
113. Yeung DK, Griffith JF, Antonio GE, Lee FK, Woo J, Leung PC. Osteoporosis is associated with increased marrow fat content and decreased marrow fat unsaturation: a proton MR spectroscopy study. J Magn Reson Imaging. (2005) 22:279–85. doi: 10.1002/jmri.20367
114. Patsch JM, Li X, Baum T, Yap SP, Karampinos DC, Schwartz AV, et al. Bone marrow fat composition as a novel imaging biomarker in postmenopausal women with prevalent fragility fractures. J Bone Miner Res. (2013) 28:1721–8. doi: 10.1002/jbmr.1950
115. Maciel JG, De Araujo IM, Carvalho AL, Simao MN, Bastos CM, Troncon LE, et al. Marrow fat quality differences by sex in healthy adults. J Clin Densitom. (2017) 20:106–13. doi: 10.1016/j.jocd.2016.08.002
116. Budzik JF, Lefebvre G, Forzy G, El Rafei M, Chechin D, Cotten A. Study of proximal femoral bone perfusion with 3D T1 dynamic contrast-enhanced MRI: a feasibility study. Eur Radiol. (2014) 24:3217–23. doi: 10.1007/s00330-014-3340-5
117. Goodsitt MM, Rosenthal DI. Quantitative computed tomography scanning for measurement of bone and bone marrow fat content. A comparison of single- and dual-energy techniques using a solid synthetic phantom. Invest Radiol. (1987) 22:799–810. doi: 10.1097/00004424-198710000-00006
118. Laval-Jeantet AM, Roger B, Bouysee S, Bergot C, Mazess RB. Influence of vertebral fat content on quantitative CT density. Radiology. (1986) 159:463–6. doi: 10.1148/radiology.159.2.3961178
119. Arentsen L, Hansen KE, Yagi M, Takahashi Y, Shanley R, Mcarthur A, et al. Use of dual-energy computed tomography to measure skeletal-wide marrow composition and cancellous bone mineral density. J Bone Miner Metab. (2017) 35:428–36. doi: 10.1007/s00774-016-0796-1
120. Rosenthal DI, Hayes CW, Rosen B, Mayo-Smith W, Goodsitt MM. Fatty replacement of spinal bone marrow due to radiation: demonstration by dual energy quantitative CT and MR imaging. J Comput Assist Tomogr. (1989) 13:463–5. doi: 10.1097/00004728-198905000-00018
121. Arentsen T, Raith H, Qian Y, Forssberg H, Diaz Heijtz R. Host microbiota modulates development of social preference in mice. Microb Ecol Health Dis. (2015) 26:29719. doi: 10.3402/mehd.v26.29719
122. Magome T, Froelich J, Takahashi Y, Arentsen L, Holtan S, Verneris MR, et al. Evaluation of functional marrow irradiation based on skeletal marrow composition obtained using dual-energy computed tomography. Int J Radiat Oncol Biol Phys. (2016) 96:679–87. doi: 10.1016/j.ijrobp.2016.06.2459
123. Bredella MA, Daley SM, Kalra MK, Brown JK, Miller KK, Torriani M. Marrow adipose tissue quantification of the lumbar spine by using dual-energy CT and single-voxel (1)H MR spectroscopy: a feasibility study. Radiology. (2015) 277:230–5. doi: 10.1148/radiol.2015142876
124. Hui SK, Arentsen L, Sueblinvong T, Brown K, Bolan P, Ghebre RG, et al. A phase I feasibility study of multi-modality imaging assessing rapid expansion of marrow fat and decreased bone mineral density in cancer patients. Bone. (2015) 73:90–7. doi: 10.1016/j.bone.2014.12.014
125. Bianco P, Robey PG. Skeletal stem cells. Development. (2015) 142:1023–7. doi: 10.1242/dev.102210
126. Bianco P, Gehron Robey P. Marrow stromal stem cells. J Clin Invest. (2000) 105:1663–8. doi: 10.1172/JCI10413
127. Kassem M, Bianco P. Skeletal stem cells in space and time. Cell. (2015) 160:17–9. doi: 10.1016/j.cell.2014.12.034
128. Hardouin P, Rharass T, Lucas S. Bone marrow adipose tissue: to be or not to be a typical adipose tissue? Front Endocrinol. (2016) 7:85. doi: 10.3389/fendo.2016.00085
129. Colvin GA, Lambert JF, Abedi M, Hsieh CC, Carlson JE, Stewart FM, et al. Murine marrow cellularity and the concept of stem cell competition: geographic and quantitative determinants in stem cell biology. Leukemia. (2004) 18:575–83. doi: 10.1038/sj.leu.2403268
130. Poloni A, Maurizi G, Serrani F, Mancini S, Zingaretti MC, Frontini A, et al. Molecular and functional characterization of human bone marrow adipocytes. Exp Hematol. (2013) 41:558–66.e2. doi: 10.1016/j.exphem.2013.02.005
131. Hozumi A, Osaki M, Sakamoto K, Goto H, Fukushima T, Baba H, et al. Dexamethasone-induced plasminogen activator inhibitor-1 expression in human primary bone marrow adipocytes. Biomed Res. (2010) 31:281–6. doi: 10.2220/biomedres.31.281
132. Hagberg CE, Li Q, Kutschke M, Bhowmick D, Kiss E, Shabalina IG, et al. Flow cytometry of mouse and human adipocytes for the analysis of browning and cellular heterogeneity. Cell Rep. (2018) 24:2746–56.e5. doi: 10.1016/j.celrep.2018.08.006
133. Torisawa YS, Spina CS, Mammoto T, Mammoto A, Weaver JC, Tat T, et al. Bone marrow-on-a-chip replicates hematopoietic niche physiology in vitro. Nat Methods. (2014) 11:663–9. doi: 10.1038/nmeth.2938
134. Bourgine PE, Klein T, Paczulla AM, Shimizu T, Kunz L, Kokkaliaris KD, et al. In vitro biomimetic engineering of a human hematopoietic niche with functional properties. Proc Natl Acad Sci USA. (2018) 115:E5688–95. doi: 10.1073/pnas.1805440115
135. Fairfield H, Falank C, Farrell M, Vary C, Boucher JM, Driscoll H, et al. Development of a 3D bone marrow adipose tissue model. Bone. (2019) 118:77–88. doi: 10.1016/j.bone.2018.01.023
136. Boulais PE, Mizoguchi T, Zimmerman S, Nakahara F, Vivie J, Mar JC, et al. The majority of CD45(-) Ter119(-) CD31(-) bone marrow cell fraction is of hematopoietic origin and contains erythroid and lymphoid progenitors. Immunity. (2018) 49:627–39.e6. doi: 10.1016/j.immuni.2018.08.019
137. Worthley DL, Churchill M, Compton JT, Tailor Y, Rao M, Si Y, et al. Gremlin 1 identifies a skeletal stem cell with bone, cartilage, and reticular stromal potential. Cell. (2015) 160:269–84. doi: 10.1016/j.cell.2014.11.042
138. Chan CKF, Gulati GS, Sinha R, Tompkins JV, Lopez M, Carter AC, et al. Identification of the human skeletal stem cell. Cell. (2018) 175:43–56.e21. doi: 10.1016/j.cell.2018.07.029
139. Tormin A, Li O, Brune JC, Walsh S, Schutz B, Ehinger M, et al. CD146 expression on primary nonhematopoietic bone marrow stem cells is correlated with in situ localization. Blood. (2011) 117:5067–77. doi: 10.1182/blood-2010-08-304287
140. Serafini M, Sacchetti B, Pievani A, Redaelli D, Remoli C, Biondi A, et al. Establishment of bone marrow and hematopoietic niches in vivo by reversion of chondrocyte differentiation of human bone marrow stromal cells. Stem Cell Res. (2014) 12:659–72. doi: 10.1016/j.scr.2014.01.006
141. Houlihan DD, Mabuchi Y, Morikawa S, Niibe K, Araki D, Suzuki S, et al. Isolation of mouse mesenchymal stem cells on the basis of expression of Sca-1 and PDGFR-alpha. Nat Protoc. (2012) 7:2103–11. doi: 10.1038/nprot.2012.125
142. Li H, Ghazanfari R, Zacharaki D, Ditzel N, Isern J, Ekblom M, et al. Low/negative expression of PDGFR-alpha identifies the candidate primary mesenchymal stromal cells in adult human bone marrow. Stem Cell Rep. (2014) 3:965–74. doi: 10.1016/j.stemcr.2014.09.018
143. Dominici M, Le Blanc K, Mueller I, Slaper-Cortenbach I, Marini F, Krause D, et al. Minimal criteria for defining multipotent mesenchymal stromal cells. The international society for cellular therapy position statement. Cytotherapy. (2006) 8:315–7. doi: 10.1080/14653240600855905
144. Robey PG, Kuznetsov SA, Ren J, Klein HG, Sabatino M, Stroncek DF. Generation of clinical grade human bone marrow stromal cells for use in bone regeneration. Bone. (2015) 70:87–92. doi: 10.1016/j.bone.2014.07.020
145. Tanavde V, Vaz C, Rao MS, Vemuri MC, Pochampally RR. Research using mesenchymal stem/stromal cells: quality metric towards developing a reference material. Cytotherapy. (2015) 17:1169–77. doi: 10.1016/j.jcyt.2015.07.008
146. Arcidiacono JA, Bauer SR, Kaplan DS, Allocca CM, Sarkar S, Lin-Gibson S. FDA and NIST collaboration on standards development activities supporting innovation and translation of regenerative medicine products. Cytotherapy. (2018) 20:779–84. doi: 10.1016/j.jcyt.2018.03.039
147. Sreejit P, Dilip KB, Verma RS. Generation of mesenchymal stem cell lines from murine bone marrow. Cell Tissue Res. (2012) 350:55–68. doi: 10.1007/s00441-012-1458-9
148. Suire C, Brouard N, Hirschi K, Simmons PJ. Isolation of the stromal-vascular fraction of mouse bone marrow markedly enhances the yield of clonogenic stromal progenitors. Blood. (2012) 119:e86–95. doi: 10.1182/blood-2011-08-372334
149. Mendez-Ferrer S, Michurina TV, Ferraro F, Mazloom AR, Macarthur BD, Lira SA, et al. Mesenchymal and haematopoietic stem cells form a unique bone marrow niche. Nature. (2010) 466:829–34. doi: 10.1038/nature09262
150. Ding L, Saunders TL, Enikolopov G, Morrison SJ. Endothelial and perivascular cells maintain haematopoietic stem cells. Nature. (2012) 481:457–62. doi: 10.1038/nature10783
151. Soleimani M, Nadri S. A protocol for isolation and culture of mesenchymal stem cells from mouse bone marrow. Nat Protoc. (2009) 4:102–6. doi: 10.1038/nprot.2008.221
152. Sui B, Hu C, Liao L, Chen Y, Zhang X, Fu X, et al. Mesenchymal progenitors in osteopenias of diverse pathologies: differential characteristics in the common shift from osteoblastogenesis to adipogenesis. Sci Rep. (2016) 6:30186. doi: 10.1038/srep30186
153. Huang S, Xu L, Sun Y, Wu T, Wang K, Li G. An improved protocol for isolation and culture of mesenchymal stem cells from mouse bone marrow. J Orthop Translat. (2015) 3:26–33. doi: 10.1016/j.jot.2014.07.005
154. Robey PG, Kuznetsov SA, Riminucci M, Bianco P. Bone marrow stromal cell assays: in vitro and in vivo. Methods Mol Biol. (2014) 1130:279–93. doi: 10.1007/978-1-62703-989-5_21
155. Ko FC, Martins JS, Reddy P, Bragdon B, Hussein AI, Gerstenfeld LC, et al. Acute phosphate restriction impairs bone formation and increases marrow adipose tissue in growing mice. J Bone Miner Res. (2016) 31:2204–14. doi: 10.1002/jbmr.2891
156. Abdallah BM, Alzahrani AM, Kassem M. Secreted clusterin protein inhibits osteoblast differentiation of bone marrow mesenchymal stem cells by suppressing ERK1/2 signaling pathway. Bone. (2018) 110:221–9. doi: 10.1016/j.bone.2018.02.018
157. Calvi LM, Adams GB, Weibrecht KW, Weber JM, Olson DP, Knight MC, et al. Osteoblastic cells regulate the haematopoietic stem cell niche. Nature. (2003) 425:841–6. doi: 10.1038/nature02040
158. Caroti CM, Ahn H, Salazar HF, Joseph G, Sankar SB, Willett NJ, et al. A novel technique for accelerated culture of murine mesenchymal stem cells that allows for sustained multipotency. Sci Rep. (2017) 7:13334. doi: 10.1038/s41598-017-13477-y
159. Peister A, Mellad JA, Larson BL, Hall BM, Gibson LF, Prockop DJ. Adult stem cells from bone marrow (MSCs) isolated from different strains of inbred mice vary in surface epitopes, rates of proliferation, and differentiation potential. Blood. (2004) 103:1662–8. doi: 10.1182/blood-2003-09-3070
160. Zhu H, Guo ZK, Jiang XX, Li H, Wang XY, Yao HY, et al. A protocol for isolation and culture of mesenchymal stem cells from mouse compact bone. Nat Protoc. (2010) 5:550–60. doi: 10.1038/nprot.2009.238
161. Tencerova M, Figeac F, Ditzel N, Taipaleenmaki H, Nielsen TK, Kassem M. High-fat diet-induced obesity promotes expansion of bone marrow adipose tissue and impairs skeletal stem cell functions in mice. J Bone Miner Res. (2018) 33:1154–65. doi: 10.1002/jbmr.3408
162. Nagasawa T, Omatsu Y, Sugiyama T. Control of hematopoietic stem cells by the bone marrow stromal niche: the role of reticular cells. Trends Immunol. (2011) 32:315–20. doi: 10.1016/j.it.2011.03.009
163. Scott MA, Nguyen VT, Levi B, James AW. Current methods of adipogenic differentiation of mesenchymal stem cells. Stem Cells Dev. (2011) 20:1793–804. doi: 10.1089/scd.2011.0040
164. Gobaa S, Hoehnel S, Lutolf MP. Substrate elasticity modulates the responsiveness of mesenchymal stem cells to commitment cues. Integr Biol. (2015) 7:1135–42. doi: 10.1039/c4ib00176a
165. Gubelmann C, Schwalie PC, Raghav SK, Roder E, Delessa T, Kiehlmann E, et al. Identification of the transcription factor ZEB1 as a central component of the adipogenic gene regulatory network. Elife. (2014) 3:e03346. doi: 10.7554/eLife.03346.020
166. Whitfield MJ, Cheng W, Lee J, Vliet KJV. Onset of heterogeneity in culture-expanded bone marrow stromal cells. Stem Cell Res. (2013) 11:1365–77. doi: 10.1016/j.scr.2013.09.004
167. Schwalie PC, Dong H, Zachara M, Russeil J, Alpern D, Akchiche N, et al. A stromal cell population that inhibits adipogenesis in mammalian fat depots. Nature. (2018) 559:103–8. doi: 10.1038/s41586-018-0226-8
168. Friedenstein AJ, Petrakova KV, Kurolesova AI, Frolova GP. Heterotopic of bone marrow. Analysis of precursor cells for osteogenic and hematopoietic tissues. Transplantation. (1968) 6:230–47. doi: 10.1097/00007890-196803000-00009
169. Sacchetti B, Funari A, Michienzi S, Di Cesare S, Piersanti S, Saggio I, et al. Self-renewing osteoprogenitors in bone marrow sinusoids can organize a hematopoietic microenvironment. Cell. (2007) 131:324–36. doi: 10.1016/j.cell.2007.08.025
170. Krautgasser C, Mandl M, Hatzmann FM, Waldegger P, Mattesich M, Zwerschke W. Reliable reference genes for expression analysis of proliferating and adipogenically differentiating human adipose stromal cells. Cell Mol Biol Lett. (2019) 24:14. doi: 10.1186/s11658-019-0140-6
171. Santos BP, da Costa Diesel LF, da Silva Meirelles L, Nardi NB, Camassola M. Identification of suitable reference genes for quantitative gene expression analysis in rat adipose stromal cells induced to trilineage differentiation. Gene. (2016) 594:211–9. doi: 10.1016/j.gene.2016.09.002
172. Smus JP, Moura CC, Mcmorrow E, Tare RS, Oreffo ROC, Mahajan S. Tracking adipogenic differentiation of skeletal stem cells by label-free chemically selective imaging. Chem Sci. (2015) 6:7089–96. doi: 10.1039/C5SC02168E
173. Campos V, Rappaz B, Kuttler F, Turcatti G, Naveiras O. High-throughput, nonperturbing quantification of lipid droplets with digital holographic microscopy. J Lipid Res. (2018) 59:1301–10. doi: 10.1194/jlr.D085217
174. Doucette CR, Horowitz MC, Berry R, Macdougald OA, Anunciado-Koza R, Koza RA, et al. A high fat diet increases bone marrow adipose tissue (MAT) but does not alter trabecular or cortical bone mass in C57BL/6J mice. J Cell Physiol. (2015) 230:2032–7. doi: 10.1002/jcp.24954
175. Scheller EL, Khoury B, Moller KL, Wee NK, Khandaker S, Kozloff KM, et al. Changes in skeletal integrity and marrow adiposity during high-fat diet and after weight loss. Front Endocrinol. (2016) 7:102. doi: 10.3389/fendo.2016.00102
176. Styner M, Thompson WR, Galior K, Uzer G, Wu X, Kadari S, et al. Bone marrow fat accumulation accelerated by high fat diet is suppressed by exercise. Bone. (2014) 64:39–46. doi: 10.1016/j.bone.2014.03.044
177. Cawthorn WP, Scheller EL, Parlee SD, Pham HA, Learman BS, Redshaw CM, et al. Expansion of bone marrow adipose tissue during caloric restriction is associated with increased circulating glucocorticoids and not with hypoleptinemia. Endocrinology. (2016) 157:508–21. doi: 10.1210/en.2015-1477
178. Scheller EL, Khandaker S, Learman BS, Cawthorn WP, Anderson LM, Pham HA, et al. Bone marrow adipocytes resist lipolysis and remodeling in response to beta-adrenergic stimulation. Bone. (2019) 118:32–41. doi: 10.1016/j.bone.2018.01.016
179. Halade GV, Rahman MM, Williams PJ, Fernandes G. Combination of conjugated linoleic acid with fish oil prevents age-associated bone marrow adiposity in C57Bl/6J mice. J Nutr Biochem. (2011) 22:459–69. doi: 10.1016/j.jnutbio.2010.03.015
180. Plummer J, Park M, Perodin F, Horowitz MC, Hens JR. Methionine-restricted diet increases miRNAs that can target RUNX2 expression and alters bone structure in young mice. J Cell Biochem. (2017) 118:31–42. doi: 10.1002/jcb.25604
181. Hamrick MW, Della-Fera MA, Choi YH, Pennington C, Hartzell D, Baile CA. Leptin treatment induces loss of bone marrow adipocytes and increases bone formation in leptin-deficient ob/ob mice. J Bone Miner Res. (2005) 20:994–1001. doi: 10.1359/JBMR.050103
182. Motyl KJ, Mccabe LR. Leptin treatment prevents type I diabetic marrow adiposity but not bone loss in mice. J Cell Physiol. (2009) 218:376–84. doi: 10.1002/jcp.21608
183. Devlin MJ, Brooks DJ, Conlon C, Vliet M, Louis L, Rosen CJ, et al. Daily leptin blunts marrow fat but does not impact bone mass in calorie-restricted mice. J Endocrinol. (2016) 229:295–306. doi: 10.1530/JOE-15-0473
184. Hamrick MW, Della Fera MA, Choi YH, Hartzell D, Pennington C, Baile CA. Injections of leptin into rat ventromedial hypothalamus increase adipocyte apoptosis in peripheral fat and in bone marrow. Cell Tissue Res. (2007) 327:133–41. doi: 10.1007/s00441-006-0312-3
185. Lindenmaier LB, Philbrick KA, Branscum AJ, Kalra SP, Turner RT, Iwaniec UT. Hypothalamic leptin gene therapy reduces bone marrow adiposity in ob/ob mice fed regular and high-fat diets. Front Endocrinol. (2016) 7:110. doi: 10.3389/fendo.2016.00110
186. Sottile V, Seuwen K, Kneissel M. Enhanced marrow adipogenesis and bone resorption in estrogen-deprived rats treated with the PPARgamma agonist BRL49653 (rosiglitazone). Calcif Tissue Int. (2004) 75:329–37. doi: 10.1007/s00223-004-0224-8
187. Tornvig L, Mosekilde LI, Justesen J, Falk E, Kassem M. Troglitazone treatment increases bone marrow adipose tissue volume but does not affect trabecular bone volume in mice. Calcif Tissue Int. (2001) 69:46–50. doi: 10.1007/s002230020018
188. Lazarenko OP, Rzonca SO, Hogue WR, Swain FL, Suva LJ, Lecka-Czernik B. Rosiglitazone induces decreases in bone mass and strength that are reminiscent of aged bone. Endocrinology. (2007) 148:2669–80. doi: 10.1210/en.2006-1587
189. Styner M, Pagnotti GM, Galior K, Wu X, Thompson WR, Uzer G, et al. Exercise regulation of marrow fat in the setting of PPARγ agonist treatment in female C57BL/6 mice. Endocrinology. (2015) 156:2753–61. doi: 10.1210/en.2015-1213
190. Ackert-Bicknell CL, Shockley KR, Horton LG, Lecka-Czernik B, Churchill GA, Rosen CJ. Strain-specific effects of rosiglitazone on bone mass, body composition, and serum insulin-like growth factor-I. Endocrinology. (2009) 150:1330–40. doi: 10.1210/en.2008-0936
191. Sulston RJ, Learman BS, Zhang B, Scheller EL, Parlee SD, Simon BR, et al. Increased circulating adiponectin in response to thiazolidinediones: investigating the role of bone marrow adipose tissue. Front Endocrinol. (2016) 7:128. doi: 10.3389/fendo.2016.00128
192. Botolin S, Mccabe LR. Inhibition of PPARgamma prevents type I diabetic bone marrow adiposity but not bone loss. J Cell Physiol. (2006) 209:967–76. doi: 10.1002/jcp.20804
193. Naveiras O, Nardi V, Wenzel PL, Hauschka PV, Fahey F, Daley GQ. Bone-marrow adipocytes as negative regulators of the haematopoietic microenvironment. Nature. (2009) 460:259–63. doi: 10.1038/nature08099
194. Zhu RJ, Wu MQ, Li ZJ, Zhang Y, Liu KY. Hematopoietic recovery following chemotherapy is improved by BADGE-induced inhibition of adipogenesis. Int J Hematol. (2013) 97:58–72. doi: 10.1007/s12185-012-1233-4
195. Luo Y, Chen GL, Hannemann N, Ipseiz N, Kronke G, Bauerle T, et al. Microbiota from obese mice regulate hematopoietic stem cell differentiation by altering the bone niche. Cell Metab. (2015) 22:886–94. doi: 10.1016/j.cmet.2015.08.020
196. Sato K, Feng X, Chen J, Li J, Muranski P, Desierto MJ, et al. PPARgamma antagonist attenuates mouse immune-mediated bone marrow failure by inhibition of T cell function. Haematologica. (2016) 101:57–67. doi: 10.3324/haematol.2014.121632
197. Li J, Zhang N, Huang X, Xu J, Fernandes JC, Dai K, et al. Dexamethasone shifts bone marrow stromal cells from osteoblasts to adipocytes by C/EBPalpha promoter methylation. Cell Death Dis. (2013) 4:e832. doi: 10.1038/cddis.2013.348.
198. Calvo W, Fliedner TM, Herbst E, Hugl E, Bruch C. Regeneration of blood-forming organs after autologous leukocyte transfusion in lethally irradiated dogs. II Distribution and cellularity of the marrow in irradiated and transfused animals. Blood. (1976) 47:593–601. doi: 10.1182/blood.V47.4.593.593
199. Kalajzic Z, Li H, Wang L-P, Jiang X, Lamothe K, Adams DJ, et al. Use of an alpha-smooth muscle actin GFP reporter to identify an osteoprogenitor population. Bone. (2008) 43:501–10. doi: 10.1016/j.bone.2008.04.023
200. Mizoguchi T, Pinho S, Ahmed J, Kunisaki Y, Hanoun M, Mendelson A, et al. Osterix marks distinct waves of primitive and definitive stromal progenitors during bone marrow development. Dev Cell. (2014) 29:340–9. doi: 10.1016/j.devcel.2014.03.013
201. Zhou BO, Yue R, Murphy MM, Peyer JG, Morrison SJ. Leptin-receptor-expressing mesenchymal stromal cells represent the main source of bone formed by adult bone marrow. Cell Stem Cell. (2014) 15:154–68. doi: 10.1016/j.stem.2014.06.008
202. Horowitz MC, Berry R, Holtrup B, Sebo Z, Nelson T, Fretz JA, et al. Bone marrow adipocytes. Adipocyte. (2017) 6:193–204. doi: 10.1080/21623945.2017.1367881
203. Kretzschmar K, Watt FM. Lineage tracing. Cell. (2012) 148:33–45. doi: 10.1016/j.cell.2012.01.002
204. Sanchez-Gurmaches J, Hsiao WY, Guertin DA. Highly selective in vivo labeling of subcutaneous white adipocyte precursors with Prx1-Cre. Stem Cell Rep. (2015) 4:541–50. doi: 10.1016/j.stemcr.2015.02.008
205. Hammad S, Othman A, Meyer C, Telfah A, Lambert J, Dewidar B, et al. Confounding influence of tamoxifen in mouse models of Cre recombinase-induced gene activity or modulation. Arch Toxicol. (2018) 92:2549–61. doi: 10.1007/s00204-018-2254-4
206. Perry MJ, Gujra S, Whitworth T, Tobias JH. Tamoxifen stimulates cancellous bone formation in long bones of female mice. Endocrinology. (2005) 146:1060–5. doi: 10.1210/en.2004-1114
207. Ye R, Wang QA, Tao C, Vishvanath L, Shao M, McDonald JG, et al. Impact of tamoxifen on adipocyte lineage tracing: Inducer of adipogenesis and prolonged nuclear translocation of Cre recombinase. Mol Metab. (2015) 4:771–8. doi: 10.1016/j.molmet.2015.08.004
208. Soriano P. Generalized lacZ expression with the ROSA26 Cre reporter strain. Nat Genet. (1999) 21:70–1. doi: 10.1038/5007
209. Muzumdar MD, Tasic B, Miyamichi K, Li L, Luo L. A global double-fluorescent cre reporter mouse. Genesis. (2007) 605:593–605. doi: 10.1002/dvg.20335
210. Jeffery E, Berry R, Church CD, Yu S, Shook BA, Horsley V, et al. Characterization of Cre recombinase models for the study of adipose tissue. Adipocyte. (2014) 3:206–11. doi: 10.4161/adip.29674
211. Sanchez-Gurmaches J, Hung CM, Guertin DA. Emerging complexities in adipocyte origins and identity. Trends Cell Biol. (2016) 26:313–26. doi: 10.1016/j.tcb.2016.01.004
212. Keune JA, Wong CP, Branscum AJ, Iwaniec UT, Turner RT. Bone marrow adipose tissue deficiency increases disuse-induced bone loss in male mice. Sci Rep. (2017) 7:46325. doi: 10.1038/srep46325
213. Walji TA, Turecamo SE, Sanchez AC, Anthony BA, Abou-Ezzi G, Scheller EL, et al. Marrow adipose tissue expansion coincides with insulin resistance in MAGP1-deficient mice. Front Endocrinol (Lausanne). (2016) 7:87. doi: 10.3389/fendo.2016.00087
214. Belavy DL, Quittner MJ, Ridgers ND, Shiekh A, Rantalainen T, Trudel G. Specific modulation of vertebral marrow adipose tissue by physical activity. J Bone Miner Res. (2018) 33:651–7. doi: 10.1002/jbmr.3357
215. Mayo-Smith W, Rosenthal DI, Goodsitt MM, Klibanski A. Intravertebral fat measurement with quantitative CT in patients with Cushing disease and anorexia nervosa. Radiology. (1989) 170:835–8. doi: 10.1148/radiology.170.3.2916039
216. Bredella MA, Fazeli PK, Miller KK, Misra M, Torriani M, Thomas BJ, et al. Increased bone marrow fat in anorexia nervosa. J Clin Endocrinol Metab. (2009) 94:2129–36. doi: 10.1210/jc.2008-2532
217. Moore SG, Dawson KL. Red and yellow marrow in the femur: age-related changes in appearance at MR imaging. Radiology. (1990) 175:219–23. doi: 10.1148/radiology.175.1.2315484
218. Hamrick MW, Pennington C, Newton D, Xie D, Isales C. Leptin deficiency produces contrasting phenotypes in bones of the limb and spine. Bone. (2004) 34:376–83. doi: 10.1016/j.bone.2003.11.020
219. Yue R, Zhou BO, Shimada IS, Zhao Z, Morrison SJ. Leptin receptor promotes adipogenesis and reduces osteogenesis by regulating mesenchymal stromal cells in adult bone marrow. Cell Stem Cell. (2016) 18:782–96. doi: 10.1016/j.stem.2016.02.015
220. Takeshita S, Fumoto T, Naoe Y, Ikeda K. Age-related marrow adipogenesis is linked to increased expression of RANKL. J Biol Chem. (2014) 289:16699–710. doi: 10.1074/jbc.M114.547919
221. Justesen J, Stenderup K, Ebbesen EN, Mosekilde L, Steiniche T, Kassem M. Adipocyte tissue volume in bone marrow is increased with aging and in patients with osteoporosis. Biogerontology. (2001) 2:165–71. doi: 10.1023/A:1011513223894
222. Tuljapurkar SR, Mcguire TR, Brusnahan SK, Jackson JD, Garvin KL, Kessinger MA, et al. Changes in human bone marrow fat content associated with changes in hematopoietic stem cell numbers and cytokine levels with aging. J Anat. (2011) 219:574–81. doi: 10.1111/j.1469-7580.2011.01423.x
223. Bani Hassan E, Demontiero O, Vogrin S, Ng A, Duque G. Marrow adipose tissue in older men: association with visceral and subcutaneous fat, bone volume, metabolism, and inflammation. Calcif Tissue Int. (2018) 103:164–74. doi: 10.1007/s00223-018-0412-6
224. Martin RB, Zissimos SL. Relationships between marrow fat and bone turnover in ovariectomized and intact rats. Bone. (1991) 12:123–31. doi: 10.1016/8756-3282(91)90011-7
225. Baum T, Rohrmeier A, Syvari J, Diefenbach MN, Franz D, Dieckmeyer M, et al. Anatomical variation of age-related changes in vertebral bone marrow composition using chemical shift encoding-based water-fat magnetic resonance imaging. Front Endocrinol. (2018) 9:141. doi: 10.3389/fendo.2018.00141
226. Limonard EJ, Veldhuis-Vlug AG, Van Dussen L, Runge JH, Tanck MW, Endert E, et al. Short-term effect of estrogen on human bone marrow fat. J Bone Miner Res. (2015) 30:2058–66. doi: 10.1002/jbmr.2557
227. Maurice F, Dutour A, Vincentelli C, Abdesselam I, Bernard M, Dufour H, et al. Active cushing syndrome patients have increased ectopic fat deposition and bone marrow fat content compared to cured patients and healthy subjects: a pilot 1H-MRS study. Eur J Endocrinol. (2018) 179:307–17. doi: 10.1530/EJE-18-0318
228. Li H, Li H, Guo H, Liu F. Cholesterol suppresses adipocytic differentiation of mouse adipose-derived stromal cells via PPARgamma2 signaling. Steroids. (2013) 78:454–61. doi: 10.1016/j.steroids.2013.02.009
229. Yang Y, Luo X, Xie X, Yan F, Chen G, Zhao W, et al. Influences of teriparatide administration on marrow fat content in postmenopausal osteopenic women using MR spectroscopy. Climacteric. (2016) 19:285–91. doi: 10.3109/13697137.2015.1126576
230. Maridas DE, Rendina-Ruedy E, Helderman RC, Demambro VE, Brooks D, Guntur AR, et al. Progenitor recruitment and adipogenic lipolysis contribute to the anabolic actions of parathyroid hormone on the skeleton. FASEB J. (2019) 33:2885–98. doi: 10.1096/fj.201800948RR
231. Menagh PJ, Turner RT, Jump DB, Wong CP, Lowry MB, Yakar S, et al. Growth hormone regulates the balance between bone formation and bone marrow adiposity. J Bone Min Res. (2010) 25:757–68. doi: 10.1359/jbmr.091015
232. Bredella MA, Torriani M, Ghomi RH, Thomas BJ, Brick DJ, Gerweck AV, et al. Vertebral bone marrow fat is positively associated with visceral fat and inversely associated with IGF-1 in obese women. Obesity. (2011) 19:49–53. doi: 10.1038/oby.2010.106
233. Bredella MA, Gerweck AV, Barber LA, Breggia A, Rosen CJ, Torriani M, et al. Effects of growth hormone administration for 6 months on bone turnover and bone marrow fat in obese premenopausal women. Bone. (2014) 62:29–35. doi: 10.1016/j.bone.2014.01.022
234. Cawthorn WP, Scheller EL, Learman BS, Parlee SD, Simon BR, Mori H, et al. Bone marrow adipose tissue is an endocrine organ that contributes to increased circulating adiponectin during caloric restriction. Cell Metab. (2014) 20:368–75. doi: 10.1016/j.cmet.2014.06.003
235. Lazarenko OP, Rzonca SO, Suva LJ, Lecka-Czernik B. Netoglitazone is a PPAR-gamma ligand with selective effects on bone and fat. Bone. (2006) 38:74–84. doi: 10.1016/j.bone.2005.07.008
236. Lu W, Wang W, Wang S, Feng Y, Liu K. Rosiglitazone promotes bone marrow adipogenesis to impair myelopoiesis under stress. PLoS ONE. (2016) 11:e0149543. doi: 10.1371/journal.pone.0149543
237. Cock TA, Back J, Elefteriou F, Karsenty G, Kastner P, Chan S, et al. Enhanced bone formation in lipodystrophic PPARgamma(hyp/hyp) mice relocates haematopoiesis to the spleen. EMBO Rep. (2004) 5:1007–12. doi: 10.1038/sj.embor.7400254
238. Wilson A, Fu H, Schiffrin M, Winkler C, Koufany M, Jouzeau JY, et al. Lack of adipocytes alters hematopoiesis in lipodystrophic mice. Front Immunol. (2018) 9:2573. doi: 10.3389/fimmu.2018.02573
239. Mattiucci D, Naveiras O, Poloni A. Bone marrow “yellow” and “red” adipocytes: good or bad cells? Curr Mol Biol Rep. (2018) 4:117–22. doi: 10.1007/s40610-018-0098-6
240. Cuminetti V, Arranz L. Bone marrow adipocytes: the enigmatic components of the hematopoietic stem cell niche. J Clin Med. (2019) 8:707. doi: 10.3390/jcm8050707
241. Seimandi M, Lemaire G, Pillon A, Perrin A, Carlavan I, Voegel JJ, et al. Differential responses of PPARalpha, PPARdelta, and PPARgamma reporter cell lines to selective PPAR synthetic ligands. Analyt Biochem. (2005) 344:8–15. doi: 10.1016/j.ab.2005.06.010
242. Desdoits-Lethimonier C, Lesne L, Gaudriault P, Zalko D, Antignac JP, Deceuninck Y, et al. Parallel assessment of the effects of bisphenol A and several of its analogs on the adult human testis. Hum Reprod. (2017) 32:1465–73. doi: 10.1093/humrep/dex093
243. Van Leeuwen SP, Bovee TF, Awchi M, Klijnstra MD, Hamers AR, Hoogenboom RL, et al. BPA, BADGE and analogues: a new multi-analyte LC-ESI-MS/MS method for their determination and their in vitro (anti)estrogenic and (anti)androgenic properties. Chemosphere. (2019) 221:246–53. doi: 10.1016/j.chemosphere.2018.12.189
244. Bolan PJ, Arentsen L, Sueblinvong T, Zhang Y, Moeller S, Carter JS, et al. Water-fat MRI for assessing changes in bone marrow composition due to radiation and chemotherapy in gynecologic cancer patients. J Magn Reson Imaging. (2013) 38:1578–84. doi: 10.1002/jmri.24071
245. Geissler EN, Russell ES. Analysis of the hematopoietic effects of new dominant spotting (W) mutations of the mouse. I. Influence upon hematopoietic stem cells. Exp Hematol. (1983) 11:452–60.
246. Potter JE, Wright EG. Bone marrow lipids in normal and anemic mice. Am J Hematol. (1980) 8:361–7. doi: 10.1002/ajh.2830080404
247. Chen JR, Lazarenko OP, Wu X, Tong Y, Blackburn ML, Shankar K, et al. Obesity reduces bone density associated with activation of PPARgamma and suppression of Wnt/beta-catenin in rapidly growing male rats. PLoS ONE. (2010) 5:e13704. doi: 10.1371/journal.pone.0013704
248. Wang J, Chen GL, Cao S, Zhao MC, Liu YQ, Chen XX, et al. Adipogenic niches for melanoma cell colonization and growth in bone marrow. Lab Invest. (2017) 97:737–45. doi: 10.1038/labinvest.2017.14
249. Boyd AL, Reid JC, Salci KR, Aslostovar L, Benoit YD, Shapovalova Z, et al. Acute myeloid leukaemia disrupts endogenous myelo-erythropoiesis by compromising the adipocyte bone marrow niche. Nat Cell Biol. (2017) 19:1336–47. doi: 10.1038/ncb3625
250. Cahu X, Carre M, Recher C, Pigneux A, Hunault-Berger M, Vey N, et al. Impact of body-surface area on patients' outcome in younger adults with acute myeloid leukemia. Eur J Haematol. (2017) 98:443–9. doi: 10.1111/ejh.12850
251. Lu W, Weng W, Zhu Q, Zhai Y, Wan Y, Liu H, et al. Small bone marrow adipocytes predict poor prognosis in acute myeloid leukemia. Haematologica. (2018) 103:e21–4. doi: 10.3324/haematol.2017.173492
252. Huggins C, Blocksom BH. Changes in outlying bone marrow accompanying a local increase of temperature within physiological limits. J Exp Med. (1936) 64:253–74. doi: 10.1084/jem.64.2.253
253. Suchacki KJ, Cawthorn WP. Molecular interaction of bone marrow adipose tissue with energy metabolism. Curr Mol Biol Rep. (2018) 4:41–9. doi: 10.1007/s40610-018-0096-8
254. Cannon B, Nedergaard J. Nonshivering thermogenesis and its adequate measurement in metabolic studies. J Exp Biol. (2011) 214:242–53. doi: 10.1242/jeb.050989
255. Iwaniec UT, Philbrick KA, Wong CP, Gordon JL, Kahler-Quesada AM, Olson DA, et al. Room temperature housing results in premature cancellous bone loss in growing female mice: implications for the mouse as a preclinical model for age-related bone loss. Osteoporosis Int. (2016) 27:3091–101. doi: 10.1007/s00198-016-3634-3
Keywords: bone marrow adiposity, bone marrow adipose tissue, bone marrow fat, marrow, adipocyte, standards, methods, Bone Marrow Adiposity Society
Citation: Tratwal J, Labella R, Bravenboer N, Kerckhofs G, Douni E, Scheller EL, Badr S, Karampinos DC, Beck-Cormier S, Palmisano B, Poloni A, Moreno-Aliaga MJ, Fretz J, Rodeheffer MS, Boroumand P, Rosen CJ, Horowitz MC, van der Eerden BCJ, Veldhuis-Vlug AG and Naveiras O (2020) Reporting Guidelines, Review of Methodological Standards, and Challenges Toward Harmonization in Bone Marrow Adiposity Research. Report of the Methodologies Working Group of the International Bone Marrow Adiposity Society. Front. Endocrinol. 11:65. doi: 10.3389/fendo.2020.00065
Received: 30 August 2019; Accepted: 31 January 2020;
Published: 28 February 2020.
Edited by:
Basem M. Abdallah, University of Southern Denmark, DenmarkReviewed by:
Urszula T. Iwaniec, Oregon State University, United StatesGraziana Colaianni, University of Bari Aldo Moro, Italy
Copyright © 2020 Tratwal, Labella, Bravenboer, Kerckhofs, Douni, Scheller, Badr, Karampinos, Beck-Cormier, Palmisano, Poloni, Moreno-Aliaga, Fretz, Rodeheffer, Boroumand, Rosen, Horowitz, van der Eerden, Veldhuis-Vlug and Naveiras. This is an open-access article distributed under the terms of the Creative Commons Attribution License (CC BY). The use, distribution or reproduction in other forums is permitted, provided the original author(s) and the copyright owner(s) are credited and that the original publication in this journal is cited, in accordance with accepted academic practice. No use, distribution or reproduction is permitted which does not comply with these terms.
*Correspondence: Annegreet G. Veldhuis-Vlug, YW5uZWdyZWV0dmVsZGh1aXNAbGl2ZS5ubA==; Olaia Naveiras, b2xhaWEubmF2ZWlyYXNAZXBmbC5jaA==; b2xhaWEubmF2ZWlyYXNAY2h1di5jaA==
†These authors have contributed equally to this work