 Xiaomin Nie
 Xiaojing Ma2*
 Yuqian Bao
- 1Department of Endocrinology and Metabolism, Shanghai Key Laboratory of Diabetes Mellitus, Shanghai Clinical Center for Diabetes, Shanghai Jiao Tong University Affiliated Sixth People's Hospital, Shanghai, China
- 2Shanghai Diabetes Institute, Shanghai Key Laboratory of Diabetes Mellitus, Shanghai Clinical Center for Diabetes, Shanghai Jiao Tong University Affiliated Sixth People's Hospital, Shanghai, China
Aim: Metabolically healthy obese (MHO) individuals have attracted broad attention. We aimed to investigate the characteristics of serum thyroid hormones in different metabolic phenotypes of obesity.
Methods: The study included 1,023 community-based euthyroid subjects (age range: 27–81 years), of whom 586 were women. Fat% was detected by a bioelectrical impedance analyzer. Two definitions of obesity were applied as follows: (1) fat% ≥ 25% for men and ≥ 30% for women; (2) body mass index (BMI) ≥ 25 kg/m2. According to the diagnostic criteria for metabolic syndrome by the Chinese Diabetes Society, metabolically unhealthy was defined as two or more components of metabolic syndrome, excluding waist circumference. Serum-free triiodothyronine (FT3), free thyroxine (FT4), and thyroid-stimulating hormone (TSH) levels were measured by electrochemiluminescence immunoassay.
Results: The proportions of obesity defined by fat% and BMI were 41.3 and 27.1%, respectively. The proportion of metabolically unhealthy was 41.6%. After adjusting for age and gender, regardless of the definitions based on fat% or BMI, FT3 was positively related to both the MHO and the metabolically unhealthy obese (MUO) phenotypes [MHO: odds ratio (OR)s = 1.676 based on fat% and 2.055 based on BMI; MUO: ORs = 1.818 based on fat% and 1.526 based on BMI; all P < 0.05]; FT4 was negatively related to the MUO phenotype (ORs = 0.870 based on fat% and 0.849 based on BMI, all P < 0.05); FT3/FT4 was also positively related to both the MHO and the MUO phenotypes (MHO: ORs = 1.678 based on fat% and 2.825 based on BMI; MUO: ORs = 2.866 based on fat% and 2.883 based on BMI; all P < 0.05); and TSH was positively related to the metabolically unhealthy non-obese phenotype (ORs = 1.329 based on fat% and 1.321 based on BMI, all P < 0.01).
Conclusions: In euthyroid population, both the MHO and the MUO phenotypes were characterized by increased FT3 and FT3/FT4 levels.
Introduction
Obesity is a common health problem faced by developing countries (1). Common complications of obesity include insulin resistance, dyslipidemia, hypertension, and systemic inflammation, which may finally cause type 2 diabetes, cardiovascular disease, and cancer (2–4). In recent decades, obese individuals with normal metabolic status and low risk in cardiovascular metabolic disease have gained wide attention (5). Whether the metabolically healthy obese (MHO) individuals need weight loss intervention is still unclear, and whether they can maintain stable health is also controversial (6). Clarifying these problems is essential for the targeted treatment of obesity, and may help save healthcare resources.
Thyroid hormones are closely related to both obesity and metabolic disorders (7–9). Free triiodothyronine (FT3) and thyroid-stimulating hormone (TSH) were found to be increased in morbid obesity (7). A Mendelian randomization study indicated that obesity had a causal role in increasing FT3 levels (10). The altered expression of type 1 iodothyronine deiodinase, thyroid hormone receptor, and TSH receptor in adipose tissue may partly explain the variations of thyroid hormones in obesity (11–13). Even within the euthyroid range, the change of thyroid hormones was associated with multiple metabolic risks. A prospective study found that decreased free thyroxine (FT4) within the subclinical and euthyroid range contributed to an increased risk of metabolic syndrome (MS) (8). Another cohort study found that euthyroid subjects with suspected non-alcoholic fatty liver disease had higher free triiodothyronine (FT3), lower FT4, and higher FT3/FT4 ratio (9). Higher FT3/FT4 ratio and TSH were also considered to have predictive power for MS (14). Therefore, investigating thyroid hormones in MHO individuals can help to understand and explain the potential metabolic risk of the MHO phenotype.
Although some previous studies have explored the relationships between thyroid hormones and different metabolic phenotypes of obesity, the results are quite inconsistent (15, 16). Moreover, FT3 as the bioactive form of thyroid hormones has not been analyzed in the previous studies. In the present study, we aimed to explore the relationships between thyroid hormones (FT3, FT4, and TSH) and different metabolic phenotypes of obesity in a euthyroid population.
Subjects and Methods
Subjects
Subjects were recruited from Shanghai communities from October 2015 to July 2016. The recruitment details are described in a previous study (17). All subjects received a complete questionnaire survey, physical examination, laboratory examination, and body composition examination. The exclusion criteria included a history of diabetes or cardiovascular diseases, abnormal thyroid function, hormone replacement treatment such as thyroid hormones or sex hormones, anti-thyroid treatment, severe hepatic or renal dysfunction, use of weight loss drugs, hypotensive drugs, lipid-regulating drugs, glucocorticoid or amiodaron, moderate to severe anemia, cancer, and acute infection. The study was approved by the Ethics Committee of the Shanghai Jiao Tong University Affiliated Sixth People's Hospital. All participants provided informed consent.
Body Measurement and Laboratory Examination
Height, body weight, and blood pressure were measured according to standard methods described in a previous study. Body mass index (BMI) = body weight (kg)/height2 (m2). A bioelectrical impedance analyzer (TBF-418B; Tanita Corp., Tokyo, Japan) was used to detect fat%, and the details of the method are described in a previous study (17).
All subjects received a 75-g oral glucose tolerance test in the morning after an overnight fast of 10 h. Fasting plasma glucose (FPG), 2-h plasma glucose (2hPG), total cholesterol (TC), triglyceride (TG), high-density lipoprotein-cholesterol (HDL-c), low-density lipoprotein-cholesterol (LDL-c), and fasting insulin (FINS) levels were detected by methods described in the previous study (17). Homeostasis model assessment of insulin resistance (HOMA-IR) was used to evaluate the level of insulin resistance. HOMA-IR = FINS (mU/L) × FPG (mmol/L)/22.5 (18). FT3, FT4, and TSH levels were measured by electrochemiluminescence immunoassays (Roche Diagnostics GmbH, Mannheim, Germany) on a Cobas e601 analyzer, and the details of the method are described in a previous study (19).
Definitions
According to the 1998 criteria of the World Health Organization, two definitions of obesity were applied, one was fat% ≥ 25% for men and ≥30% for women, and the other was BMI ≥ 25 kg/m2. According to the diagnostic criteria for MS of the Chinese Diabetes Society (CDS) (20), metabolically unhealthy was defined as having two or more of the following components of MS: (1) FPG ≥ 6.1 mmol/L or 2hPG ≥ 7.8 mmol/L; (2) systolic blood pressure (SBP) ≥ 130 mmHg or diastolic blood pressure (DBP) ≥ 85 mmHg; (3) TG ≥ 1.7 mmol/L; (4) HDL-c < 1.0 mmol/L. Waist circumference was excluded from the definitions of metabolic unhealthy due to its high multicollinearity with fat% and BMI.
According to the obesity and metabolic unhealthy status, subjects were classified into the following four different obesity metabolic phenotypes: (1) metabolically healthy and non-obese (MHNO); (2) metabolically unhealthy and non-obese (MUNO); (3) MHO; (4) metabolically unhealthy obese (MUO).
Statistical Analysis
All statistical analyses were performed using Stata version 15.1 statistical software (StataCorp LLC, Texas, USA). The skewness/kurtosis test was used to evaluate the normal distribution of variables. All continuous variables had a skewed distribution and were expressed as medians (interquartile ranges). Categorical variables were expressed as frequencies (proportions). The Kruskal–Wallis one-way analysis of variance was used for group comparisons of skewed continuous variables. For categorical variables, the chi-square test was used for group comparisons. Multiple logistic regression analysis and marginal effects analysis were used to explore the relationships between thyroid hormones and obesity metabolic phenotypes. A two-tailed P < 0.05 was considered statistically significant.
Results
Clinical Characteristics of Subjects
A total of 1,023 participants were included in the final analysis, of which 586 were women. The average age was 59 ± 8 years (age range: 27–81 years). The medians (interquartile ranges) of FT3, FT4, and TSH levels were 4.93 (4.59–5.30) pmol/L, 16.51 (15.30–17.69) pmol/L, and 2.16 (1.55–2.87) mIU/L, respectively. The proportions of obese individuals based on fat% and BMI were 41.3 and 27.1%, respectively (Figure 1). Compared with the definitions based on fat%, the proportions of the MHNO and the MUNO phenotypes were higher while the proportions of the MHO and the MUO phenotypes were lower when using the definitions based on BMI (all P < 0.01).
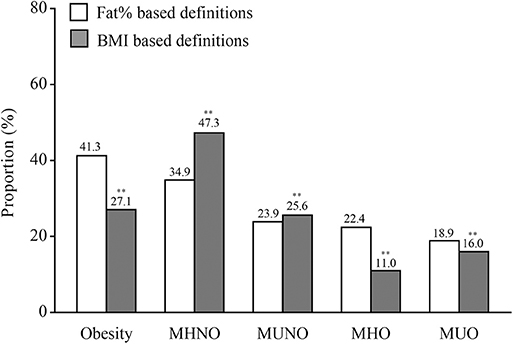
Figure 1. The proportions of obesity and different metabolic phenotypes of obesity. In the graph, the column indicated to proportions. For the white columns, obesity was defined as fat% ≥ 25% for men and ≥30% for women. For the gray columns, obesity was defined as BMI ≥ 25 kg/m2. **P < 0.01 compared with the corresponding definition based on fat%.
Clinical Characteristics According to Different Obesity Metabolic Phenotypes
Regardless of using the definitions based on fat% or BMI (Table 1), compared with the MHNO subjects, both the MUNO and the MUO individuals had significantly higher BMI, SBP, DBP, FPG, 2hPG, HOMA-IR, TG, and LDL-c and lower HDL-c (all P < 0.05), while the MUO individuals also had significantly higher fat% (all P < 0.01); the MHO individuals only had significantly higher BMI, fat%, and HOMA-IR (all P < 0.01).
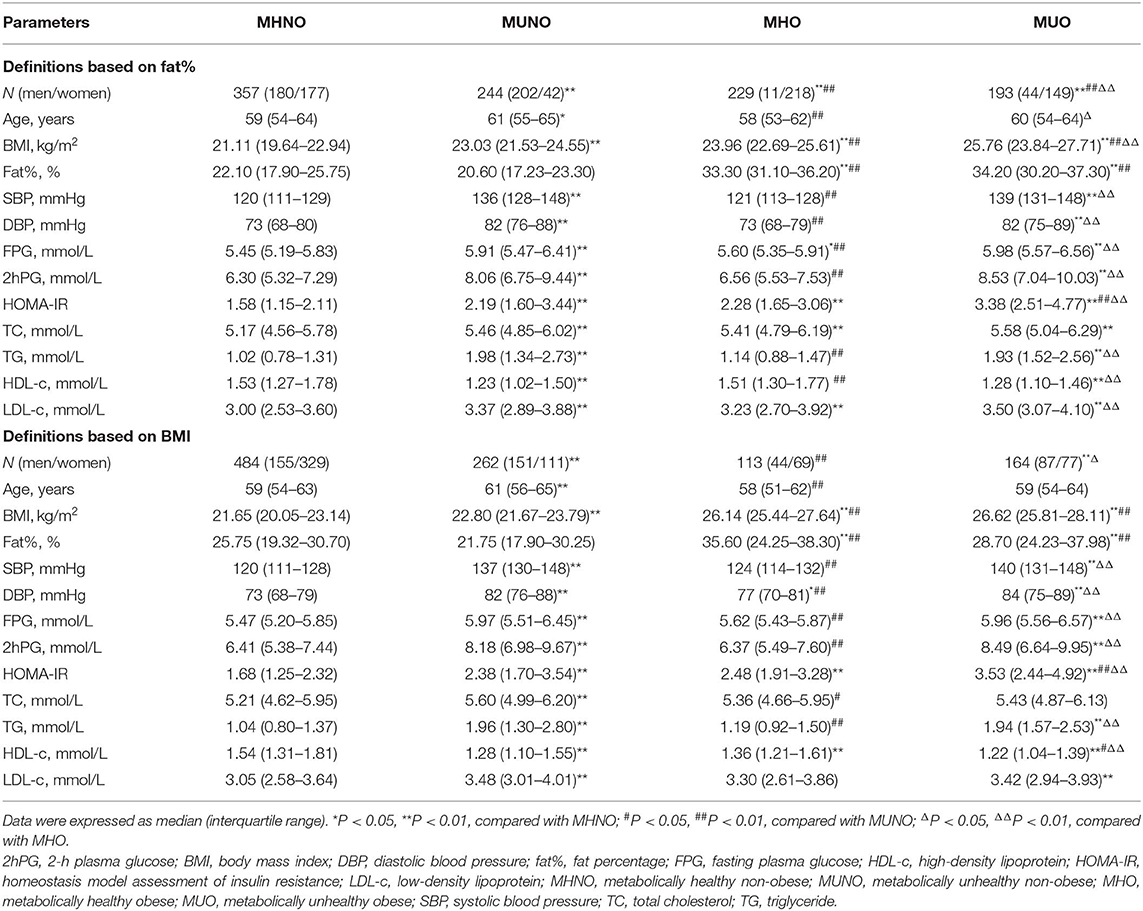
Table 1. Clinical characteristics according to different metabolic phenotypes of obesity.
Covariance analysis was further used to explore thyroid hormones levels in different obesity metabolic phenotypes after adjusting for age and gender (Figure 2). Regardless of using the definitions based on fat% or BMI, compared with the MHNO subjects, both the MHO and the MUO subjects had significantly higher FT3 and FT3/FT4 (all P < 0.05); the MUO subjects also had significantly lower FT4 (all P < 0.05); and the MUNO subjects had significantly higher TSH (all P < 0.01).
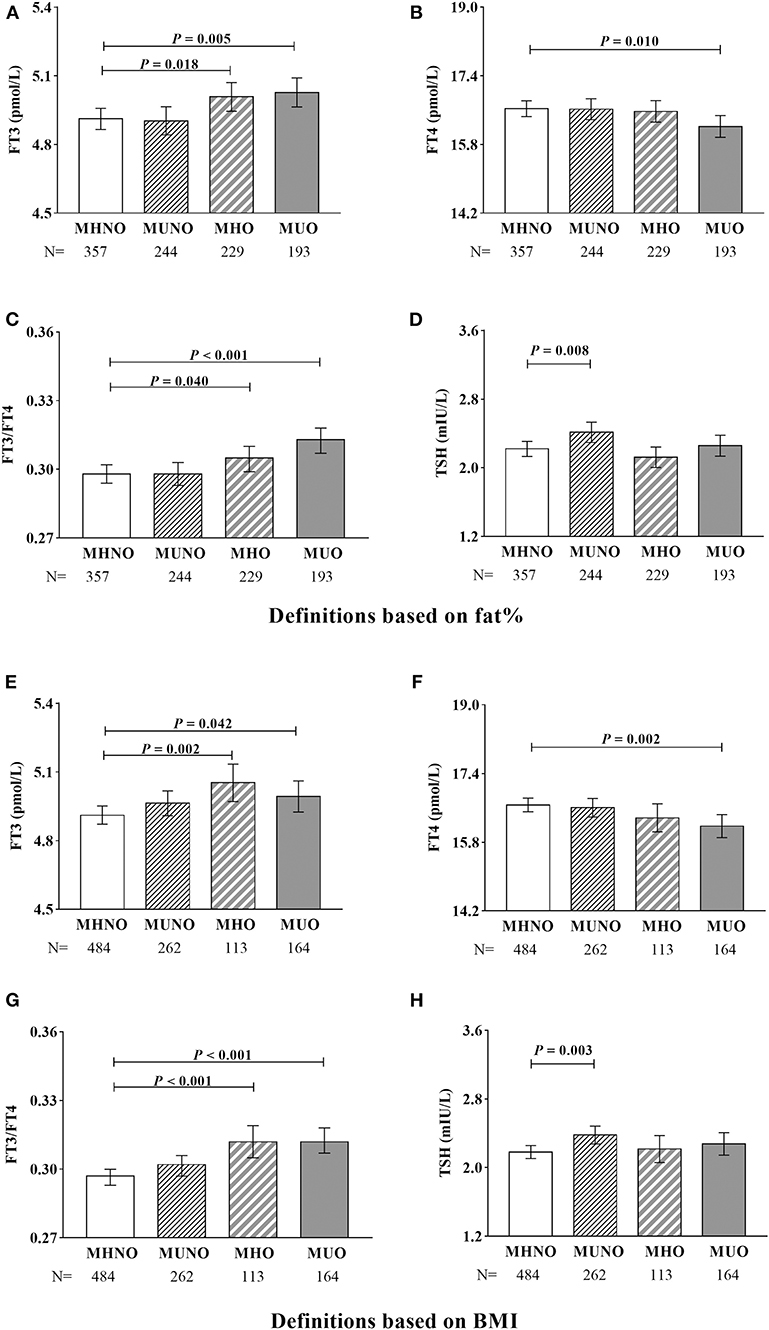
Figure 2. Covariance analysis of thyroid hormones in different metabolic phenotypes of obesity. (A–D) Definitions based on fat%. (E–H) Definitions based on BMI. Age and gender were adjusted. In the graph, the column indicated to adjusted mean, the bars indicated to 95% confidence interval.
Logistic Regression Analysis of Different Obesity Metabolic Phenotypes
We further used a multiple logistics regression analysis to explore the relationships between thyroid hormones and different metabolic phenotypes of obesity (Table 2). In the logistic regression analysis, age and gender were adjusted, and the MHNO subjects were set to be the reference group.
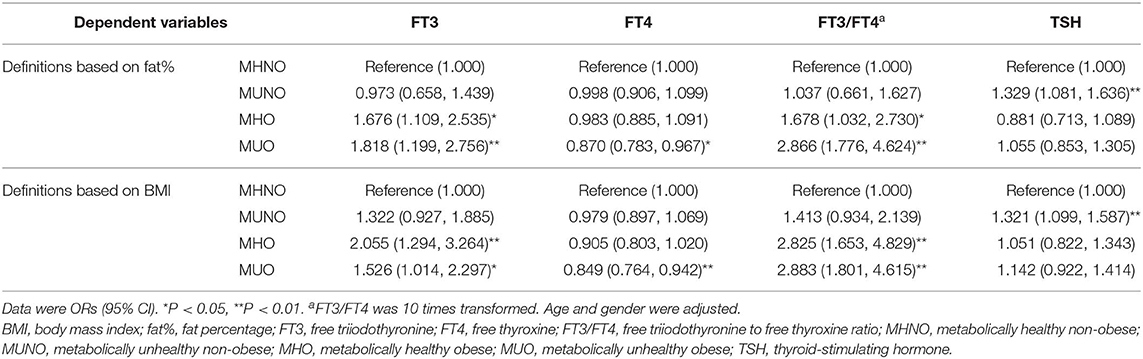
Table 2. Multivariate logistics regression analysis.
Regardless of using the definitions based on fat% or BMI, FT3 was significantly and positively related to both the MHO and the MUO phenotypes (all P < 0.05). FT4 was significantly and negatively related to the MUO phenotype (all P < 0.05). FT3/FT4 was also significantly and positively related to both the MHO and the MUO phenotypes (all P < 0.05). TSH was significantly and positively related to the MUNO phenotype (all P < 0.01).
According to the marginal effect analysis (Figure 3), regardless of using the definitions based on fat% or BMI, the probabilities of the MHO and the MUO phenotypes were significantly increased with increased FT3 and FT3/FT4 levels (all P < 0.05), the probabilities of the MUO phenotype were significantly decreased with increased FT4 levels (all P < 0.05), while the probability of the MUNO phenotype was significantly increased with increased TSH levels (all P < 0.01).
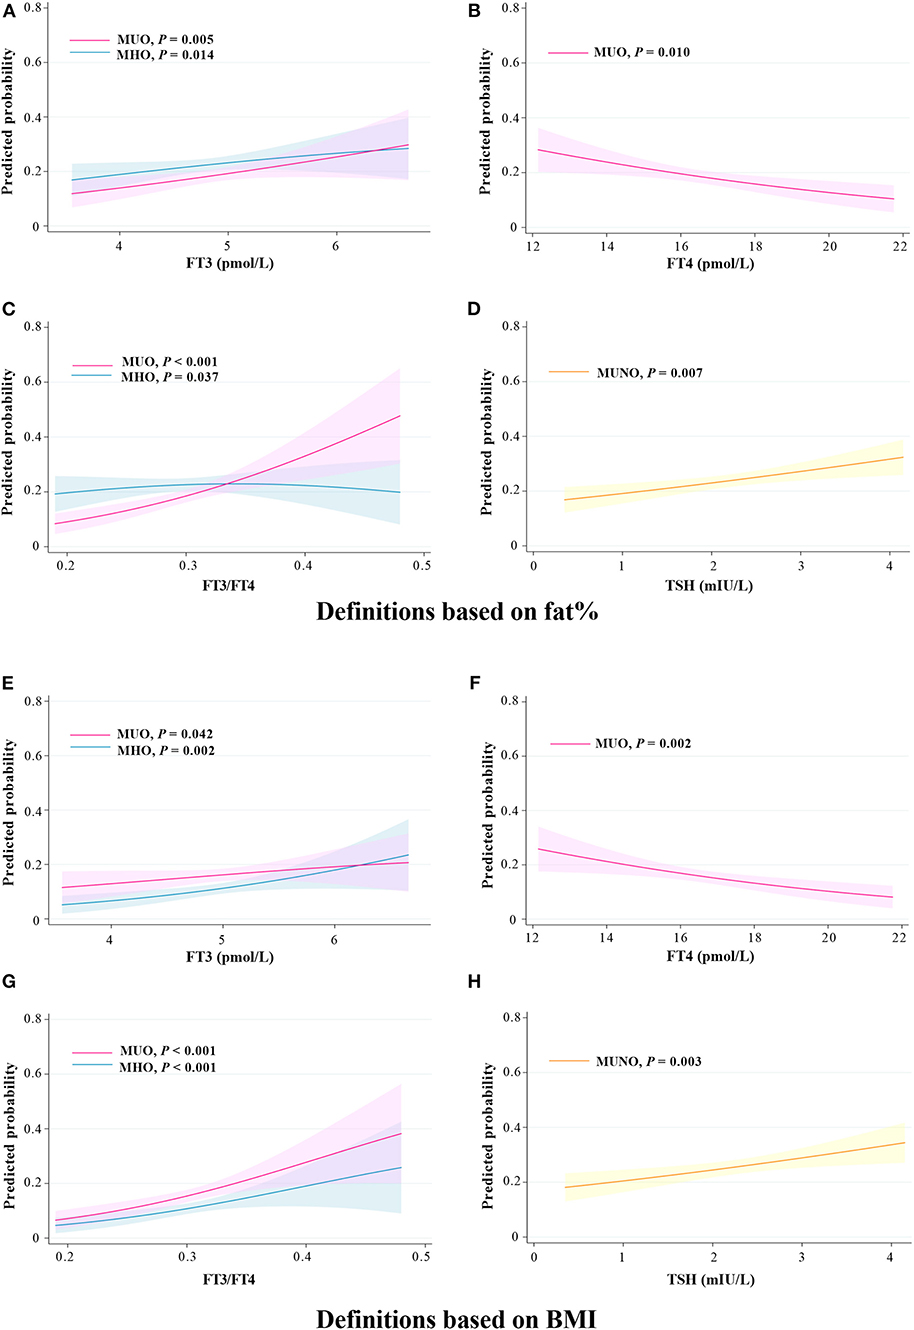
Figure 3. Predicted probability of different metabolic phenotypes of obesity in relation to thyroid hormones. (A–D) Definitions based on fat%. (E–H) Definitions based on BMI. Predicted probabilities and 95% confidence intervals for the marginal effect of different metabolic phenotypes of obesity.
Subgroup Analysis on the Gender Difference
Gender difference was further analyzed in the relationships between thyroid hormones and the obesity metabolic phenotypes (Table 3). Age was adjusted in the logistic regression analysis.
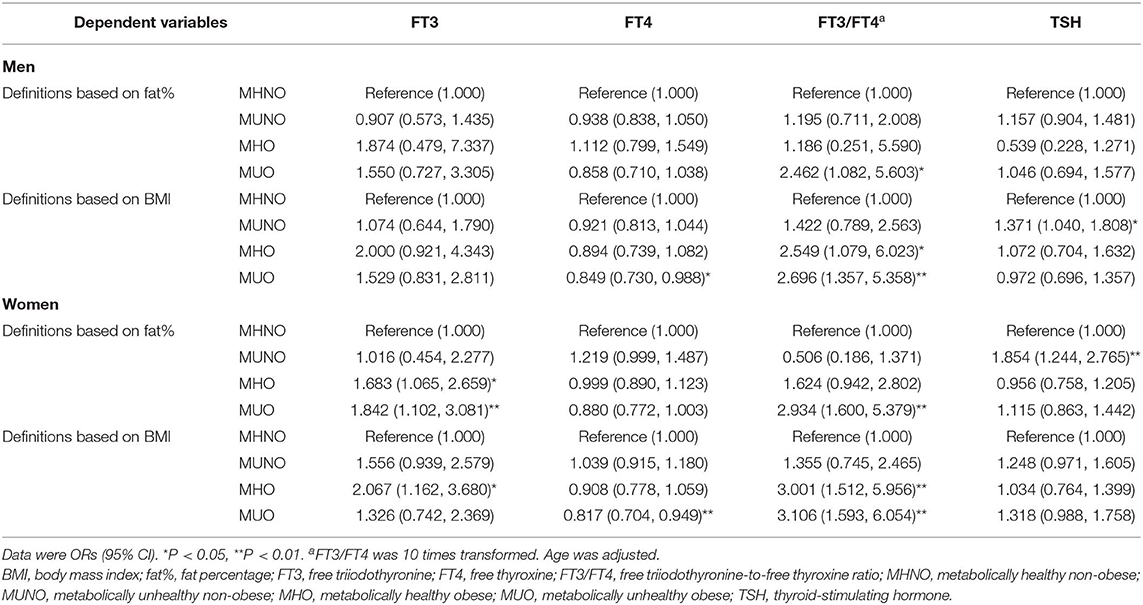
Table 3. Subgroup analysis on the gender difference.
When using the definitions based on fat%, FT3 was positively related to both the MHO and the MUO phenotype in women (all P < 0.05), but was related to none of the obesity metabolic phenotypes in men (all P > 0.05). In both genders, FT4 was related to none of the obesity metabolic phenotypes, while FT3/FT4 was positively related to the MUO phenotype (all P < 0.05). Only in women was TSH positively related to the MUNO phenotype (P < 0.01).
When using the definitions based on BMI, FT3 was only positively related to the MHO phenotype in women (P < 0.05). In both genders, FT4 was negatively related to the MUO phenotype and FT3/FT4 was positively related to the MHO and the MUO phenotypes (all P < 0.05). TSH was only positively related to the MUNO phenotype in men (P < 0.05).
Discussion
In this study of a community-based euthyroid population, fat% measured by bioelectrical impedance analysis and BMI were used to diagnose obesity. We found that thyroid hormones were related to different metabolic phenotypes of obesity. FT3 and FT3/FT4 were all positively related to the MHO and the MUO phenotypes, FT4 was negatively related to the MUO phenotype, while TSH was positively related to the MUNO phenotype.
The major physiological functions of thyroid hormones include promoting thermogenesis and regulating energy expenditure (21). Hyperthyroidism with excess thyroid hormones is often along with weight loss, increased steatolysis and energy expenditure. The prevalence of thyroid dysfunction is not high in the general population (22); however, thyroid hormones within the euthyroid range are also found to be frequently involved in metabolic diseases. It is commonly noticed in the clinical practice that obese individuals often have higher TSH and FT3 levels (7, 23). Higher levels of FT3, FT3/FT4, and TSH were associated with increased risks of non-alcoholic fatty liver disease and MS (9, 14), while lower FT4 may contribute to an increased risk of MS (8). Whether the MHO individuals have altered thyroid hormones remains unclear.
Some previous studies have explored the relationships between thyroid hormones and obesity metabolic phenotypes. Amouzegar et al. conducted a 9-year follow-up study. They defined obesity as BMI ≥ 25 kg/m2 and metabolically unhealthy as three or more components of MS according to the Joint Interim Statement criteria (waist circumference was included). They found that FT4 was positively related to MHNO development and negatively related to MHO development, while TSH was positively related to MUNO development (15). In another 6-year follow-up study, Jun et al. recruited 992 euthyroid MHO individuals. They used the same criteria of obesity and metabolically unhealthy as those used in Amouzegar's study. They found that the baseline total triiodothyronine level was positively related to the risk of MS (24). In the Korean National Nutrition and Health Survey, Kim et al. also defined obesity as BMI ≥ 25 kg/m2. Metabolically unhealthy was defined as two or more components of MS according to the NCEP ATP III criteria (waist circumference was excluded). They found that TSH was negatively associated with MHNO status, while FT4 was positively associated with MHNO status (16).
We found large discrepancies in the proportions of obesity defined either by fat% or BMI. However, regardless of definitions based on fat% or BMI, FT3, and FT3/FT4 were all positively related to the MHO and the MUO phenotypes, among which FT4 was negatively related to the MUO phenotype, while TSH was positively related to the MUNO phenotype. Our findings in FT4 and TSH were consistent with the previous studies, suggesting that higher FT4 was related to metabolic benefits while higher TSH was related to metabolic risks. In addition, we firstly found that both the MHO and the MUO phenotypes were characterized by increased FT3 and FT3/FT4.
Gender difference was found in the relationships between thyroid hormones and the obesity metabolic phenotypes. According to the fat%-based definitions, FT3 was positively related to the MHO and the MUO phenotype in women, but not in men. Gender difference in body fat content might contribute to this discrepancy, as women tended to have higher fat% than men even with the same BMI (25). In women, FT3 was positively related to the fat%-based MUO phenotype but was not related to the BMI-based MUO phenotype. In fact, when using the BMI-based definitions, some MUO subjects moved to the MUNO group due to normal BMI despite high fat%, which might result in the non-significant result. The inconsistent results between the gender-stratified groups and the entire cohort might also be explained by the relatively small sample size in each group after gender stratifying.
The thyroid follicles secrete thyroxine and a small amount of triiodothyronine. In the peripheral tissues, thyroxine is transformed into triiodothyronine as the bioactive form by the catalysis of type 1 iodothyronine deiodinase. Triiodothyronine exerts physiological effects by binding to thyroid hormone receptor (21). The expression of type 1 iodothyronine deiodinase was enhanced in white adipose tissue of obese subjects, while the expressions of the thyroid hormone receptor TRα1 and TSH receptor were decreased (11, 12). After weight loss, the expressions of TRα1 and TSH receptor were increased, while serum FT3 and TSH levels were decreased (12). The above basic researches well explained our finding that FT3 and FT3/FT4 were positively related to obesity phenotypes independently of metabolic healthy or not. In our study, FT3/FT4 had stronger positive relationship with the MUO phenotype than the MHO phenotype, which might partly explain that FT4 was only negatively related to the MUO phenotype but not the MHO phenotype. Considering TSH was only positively associated with the MUNO phenotype, we speculated that the altered TSH levels might mainly be contributed by metabolic dysregulation, but not higher fat% or BMI. Further basic researches are needed to clarify the potential mechanisms.
Considering that higher FT3 and FT3/FT4 were related to multiple metabolic risks, our findings also indicated that the MHO phenotype may not be a benign status from an endocrine perspective. In recent years, emerging evidence has suggested that the MHO phenotype may not be a stable status. Perspective studies found that approximately half of the MHO individuals transitioned to metabolically unhealthy in the 10- or 12-year follow-up. These unstable MHO individuals also had a significantly increased risk of cardiovascular diseases (26, 27). In general, weight loss is still recommended for the MHO individuals, as obesity itself rather than metabolic status can directly affect the metabolism of thyroid hormones and then contribute to metabolic and cardiovascular risks.
Our study has some limitations. First, the causality between thyroid hormones and obesity metabolic phenotypes could not be established through a cross-sectional study. Second, the levels of thyroid antibodies and urinary iodine were not detected in our study; thus, we could not exclude potential bias from thyroid autoimmunity diseases and iodine intake. Third, the nutritional status has not been assessed in detail in this study, which might cause potential bias.
Conclusions
In euthyroid population, both the MHO and the MUO phenotypes were characterized by increased FT3 and FT3/FT4 levels.
Data Availability Statement
The datasets generated for this study will not be made publicly available because the ethical approval obtained for this study prevents the human data being shared publicly to protect patients' privacy. Requests to access the datasets should be directed to YB (eXFiYW9Ac2p0dS5lZHUuY24=). This would be passed to the ethics committee who will decide whether they can access the data directly.
Ethics Statement
The studies involving human participants were reviewed and approved by Ethics Committee of the Shanghai Jiao Tong University Affiliated Sixth People's Hospital. The patients/participants provided their written informed consent to participate in this study.
Author Contributions
XM and YB designed the study. XN, YX, YS, and YW collected samples and clinical data. XN wrote the manuscript. XN, XM, and YB reviewed and edited the manuscript. All authors revised the manuscript and approved the final manuscript.
Funding
This work was funded by the National Key R&D Program of China (2016YFA0502003). The funding agency had no role in the design of the study; in the collection, analyses, or interpretation of data; in the writing of the manuscript; or in the decision to publish the results.
Conflict of Interest
The authors declare that the research was conducted in the absence of any commercial or financial relationships that could be construed as a potential conflict of interest.
References
1. Bray GA, Heisel WE, Afshin A, Jensen MD, Dietz WH, Long M, et al. The Science of obesity management: an endocrine society scientific statement. Endocr Rev. (2018) 39:79–132. doi: 10.1210/er.2017-00253
2. Khandekar MJ, Cohen P, Spiegelman BM. Molecular mechanisms of cancer development in obesity. Nat Rev Cancer. (2011) 11:886–95. doi: 10.1038/nrc3174
3. Kahn SE, Hull RL, Utzschneider KM. Mechanisms linking obesity to insulin resistance and type 2 diabetes. Nature. (2006) 444:840–46. doi: 10.1038/nature05482
4. van Gaal LF, Mertens IL, de Block CE. Mechanisms linking obesity with cardiovascular disease. Nature. (2006) 444:875–80. doi: 10.1038/nature05487
5. Bluher M. The distinction of metabolically 'healthy' from 'unhealthy' obese individuals. Curr Opin Lipidol. (2010) 21:38–43. doi: 10.1097/MOL.0b013e3283346ccc
6. Magkos F. Metabolically healthy obesity: what's in a name? Am J Clin Nutr. (2019) 110:533–9. doi: 10.1093/ajcn/nqz133
7. Michalaki MA, Vagenakis AG, Leonardou AS, Argentou MN, Habeos IG, Makri MG, et al. Thyroid function in humans with morbid obesity. Thyroid. (2006) 16:73–8. doi: 10.1089/thy.2006.16.73
8. Mehran L, Amouzegar A, Bakhtiyari M, Mansournia MA, Rahimabad PK, Tohidi M, et al. Variations in serum free thyroxine concentration within the reference range predicts the incidence of metabolic syndrome in non-obese adults: a cohort study. Thyroid. (2017) 27:886–93. doi: 10.1089/thy.2016.0557
9. van den Berg EH, van Tienhoven-Wind LJ, Amini M, Schreuder TC, Faber KN, Blokzijl H, et al. Higher free triiodothyronine is associated with non-alcoholic fatty liver disease in euthyroid subjects: the Lifelines Cohort Study. Metabolism. (2017) 67:62–71. doi: 10.1016/j.metabol.2016.11.002
10. Taylor PN, Richmond R, Davies N, Sayers A, Stevenson K, Woltersdorf W, et al. Paradoxical relationship between body mass index and thyroid hormone levels: a study using mendelian randomization. J Clin Endocrinol Metab. (2016) 101:730–8. doi: 10.1210/jc.2015-3505
11. Ortega FJ, Jilkova ZM, Moreno-Navarrete JM, Pavelka S, Rodriguez-Hermosa JI, Kopeck Ygrave J, et al. Type I iodothyronine 5'-deiodinase mRNA and activity is increased in adipose tissue of obese subjects. Int J Obes. (2012) 36:320–4. doi: 10.1038/ijo.2011.101
12. Nannipieri M, Cecchetti F, Anselmino M, Camastra S, Niccolini P, Lamacchia M, et al. Expression of thyrotropin and thyroid hormone receptors in adipose tissue of patients with morbid obesity and/or type 2 diabetes: effects of weight loss. Int J Obes. (2009) 33:1001–6. doi: 10.1038/ijo.2009.140
13. de Lloyd A, Bursell J, Gregory JW, Rees DA, Ludgate M. TSH receptor activation and body composition. J Endocrinol. (2010) 204:13–20. doi: 10.1677/joe-09-0262
14. Park SY, Park SE, Jung SW, Jin HS, Park IB, Ahn SV, et al. Free triiodothyronine/free thyroxine ratio rather than thyrotropin is more associated with metabolic parameters in healthy euthyroid adult subjects. Clin Endocrinol. (2017) 87:87–96. doi: 10.1111/cen.13345
15. Amouzegar A, Kazemian E, Abdi H, Mansournia MA, Bakhtiyari M, Hosseini MS, et al. Association between thyroid function and development of different obesity phenotypes in euthyroid adults: a nine-year follow-up. Thyroid. (2018) 28:458–64. doi: 10.1089/thy.2017.0454
16. Kim JM, Kim BH, Lee H, Kim EH, Kim M, Kim JH, et al. The relationship between thyroid function and different obesity phenotypes in korean euthyroid adults. Diabetes Metab J. (2019) 43:867–78. doi: 10.4093/dmj.2018.0130
17. Xu Y, Ma X, Shen Y, Gu C, Tang J, Bao Y. Role of hyperglycaemia in the relationship between serum osteocalcin levels and relative skeletal muscle index. Clin Nutr. (2019) 38:2704–11. doi: 10.1016/j.clnu.2018.11.025
18. Matthews DR, Hosker JP, Rudenski AS, Naylor BA, Treacher DF, Turner RC. Homeostasis model assessment: insulin resistance and beta-cell function from fasting plasma glucose and insulin concentrations in man. Diabetologia. (1985) 28:412–9. doi: 10.1007/bf00280883
19. Nie X, Xu Y, Ma X, Shen Y, Wang Y, Bao Y. Trunk fat and leg fat in relation to free triiodothyronine in euthyroid postmenopausal women. Endocr Connect. (2019) 8:1425–32. doi: 10.1530/ec-19-0394
20. Society CD. China T2DM prevention and treatment guideline (2017). Chin J Diabete Mellitus. (2018) 10:4–67. doi: 10.3760/cma.j.issn.1674-5809.2018.01.003
21. Mullur R, Liu YY, Brent GA. Thyroid hormone regulation of metabolism. Physiol Rev. (2014) 94:355–82. doi: 10.1152/physrev.00030.2013
22. Shan Z, Chen L, Lian X, Liu C, Shi B, Shi L, et al. iodine status and prevalence of thyroid disorders after introduction of mandatory universal salt iodization for 16 years in China: a cross-sectional study in 10 cities. Thyroid. (2016) 26:1125–30. doi: 10.1089/thy.2015.0613
23. Valdes S, Maldonado-Araque C, Lago-Sampedro A, Lillo-Munoz JA, Garcia-Fuentes E, Perez-Valero V, et al. Reference values for TSH may be inadequate to define hypothyroidism in persons with morbid obesity:RGlAYmV0LmVzstudy. Obesity. (2017) 25:788–93. doi: 10.1002/oby.21796
24. Jun JE, Kim TH. Hormetic effect of triiodothyronine in metabolically healthy obese persons. Endocrine. (2017) 57:418–27. doi: 10.1007/s12020-017-1363-9
25. Hung SP, Chen CY, Guo FR, Chang CI, Jan CF. Combine body mass index and body fat percentage measures to improve the accuracy of obesity screening in young adults. Obes Res Clin Pract. (2017) 11:11–8. doi: 10.1016/j.orcp.2016.02.005
26. Kouvari M, Panagiotakos DB, Yannakoulia M, Georgousopoulou E, Critselis E, Chrysohoou C, et al. Transition from metabolically benign to metabolically unhealthy obesity and 10-year cardiovascular disease incidence: the ATTICA cohort study. Metabolism. (2019) 93:18–24. doi: 10.1016/j.metabol.2019.01.003
Keywords: free triiodothyronine, free thyroxine, metabolically healthy obese, metabolically unhealthy obese, fat percentage
Citation: Nie X, Ma X, Xu Y, Shen Y, Wang Y and Bao Y (2020) Characteristics of Serum Thyroid Hormones in Different Metabolic Phenotypes of Obesity. Front. Endocrinol. 11:68. doi: 10.3389/fendo.2020.00068
Received: 10 November 2019; Accepted: 03 February 2020;
Published: 28 February 2020.
Edited by:
Deanne Helena Hryciw, Griffith University, AustraliaReviewed by:
Ben Perry, Western Sydney University, AustraliaThemistoklis Tzotzas, St. Luke's Hospital, Greece
Copyright © 2020 Nie, Ma, Xu, Shen, Wang and Bao. This is an open-access article distributed under the terms of the Creative Commons Attribution License (CC BY). The use, distribution or reproduction in other forums is permitted, provided the original author(s) and the copyright owner(s) are credited and that the original publication in this journal is cited, in accordance with accepted academic practice. No use, distribution or reproduction is permitted which does not comply with these terms.
*Correspondence: Xiaojing Ma, bWF4aWFvamluZ0BzanR1LmVkdS5jbg==; Yuqian Bao, eXFiYW9Ac2p0dS5lZHUuY24=