 Michael Dieckmeyer1*
 Daniela Junker2
 Stefan Ruschke2
 Muthu Rama Krishnan Mookiah3
 Karupppasamy Subburaj3
 Egon Burian1
 Nico Sollmann1,4
 Jan S. Kirschke1,4
 Dimitrios C. Karampinos2
 Thomas Baum1
- 1Department of Diagnostic and Interventional Neuroradiology, School of Medicine, Klinikum rechts der Isar, Technical University of Munich, Munich, Germany
- 2Department of Diagnostic and Interventional Radiology, School of Medicine, Klinikum rechts der Isar, Technical University of Munich, Munich, Germany
- 3Pillar of Engineering Product Development, Singapore University of Technology and Design, Singapore, Singapore
- 4TUM-Neuroimaging Center, Klinikum rechts der Isar, Technical University of Munich, Munich, Germany
Objective: Vertebral bone marrow composition has been extensively studied in the past and shown potential as imaging biomarker for osteoporosis, hematopoietic, and metabolic disorders. However, beyond quantitative assessment of bone marrow fat, little is known about its heterogeneity. Therefore, we investigated bone marrow heterogeneity of the lumbar spine using texture analysis of chemical-shift-encoding (CSE-MRI) based proton density fat fraction (PDFF) maps and its association with age, sex, and anatomical location.
Methods: One hundred and fifty-six healthy subjects were scanned (age range: 20–29 years, 12/30 males/females; 30–39, 15/9; 40–49, 5/13; 50–59, 9/27; ≥60: 9/27). A sagittal 8-echo 3D spoiled-gradient-echo sequence at 3T was used for CSE-MRI-based water-fat separation at the lumbar spine. Manual segmentation of vertebral bodies L1-4 was performed. Mean PDFF and texture features (global: variance, skewness, kurtosis; second-order: energy, entropy, contrast, homogeneity, correlation, sum-average, variance, dissimilarity) were extracted at each vertebral level and compared between age groups, sex, and anatomical location.
Results: Mean PDFF significantly increased from L1 to L4 (35.89 ± 11.66 to 39.52 ± 11.18%, p = 0.017) and with age (females: 27.19 ± 6.01 to 49.34 ± 7.75%, p < 0.001; males: 31.97 ± 7.96 to 41.83 ± 7.03 %, p = 0.025), but showed no difference between females and males after adjustment for age and BMI (37.13 ± 11.63 vs. 37.17 ± 8.67%; p = 0.199). Bone marrow heterogeneity assessed by texture analysis, in contrast to PDFF, was significantly higher in females compared to males after adjustment for age and BMI (namely contrast and dissimilarity; p < 0.031), demonstrated age-dependent differences, in particular in females (p < 0.05), but showed no statistically significant dependence on vertebral location.
Conclusion: Vertebral bone marrow heterogeneity, assessed by texture analysis of PDFF maps, is primarily dependent on sex and age but not on anatomical location. Future studies are needed to investigate bone marrow heterogeneity with regard to aging and disease.
Introduction
The non-mineralized bone compartment can be divided into red bone marrow which features higher vascularization and cellularity and is essential for hematopoiesis, and yellow bone marrow which has a higher fat content and important metabolic and endocrine functions (1, 2). The two bone marrow components can be quantitatively assessed using chemical shift encoding-based water–fat magnetic resonance imaging (CSE-MRI) and magnetic resonance spectroscopy (MRS). These two techniques allow for quantification of the proton density fat fraction (PDFF) while MRS additionally has been shown to enable the quantification of marrow fat composition (3–5).
Variations in bone marrow composition, assessed by quantitative MRI, have been demonstrated to be associated with a variety of diseases, such as osteoporosis, hematopoietic disorders, and metabolic disorders, such as obesity and type 2 diabetes mellitus (6–9). In osteoporosis, bone mineral density (BMD) is reduced and a negative correlation of BMD with bone marrow fat fraction as well as a positive correlation with bone marrow unsaturation has been established (10–14). Thus, MR-based quantification of vertebral bone marrow composition has been proposed as imaging biomarker for osteoporosis and fracture risk assessment (3, 14, 15). In addition, vertebral bone marrow composition has been recommended as an advanced surrogate marker for hematopoietic and metabolic disorders such as multiple myeloma and metabolic syndrome (16–20).
Previous studies showed that PDFF is a valid biomarker for fatty conversion of vertebral bone marrow and demonstrated a cranio-caudal increase in fat content for both adults and children (21, 22). An accelerated age-dependent fatty conversion of vertebral bone marrow was shown in females compared to males, particularly pronounced after menopause (23).
However, there are methods that allow quantitative assessment of bone marrow beyond PDFF and fatty acid unsaturation. Burian et al. showed that CSE-MRI can be used for the assessment of vertebral bone marrow heterogeneity using texture analysis (24).
The texture of an image or three-dimensional imaging dataset is characterized by the spatial arrangement of voxels with different intensities. Texture analysis intends to quantify features reflecting repetitive patterns in the image as a function of the spatial gray-level variation. First-order, or global, features provide information related to the gray-level distribution of the image without carrying any information about the relative positions of the gray-levels within the image. This information is obtained from second-order features which can be extracted from the gray-level co-occurrence matrix (GLCM) as described by Haralick et al. (25). Texture features have previously been applied in different biomedical imaging modalities, e.g., for computed tomography (CT)-based analysis of bone microstructure, CT-based fracture risk assessment, and diagnostic support in mammography (26–28), in multi-modal oncologic imaging analysis (29–31) as well as for MRI-based computer-aided diagnosis and classification of vertebral compression fractures (32, 33). In a recent preliminary study, CSE-MRI-based texture analysis demonstrated an increased vertebral bone marrow heterogeneity after menopause and the second-order features contrast and dissimilarity were shown to differentiate post- from premenopausal equally well as PDFF (24). However, this previous study only included a relatively small number of female subjects and vertebral bone marrow heterogeneity has not been characterized in greater detail.
Therefore, the purpose of our study was to further investigate the heterogeneity of the lumbar vertebral bone marrow with regard to anatomical location, sex, and age in a larger cohort using texture analysis of CSE-MRI-based PDFF maps.
Materials and Methods
Subjects
Written informed consent was obtained from all subjects before participation in the study which was approved by the local institutional committee for human research. Healthy subjects older than 20 years of age were included in this study as outlined previously (23). The following exclusion criteria were applied: history of pathological bone changes such as hematological or metabolic bone disorders other than osteoporosis, history of diabetes, and contraindications for MRI. In total, 156 healthy subjects were recruited: age range 20–29 years (age group 1), 12/30 males/females; 30–39 years (age group 2), 15/9 males/females; 40–49 years (age group 3), 5/13 males/females; 50–59 years (age group 4), 9/27 males/females; 60 years and older (age group 5): 9/27 males/females.
MR Imaging
All subjects were scanned using the same 3T MRI system (Ingenia, Philips Healthcare, Best, The Netherlands). For chemical shift-encoding based water–fat separation at the lumbar spine, a sagittal eight-echo 3D spoiled gradient echo sequence was performed using the built-in-the-table posterior coil elements (12-channel array). The eight echoes of this sequence are acquired in a single repetition time (TR) using non-flyback (bipolar) read-out gradients and the following imaging parameters: TR/TE1/ΔTE = 11/1.4/1.1 ms, field of view (FOV) = 220 × 220 × 80 mm, acquisition matrix size = 224 × 224 × 20, acquisition voxel size = 0.98 mm × 0.98 mm × 4.00 mm, receiver bandwidth = 1,527 Hz/pixel, frequency direction = anterior-posterior (to minimize breathing artifacts), 1 average, scan time = 1 min and 17 s. A flip angle of 3° was used to minimize T1-bias effects (34, 35).
Vertebral Bone Marrow Fat Quantification
The fat quantification routine of the MRI system vendor was used for on-line processing of the gradient echo imaging data including the following steps: first, phase error correction; second, complex-based water–fat decomposition using a precalibrated seven-peak fat spectrum and a single T2* to model the signal variation with echo time (36, 37). The imaging-based PDFF map was computed as the ratio of the fat signal over the sum of fat and water signals. Figure 1 shows representative PDFF maps. The vertebral bodies L1 to L4 were included in the analysis and manually segmented by a radiologist with 3 years of experience in spine imaging (Figure 2). The segmentations did not include Schmorl nodes or cortical bone but comprised the basivertebral veins which could be considered as a potential source of quantification bias. However, the segmentations are consistent with previous publications (21, 23). In order to avoid the inclusion of degenerative alterations, such as Modic changes, endplate-associated sclerotic changes were excluded. Segmentation was performed on the PDFF maps by using the free open-source software Medical Imaging Interaction Toolkit (MITK), developed by the Division of Medical and Biological Informatics, German Cancer Research Center, Heidelberg, Germany (www.mitk.org). PDFF values were calculated individually for each segmented vertebral level as well as for the entire segmentation from L1 to L4 to obtain average values for each subject.
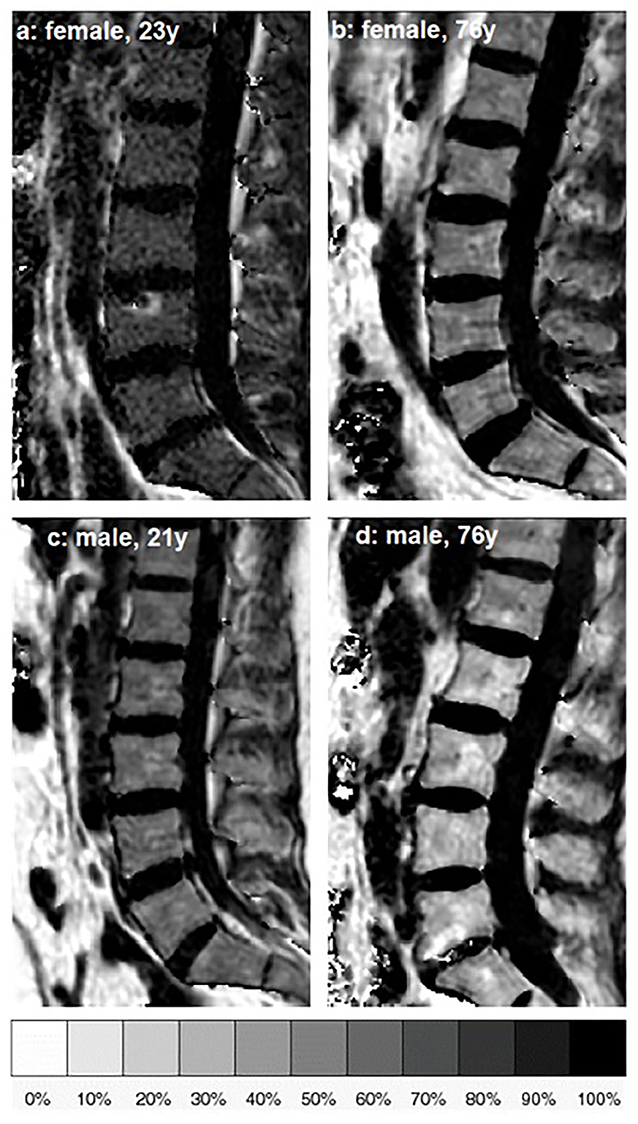
Figure 1. Representative sagittal proton density fat fraction (PDFF) [%] maps of one female and one male subject of age group 1 (a,c) and age group 5 (b,d), respectively.
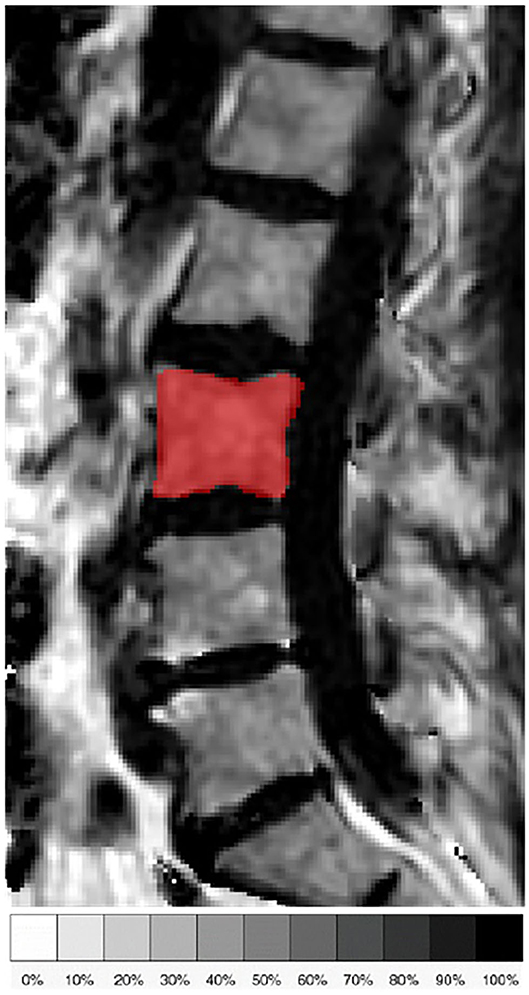
Figure 2. Representative sagittal slice of the segmentation of the L3 vertebral body in the proton density fat fraction (PDFF) map of a 71-year old female subject.
Texture Analysis
Texture analysis was performed on the PDFF maps of the segmented vertebral bodies. Three global features (variance, skewness, kurtosis) and the following eight second-order features were extracted: Energy, entropy, contrast, homogeneity, and correlation were calculated according to (25), variance and sum-average according to (38) and dissimilarity according to (39).
Global features were extracted from intensity histograms. The ideal number of bins used in the histogram analysis was calculated by a combination of different methods (40–42).
Second-order features were extracted using gray-level GLCM analysis (25). As a preprocessing step, gray level quantization of the PDFF maps was performed to prevent sparseness by normalizing the image intensities using 100 equally sized bins and the minimum and maximum gray levels present, corresponding to values of 0 and 100%, respectively.
GLCM is obtained by computing the joint probability of two adjacent voxel intensities at a given offset d = (dx, dy, dz) and angular directions θ = (0, 45, 90, and 135°). dx, dy, and dz denote the displacement along the x-, y-, and z-axis, respectively.
For 3D-GLCM analysis, the co-occurrence probabilities of voxel intensities were computed from the 26 neighbors, aligned in 13 directions taking into account discretization length differences. The mean value of the features computed from the 13 directions ensures the rotation invariance. Image preprocessing, including isotropic resampling, gray level uniform quantization and texture analysis were performed using MATLAB 2017 (MathWorks Inc., Natick, MA, USA) and a radiomics toolbox (https://github.com/mvallieres/radiomics/) (29–31).
Statistical Analysis
The statistical analyses were performed with SPSS (SPSS Inc., Chicago, IL, USA). All tests were done using a two-sided 0.05 level of significance.
The Kolmogorov-Smirnov test indicated normally distributed data for the majority of parameters.
Mean and standard deviation (SD) of PDFF and texture features were calculated for L1 to L4 and a one-way analysis of variance (ANOVA) was performed to test for any significant differences between the four vertebral levels. Bonferroni-adjusted post-hoc analysis was used for pairwise comparisons between the four vertebral levels.
Furthermore, mean and SD of PDFF and texture features, averaged from L1 to L4, were calculated and compared with respect to sex, using a general linear model to adjust for age and body mass index (BMI).
Lastly, mean and SD of PDFF and texture features, averaged from L1 to L4, were calculated for the five age groups and a one-way ANOVA was performed to test for any significant differences between the age groups. This was done separately for female and male subjects. Bonferroni-adjusted post-hoc analysis was used for pairwise comparisons between the five age groups.
Results
Study Population
The study population consisted of 100 female subjects with an age of 46.6 ± 17.1 years and 56 male subjects with an age of 42.9 ± 15.5 years. The age difference between females and males was not significant (p > 0.05). BMI was significantly (p < 0.05) different between females and males (Table 1).
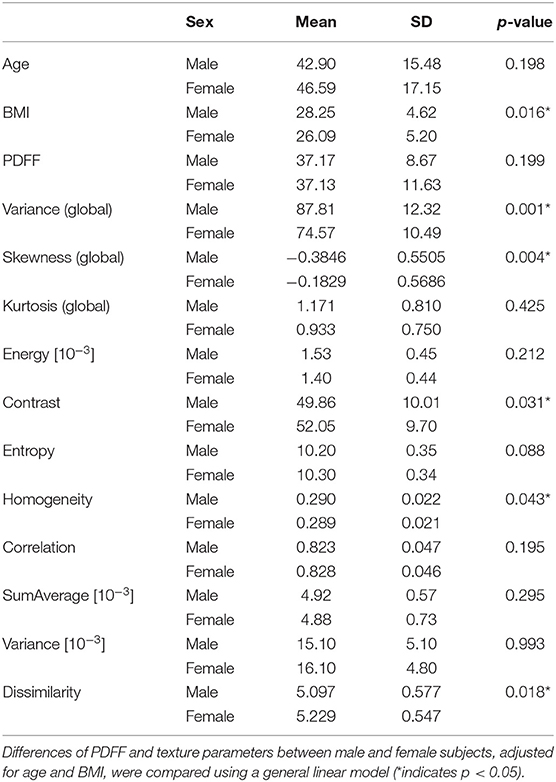
Table 1. Mean and standard deviation (SD) of subject characteristics, proton density fat fraction (PDFF), and analyzed texture parameters, averaged from L1 to L4 and grouped by sex (0: male, n = 50; 1: female, n = 106).
PDFF Measurements
Mean PDFF for all subjects combined showed a statistically significant difference depending on vertebral location (p < 0.05), increasing from 35.89 ± 11.66% in L1 to 39.52 ± 11.18% in L4 (Table 2, Figure 3). Significant differences between consecutive vertebral levels are indicated with * in Figure 3.
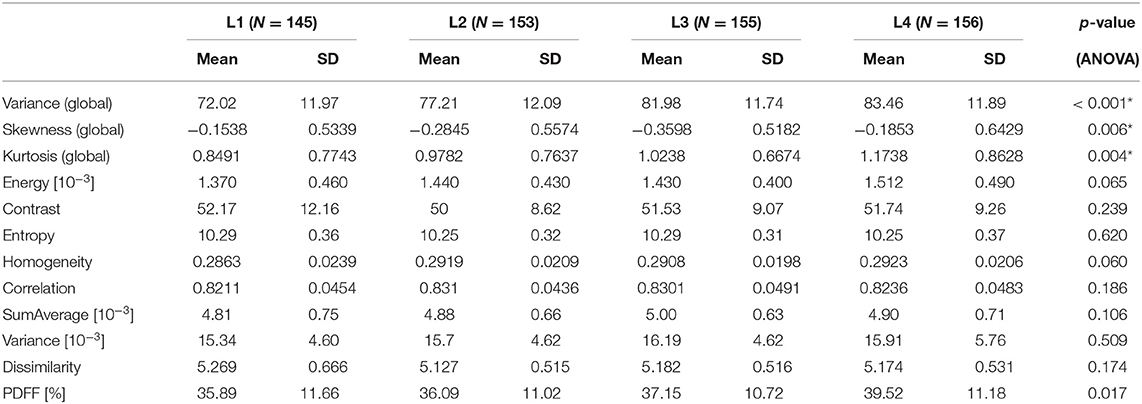
Table 2. Mean and standard deviation (SD), and number of samples (N) of the analyzed texture parameters and proton density fat fraction (PDFF), grouped by vertebral location; p-values for test of differences between vertebral locations using analysis of variance [ANOVA; *indicates stat. significant difference (p < 0.05) between any of the vertebral locations].
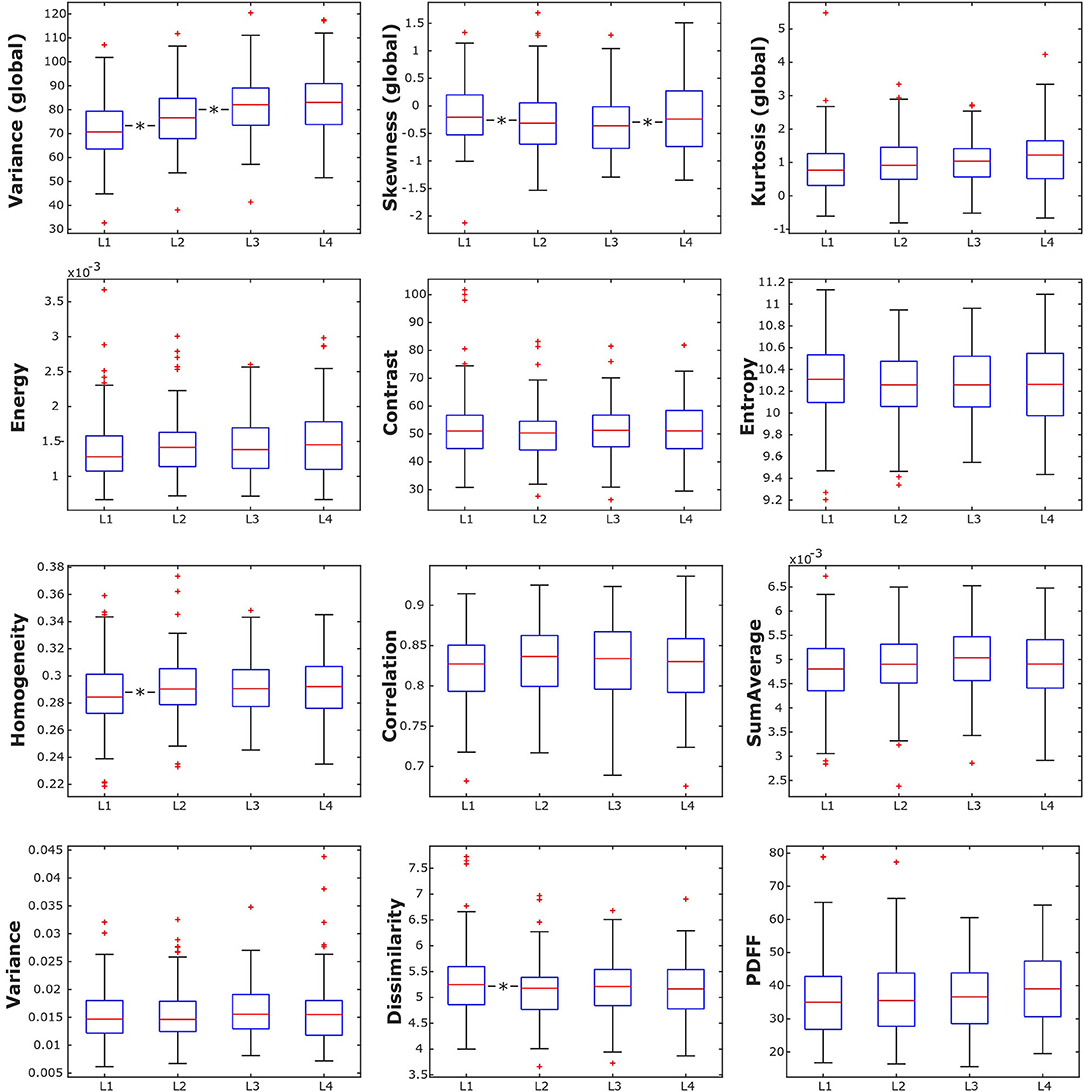
Figure 3. Box plots of the analyzed texture parameters and proton density fat fraction (PDFF) of all subjects, grouped by lumbar vertebral body. *indicates stat. significant difference (p < 0.05) between consecutive lumbar vertebrae.
PDFF, averaged from L1 to L4, showed no statistically significant difference between female and male subjects (37.13 ± 11.63 vs. 37.17 ± 8.67%; Table 1).
In female subjects, PDFF, averaged from L1 to L4, showed a statistically significant difference depending on age group (p < 0.05), increasing from 27.19 ± 6.01% in age group 1 (20–29 years) to 49.34 ± 7.75% in age group 5 (≥ 60 years) (Table 3A, Figure 4A). In male subjects, PDFF, averaged from L1 to L4, showed a statistically significant difference depending on age group (p < 0.05), increasing from 31.97 ± 7.96% in age group 1 (20–29 years) to 42.04 ± 6.06 % in age group 4 (50–59 years) and plateauing at 41.83 ± 7.03% in age group 5 (≥ 60 years) (Table 3A, Figure 4A). Significant differences between consecutive age groups are indicated with * in Figures 4A,B.
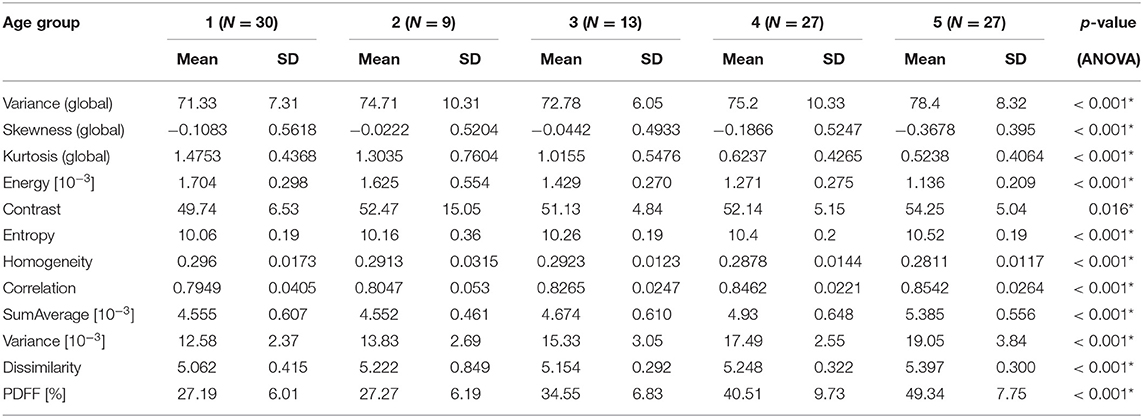
Table 3A. (Females) Mean, standard deviation (SD), and number of samples (N) of texture parameters and proton PDFF of female subjects, grouped by age (1: age 20–29 years, 2: age < 30–39 years, 3: 40–49 years, 4: age 50–59 years, 5: age ≥ 60 years); p-values for test of differences between age groups using analysis of variance (ANOVA; *indicates stat. significant difference between any of the age groups).
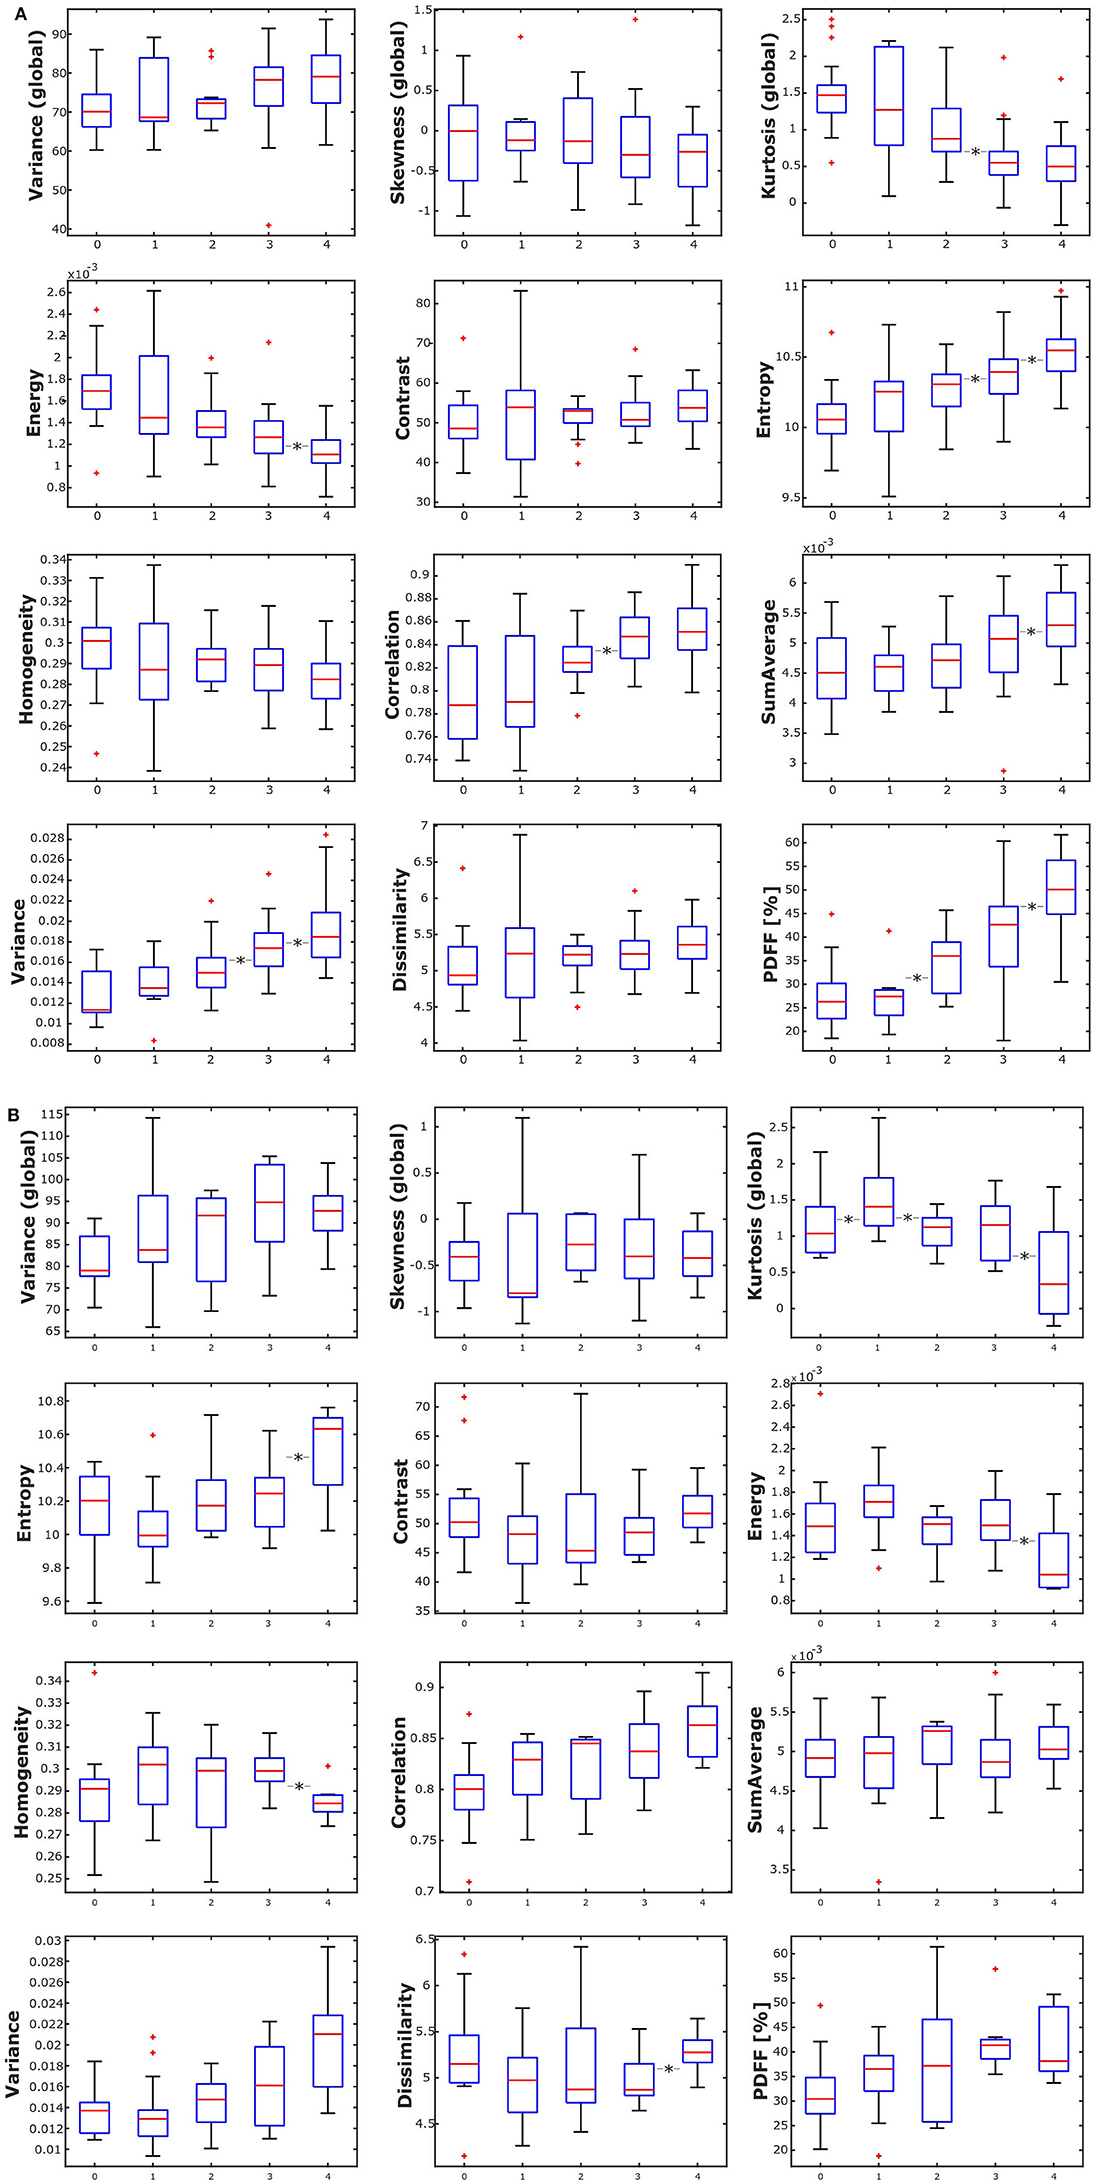
Figure 4. (A) Box plots of the analyzed texture parameters and proton density fat fraction (PDFF) of female subjects, grouped by age group (1: age 20–29 years, 2: age < 30–39 years, 3: 40–49 years, 4: age 50–59 years, 5: age ≥ 60 years). *Indicates stat. significant difference (p < 0.05) between consecutive age groups. (B) Box plots of the analyzed texture parameters and proton density fat fraction (PDFF) of male subjects, grouped by age group (1: age 20–29 years, 2: age < 30–39 years, 3: 40–49 years, 4: age 50–59 years, 5: age ≥ 60 years). *Indicates stat. significant difference (p < 0.05) between consecutive age groups.
Texture Analysis
Combining all subjects, the global texture features variance, skewness, and kurtosis showed statistically significant anatomical variations from L1 to L4 (p < 0.05). However, only variance and kurtosis showed a consistent increasing trend from L1 to L4. None of the second-order texture features showed a significant anatomical variation from L1 to L4 (p > 0.05) (Table 2, Figure 3). Significant differences between consecutive vertebral levels are indicated with * in Figures 4A,B.
Averaged from L1 to L4 and adjusted for age and BMI, the global features variance and skewness as well as the second-order features contrast, dissimilarity and homogeneity showed statistically significant differences between female and male subjects (Table 1).
In female subjects, all texture features, averaged from L1 to L4, showed statistically significant differences between age groups (p < 0.05). A consistent trend was shown for the global feature kurtosis (decreasing with age) and the second-order features energy (decreasing with age), entropy (increasing with age), correlation (increasing with age), and variance (increasing with age) (Table 3A, Figure 4A). In male subjects, all texture features, averaged from L1 to L4, except for the global feature skewness and the second-order feature variance showed statistically significant differences between age groups (p < 0.05). However, a consistent trend was shown only for the second-order feature correlation (increasing with age) (Table 3B, Figure 4B). Significant differences between consecutive age groups are indicated with * in Figures 4A,B.
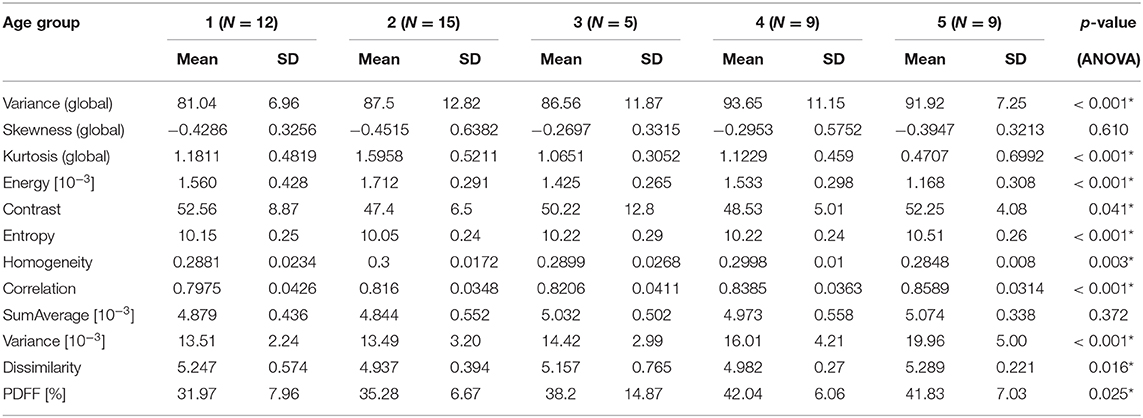
Table 3B. (Males) Mean, standard deviation (SD), and number of samples (N) of texture parameters and proton PDFF of male subjects, grouped by age (1: age 20–29 years, 2: age < 30–39 years, 3: 40–49 years, 4: age 50–59 years, 5: age ≥ 60 years); p-values for test of differences between age groups using analysis of variance (ANOVA; *indicates stat. significant difference between any of the age groups).
Discussion
In the present study, we observed that vertebral bone marrow heterogeneity, assessed by texture analysis of PDFF maps, exhibits sex-specific differences. Significant differences between age groups were found in a considerable subset of the analyzed texture features, particularly in women. In contrast to PDFF, bone marrow heterogeneity shows no gradient along the lumbar spine.
In 1973, Haralick et al. (25) described the computation of 14 textural features containing information about characteristics, such as homogeneity, contrast, linear structure, or complexity, on photo-micrographs and satellite images and applied them for image-classification. Since then, texture features have been increasingly used based on a variety of medical imaging modalities, with a strong focus on oncologic applications (27, 29–31, 43–45). Shape, texture and statistical features of T1-weighted MR images of the lumbar spine have also been shown to improve diagnostic accuracy and classification results of vertebral compression fractures (32, 33). Furthermore, texture analysis has been reported as a reproducible tool for the quantitative assessment of fatty infiltration of paraspinal muscles in patients suffering from lumbar spinal stenosis based on axial T2-weighted MR images (46). In this study, we performed texture analysis of vertebral bone marrow on CSE-MRI-based PDFF maps, an approach which has been shown to be feasible by Burian et al. (24). We took a texture feature processing tool which used positron emission tomography (PET) and non-quantitative MR images of the extremities as well as the head and neck region in the context of radiomics models and tailored it to be applied to PDFF maps of vertebral bone marrow which, by themselves are already quantitative. The voxels of the PDFF maps assume gray-level values corresponding to a range between 0 and 100%. We normalized all image intensities to this same range using the same gray-level quantization for each dataset. Furthermore, the same MRI protocol and scan parameters and resolution were used for each subject ensuring comparable signal-to-noise ratios throughout the scans. As a result, these measures ensure good comparability of the extracted features among the, compared to previous studies, relatively large number of subjects (24, 47).
In this larger-scale study, we found that bone marrow heterogeneity, assessed by the second-order textural features contrast and dissimilarity, is significantly higher in females compared to males, while PDFF itself showed no significant difference between females and males averaged over all age groups. We also found a sex-dependent statistical significant difference in the second-order textural feature homogeneity. However, it was only marginal and can be considered negligible. One potential pathophysiologic explanation for the revealed sex-dependent difference may involve the conversion process from red to yellow marrow. According to Scheller et al. vertebral bone marrow adipose tissue is highly regulated and actively involved in hematopoiesis and skeletal remodeling (1). Several human and animal studies found sex-dependent differences regarding the relationship between marrow fat and bone which were potentially attributed to differences in sex hormone levels (6, 13, 48–50). So it stands to reason that the revealed sex-dependent differences in bone marrow heterogeneity may also be due to the effects of higher estrogen and testosterone levels in males compared to females, particularly in older subjects. Our results could suggest that, beyond the known sex-dependent differences in bone marrow fat content, there are also differences in the conversion process from red to yellow marrow. One potential confounder could be degenerative alterations of the vertebral bodies. Females are known to have a higher prevalence of Modic changes than males which could result in higher heterogeneity measurements (51). However, more severe visible Modic changes were excluded in the segmentations of the vertebral bodies, minimizing this potentially confounding effect.
In addition, our results showed an age dependence of some textural features suggesting an increase in vertebral bone marrow heterogeneity with age. While textural features of bone marrow have not been investigated with regard to age before, heterogeneity shows a similar behavior to PDFF increasing with age in our study, confirming previous results in children and adults (22, 23).
Previous studies have also demonstrated an increase in PDFF from cervical to lumbar vertebral bodies showing that conversion from red to yellow marrow is occurring first at lower vertebral levels (21–23). This could be confirmed in our study. However, in contrast to increasing PDFF from L1-4, textural features did not show a spatial gradient further supporting the hypothesis of Burian et al. of an anatomically homogeneous fatty conversion of bone marrow along the spine (24).
To the best of our knowledge, the present work is the first study investigating the association of bone marrow heterogeneity with sex and age. We found an association of bone marrow heterogeneity with sex and age, admittedly with varying degrees of statistical significance. The clinical relevance of these findings is still unclear. Therefore, an important and logical next step is to investigate these connections in subjects suffering from musculoskeletal and metabolic diseases affecting bone marrow structure and composition, such as osteoporosis and type 2 diabetes (3, 6–9, 15).
Our study is not without limitations. First, the number of female subjects was considerably higher than the number of male subjects, and some of the age groups comprised only a relatively small number of subjects. To more reliably characterize the revealed sex- and age-dependent differences in bone marrow textural features, the inclusion of additional subjects resulting in a more balanced sex and age distribution would be desirable. Second, the present study has a cross-sectional design with the inherent limitations. However, it could be helpful in designing a future longitudinal study, in particular for the characterization of changes in bone marrow heterogeneity related to age and diseases of high clinical interest.
Conclusion
In the present study, we found that texture features of vertebral bone marrow, assessed by analysis of CSE-MRI-based PDFF maps of the lumbar spine, exhibit sex-, and age-specific differences. In contrast to PDFF, bone marrow shows no significant anatomical variation regarding textural features along the lumbar spine. Hence, vertebral bone marrow heterogeneity seems to be primarily sex- and age-dependent. Further studies are needed to investigate bone marrow heterogeneity during aging and disease progression in order to investigate whether texture analysis of bone marrow can improve the clinical impact of quantitative MRI of the spine.
Data Availability Statement
The data supporting the conclusions of this article will be made available by the authors at reasonable request.
Ethics Statement
The studies involving human participants were reviewed and approved by Ethikkommision der Technischen Universität München. The participants provided their written informed consent to participate in this study.
Author Contributions
MD: concept of study design, subject recruitment, data acquisition, data post-processing, statistical analysis, and drafting the manuscript. DJ: subject recruitment, data acquisition, and critical revision of manuscript. SR: data acquisition and critical revision of manuscript. MM and KS: data post-processing and critical revision of manuscript. EB: subject recruitment and critical revision of manuscript. NS: critical revision of manuscript. JK: critical revision of manuscript and project supervision. DK: subject recruitment, data post-processing, and critical revision of manuscript. TB: concept of study design, subject recruitment, data post-processing, statistical analysis, drafting the manuscript, and leading role in critical revision of manuscript.
Funding
The present work was supported by the European Research Council (grant agreement No. 677661 ProFatMRI and grant agreement No. 637164 iBack), Deutsche Forschungsgemeinschaft (DFG, German Research Foundation) under Project 432290010, and Deutsche Gesellschaft für Muskuloskelettale Radiologie (DGMSR).
Conflict of Interest
The authors declare that the research was conducted in the absence of any commercial or financial relationships that could be construed as a potential conflict of interest.
Abbreviations
ANOVA, analysis of variance; BMD, bone mineral density; BMI, body mass index; CT, computed tomography; FOV, field of view; GLCM, gray-level co-occurrence matrix; L1, first lumbar vertebra; L4, fourth lumbar vertebra; MITK, Medical Imaging Interaction Toolkit; MRI, magnetic resonance imaging; MRS, magnetic resonance spectroscopy; PDFF, proton density fat fraction; PET, positron emission tomography; SD, standard deviation; T1, longitudinal relaxation time; T2, transverse relaxation time; T2*, effective transverse relaxation time; TE, echo time; ΔTE, echo time step; TR, repetition time.
References
1. Scheller EL, Doucette CR, Learman BS, Cawthorn WP, Khandaker S, Schell B, et al. Region-specific variation in the properties of skeletal adipocytes reveals regulated and constitutive marrow adipose tissues. Nat Commun. (2015) 6:7808. doi: 10.1038/ncomms8808
2. Devlin MJ, Rosen CJ. The bone-fat interface: basic and clinical implications of marrow adiposity. Lancet Diabetes Endocrinol. (2015) 3:141–7. doi: 10.1016/S2213-8587(14)70007-5
3. Karampinos DC, Ruschke S, Dieckmeyer M, Diefenbach M, Franz D, Gersing AS, et al. Quantitative MRI and spectroscopy of bone marrow. J Magn Reson Imaging. (2018) 47:332–53. doi: 10.1002/jmri.25769
4. Baum T, Cordes C, Dieckmeyer M, Ruschke S, Franz D, Hauner H, et al. MR-based assessment of body fat distribution and characteristics. Eur J Radiol. (2016) 85:1512–8. doi: 10.1016/j.ejrad.2016.02.013
5. Cordes C, Baum T, Dieckmeyer M, Ruschke S, Diefenbach MN, Hauner H, et al. MR-based assessment of bone marrow fat in osteoporosis, diabetes, and obesity. Front Endocrinol. (2016) 7:74. doi: 10.3389/fendo.2016.00074
6. Schwartz AV. Marrow fat and bone: review of clinical findings. Front Endocrinol. (2015) 6:40. doi: 10.3389/fendo.2015.00040
7. Paccou J, Hardouin P, Cotten A, Penel G, Cortet B. The role of bone marrow fat in skeletal health: usefulness and perspectives for clinicians. J Clin Endocrinol Metab. (2015) 100:3613–21. doi: 10.1210/jc.2015-2338
8. Cawthorn WP, Scheller EL. Editorial: bone marrow adipose tissue: formation, function, and impact on health and disease. Front Endocrinol. (2017) 8:112. doi: 10.3389/fendo.2017.00112
9. Veldhuis-Vlug AG, Rosen CJ. Clinical implications of bone marrow adiposity. J Intern Med. (2018) 283:121–39. doi: 10.1111/joim.12718
10. Griffith JF, Yeung DK, Antonio GE, Lee FK, Hong AW, Wong SY, et al. Vertebral bone mineral density, marrow perfusion, and fat content in healthy men and men with osteoporosis: dynamic contrast-enhanced MR imaging and MR spectroscopy. Radiology. (2005) 236:945–51. doi: 10.1148/radiol.2363041425
11. Yeung DK, Griffith JF, Antonio GE, Lee FK, Woo J, Leung PC. Osteoporosis is associated with increased marrow fat content and decreased marrow fat unsaturation: a proton MR spectroscopy study. J Magn Reson Imaging. (2005) 22:279–85. doi: 10.1002/jmri.20367
12. Griffith JF, Yeung DK, Antonio GE, Wong SY, Kwok TC, Woo J, et al. Vertebral marrow fat content and diffusion and perfusion indexes in women with varying bone density: MR evaluation. Radiology. (2006) 241:831–8. doi: 10.1148/radiol.2413051858
13. Schwartz AV, Sigurdsson S, Hue TF, Lang TF, Harris TB, Rosen CJ, et al. Vertebral bone marrow fat associated with lower trabecular BMD and prevalent vertebral fracture in older adults. J Clin Endocrinol Metab. (2013) 98:2294–300. doi: 10.1210/jc.2012-3949
14. Karampinos DC, Ruschke S, Gordijenko O, Grande Garcia E, Kooijman H, Burgkart R, et al. Association of MRS-based vertebral bone marrow fat fraction with bone strength in a human in vitro model. J Osteoporos. (2015) 2015:152349. doi: 10.1155/2015/152349
15. Patsch JM, Li X, Baum T, Yap SP, Karampinos DC, Schwartz AV, et al. Bone marrow fat composition as a novel imaging biomarker in postmenopausal women with prevalent fragility fractures. J Bone Miner Res. (2013) 28:1721–8. doi: 10.1002/jbmr.1950
16. Oriol A, Valverde D, Capellades J, Cabanas ME, Ribera JM, Arus C. In vivo quantification of response to treatment in patients with multiple myeloma by 1H magnetic resonance spectroscopy of bone marrow. MAGMA. (2007) 20:93–101. doi: 10.1007/s10334-007-0072-4
17. Baum T, Yap SP, Karampinos DC, Nardo L, Kuo D, Burghardt AJ, et al. Does vertebral bone marrow fat content correlate with abdominal adipose tissue, lumbar spine bone mineral density, and blood biomarkers in women with type 2 diabetes mellitus? J Magn Reson Imaging. (2012) 35:117–24. doi: 10.1002/jmri.22757
18. Bredella MA, Torriani M, Ghomi RH, Thomas BJ, Brick DJ, Gerweck AV, et al. Vertebral bone marrow fat is positively associated with visceral fat and inversely associated with IGF-1 in obese women. Obesity. (2011) 19:49–53. doi: 10.1038/oby.2010.106
19. Bredella MA, Gill CM, Gerweck AV, Landa MG, Kumar V, Daley SM, et al. Ectopic and serum lipid levels are positively associated with bone marrow fat in obesity. Radiology. (2013) 269:534–41. doi: 10.1148/radiol.13130375
20. Bredella MA, Greenblatt LB, Eajazi A, Torriani M, Yu EW. Effects of Roux-en-Y gastric bypass and sleeve gastrectomy on bone mineral density and marrow adipose tissue. Bone. (2017) 95:85–90. doi: 10.1016/j.bone.2016.11.014
21. Baum T, Yap SP, Dieckmeyer M, Ruschke S, Eggers H, Kooijman H, et al. Assessment of whole spine vertebral bone marrow fat using chemical shift-encoding based water-fat MRI. J Magn Reson Imaging. (2015) 42:1018–23. doi: 10.1002/jmri.24854
22. Ruschke S, Pokorney A, Baum T, Eggers H, Miller JH, Hu HH, et al. Measurement of vertebral bone marrow proton density fat fraction in children using quantitative water-fat MRI. MAGMA. (2017) 30:449–60. doi: 10.1007/s10334-017-0617-0
23. Baum T, Rohrmeier A, Syvari J, Diefenbach MN, Franz D, Dieckmeyer M, et al. Anatomical variation of age-related changes in vertebral bone marrow composition using chemical shift encoding-based water-fat magnetic resonance imaging. Front Endocrinol. (2018) 9:141. doi: 10.3389/fendo.2018.00141
24. Burian E, Subburaj K, Mookiah MRK, Rohrmeier A, Hedderich DM, Dieckmeyer M, et al. Texture analysis of vertebral bone marrow using chemical shift encoding-based water-fat MRI: a feasibility study. Osteoporos Int. (2019) 30:1265–74. doi: 10.1007/s00198-019-04924-9
25. Haralick RM, Shanmugam K, Dinstein I. Textural features for image classification. IEEE Trans Syst Man Cybernetics. (1973) SMC-3:610–21. doi: 10.1109/TSMC.1973.4309314
26. Mookiah MRK, Subburaj K, Mei K, Kopp FK, Kaesmacher J, Jungmann PM, et al. Multidetector computed tomography imaging: effect of sparse sampling and iterative reconstruction on trabecular bone microstructure. J Comput Assist Tomogr. (2018) 42:441–7. doi: 10.1097/RCT.0000000000000710
27. Karahaliou AN, Boniatis IS, Skiadopoulos SG, Sakellaropoulos FN, Arikidis NS, Likaki EA. Breast cancer diagnosis: analyzing texture of tissue surrounding microcalcifications. IEEE Trans Inf Technol Biomed. (2008) 12:731–8. doi: 10.1109/TITB.2008.920634
28. Link TM, Heilmeier U. Bone quality-beyond bone mineral density. Semin Musculoskelet Radiol. (2016) 20:269–78. doi: 10.1055/s-0036-1592365
29. Vallieres M, Freeman CR, Skamene SR, El Naqa I. A radiomics model from joint FDG-PET and MRI texture features for the prediction of lung metastases in soft-tissue sarcomas of the extremities. Phys Med Biol. (2015) 60:5471–96. doi: 10.1088/0031-9155/60/14/5471
30. Zhou H, Vallieres M, Bai HX, Su C, Tang H, Oldridge D, et al. MRI features predict survival and molecular markers in diffuse lower-grade gliomas. Neuro Oncol. (2017) 19:862–70. doi: 10.1093/neuonc/now256
31. Vallieres M, Kay-Rivest E, Perrin LJ, Liem X, Furstoss C, Aerts H, et al. Radiomics strategies for risk assessment of tumour failure in head-and-neck cancer. Sci Rep. (2017) 7:10117. doi: 10.1038/s41598-017-10371-5
32. Frighetto-Pereira L, Rangayyan RM, Metzner GA, de Azevedo-Marques PM, Nogueira-Barbosa MH. Shape, texture and statistical features for classification of benign and malignant vertebral compression fractures in magnetic resonance images. Comput Biol Med. (2016) 73:147–56. doi: 10.1016/j.compbiomed.2016.04.006
33. Casti P, Mencattini A, Nogueira-Barbosa MH, Frighetto-Pereira L, Azevedo-Marques PM, Martinelli E, et al. Cooperative strategy for a dynamic ensemble of classification models in clinical applications: the case of MRI vertebral compression fractures. Int J Comput Assist Radiol Surg. (2017) 12:1971–83. doi: 10.1007/s11548-017-1625-2
34. Karampinos DC, Yu H, Shimakawa A, Link TM, Majumdar S. T(1)-corrected fat quantification using chemical shift-based water/fat separation: application to skeletal muscle. Magn Reson Med. (2011) 66:1312–26. doi: 10.1002/mrm.22925
35. Liu CY, McKenzie CA, Yu H, Brittain JH, Reeder SB. Fat quantification with IDEAL gradient echo imaging: correction of bias from T(1) and noise. Magn Reson Med. (2007) 58:354–64. doi: 10.1002/mrm.21301
36. Ren J, Dimitrov I, Sherry AD, Malloy CR. Composition of adipose tissue and marrow fat in humans by 1H NMR at 7 Tesla. J Lipid Res. (2008) 49:2055–62. doi: 10.1194/jlr.D800010-JLR200
37. Karampinos DC, Ruschke S, Dieckmeyer M, Eggers H, Kooijman H, Rummeny EJ, et al. Modeling of T2* decay in vertebral bone marrow fat quantification. NMR Biomed. (2015) 28:1535–42. doi: 10.1002/nbm.3420
38. Assefa D, Keller H, Menard C, Laperriere N, Ferrari RJ, Yeung I. Robust texture features for response monitoring of glioblastoma multiforme on T1-weighted and T2-FLAIR MR images: a preliminary investigation in terms of identification and segmentation. Med Phys. (2010) 37:1722–36. doi: 10.1118/1.3357289
39. Thibault G, Devic C, Fertil B, Mari J, Sequeira J. Indices de formes: de la 2D vers la 3D-Application au classement de noyaux de cellules. In: Journées de l'Association Francophone d'Informatique Graphique. Marne-la-Vallée (2007) p. 17.
40. Sturges HA. The choice of a class interval. J Am Stat Assoc. (1926) 21:65–6. doi: 10.1080/01621459.1926.10502161
41. Scott DW. On optimal and data-based histograms. Biometrika. (1979) 66:605–10. doi: 10.1093/biomet/66.3.605
42. Freedman D. On the histogram as a density estimator: L2 theory. Probab Theory Relat Fields. (1981) 57:453–76. doi: 10.1007/BF01025868
43. Lisson CS, Lisson CG, Flosdorf K, Mayer-Steinacker R, Schultheiss M, von Baer A, et al. Diagnostic value of MRI-based 3D texture analysis for tissue characterisation and discrimination of low-grade chondrosarcoma from enchondroma: a pilot study. Eur Radiol. (2018) 28:468–77. doi: 10.1007/s00330-017-5014-6
44. Ortiz-Ramon R, Larroza A, Ruiz-Espana S, Arana E, Moratal D. Classifying brain metastases by their primary site of origin using a radiomics approach based on texture analysis: a feasibility study. Eur Radiol. (2018) 28:4514–23. doi: 10.1007/s00330-018-5463-6
45. Tixier F, Le Rest CC, Hatt M, Albarghach N, Pradier O, Metges JP, et al. Intratumor heterogeneity characterized by textural features on baseline 18F-FDG PET images predicts response to concomitant radiochemotherapy in esophageal cancer. J Nucl Med. (2011) 52:369–78. doi: 10.2967/jnumed.110.082404
46. Mannil M, Burgstaller JM, Thanabalasingam A, Winklhofer S, Betz M, Held U, et al. Texture analysis of paraspinal musculature in MRI of the lumbar spine: analysis of the lumbar stenosis outcome study (LSOS) data. Skeletal Radiol. (2018) 47:947–54. doi: 10.1007/s00256-018-2919-3
47. Mayerhoefer ME, Szomolanyi P, Jirak D, Materka A, Trattnig S. Effects of MRI acquisition parameter variations and protocol heterogeneity on the results of texture analysis and pattern discrimination: an application-oriented study. Med Phys. (2009) 36:1236–43. doi: 10.1118/1.3081408
48. Sottile V, Seuwen K, Kneissel M. Enhanced marrow adipogenesis and bone resorption in estrogen-deprived rats treated with the PPARgamma agonist BRL49653 (rosiglitazone). Calcif Tissue Int. (2004) 75:329–37. doi: 10.1007/s00223-004-0224-8
49. Tamura N, Kurabayashi T, Nagata H, Matsushita H, Yahata T, Tanaka K. Effects of testosterone on cancellous bone, marrow adipocytes, and ovarian phenotype in a young female rat model of polycystic ovary syndrome. Fertil Steril. (2005) 84(Suppl. 2):1277–84. doi: 10.1016/j.fertnstert.2005.06.017
50. Elbaz A, Rivas D, Duque G. Effect of estrogens on bone marrow adipogenesis and Sirt1 in aging C57BL/6J mice. Biogerontology. (2009) 10:747–55. doi: 10.1007/s10522-009-9221-7
Keywords: bone marrow, magnetic resonance imaging, texture analysis, spine, proton density fat fraction
Citation: Dieckmeyer M, Junker D, Ruschke S, Mookiah MRK, Subburaj K, Burian E, Sollmann N, Kirschke JS, Karampinos DC and Baum T (2020) Vertebral Bone Marrow Heterogeneity Using Texture Analysis of Chemical Shift Encoding-Based MRI: Variations in Age, Sex, and Anatomical Location. Front. Endocrinol. 11:555931. doi: 10.3389/fendo.2020.555931
Received: 26 April 2020; Accepted: 24 August 2020;
Published: 15 October 2020.
Edited by:
Gudrun Stenbeck, Brunel University London, United KingdomReviewed by:
Marcello Nogueira-Barbosa, Ribeirao Preto Medical School, Ribeirão Preto, BrazilQingyun Ren, The First Hospital of Hebei Medical University, China
Copyright © 2020 Dieckmeyer, Junker, Ruschke, Mookiah, Subburaj, Burian, Sollmann, Kirschke, Karampinos and Baum. This is an open-access article distributed under the terms of the Creative Commons Attribution License (CC BY). The use, distribution or reproduction in other forums is permitted, provided the original author(s) and the copyright owner(s) are credited and that the original publication in this journal is cited, in accordance with accepted academic practice. No use, distribution or reproduction is permitted which does not comply with these terms.
*Correspondence: Michael Dieckmeyer, bWljaGFlbC5kaWVja21leWVyQHR1bS5kZQ==