 Hui Guo1†
 Chiyu Wang2†
 Boren Jiang2Shaohong Ge1Jian Cai1Ying Zhou1Rong Ying1Kexi Zha1Ji Zhou1
 Ningjian Wang2Chunfang Zhu2Chenyu Cao2Liqin Zhang1Tao Gu1Yan Zhao1
 Yingli Lu2*
 Zengmei An1*
- 1Institute and Department of Endocrinology and Metabolism, Huangpu Branch of Shanghai Ninth People’s Hospital, Shanghai, China
- 2Institute and Department of Endocrinology and Metabolism, Shanghai Ninth People’s Hospital, Shanghai Jiao Tong University School of Medicine, Shanghai, China
Background: The interrelation between glucose and bone metabolism is complex and has not been fully revealed. This study aimed to investigate the association between insulin resistance, β-cell function and bone turnover biomarker levels among participants with abnormal glycometabolism.
Methods: A total of 5277 subjects were involved through a cross-sectional study (METAL study, http://www.chictr.org.cn, ChiCTR1800017573) in Shanghai, China. Homeostasis model assessment of insulin resistance (HOMA-IR) and β-cell dysfunction (HOMA-%β) were applied to elucidate the nexus between β-C-terminal telopeptide (β-CTX), intact N-terminal propeptide of type I collagen (P1NP) and osteocalcin (OC). β-CTX, OC and P1NP were detected by chemiluminescence.
Results: HOMA-IR was negatively associated with β-CTX, P1NP and OC (regression coefficient (β) -0.044 (-0.053, -0.035), Q4vsQ1; β -7.340 (-9.130, -5.550), Q4vsQ1 and β -2.885 (-3.357, -2.412), Q4vsQ1, respectively, all P for trend <0.001). HOMA-%β was positively associated with β-CTX, P1NP and OC (β 0.022 (0.014, 0.031), Q4vsQ1; β 6.951 (5.300, 8.602), Q4vsQ1 and β 1.361 (0.921, 1.800), Q4vsQ1, respectively, all P for trend <0.001).
Conclusions: Our results support that lower bone turnover biomarker (β-CTX, P1NP and OC) levels were associated with a combination of higher prevalence of insulin resistance and worse β-cell function among dysglycemia patients. It is feasible to detect bone turnover in diabetes or hyperglycemia patients to predict the risk of osteoporosis and fracture, relieve patients’ pain and reduce the expenses of long-term cure.
Introduction
Bone metabolism and the blood glucose milieu are considered to be closely related (1). It is well recognized that diabetes or impaired glucose metabolism could affect bone health, contributing to decreased bone formation, increased bone marrow adiposity and increased risk of fracture (2, 3). In addition, there is a tight connection between bone metabolism and insulin resistance (IR) in type 2 diabetes (T2D) (4, 5). Insulin resistance may play a part in these interactions through impairment of the IGF-1 signaling pathway, which is vital for the muscle-bone unit (6). Homeostatic model assessment (HOMA) is a method for assessing IR and β-cell function from fasting glucose or insulin/C-peptide concentrations (7). The model has been used widely since it was first published in 1985 and has been included in numerous studies (8).
However, as the gold standard for the diagnosis of osteoporosis, bone mineral density (BMD) aberrations are not sufficient to predict the increased risk of osteoporosis and fracture for the hysteresis of imaging characteristics (9). Currently, bone turnover biomarkers are widely used to forecast the prevalence of bone metabolism dysfunction and estimate the treatment effect of osteoporosis (10–12). Thus, osteocalcin (OC), a protein secreted by osteoblasts, and the intact N-terminal propeptide of type I collagen (P1NP), all serves as a marker of bone formation. And β-C-terminal telopeptide (β-CTX) is regarded as a marker of bone resorption and osteoclast activity (10, 13, 14). In vivo research revealed that during the oral glucose tolerance test (OGTT), both formative (OC, P1NP) and resorptive (β-CTX) bone markers decreased within twenty minutes in healthy young individuals (15). However, a study also showed that serum levels of CTX (s-CTX) in postmenopausal, healthy, untreated women with T2D were not correlated with age, age at menopause, or BMI (16). This lack of correlation between s-CTX was also in accordance with the observations of Papakitsou et al. (17).
Research on the relationship between insulin resistance, glucose metabolism and bone turnover biomarkers in hyperglycemia patients remains scarce and inconclusive, thus clearly warranting further study. For this reason, the aim of the present study was to investigate the association of HOMA-IR and HOMA-%β with β-CTX, P1NP and OC in Chinese patients with hyperglycemia.
Methods
Study Design and Participants
We used data from volunteers in seven communities in Shanghai, China. The ongoing cross-sectional METAL study (Environmental Pollutant Exposure and Metabolic Diseases in Shanghai) is a population-based survey on the complications of metabolic diseases and risk factors (http://www.chictr.org.cn, ChiCTR1800017573). We included adults aged 18 years or older who had lived in their current area for more than six months and excluded subjects who were unwilling to participate or had severe communication problems or acute illness. Before data collection, all participants provided written informed consent. Our study initially enrolled 5827 populations aged 18 to 99 years old. Among them, subjects with missing laboratory results (n=58) or questionnaire data (n=90) and premenopausal women (n=236) were excluded. A woman was considered postmenopausal if she confirmed menopause on the questionnaire or was over 60 years old or over 55 years old with FSH ≥25 IU/L (18). Thus, 5443 participants were included in the METAL study. In this study, subjects without serum insulin and fasting plasma glucose (FPG) data (n=32), bone turnover data (n=46) and information on hypertension, cardiovascular disease (CVD) or dyslipidemia (n=88) were excluded. Thus, a total of 5277 subjects were ultimately involved in this study (Figure 1).
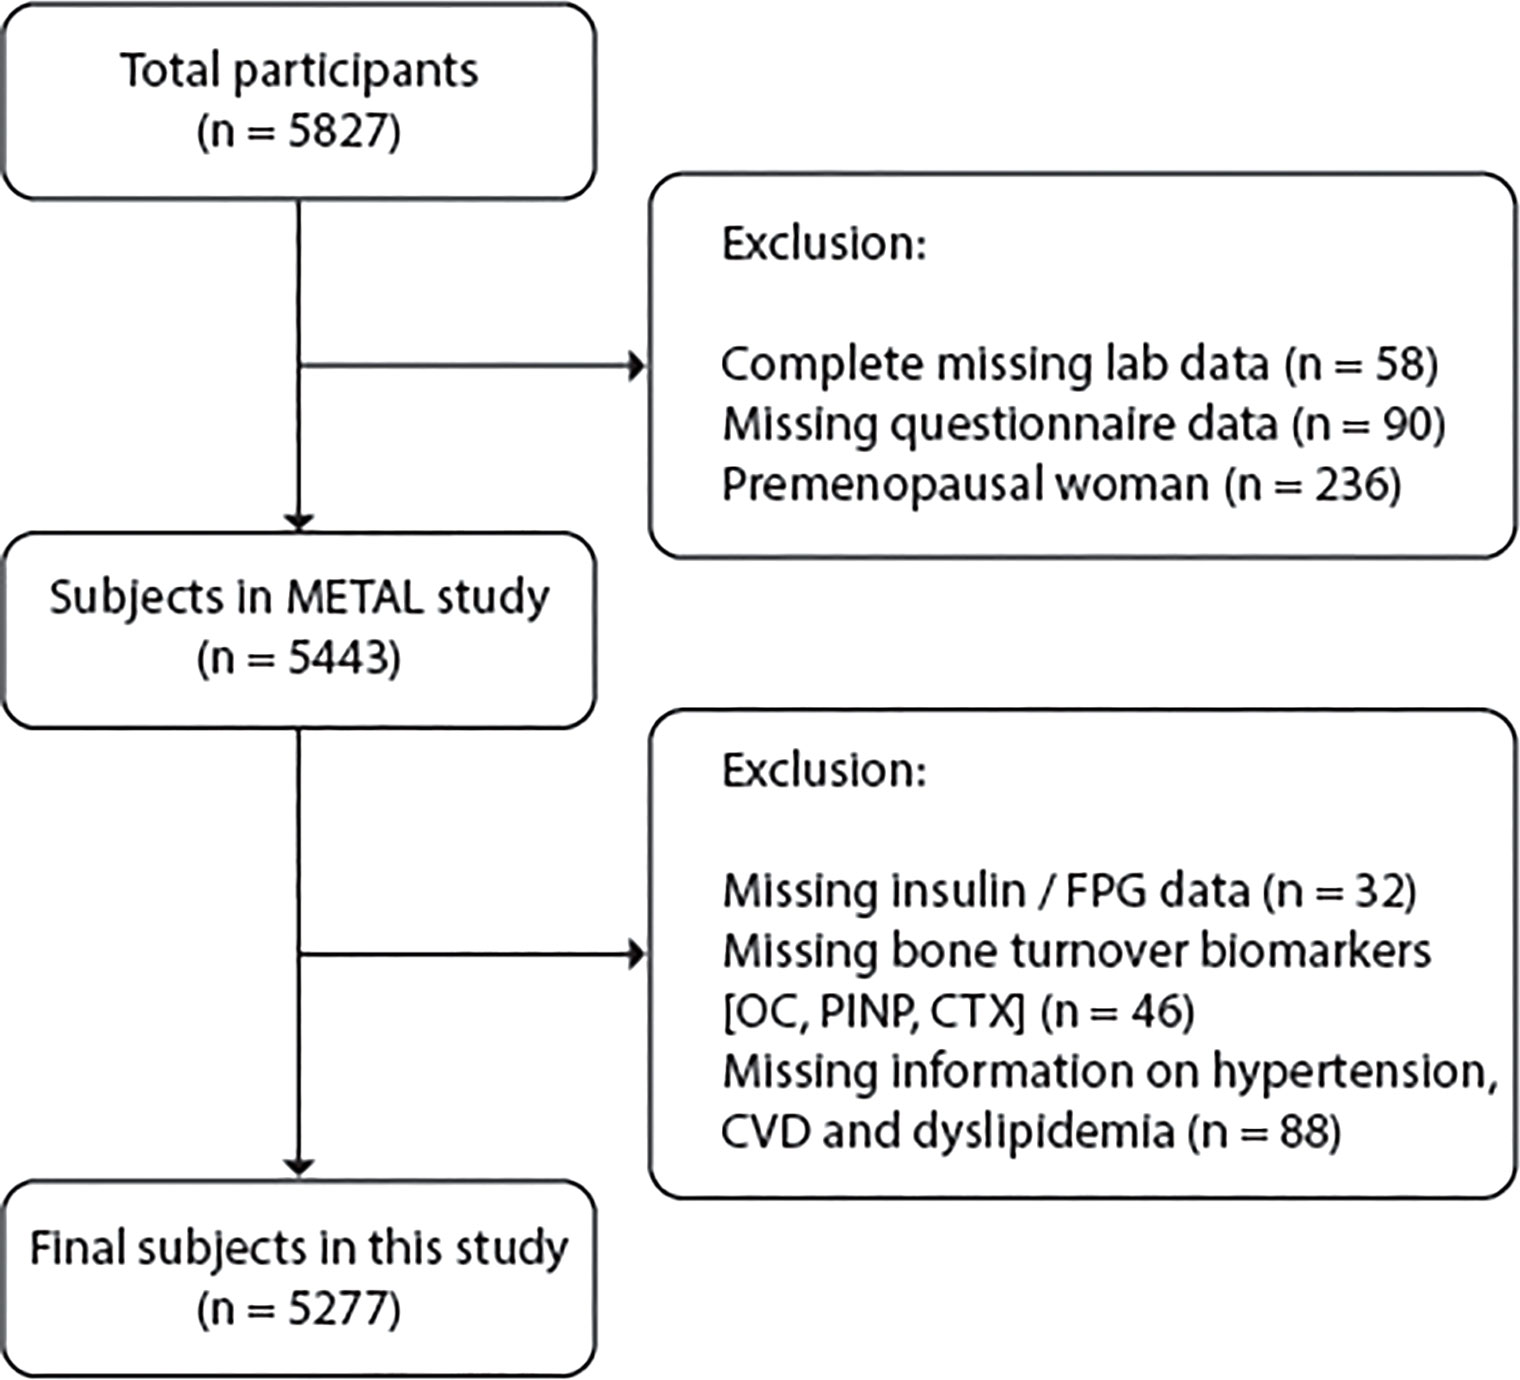
Figure 1 Flow chart of study participant selection (inclusions and exclusions).
This study protocol was approved by the Ethics Committee of Shanghai Ninth People’s Hospital, Huangpu Branch of Shanghai Ninth People’s Hospital, Shanghai Jiaotong University School of Medicine. All following procedures were in accordance with the ethical standards of the responsible committee on human experimentation (institutional and national) and with the Helsinki Declaration of 1975.
Data Collection
We followed the methods of Y. Wang et al. in 2019 (19). All data collection was performed by the same staff from the Department of Endocrinology and Metabolism in Shanghai Ninth People’s Hospital, Huangpu Branch of Shanghai Ninth People’s Hospital, Shanghai Jiaotong University School of Medicine who underwent a classic training program on the specific tools and methods used at every step of this study. A standard questionnaire was administered by trained staff to obtain information on demographic characteristics, self-reported symptoms, previous personal and family medical history, and risk elements in their daily lives. All experienced personnel were involved in the Survey on Prevalence in East China for Metabolic Diseases and Risk Factors (SPECT-China). In addition, weight, height, waist circumference and hip circumference were measured according to a standard protocol. All of the anthropometric measurements were conducted at the same time when the serum samples were collected.
Clinical Measurements
We collected serum samples by venipuncture after an 8-hour fast from 6-10 o’clock in the morning. Within 2-4 hours, blood samples were stored at -20°C and shipped by air in dry ice to one central laboratory that was certified by the College of American Pathologists (CAP).
Insulin was detected by the chemiluminescence method (Abbott ARCHITECT i2000SR, Chicago, USA). FPG, glycosylated hemoglobin(HbA1c), total cholesterol (TC), triglycerides (TG), low-density lipoprotein (LDL) and high-density lipoprotein (HDL) were measured by a Beckman Coulter AU680 (Brea, USA).
Serum C-peptide was assessed by immunoassay (ARCHITECT i2000SR, Abbott Laboratories, Chicago, IL, USA), and 25(OH)D was detected using a chemiluminescence assay (ADVIA Centaur XP, Siemens, Germany).
Dysglycemia was consisted of three parts, T2DM, impaired fasting glucose (IFG) and impaired glucose tolerance (IGT). T2DM was determined using a previous diagnosis by health-care professionals, FPG level ≥ 7.0 mmol/L or HbA1c ≥ 6.5%. ADA2003 recommend cut points for IGT as 7.8–11.0 mmol/L measured at the 2-h time point of an OGTT. And IFG was defined as 5.6–6.9 mmol/L by ADA2003. Body mass index (BMI) was defined as weight (in kg) divided by height (in meters squared). In accordance with the Cooperative Meta-Analysis Group of the Working Group on Obesity in China criteria, BMI < 24 kg/m2 was considered normal, while BMI ≥ 24 kg/m2 was defined as overweight/obesity (20). Drug use was determined to take thiazolidinedione (TZD) drugs and insulin in the hypoglycemic therapy. Current smoking was defined as having at least 100 cigarettes over a lifetime and still smoking at present (21). Cardiovascular disease (CVD) was defined as a composite of a previous diagnosis of coronary heart disease, stroke or myocardial infarction, according to the self-reported record of the participants. Hypertension was defined as a systolic blood pressure of 140 mmHg or higher, a diastolic blood pressure of 90 mmHg or higher or a previous diagnosis by healthcare professionals. Dyslipidemia was diagnosed as a TC level≥ 6.22 mmol/L, triglycerides (TG) ≥ 2.26 mmol/L, LDL-C≥ 4.14 mmol/L, HDL-C< 1.04 mmol/L, or a self-reported physician’s diagnosis, as per the US modified National Cholesterol Education Program Adult Treatment Panel III guidelines (22).
Outcome Definition
HOMA-IR has proven to be an instrumental tool for the assessment of insulin resistance and is the index of IR that is most widely applied in large population studies (23–25). The HOMA of IR and β-cell function was first described in 1985 (7, 8).
HOMA-IR and HOMA-%β are calculated using the following simplified equations:
HOMA-IR = (FPI×FPG)/22.5
HOMA-%β = (20×FPI)/(FPG - 3.5)
β-CTX, OC and P1NP were detected with a chemiluminescence method (Roche E602, Switzerland). The interassay coefficients of variation were as follows: 7.60% (β-CTX), 1.81% (OC) and 3.30% (P1NP). The intra-assay coefficients of variation were 5.50% (β-CTX), 0.80% (OC) and 3.0% (P1NP).
Statistical Analyses
The survey analyses were performed with IBM SPSS Statistics, Version 22 (IBM Corporation, Armonk, NY, USA). A P value less than 0.05 was considered to be significant (two-sided). Continuous variables were expressed as the median (IQR, inter quartile range), and categorical variables were expressed as percentages (%). The nonparametric test and chi-square test were used to test for trends of variable changes across HOMA-IR and HOMA-%β quartiles, with the first quartile (Q1) representing the lowest quartile and the fourth quartile (Q4) being the highest, and to provide P-values that were adjusted for sex, age, BMI, lipids, vitamin D (VitD), C-peptide, current smoking and drinking habits, hypertension, CVD, dyslipidemia and drug use. For the association between HOMA and bone turnover biomarker levels, the model was adjusted for the same factors mentioned before. Multiple linear regression coefficients were applied to perform the statistical work.
Results
Clinical Characteristics According to HOMA-IR and HOMA-%β Levels
Table 1 presents the characteristics of the 5277 subjects with dysglycemia included in our study (n=5277). With increasing quartiles of HOMA-IR, the concentrations of CTX, P1NP and OC significantly decreased. In the HOMA-%β model, these three bone turnover markers significantly increased with β-cell function growth.
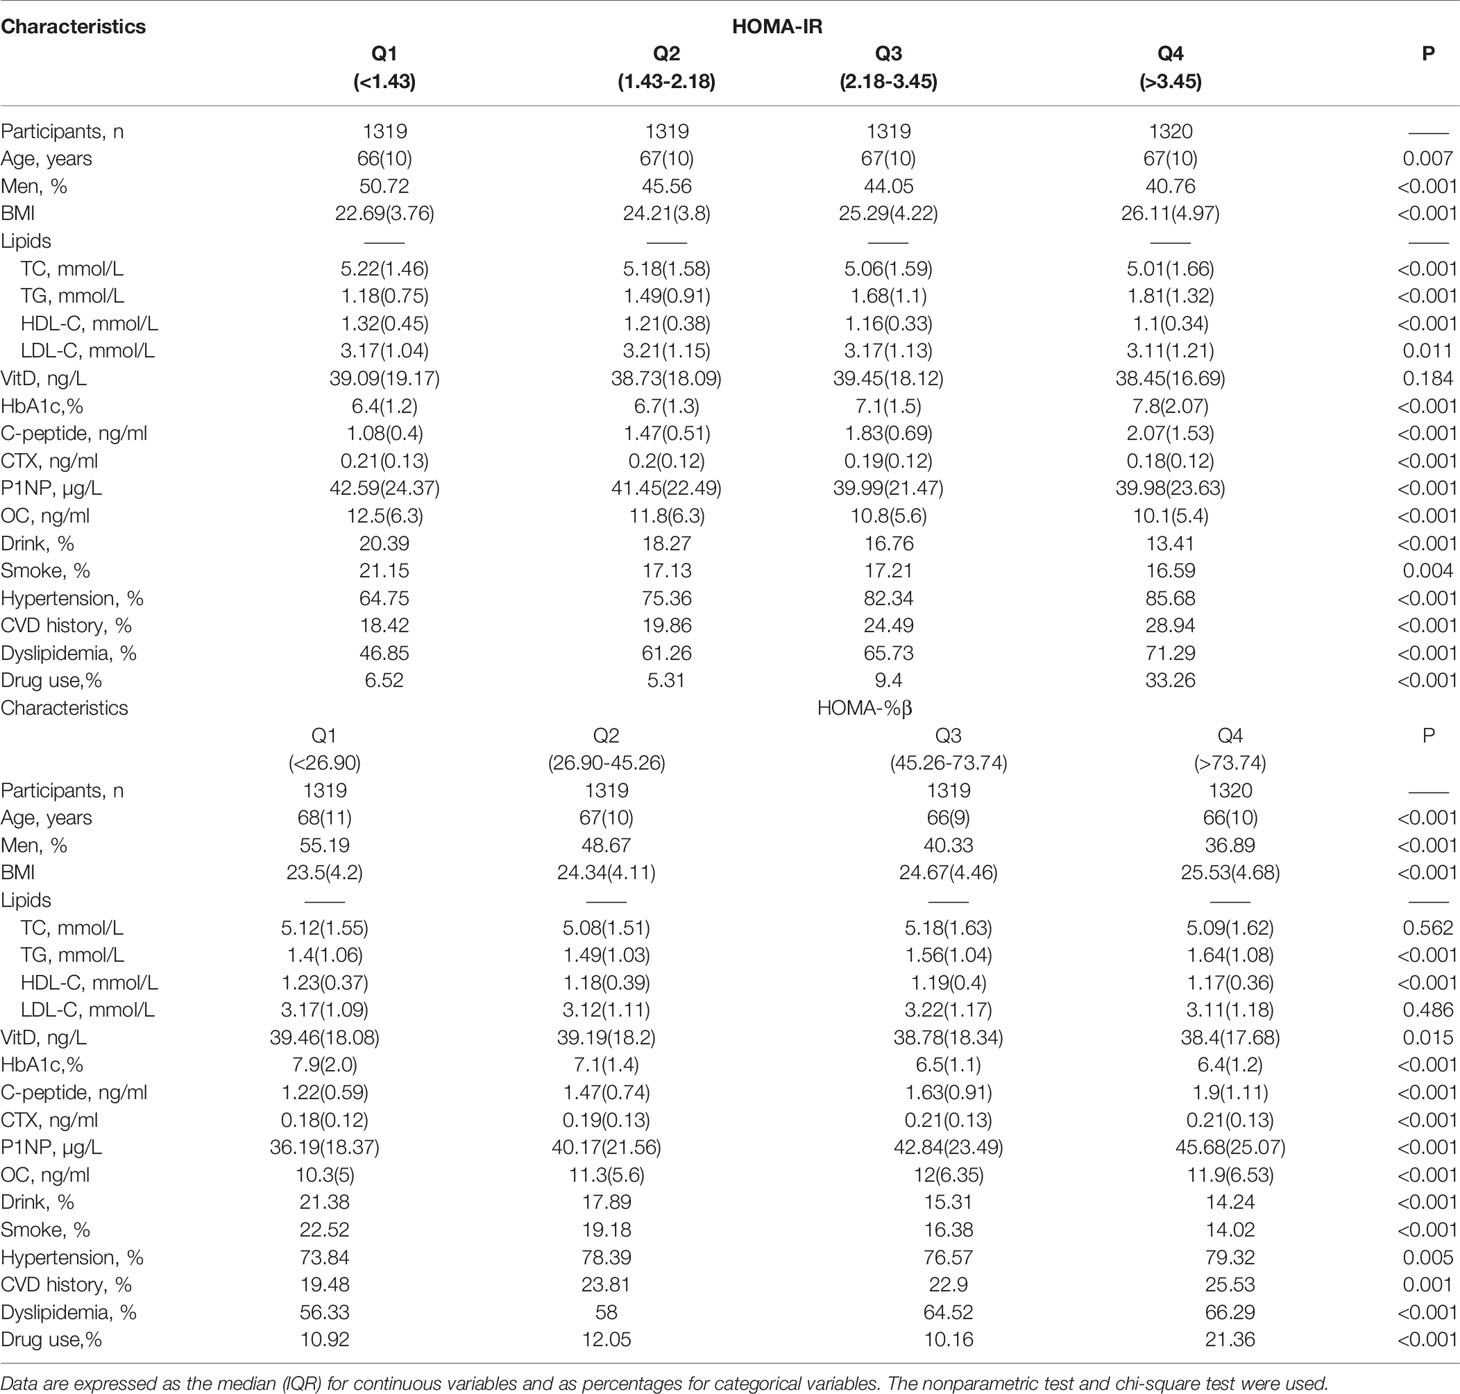
Table 1 Characteristics of subjects in terms of the quartiles (Q1-Q4) of HOMA-IR and HOMA-%β concentration.
In both the HOMA-IR and HOMA-%β models, BMI, TG, C-peptide and prevalence of hypertension, CVD and dyslipidemia were positively related to the increasing concentration quartile (P for trend <0.001, Table 1).
Association of HOMA-IR With Bone Markers in Diabetes Patients
The association of HOMA-IR concentration and bone markers in the diabetes and hyperglycemia populations is presented in Figure 2 and Table 2. HOMA-IR concentration was negatively related to CTX, and as HOMA-IR quartiles increased, the level of CTX decreased (P< 0.001, Table 2) after adjusting for sex, age, BMI, lipids, VitD, C-peptide, current smoking and drinking, hypertension, CVD, dyslipidemia and drug use. [Q1: regression coefficient (β): -0.015, 95% CI: -0.018, -0.012; Q2: β -0.013, 95% CI: -0.021, -0.005; Q3: β -0.028, 95% CI: -0.036, -0.019; Q4: β -0.044, 95% CI: -0.053, -0.035; p for trend < 0.001; Figure 2A].
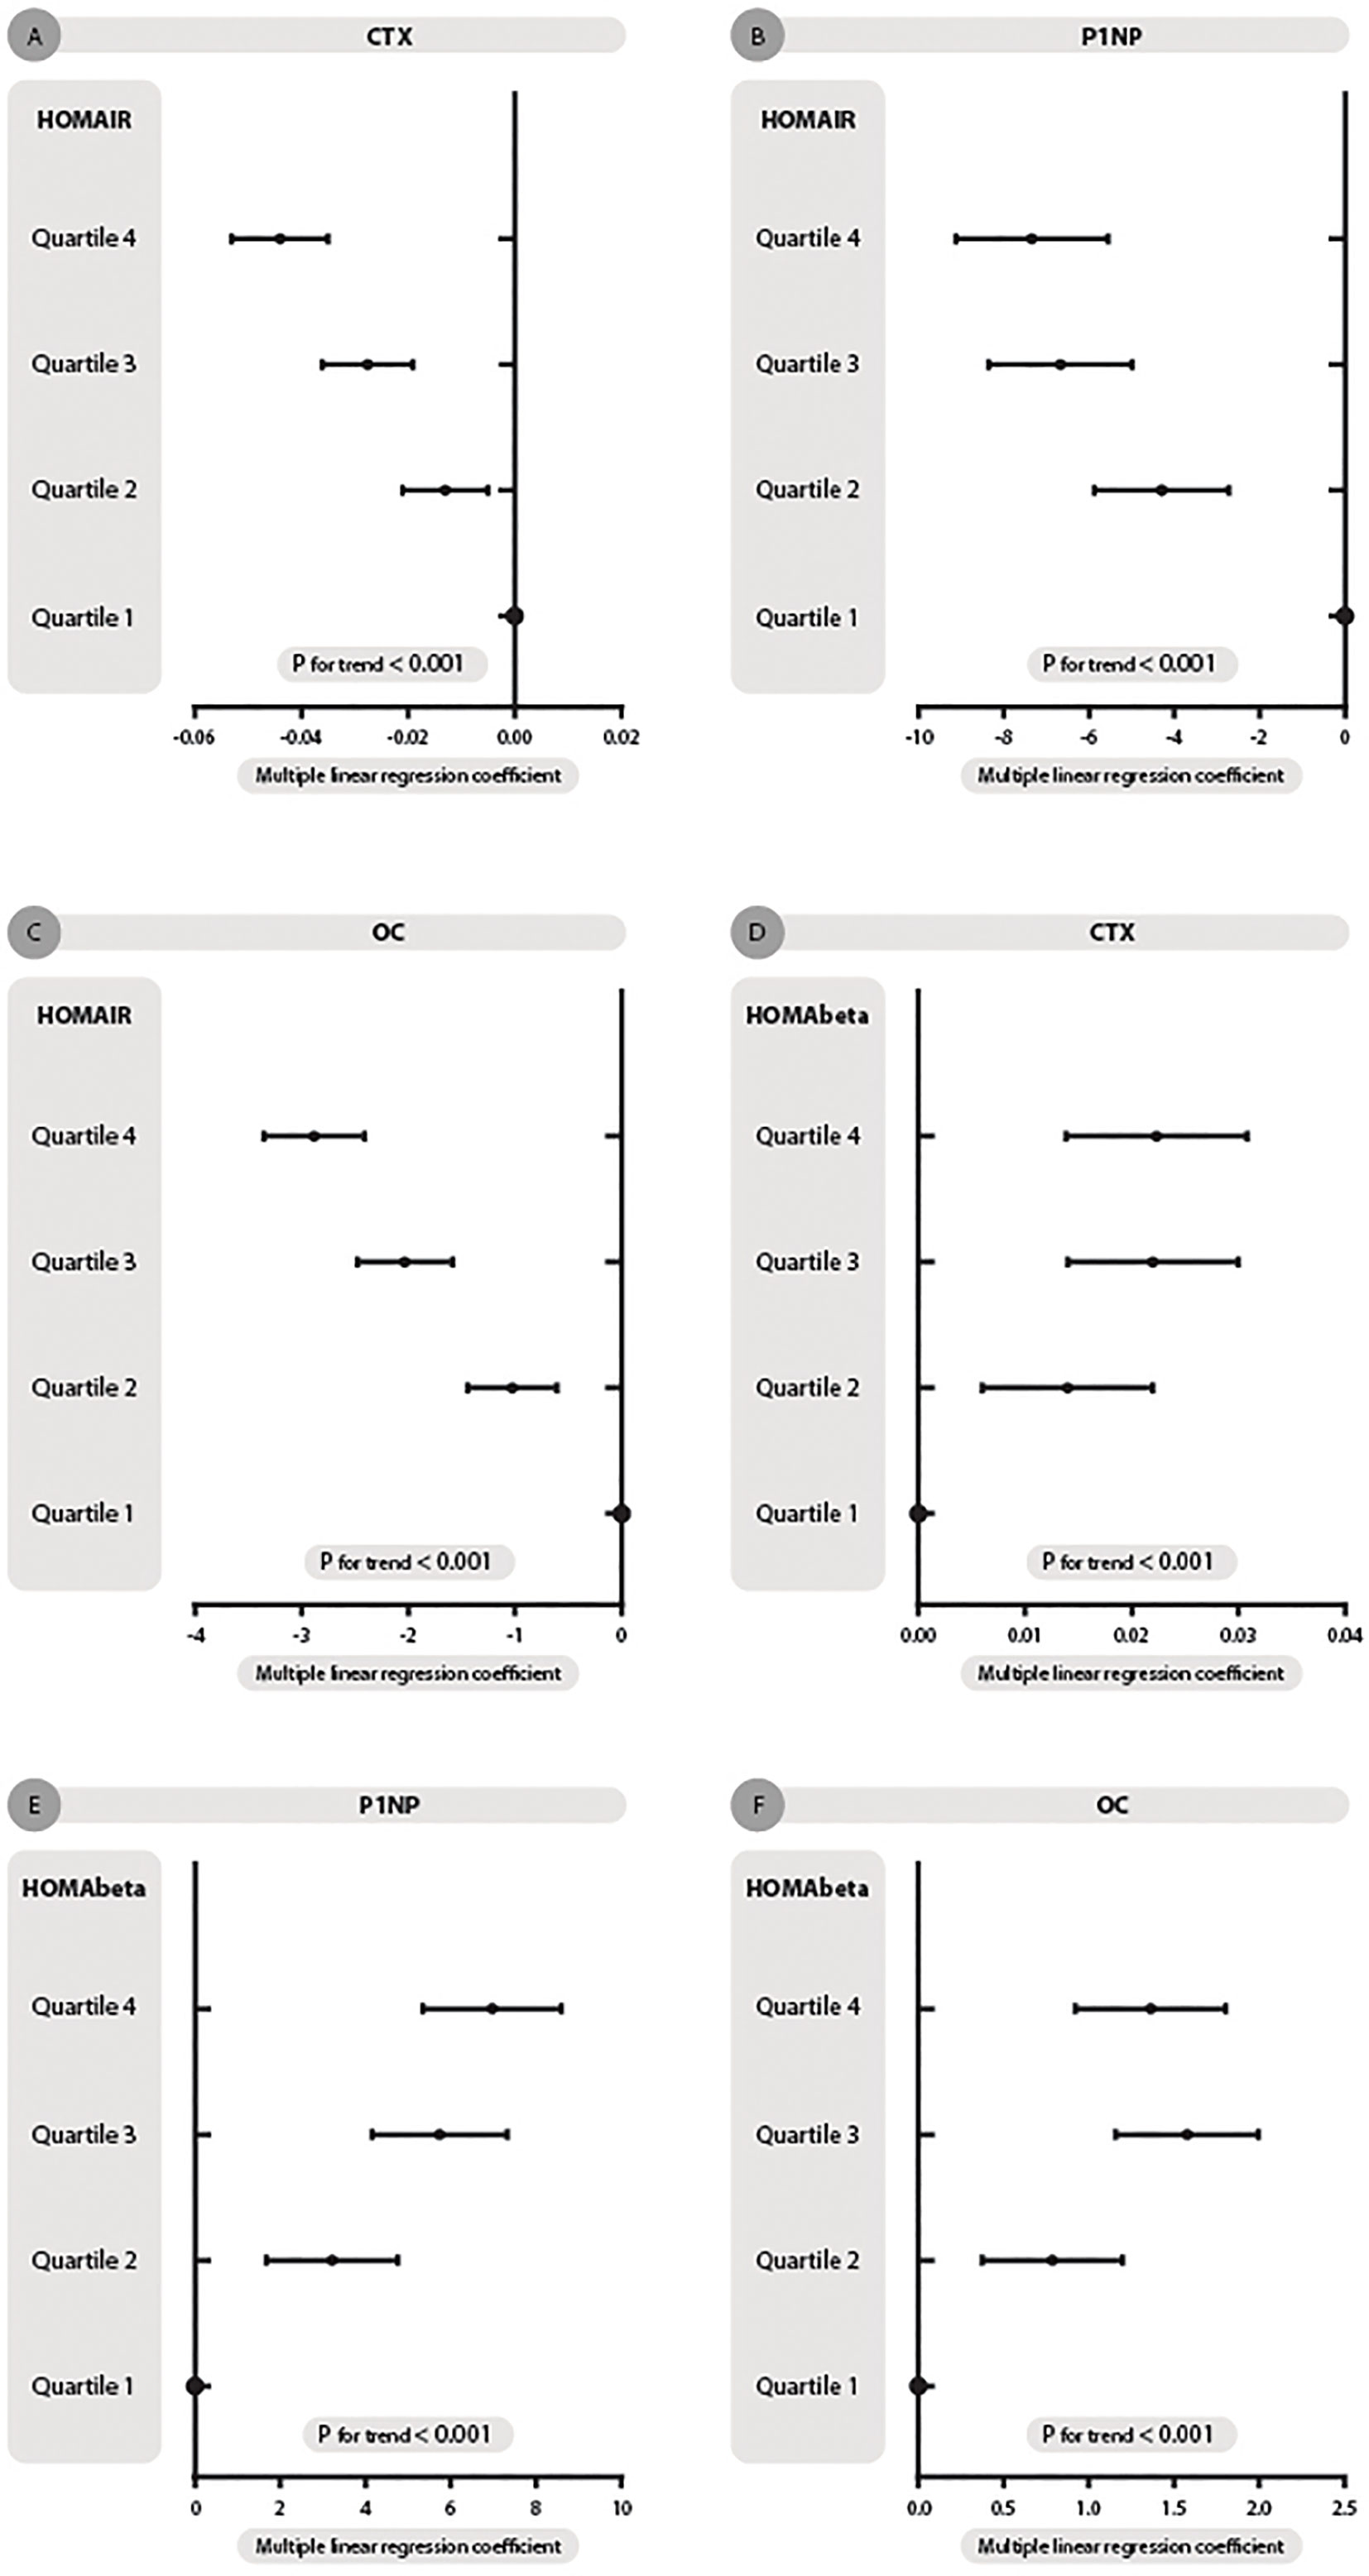
Figure 2 HOMA-IR and HOMA-beta quartiles with changes in the association of β-CTX, P1NP and OC concentration in dysglycemia patients. (A–C) represent HOMA-IR quartiles with β-CTX, P1NP and OC concentration trends, respectively. (D–F) represent HOMA-beta quartiles with three turnovers mentioned. Multiple linear regression coefficients were adjusted for sex, age, BMI, lipids, Vit D, C-peptide, current smoking and drinking, hypertension, CVD, dyslipidemia and drug use.
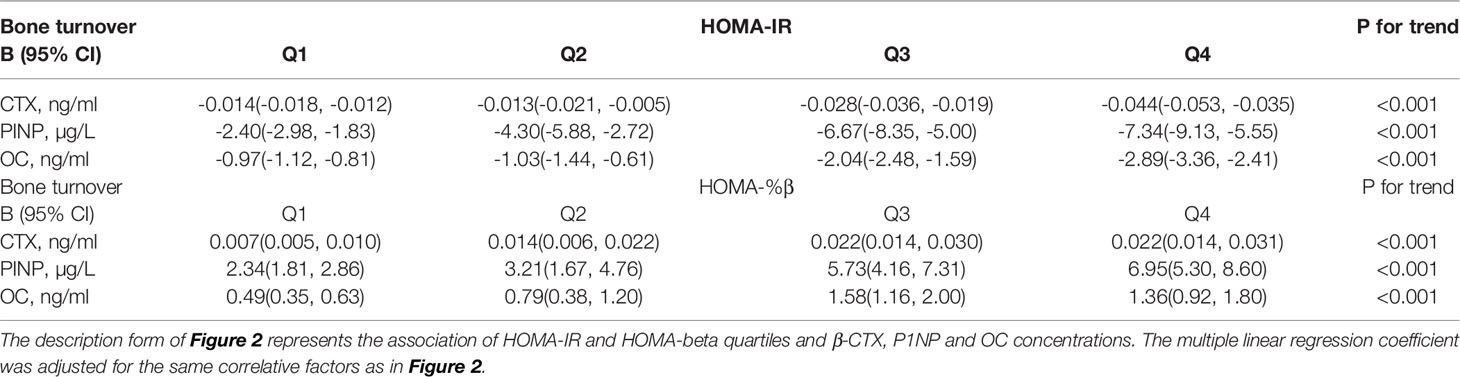
Table 2 The description table for Figure 2.
Thus, HOMA-IR was also negatively related to P1NP after adjusting for the same factors mentioned above [Q1: β -2.404, 95% CI: -2.978, -1.830; Q2: β -4.298, 95% CI: -5.878, -2.718; Q3:β -6.673, 95% CI: -8.351, -4.996; Q4: β -7.340, 95% CI: -9.130, -5.550; p for trend < 0.001; Figure 2B].
As displayed in Table 2 and Figure 2C, after full adjustment, HOMA-IR also had a negative relationship with OC [Q1: β -0.965, 95% CI: -1.116, -0.813; Q2: β -1.025, 95% CI: -1.442, -0.609; Q3:β -2.036, 95% CI: -2.478, -1.593; Q4: β -2.885, 95% CI: -3.357, -2.412; p for trend < 0.001; Figure 2C].
Association of HOMA Beta With Bone Markers in Diabetes Patients
As shown in Table 2, HOMA-%β had a positive relationship with the three bone markers after adjusting for sex, age, BMI, lipids, VitD, C-peptide, current smoking and drinking, hypertension, CVD, dyslipidemia and drug use.
CTX concentration increased when HOMA-%β quartiles increased [Q1: β 0.008, 95% CI: 0.005, 0.010; Q2: β 0.014, 95% CI: 0.006, 0.022; Q3:β 0.022, 95% CI: 0.014, 0.030; Q4: β 0.022, 95% CI: 0.014, 0.031; p for trend < 0.001. Figure 2D].
Thus, P1NP level had the same variation trend as HOMA-%β concentration [Q1: β 2.338, 95% CI: 1.813, 2.862; Q2: β 3.213, 95% CI: 1.671, 4.756; Q3:β 5.733, 95% CI: 4.156, 7.310; Q4: β 6.951, 95% CI: 5.300, 8.602; p for trend < 0.001. Figure 2E].
HOMA-%β concentration also had a positive relationship with OC [Q1: β 0.488, 95% CI: 0.348, 0.628; Q2: β 0.786, 95% CI: 0.376, 1.197; Q3:β 1.575, 95% CI: 1.155, 1.995; Q4: β 1.361, 95% CI: 0.921, 1.800; p for trend < 0.001. Figure 2F].
Discussion
Bone turnover is a product of the tightly coupled processes of bone formation and resorption, with the net balance between the two determining the bone mass and serum calcium level. This process requires the input of numerous hormones (such as parathormone, calcitonin and VitD), growth factors (growth hormone, IGF–1) and cytokines that interact at the level of osteoclasts and osteoblasts to regulate the balance between net resorption and formation (26). In this study, three typical biomarkers were selected for evaluation of the relationship between insulin resistance and pancreatic β-cell function in dysglycemia patients.
In this cross-sectional study, we reported the association of bone metabolism with insulin resistance and β-cell function in diabetic and hyperglycemic populations. The results suggest that β-CTX, P1NP and OC were negatively associated with HOMA-IR and positively associated with HOMA-%β. These results indicated that patients with higher bone metabolism have a lower prevalence of insulin resistance and better β-cell function. To the best of our knowledge, this is the first study to estimate the bone metabolism state in dysglycemia patients and emphasize the association of bone turnover biomarkers with insulin resistance and β-cell function in an investigation with a large community-dwelling sample.
Insulin signaling is an evolutionarily conserved pathway that plays a pivotal role in the regulation of metabolism and longevity, and bone is an insulin-responsive organ. In T2D, impaired insulin signaling in peripheral tissues leads to insulin resistance (27). Thus, metabolic disturbances associated with diabetes increase the risk of fragility fractures along with increased bone marrow adiposity. Bone marrow adipose tissue (BMAT) accounts for approximately 8% of the total fat mass, representing a significant fat accumulation site in adult humans. BMAT participates in regulating whole body energy metabolism through its ability to respond to insulin (28), activate Sirt1, which is a key cellular energy sensor, and induce a thermogenic gene program (29). In addition, BMAT also responds to insulin-sensitizing antidiabetic medications such as TZD drugs and PPARγ agonists (28, 30, 31). Therefore, when insulin resistance occurs, BMAT fills the interstitial bone, the microarchitecture deteriorates, and the structure of the trabecular bone undergoes early changes prior to the BMD decrease. This means that subclinical osteoporosis could happen without the detection of a low T-score for the lag effect. An early efficient method for determining bone loss is needed to facilitate preventive treatment among the population with insulin resistance.
The clinical usefulness of bone turnover biomarkers in the contemporary management of osteoporosis can be described as follows. On the one hand, it has been suggested that several of these markers can be used to target populations at increased risk for osteoporosis, assess the treatment effect of calcium supplements and predict the development of future fractures (32–34). On the other hand, their role in estimating BMD or bone loss in an individual patient has been revealed (32). Thus, there could exist an inner link for bone biomarkers to estimate the relationship between the process of osteoporosis and the function of pancreatic or insulin resistance. Previous research held the opinion that insulin resistance had a negative relationship with bone formation and a positive interrelation with bone resorption and that pancreatic function had the opposite relationship (35, 36). However, our results from this study showed that when IR was aggravated or β-cell function decreased, the metabolic disorders of bone agitated not only formation but also resorption. This would be due to the increasing requirements of the components of bone formation, and the process of bone resorption also accelerates to provide the materials to maintain the dynamic balance.
Currently, with the continuous aging of the global population and changes in modern lifestyle, type 2 diabetes mellitus and osteoporosis have become public health issues that always coexist. A recent study indicated an increased risk of brittle bone fracture as another concerning complication of diabetes (37). In addition to the most common complications, such as macrovascular disease, nephropathy, retinopathy, and peripheral neuropathy (38), osteoporotic fractures have a considerable impact on individual health as well as on the cost to society since they lead to a significant increase in not only overall mortality but also long-term morbidity and major disabilities (39, 40). Up to a point, it might be feasible to detect bone turnover biomarkers in dysglycemia patients with insulin resistance or with low-level β-cell function to predict the risk of osteoporosis along with BMD determination and the hazard of fracture. The dynamic excellence of biomarkers could be detected after a month of supplementation with therapy, and clinical intervention would perform better according to early feedback (40). Physicians could predict the curative effect within 3-6 months. Therefore, identifying glycemia patients at high risk for future fractures is significant in order to develop effective preventive treatment to reduce occurrence, relieve patients’ pain and lessen the expenses of long-term cure.
Finally, this study has several limitations. First, our study population came from seven communities in Shanghai, China. The results do not represent other regions in China or other ethnic groups. Second, the findings suggest a relationship between insulin resistance and bone metabolism without indicating causation; further prospective follow-up studies are needed. Third, it would be more convincing to detect bone mineral density along with bone turnover biomarkers to elucidate the progress of osteoporosis and the development of preventive treatment.
Conclusion
Insulin resistance and β-cell function were significantly associated with bone turnover in this cross-sectional study of a large population of dysglycemia participants. The three bone biomarkers decreased when insulin resistance was aggravated. When pancreatic β-cell function advanced, CTX, P1NP and OC were all elevated in combination. It might be feasible to detect bone turnover in abnormal glucose metabolism patients with insulin resistance or with low-level β-cell function to predict the risk of prevalence of osteoporosis along with determining BMD and the hazard of fracture. Therefore, it is significant to identify these populations at high risk for future fractures to develop effective preventive treatment to reduce occurrence, relieve patients’ pain and lessen the expenses of long-term cure.
Data Availability Statement
The raw data supporting the conclusions of this article will be made available by the authors, without undue reservation.
Ethics Statement
The studies involving human participants were reviewed and approved by the Ethics Committee of Shanghai Ninth People’s Hospital, Huangpu Branch of Shanghai Ninth People’s Hospital, Shanghai Jiaotong University School of Medicine.
Author Contributions
YL and ZA contributed to the conception and design of the study. HG and CW contributed to acquisition, analysis, and interpretation of data. HG, CW, BJ, SG, JC, YiZ, RY, KZ, and JZ drafted the article. NW, CZ, CC, LZ, TG, and YaZ critically revised the manuscript for important intellectual content. All authors contributed to the article and approved the submitted version.
Funding
This study was supported by National Natural Science Foundation of China (91857117); Science and Technology Commission of Shanghai Municipality (19140902400, 18410722300); the Major Science and Technology Innovation Program of Shanghai Municipal Education Commission (2019-01-07-00-01-E00059); Commission of Health and Family Planning of Pudong District (PWZxq2017-17); Municipal Human Resources Development Program for Outstanding Young Talents in Medical and Health Sciences in Shanghai (2017YQ053); Shanghai JiaoTong University School of Medicine (19XJ11007). The funders played no role in the design or conduct of the study, collection, management, analysis, or interpretation of data or in the preparation, review, or approval of the article.
Conflict of Interest
The authors declare that the research was conducted in the absence of any commercial or financial relationships that could be construed as a potential conflict of interest.
Acknowledgment
The authors thank all team members and the participants in the METAL study.
Abbreviations
T2DM, type 2 diabetes mellitus; IFG, impaired fasting glucose; IGT, impaired glucose tolerance; HbA1c, glycosylated hemoglobin A1c; IR, insulin resistance; HOMA, homeostatic model assessment; β-CTX, β-C-terminal telopeptide; P1NP, intact N -terminal propeptide of type I collagen; OC, osteocalcin; BMD, bone mineral density; BMI, body mass index; OGTT, oral glucose tolerance test; TC, total cholesterol; TG, triglycerides; HDL-C, high-density lipoprotein cholesterol; LDL-C, low-density lipoprotein cholesterol; VitD, Vitamin D; FPG, fasting plasma glucose; IGF-1, insulin-like growth factor-1; CVD, cardiovascular disease; CI, confidence interval; SD, standard deviation; BMAT, bone marrow adipose tissue; TZD, thiazolidinedione.
References
1. de Paula FJ, Horowitz MC, Rosen CJ. Novel insights into the relationship between diabetes and osteoporosis. Diabetes Metab Res Rev (2010) 26:622–30. doi: 10.1002/dmrr.1135
2. Khan MP, Singh AK, Joharapurkar AA, Yadav M, Shree S, Kumar H, et al. Pathophysiological mechanism of bone loss in type 2 diabetes involves inverse regulation of osteoblast function by PGC-1a and skeletal muscle atrogenes: AdipoR1 as a potential target for reversing diabetes-induced osteopenia. Diabetes (2015) 64:2609–23. doi: 10.2337/db14-1611
3. Janghorbani M, Van Dam RM, Willett WC, Hu FB. Systematic review of type 1 and type 2 diabetes mellitus and risk of fracture. Am J Epidemiol (2007) 166:495–505. doi: 10.1093/aje/kwm106
4. Aroor AR, McKarns S, Demarco VG, Jia G, Sowers JR. Maladaptive immune and inflammatory pathways lead to cardiovascular insulin resistance. Metabolism (2013) 62:1543–52. doi: 10.1016/j.metabol.2013.07.001
5. Harford KA, Reynolds CM, McGillicuddy FC, Roche HM. Fats, inflammation and insulin resistance: insights to the role of macrophage and T-cell accumulation in adipose tissue. Proc Nutr Soc (2011) 70:408–17. doi: 10.1017/S0029665111000565
6. Kindler JM, Pollock NK, Laing EM, Jenkins NT, Oshri A, Isales C, et al. Insulin Resistance Negatively Influences the Muscle-Dependent IGF-1-Bone Mass Relationship in Premenarcheal Girls. J Clin Endocrinol Metab (2016) 101:199–205. doi: 10.1210/jc.2015-3451
7. Wallace TM, Levy JC, Matthews DR. Use and Abuse of HOMA Modeling. Diabetes Care (2004) 27:1487–95. doi: 10.2337/diacare.27.6.1487
8. Matthews DR, Hosker JP, Rudenski AS, Naylor BA, Treacher DF, Turner RC. Homeostasis model assessment: insulin resistance and beta-cell function from fasting plasma glucose and insulin concentrations in man. Diabetologia (1985) 28:412–9. doi: 10.1007/BF00280883
9. Vestergaard P. Discrepancies in bone mineral density and fracture risk in patients with type 1 and type 2 diabetes–a meta-analysis. Osteoporos (2007) 18:427–44. doi: 10.1007/s00198-006-0253-4
10. Massera D, Biggs ML, Walker MD. Biochemical Markers of Bone Turnover and Risk of Incident Diabetes in Older Women: The Cardiovascular Health Study. Diabetes Care (2018) 9(41):1901–8. doi: 10.2337/dc18-0849
11. van Bommel EJM, Renate T. de Jongh, Myrte Brands. The osteoblast: Linking glucocorticoid-induced osteoporosis and hyperglycaemia? A post-hoc analysis of a randomised clinical trial. Bone (2018) 07:112173–6. doi: 10.1016/j.bone.2018.04.025
12. Starup-Linde J, Lykkeboe S, Gregersen S. Differences in biochemical bone markers by diabetes type and the impact of glucose. Bone (2016) 02:83149–55. doi: 10.1016/j.bone.2015.11.004
13. Zoch ML, Clemens TL, Riddle RC. New insights into the biology of osteocalcin. Bone (2016) 82:42–9. doi: 10.1016/j.bone.2015.05.046
14. Liu TT, Liu DM, Xuan Y, Zhao L, Sun L, Zhao D, et al. The association between the baseline bone resorption marker CTX and incident dysglycemia after 4 years. Bone Res (2017) 5:17020. doi: 10.1038/boneres.2017.20
15. Clowes JA, Allen HC, Prentis DM, Eastell R, Blumsohn A. Octreotide abolishes the acute decrease in bone turnover in response to oral glucose. J Clin Endocrinol Metab (2003) 88:4867–73. doi: 10.1210/jc.2002-021447
16. Trento LK, Pietropolli A, Ticconi C. Role of type I collagen C telopeptide, bone-specifific alkaline phosphatase and osteocalcin in the assessment of bone status in postmenopausal women. J Obstet Gynaecol Res (2009) 35:152–9. doi: 10.1111/j.1447-0756.2008.00868.x
17. Papakitsou EF, Margioris AN, Dretakis KE, Trovas G, Zoras U, Lyritis G, et al. Body mass index (BMI) and parameters of bone formation and resorption in postmenopausal women. Maturitas (2004) 47:185–93. doi: 10.1016/S0378-5122(03)00282-2
18. Stanczyk FZ, Hapgood JP, Winer S, Mishell DR Jr. Progestogens used in postmenopausal hormone therapy: differences in their pharmacological properties, intracellular actions, and clinical effects. Endocr Rev (2013) 34(2):171–208. doi: 10.1210/er.2012-1008
19. Wang Y, Wan H, Chen Y, Xia F, Zhang W, Wang C, et al. Association of C-peptide with diabetic vascular complications in type 2 diabetes. Diabetes Metab (2019) 04:pii:S12623636(19)30064–3. doi: 10.1016/j.diabet.2019.04.004
20. Zhou BF, Cooperative Meta-analysis Group of Working Group on Obesity in China. Predictive values of body mass index and waist circumference for risk factors of certain related diseases in Chinese adults – Study on optimal cut-off points of body mass index and waist circumference in Chinese adults. Biomed Environ Sci (2002) 15:83–96. doi: 10.1046/j.1440-6047.11.s8.9.x
21. Xu Y, Wang L, He J, Bi Y, Li M, Wang T, et al. Prevalence and control of diabetes in Chinese adults. JAMA (2013) 310:948–59. doi: 10.1001/jama.2013.168118
22. Expert Panel on Detection E, Treatment of High Blood Cholesterol in A. Executive summary of the third report of the National Cholesterol Education Program (NCEP) Expert Panel on Detection, Evaluation, and treatment of high blood cholesterol in adults (Adult Treatment Panel III). JAMA (2001) 285:2486–97. doi: 10.1001/jama.285.19.2486
23. Lann D, LeRoith D. Insulin resistance as the underlying cause for the metabolic syndrome. Med Clin North Am (2007) 91:1063–77. doi: 10.1016/j.mcna.2007.06.012
24. Antuna-Puente B, Disse E, Rabasa-Lhoret R, Laville M, Capeau J, Bastard JP. How can we measure insulin sensitivity/resistance? Diabetes Metab (2011) 37:179–88. doi: 10.1016/j.diabet.2011.01.002
25. Mojiminiyi OA, Abdella NA. Effect of homeostasis model assessment computational method on the definition and associations of insulin resistance. Clin Chem Lab Med (2010) 48:1629–34. doi: 10.1515/CCLM.2010.303
26. Soliman AT, Banna NE, Fattah MA, ElZalabani MM, Ansari BM. Bone mineral density in prepubertal children with beta thalassemia: correlation with growth and hormonal data. Metabolism (1998) 47:541–8. doi: 10.1016/S0026-0495(98)90237-2
27. Tencerova M, Okla M, Kassem M. Insulin Signaling in Bone Marrow Adipocytes. Curr Osteoporosis Rep (2019) 17:446–54. doi: 10.1007/s11914-019-00552-8
28. Zhu L, Xu Z, Li G, Wang Y, Li X, Shi X, et al. Marrow adiposity as an indicator for insulin resistance in postmenopausal women with newly diagnosed type 2 diabetes - an investigation by chemical shift-encoded water-fat MRI. Eur J Radiol (2019) 113:158–64. doi: 10.1016/j.ejrad.2019.02.020
29. Artsi H, Gurt I, El-Haj M, Muller R, Kuhn GA, Ben Shalom G, et al. Sirt1 promotes a thermogenic gene program in bone marrow adipocytes: from mice to (wo)men. Front Endocrinol (Lausanne) (2019) 10:126. doi: 10.3389/fendo.2019.00126
30. Hawkes CP, Mostoufi-Moab S. Fat-bone interaction within the bone marrow milieu: impact on hematopoiesis and systemic energy metabolism. Bone (2019) 119:57–64. doi: 10.1016/j.bone.2018.03.012
31. Li Y, Meng Y, Yu X. The unique metabolic characteristics of bone marrow adipose tissue. Front Endocrinol (Lausanne) (2019) 10:69. doi: 10.3389/fendo.2019.00069
32. Garnero P, Hausherr E, Chapuy MC, Marcelli C, Grandjean H, Muller C, et al. Markers of bone resorption predict hip fracture in elderly women: The EPIDOS prospective study. J Bone Miner Res (1996) 11:1531–8. doi: 10.1002/jbmr.5650111021
33. Ross P, Knowlton W. Rapid bone loss is associated with increased levels of biochemical markers. J Bone Miner Res (1998) 13:297–302. doi: 10.1359/jbmr.1998.13.2.297
34. Ravn P, Rix M, Andreassen H, Clemmensen B, Bidstrup M, Gunnes M. High bone turnover is associated with low bone mass and spinal fracture in postmenopausal women. Calcif Tissue Int (1997) 60:255–60. doi: 10.1007/s002239900225
35. Potikanond S, Rattanachote P, Pintana H, Suntornsaratoon P, Charoenphandhu N, Chattipakorn N, et al. Obesity does not aggravate osteoporosis or osteoblastic insulin resistance in orchiectomized rats. J Endocrinol (2016) 228:85–95. doi: 10.1530/JOE-15-0333
36. Viljakainen HT, Koistinen HA, Tervahartiala T, Sorsa T, Andersson S, Makitie O. Metabolic milieu associates with impaired skeletal characteristics in obesity. PLoS One (2017) 12(6):e0179660. doi: 10.1371/journal.pone.0179660
37. Liao CC, Lin CS, Shih CC, Yeh CC, Chang YH, Lee YW, et al. Increased risk of fracture and postfracture adverse events in patients with diabetes: Two nationwide population-based retrospective cohort studies. Diabetes Care (2014) 37:2246–52. doi: 10.2337/dc13-2957
38. Jackuliak P, Payer J. Osteoporosis, fractures, and diabetes. Int J Endocrinol (2014) 2014:820615. doi: 10.1155/2014/820615
39. Kamel HK, O’Connell MB. Introduction: Postmenopausal osteoporosis as a major public health issue. J Manag Care Pharm (2006) 12(6 Suppl A):2–3. doi: 10.18553/jmcp.2006.12.S6-A.S4
Keywords: insulin resistance, β-cell function, homeostatic model assessment, turnovers, β-CTX, P1NP, osteocalcin
Citation: Guo H, Wang C, Jiang B, Ge S, Cai J, Zhou Y, Ying R, Zha K, Zhou J, Wang N, Zhu C, Cao C, Zhang L, Gu T, Zhao Y, Lu Y and An Z (2021) Association of Insulin Resistance and β-cell Function With Bone Turnover Biomarkers in Dysglycemia Patients. Front. Endocrinol. 12:554604. doi: 10.3389/fendo.2021.554604
Received: 22 April 2020; Accepted: 04 March 2021;
Published: 25 March 2021.
Edited by:
Camille Parsons, MRC Lifecourse Epidemiology Unit (MRC), United KingdomReviewed by:
Michael Edwin Edmonds, King’s College Hospital NHS Foundation Trust, United KingdomCheng Hu, Shanghai Jiao Tong University, China
Longpo Zheng, Shanghai Tenth People’s Hospital, Tongji University, China
Copyright © 2021 Guo, Wang, Jiang, Ge, Cai, Zhou, Ying, Zha, Zhou, Wang, Zhu, Cao, Zhang, Gu, Zhao, Lu and An. This is an open-access article distributed under the terms of the Creative Commons Attribution License (CC BY). The use, distribution or reproduction in other forums is permitted, provided the original author(s) and the copyright owner(s) are credited and that the original publication in this journal is cited, in accordance with accepted academic practice. No use, distribution or reproduction is permitted which does not comply with these terms.
*Correspondence: Zengmei An, YW0zMjcub2tAMTYzLmNvbQ==; Yingli Lu, bHV5aW5nbGkyMDA4QDEyNi5jb20=
†These authors have contributed equally to this work