 Chittari Venkata Harinarayan
 Harinarayan Akhila
 Edara Shanthisree1
- 1Institute of Endocrinology, Diabetes, Thyroid and Osteoporosis Disorders, Sakra World Hospitals, Bangalore, India
- 2Department of Medicine & Endocrinology, Saveetha Medical College, Saveetha Institute of Medical and Technical Sciences University, Chennai, India
- 3IT Industry—Digital Transformation, Information Services Group (ISG), Bangalore, India
Calcium and vitamin D are inseparable nutrients required for bone health. In the past half a century, the dietary calcium intake of rural, tribal, and urban India has declined. Though India is the largest producer of milk and cereals, the major source of calcium in India is through non-dairy products. The highest intake of cereals and lowest intake of milk & milk products was observed in rural and tribal subjects whereas, the intake of cereals, milk & milk products were similar in both urban and metropolitan subjects. One of the reasons for lower calcium intake was the proportion of calcium derived from dairy sources. Over the past half a century, the average 30-day consumption of cereals in the rural and urban population has declined by 30%. The Per Capita Cereal Consumption (PCCC)has declined despite sustained raise in Monthly Per capita Consumption Expenditure (MPCE) in both rural and urban households. The cereal consumption was the highest in the lowest income group, despite spending smaller portion of their income, as cereals were supplied through public distribution system (PDS). About 85% of the Indian population are vitamin D deficient despite abundant sunlight. Dietary calcium deficiency can cause secondary vitamin D deficiency. Though India as a nation is the largest producer of milk, there is profound shortage of calcium intake in the diet with all negative consequences on bone health. There is a decline in dietary calcium in the background of upward revision of RDI/RDA. There is a gap in the production-consumption-supply chain with respect to dietary calcium. To achieve a strong bone health across India, it is imperative to have population based strategies addressing different segments including supplementing dietary/supplemental calcium in ICDS, mid-day-meals scheme, public distribution system, educational strategies. Other measures like mass food fortification, biofortification, bioaddition, leveraging digital technologies, investments from corporate sector are some measures which can address this problem. India is a vast country with diverse social, cultural and dietary habits. No single measure can address this problem and requires a multi-pronged strategic approach to tackle the dietary calcium deficiency to achieve strong bone health while solving the problem of nutritional deficiency.
Introduction
Billions of years ago, life originated in the primordial seas near volcanic craters where the ionic calcium concentration of the ocean was stable, at about 10 mM. During the course of evolution, calcium became more intracellular for complex cellular functioning (1–3). The evolution of parathyroid hormone (PTH) and vitamin D endocrine system regulated calcium homeostasis and phosphatonin-FGF23 which is the major regulator of serum phosphate homeostasis (4, 5).
Vitamin D is found in phytoplankton and zooplankton. Phytoplankton is a major part of food chain of many fish (6–12). From amphibian onwards, vitamin D endocrine system is an important regulator of calcium (for the calcified skeleton) while moving from calcium-rich ocean to calcium-poor terrestrial environment. Evolutionally, this coincides with creation of bone cells-osteocytes which regulate mineral homeostasis, mechanical sensing and production of hormones. The fully developed vitamin D endocrine system comprises of specific nuclear receptor (NR), enzyme C-450 family which metabolizes vitamin D and specific high affinity, high capacity vitamin D binding protein for extracellular transport system (11, 12).
The lifestyle of homo-sapiens transited from a hunter-gatherer, to animal and plant domesticator 12-8 k.y.a (thousands of years ago), while transiting from Paleolithic to Neolithic period (13). For the Neolithic humans, cow milk provided twice as much calcium than their Paleolithic predecessors (14). During the agrarian revolution, cereals and legumes became major source of calcium and energy, however, they were rich in anti-nutrients, phytates, oxalates which diminish calcium absorption (15, 16). The agrarian revolution occurring at various locations was associated with crowding of people in cities and increase in dietary calcium. In western countries, milk has been a major source of calcium (35%–70% of dietary calcium) (17).
Calcium-Vitamin D Endocrine System
Vitamin D3 synthesized in the skin undergoes successive sequential hydroxylations in the liver and kidney to be converted to its active form1,25 dihydroxyvitamin D3(1,25OHD3) which helps in calcium absorption from the gut and mineralization of the skeleton. The secondary hyperparathyroidism(SHPT) which is an accompaniment of low dietary calcium leashes the bones to maintain normal serum calcium. This SHPT leads to increased catabolism of 25 Hydroxyvitamin D (25OHD) leading to secondary vitamin D deficiency (Figure 1) (18, 19). Thus, vitamin D is a key factor adjusting the demand/supply of calcium at adolescent growth spurt or at weaning, whenever dietary calcium intake may fall or bone accretion rates may maximize. Calcium absorption during pregnancy is possibly dependant on estrogens and appears to be independent of vitamin D (20).
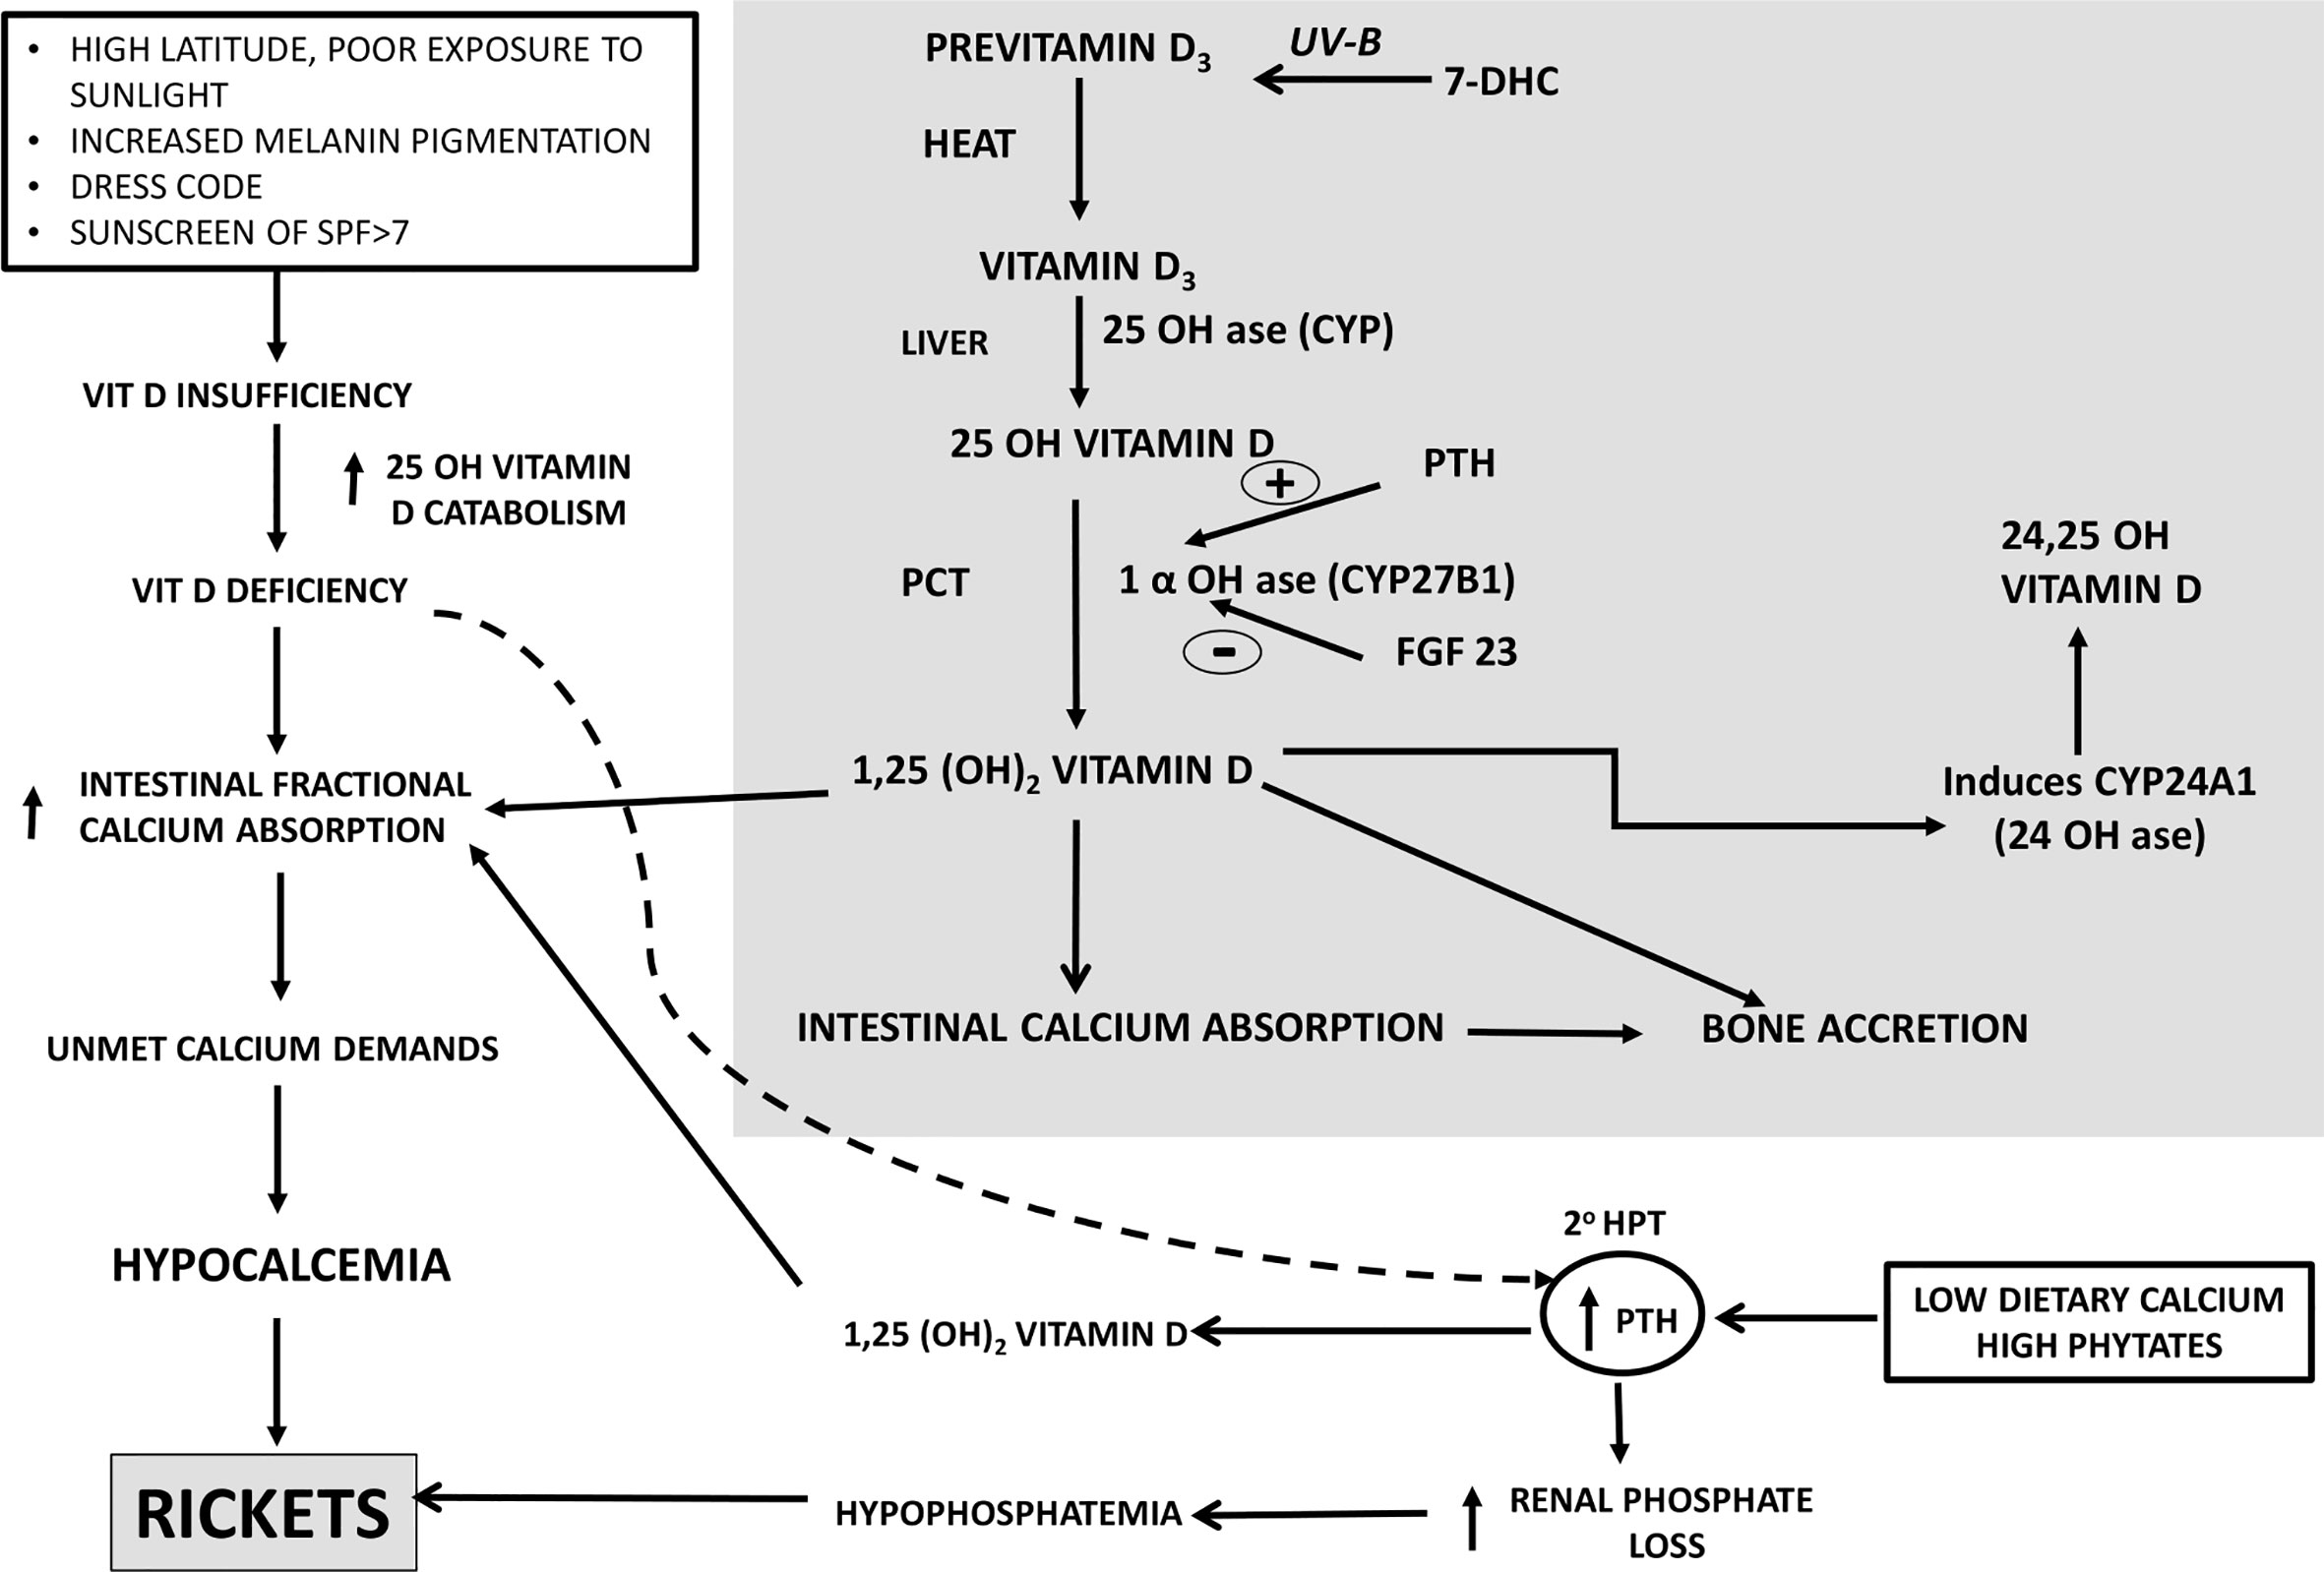
Figure 1 Calcium-Vitamin D-PTH endocrine axis in health during calcium and/or vitamin D deprivation. PTH, Parathyroid Hormone, 20 HPT, secondary hyperparathyroidism, SPF, Skin Protection Factor.
Nutritional rickets is a major global public health problem which has an impact on health of infants, children, adults and ramifications persist into adulthood. Nutritional rickets (NR) can be due to calcium deficiency and/or secondary to vitamin deficiency (Figure 1). The clinical features associated with NR are: a) non osseous features- poor linear growth and failure to thrive, muscle weakness, delayed motor development, tetany, hypocalcemic seizures, hypocalcemic dilated cardiomyopathy and raised intracranial pressure; b) osseous symptoms and signs- bone pains, craniotabes, frontal bossing, delayed closure of fontanelle and eruption of tooth, rachitic rosary, swelling of wrist and ankles, leg deformity; c) cupping, fraying, splaying of metaphysis, widening of growth plates, low bone mineral density(BMD), pseudo fractures, pelvic deformities, pelvic outlet narrowing (19, 20).
In many developing countries, across tropical and subtropical regions, NR remains a major health problem amongst infants, young children, adolescents. Lack of sunlight exposure, changing lifestyles(use of SPF>7), social customs limiting skin exposure to sunlight, atmospheric pollution remain the leading causes of vitamin D deficiency. There are reports of rickets developing in children with low calcium intake. The dietary intake of calcium of these children in developing countries is ~1/3–1/2 of Recommended Dietary Intake(RDI) (20). When the calcium intake is low, body adapts by increasing intestinal fractional absorption and reducing renal calcium excretion. When vitamin D insufficiency is associated with low dietary calcium intake, they act synergistically to exacerbate development of rickets (Figure 1). Lack of dietary calcium for prolonged duration in adults leads to low BMD. This is more pronounced in population where the inadequacy of calcium persists from childhood, adolescent and adults leading to low peak bone mass.
Methodology
In this presentation, we review the nutritional status of India in the past half century, changes in milk and cereal production and consumption while documenting trends in consumption expenditure. The article also emphasizes the interaction between vitamin D and calcium deficiencies and point to inadequacies in the recent Recommended Dietary Allowances (RDA) of Indian council of Medical research and Nation institute of Nutrition (ICMR-NIN). Second part of the article emphasizes existing strategies by the government of India, their shortfall and the remedial measures. Role of e-health and m-health in combating these problems are discussed.
Historical Perspective of Nutritional Status in India—Post Independence
In the second half of 18th century, in the West, beginning of industrial revolution was associated with rickets due to industrial air pollution. With transition to digital age, there is further diminution of UV exposure in humans. In the late 19th and early 20th century, more than 80% of children living in the West had growth deformities and features of rickets (21). During this period, the West went through industrial revolution, while India was suffering due to poverty and famine. Post-independence(1947), millions of households did not have even two square meals a day. The immediate goal for the country was to achieve availability of cereals. With this background, we analyze the nutritional status of India in post-independence era. This analysis emphasizes the dietary calcium deficiency of various age groups in different regions of India and their dietary habits.
Nutrition Trends India 1957–2017
Rural Survey: National Nutrition Monitoring Bureau
The consumption of cereals, millets, milk & milk products across all age groups was below the RDI among children, adolescents, men and women-non pregnant, pregnant, lactating and elderly (Table 1; Figure 2) (22, 23) The state wise distribution is detailed in Figures 2A–L. The milk production per capita availability and consumption for the corresponding period of the survey (2011–2012) is shown in Figure 2G.
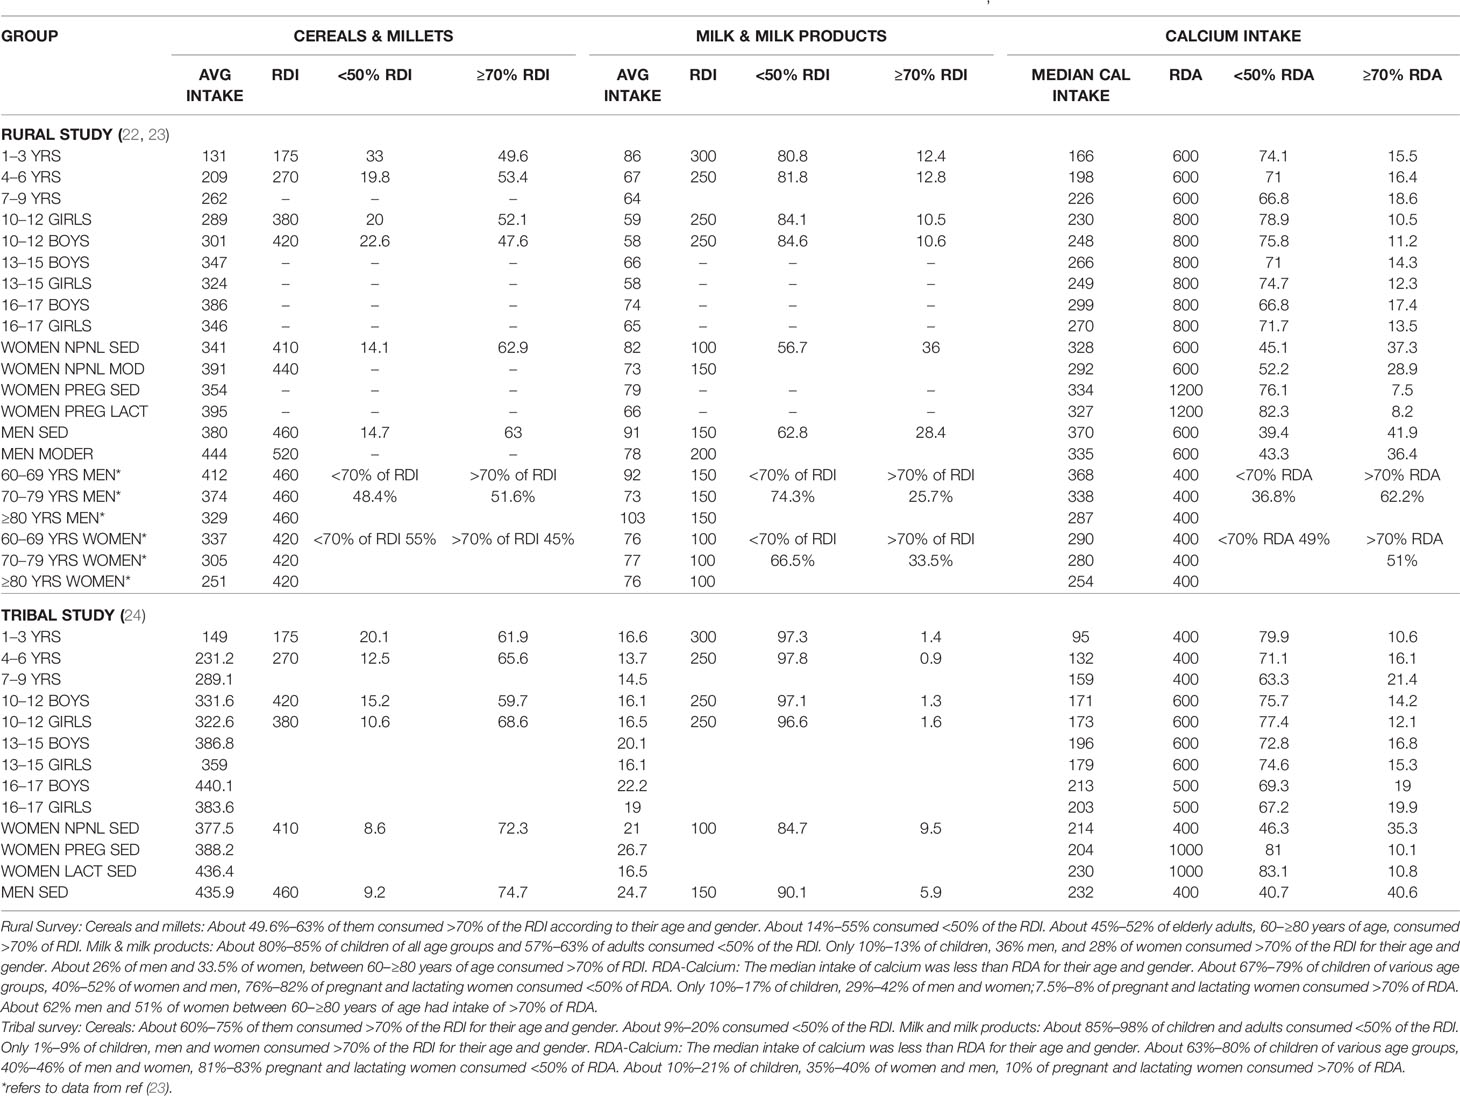
Table 1 Table depicting RDI of cereals, millets, milk and milk products, and RDA of calcium intake across various age groups in rural survey (22, 23) and tribal survey (24).
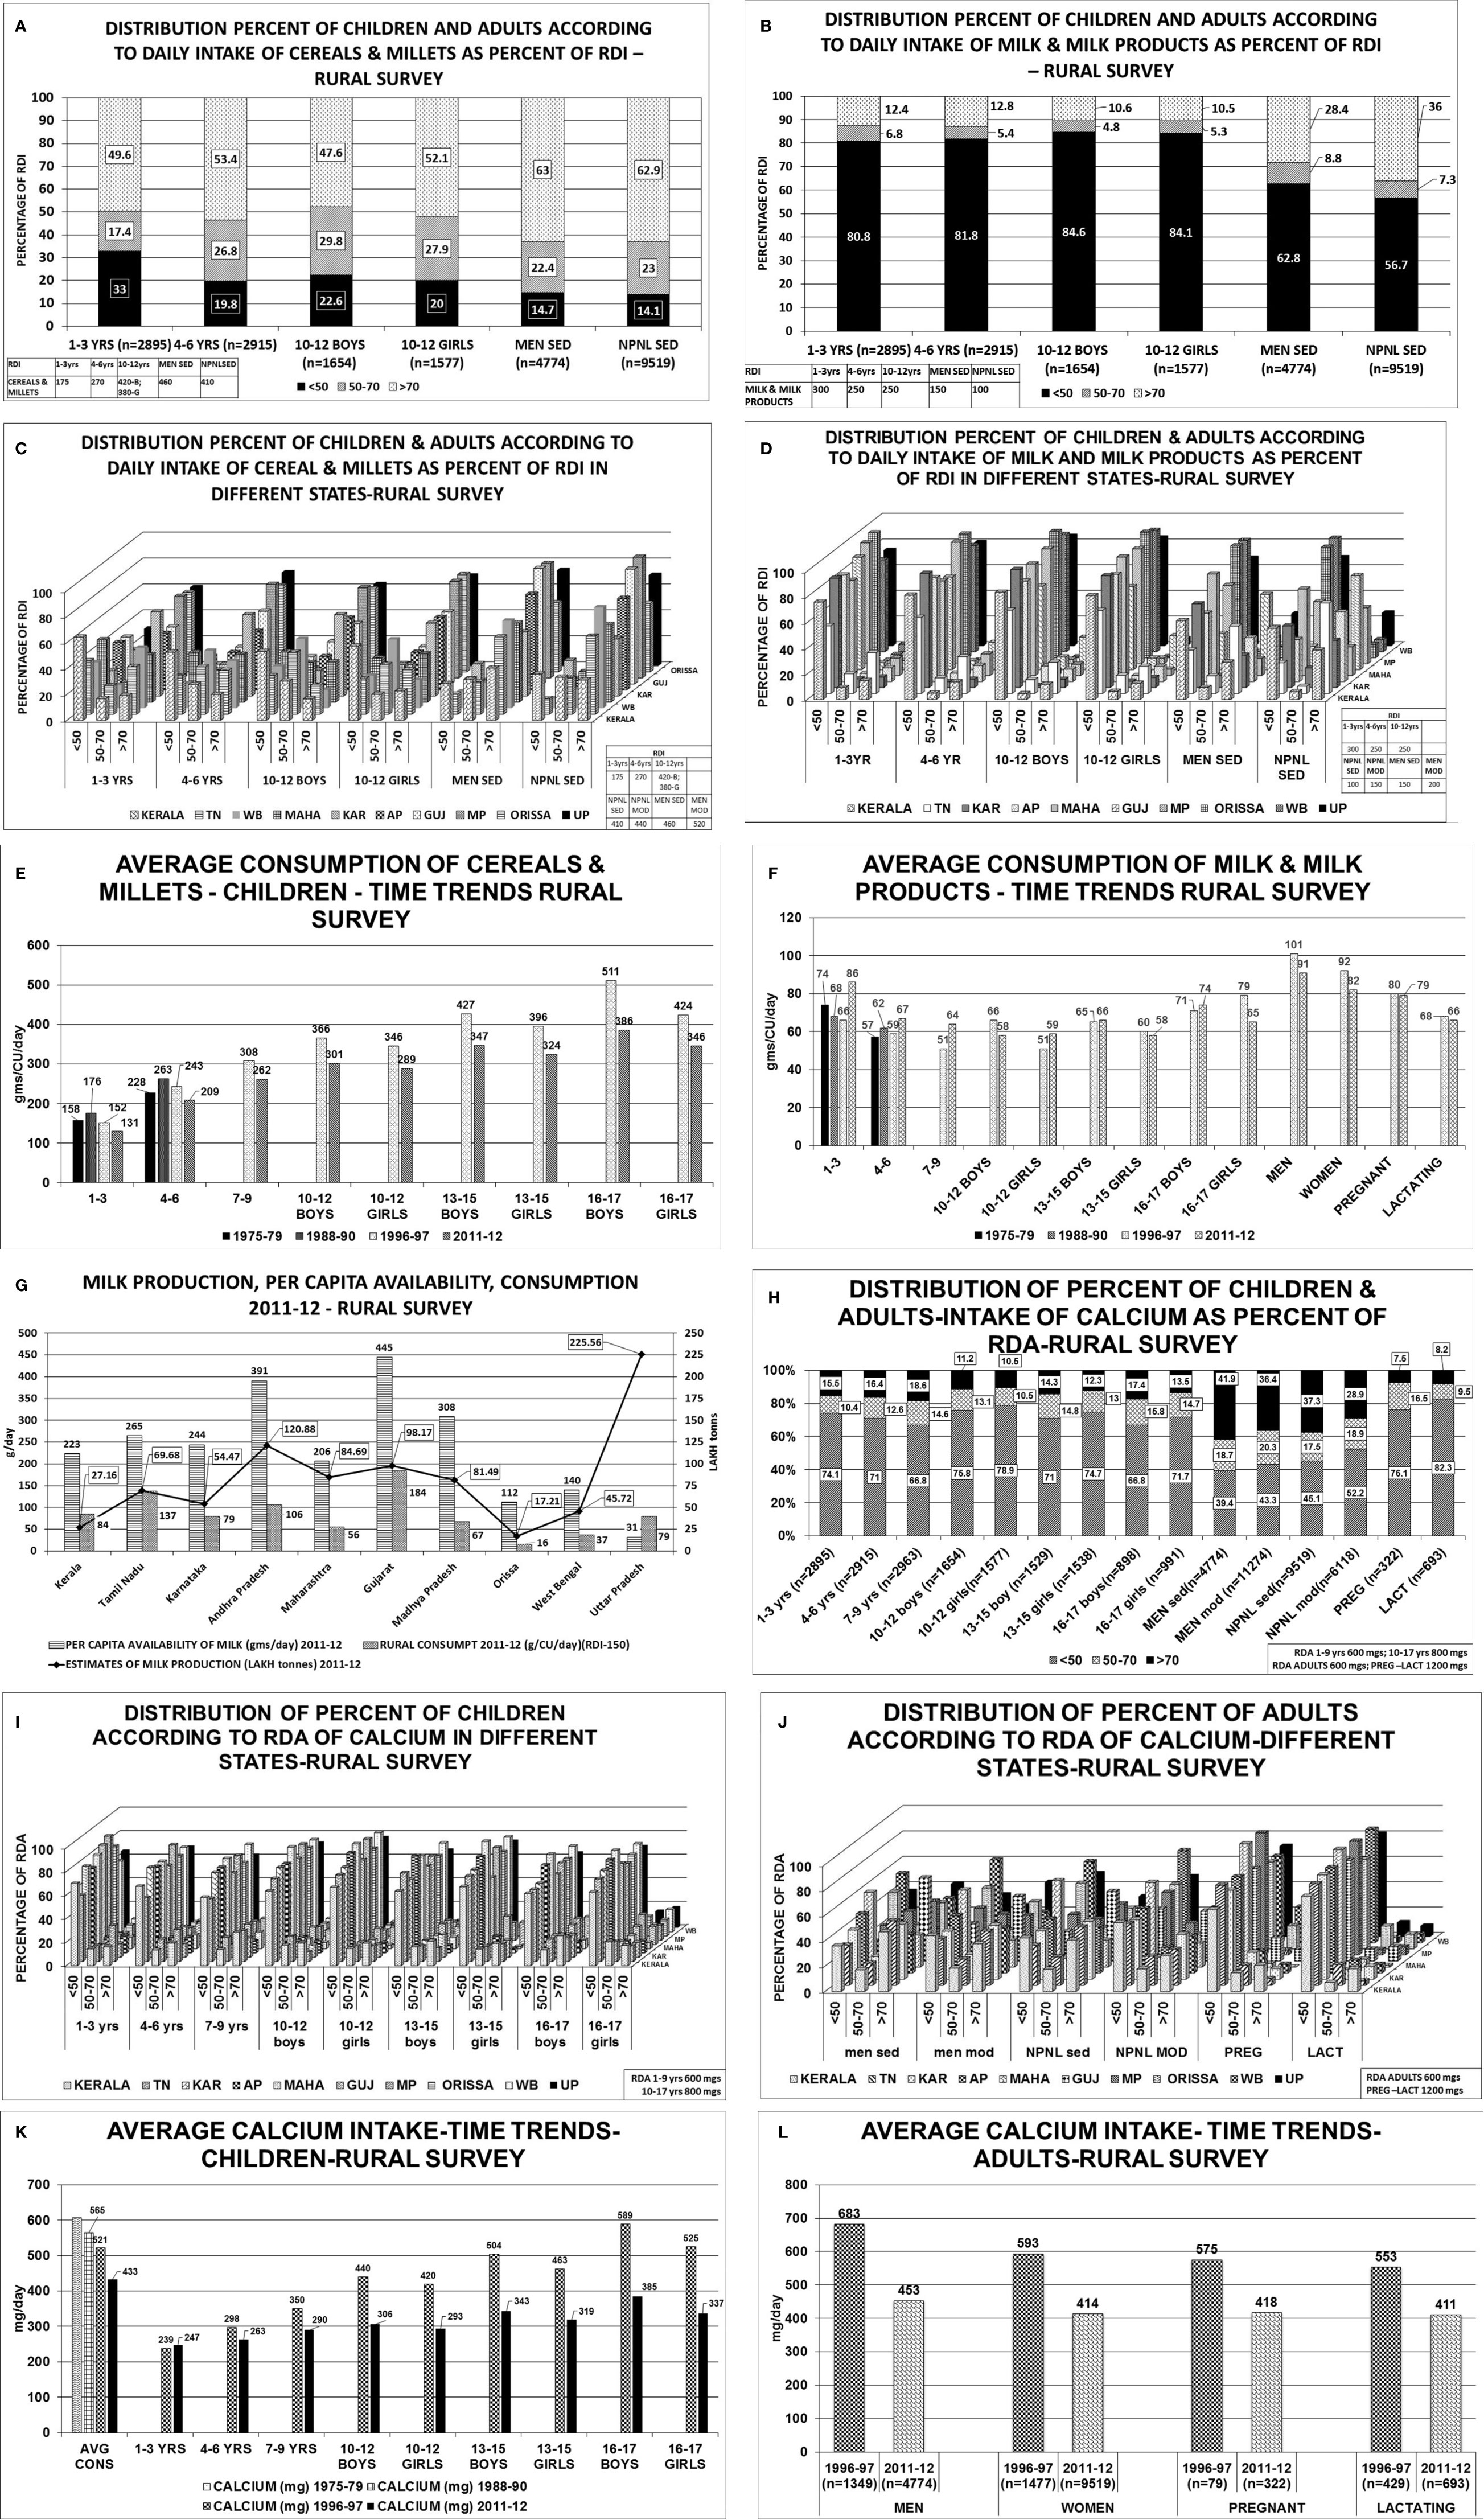
Figure 2 Rural survey (Table 1) (22): (A) Distribution percent of children and adults according to daily intake of cereals & millets as percent of RDI. B Distribution percent of children and adults according to daily intake of milk & milk products as percent of RDI. (C) Distribution percent of children and adults according to daily intake of cereals & millets as percent of RDI in different states. children 1–3 years consumed >70% of RDI. The highest consumption of >70% of RDI was seen in Karnataka, MP, Orissa, 61%–65% in UP, 36%–45% in TN, AP, Gujarat, WB and only 19% in Kerala. Similar trend was seen in children with 4–6 years, 10–12 years boys & girls. More than 2/3 of men from Karnataka, AP, Gujarat, Orissa, UP consumed >70% of RDI of cereals & millets, 50-60% in TN, Maharashtra, WB and only 40% of subjects from Kerala. Similarly, >60% of women from TN, Karnataka, AP, Gujarat, MP, Orissa, UP consumed >70% of the RDI and the lowest was 31% from Kerala. (D) Distribution percent of children and adults according to daily intake of milk & milk products as percent of RDI in different states. 1–3 years children- 75-95% of children from Karnataka, AP, Gujarat, MP and Orissa consumed <50% of the RDI, except TN-with 53%. Less than 10% of children from the above states consumed >70% of RDI(TN-31.8%). Only 0.4% of children from Orissa consumed >70% of milk & milk products. Similar trend was seen in children 4–6 years, 10–12 years boys & girls. 65%–90% of men consumed <50% of RDI of milk & milk products. More than 70% of RDI consumption was seen in TN(53%), Gujarat(59%), Kerala(29%). (E) Average consumption of cereals & millets- Time trends showing a decline in consumption of cereals & millets by 20% in the past 4 decades. (F) Average consumption of milk & milk products- Time trends showing a decline in consumption of milk & milk products in the past 4 decades. (G) Graph depicting milk production and per capita availability for year 2011–2012. The consumption data of the rural survey for year 2011–2012 is superposed. Graph clearly depicts the low consumption of milk despite adequate availability. (H) Distribution of percent of children & adults–intake of calcium as percent of RDA. (I) Distribution of percent of children according to RDA of calcium in different states. Between 70%–85% of children, adolescent boys & girls of all the states have low calcium intake (<50% of RDA). Less than 15% of children (1–3 years) from Kerala, Karnataka, AP, Maharashtra, Gujarat, MP, Orissa, and 25%–30% of children from TN, WB and UP had intake of >70% of RDA. Similar pattern was seen in 4–6 years, 10–12 years boys & girls age group, only 10%–12% of subjects from all the states of age group 13–15 years boys & girls had an RDA of calcium >70%. (J) Distribution of percent of adults according to RDA of calcium in different states. Sedentary men-51 and 65% of subjects from TN, Gujarat and 25%–35% of subjects from AP, Maharashtra and Orissa had a calcium intake of >70% of RDA. Moderately active men->70% of RDA of calcium was met with by 35%–42% of the subjects from all states except Gujarat(50.8%), Maharashtra and WB (21%). Amongst the non-pregnant women 35%–45% of subjects from all states, except Gujarat (55%) and WB (27%), met with >70% of RDA of calcium. Uniformly, only 25%–35% of subjects of moderately active non-pregnant women met with adequate RDA of >70% with exception of Maharashtra (19%) and WB (16%). Less than 10% of pregnant women of all states except Kerala (21%) met with RDA limit of >70%. 65%–75% of them had RDA of <50% except Maharashtra (97%) and MP (96%). Similar scenario seen in lactating women. (K) Average calcium intake children time trends showing a decline in calcium intake over the past 4 decades. (L) Average calcium intake adults time trends showing a decline in calcium intake over the past 4 decades. RDI-Recommended Daily Dietary Intake; RDA-Recommended Daily Dietary Allowance; HH- Households; B-Boys; G-girls; WOMEN NPNL SED-women: non-pregnant, non-lactating and sedentary; WOMEN NPNL MOD-women: non-pregnant non-lactating and moderate; WOMEN PREG SED-women: pregnant and sedentary; WOMEN PREG LACT-women: pregnant and lactating; MEN SED-men: sedentary; MEN MOD-men: moderate; TN-Tamil Nadu; WB-West Bengal; MAHA-Maharashtra; KAR-Karnataka; AP-Andhra Pradesh; GUJ-Gujarat; MP-Madhya Pradesh; UP-Uttar Pradesh.
TRIBAL SURVEY-NNMB
The consumption of cereals, millets, milk & milk products across all age groups was below the RDI among children, adolescents, men, women-non pregnant, pregnant, lactating, and elderly (Table 2; Figure 3) (24). The state wise distribution is detailed in Figures 3C, D. The milk production per capita availability and consumption for the corresponding period of the survey (2007–2008) is shown in Figure 3G.
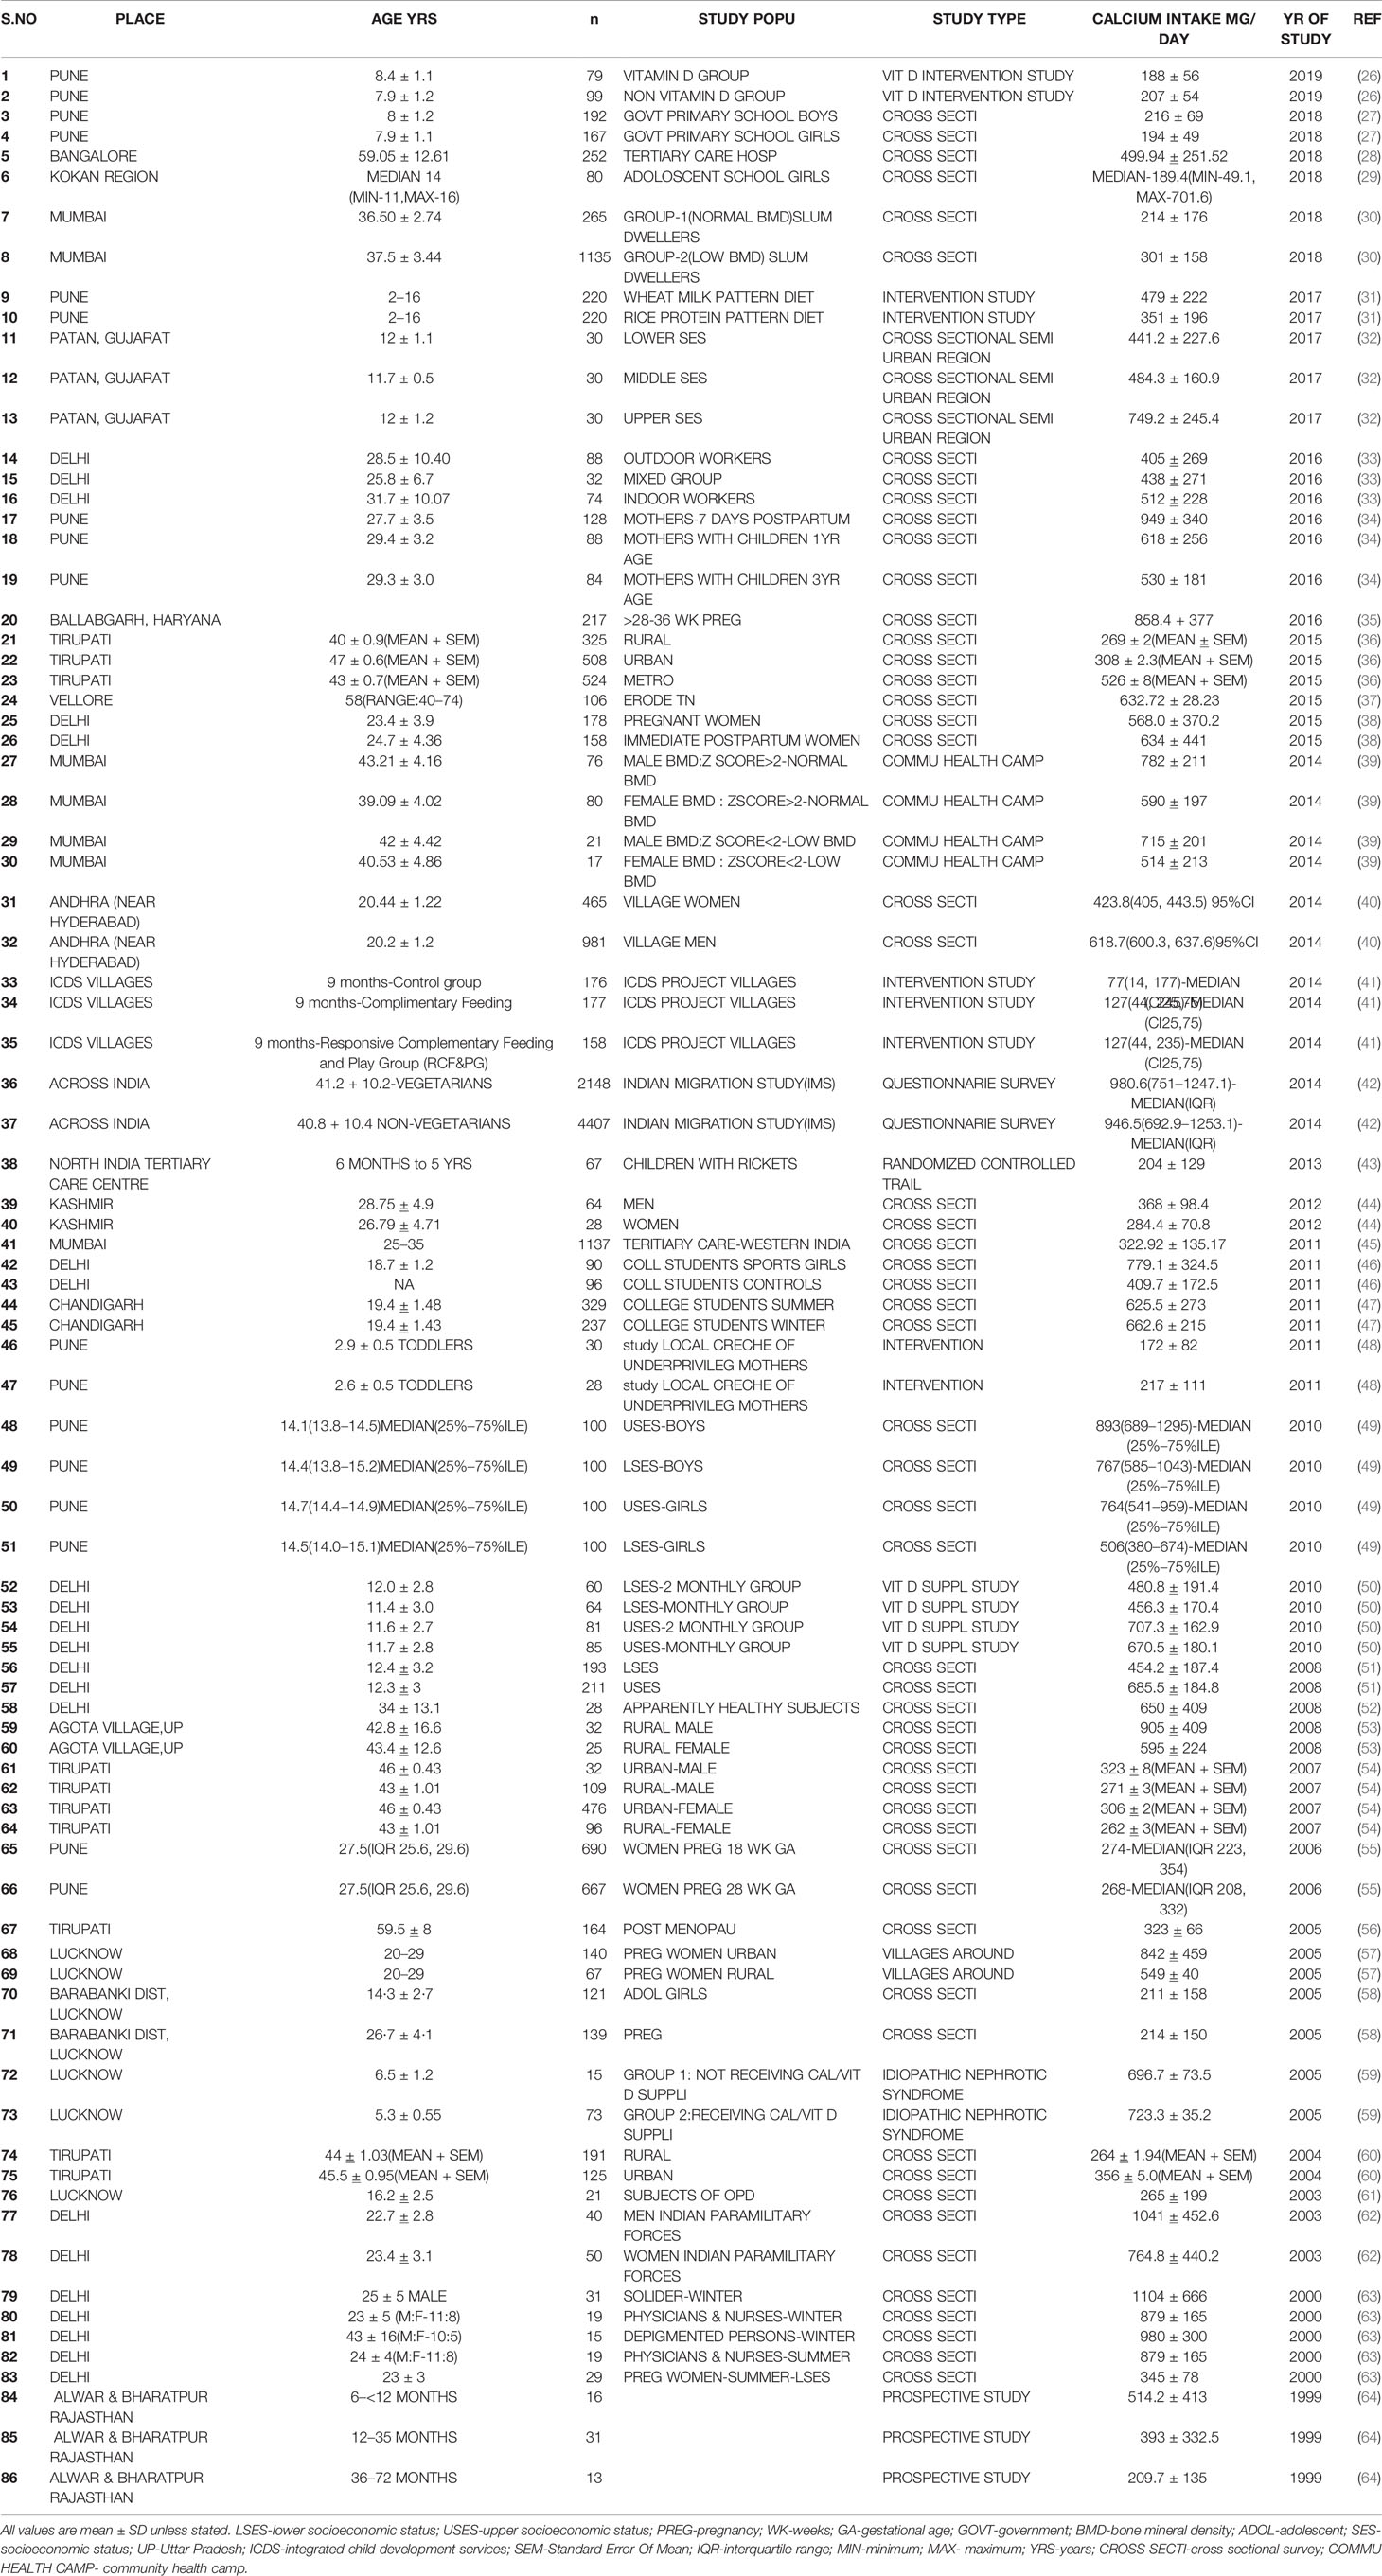
Table 2 Table showing dietary calcium intake of different age groups and various study population across the country from 1999 to 2019.
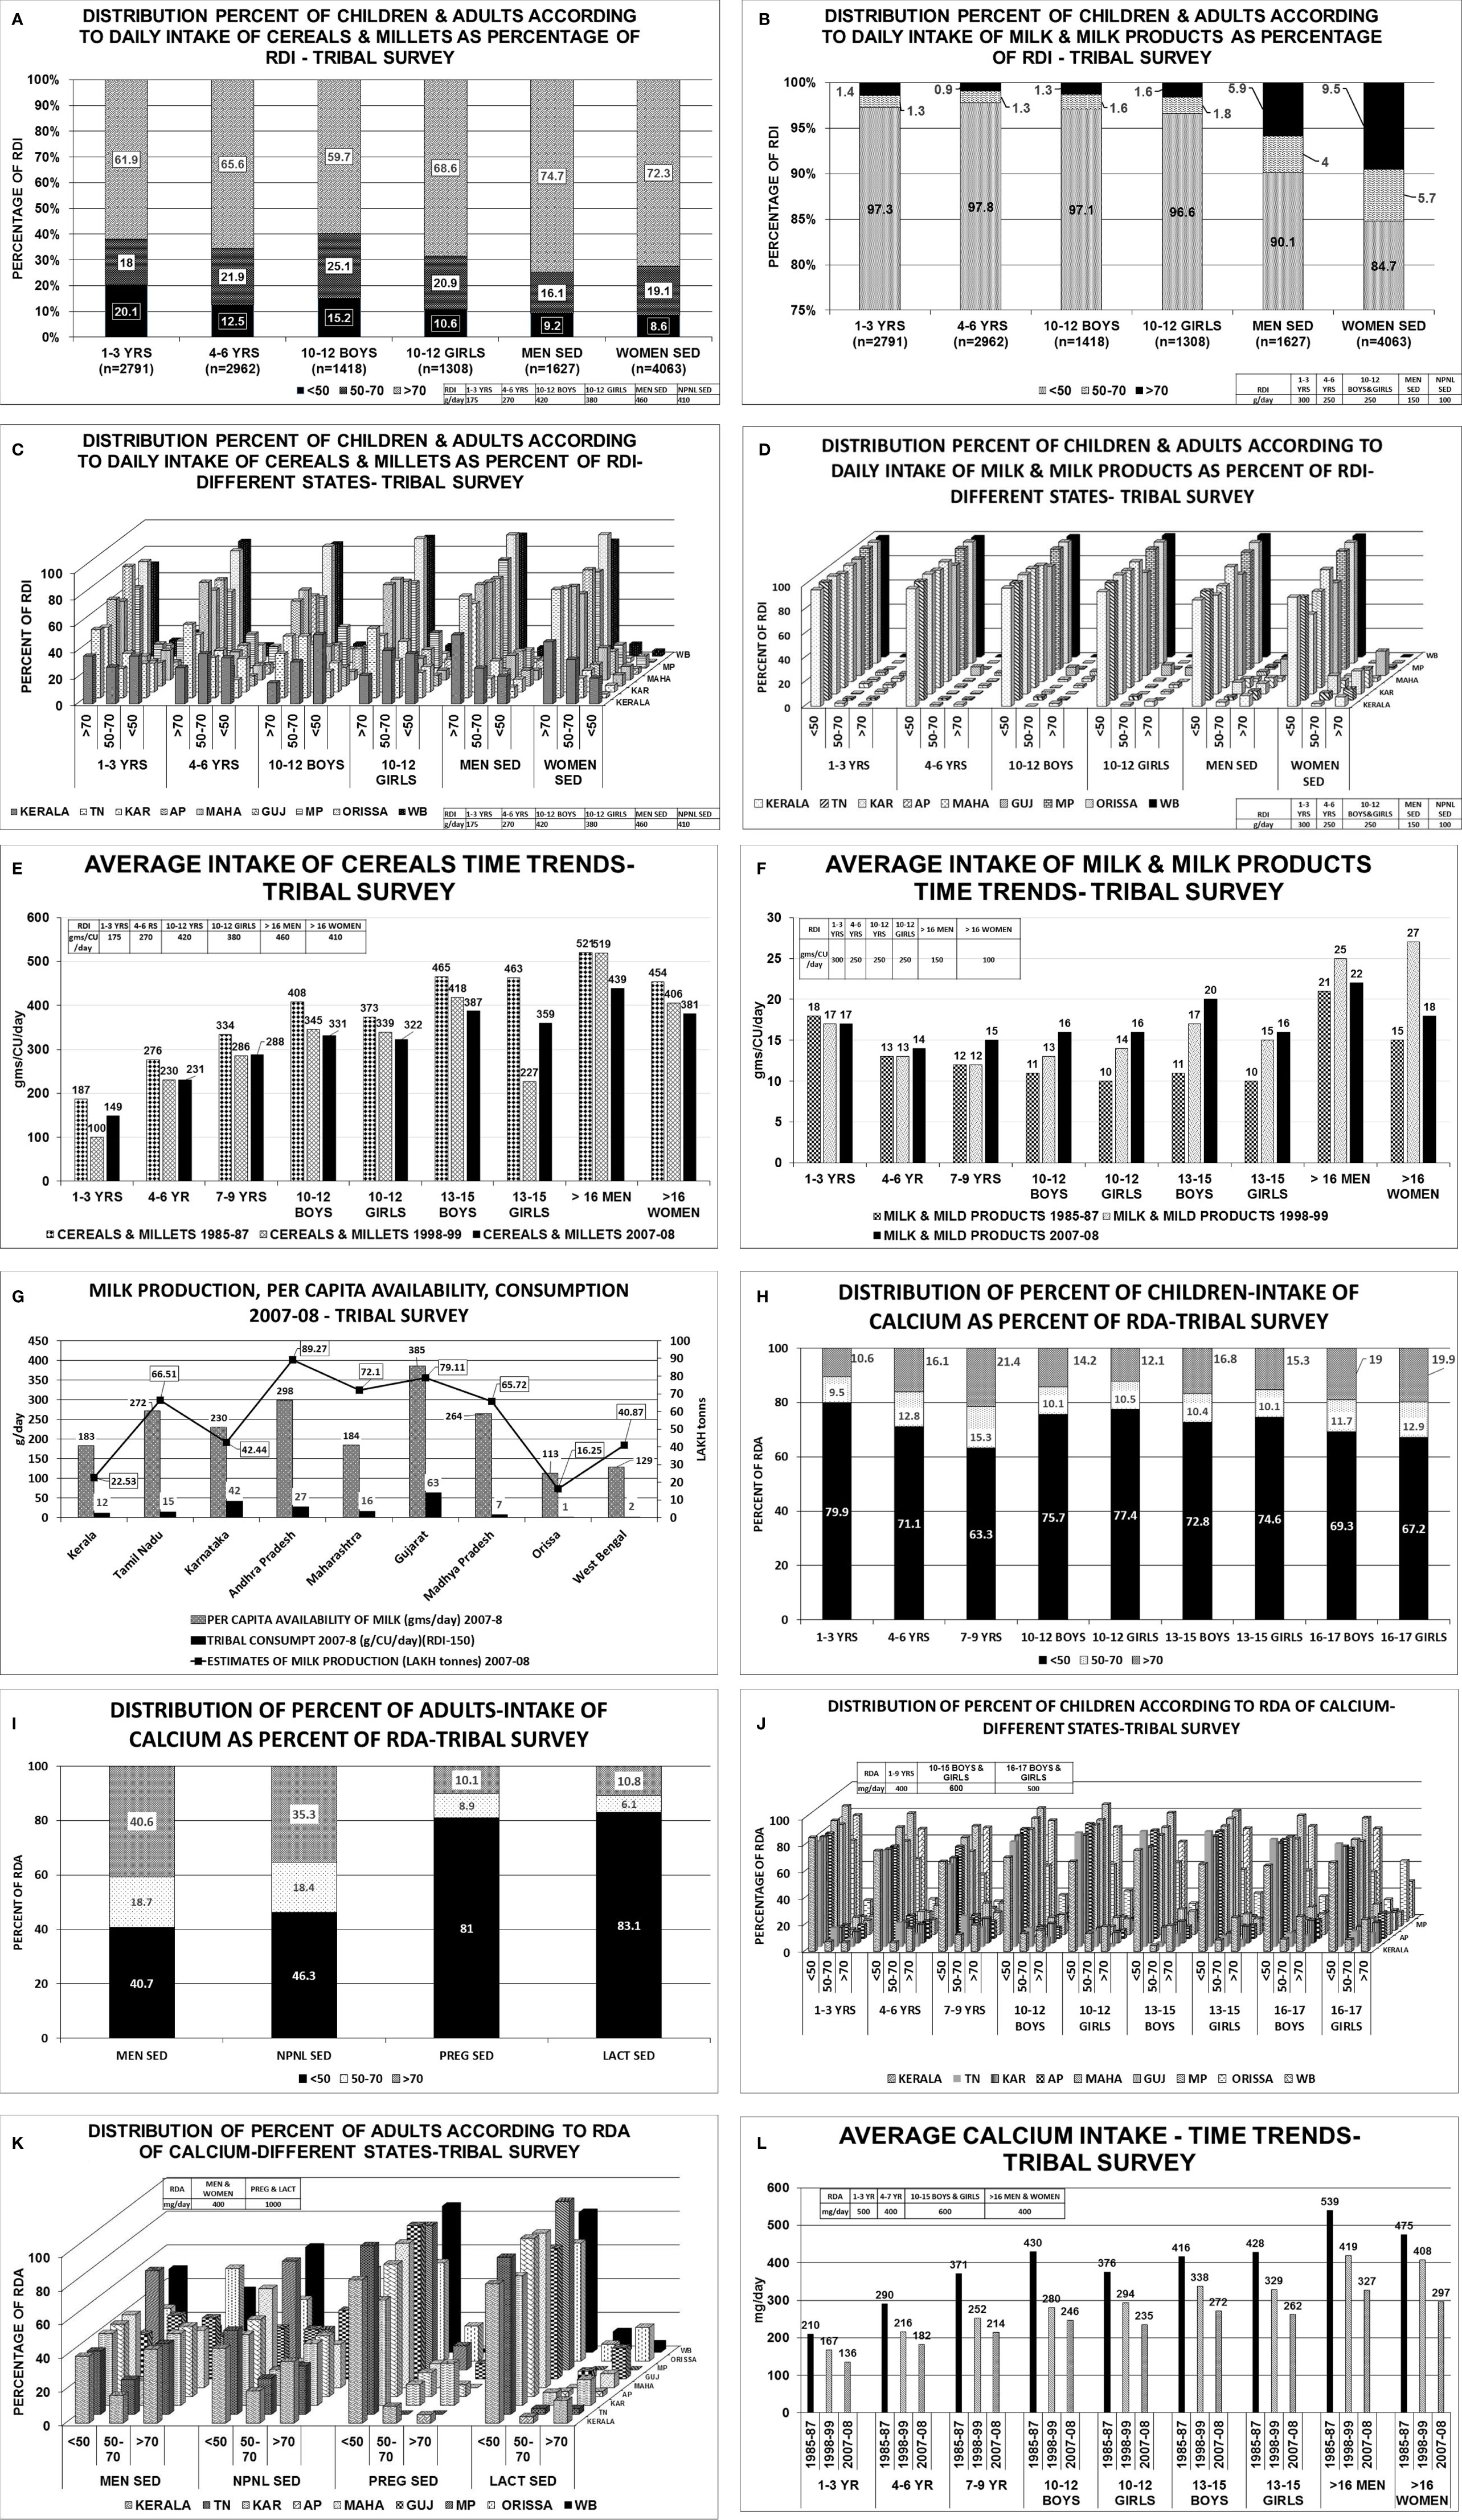
Figure 3 Tribal survey (Table 1) (24): (A) Distribution percent of children & adults according to daily intake of cereals & millets as percentage of RDI. (B) Distribution percent of children & adults according to daily intake of milk & milk products as percentage of RDI. (C) Distribution percent of children & adults according to daily intake of cereals & millets as percent of RDI- different states. About 60%–76% of Children 1–3 years from AP, Maharashtra, MP, WB, Orissa, consumed >70% of RDI with maximum from Gujarat(82%) and minimum from Kerala(36%). More than 45%–86% of children 4–6 years consumed >70% of RDI with exception of Kerala(27%). Among children of 10–12 years boys & girls, >70% of RDI was consumed from Orissa (88% & 93%) WB (85% & 90%) and least from Kerala(16% & 22%) respectively. In remaining states, consumption ranges from 35% to 68% for boys and 42% to 77% for girls. More than 51%–96% of adult men consumed >70% of RDI for cereals & millets from all states. The highest being MP (82%), WB (92%), and Orissa (96%). Similar scenario was seen with non-pregnant women. (D) Distribution percent of children & adults according to daily intake of milk & milk products as percent of RDI- different states. Uniformly, 80%–95% of population consumed <50% of RDI of milk & milk products among all age groups in all states. (E) Average intake of cereals & millets-Time trends showing a decline in intake of cereals & millets amongst all age groups in all states. (F) Average intake of milk & milk products-Time trends showing a decline in intake of milk & milk products across all age groups in all states. (G) Graph depicting the milk production and per capita availability for the year 2007–2008. The consumption data of the tribal survey for the year 2007–2008 is superposed. Graph clearly depicts the low consumption of milk despite adequate availability. (H) Distribution of percent of children intake of calcium as percent of RDA. (I) Distribution of percent of adults’ intake of calcium as percent of RDA. (J) Distribution of percent of children according to RDA of calcium in different states. Among children of 1–3 years age, about 80%–90% of HH had intake of calcium <50% of RDA and only ~10% of HH had >70% of RDA. Similar scenario was seen in children 4–6 years of age. Among children of 7–9 years of age, two-thirds of HH had daily intake of calcium <50% of RDA and only 20% of HH had >70% of RDA. Among 10–12 years boys & girls, 70%–85% of HH consumed <50% of RDA of calcium [except Orissa-43%] and less than 15% of HH achieved the criteria of >70% RDA of calcium[Orissa-37%]. Similar scenario was seen in age group of 13–15 years and 16–17 years boys & girls. (K). Distribution of percent of adults according to RDA of calcium in different states. Amongst sedentary men, 35%–45% of the HH from all the states achieved >70% of RDA of calcium with exception of MP (20%) and Orissa (55%). About 35%–45% of HH of all the states had an RDA of <50% with exception of MP (60%) and Orissa (31%). Similar scenario was seen amongst non-pregnant, sedentary women. Only <10% of the HH of pregnant women from all states (except karnataka-25%,Orissa 21%) had >70% RDA of calcium. Almost 85%–90% of HH of pregnant women had calcium intake of <50% in all states. Similar scenario was seen amongst lactating women. (L) Average calcium intake—time trends showing a decline in dietary calcium intake across all age groups over the past four decades. RDI-Recommended Daily Dietary Intake; RDA-Recommended Daily Dietary Allowance; HH-Households; B-Boys; G-girls; WOMEN NPNL SED-women: nonpregnant, non-lactating and sedentary; WOMEN NPNL MOD-women: non-pregnant non-lactating and moderate; WOMEN PREG SED-women: pregnant and sedentary; WOMEN PREG LACT-women: pregnant and lactating; MEN SED-men: sedentary; MEN MOD-men: moderate; TN-Tamil Nadu; WB-West Bengal; MAHA-Maharashtra; KAR-Karnataka; AP-Andhra Pradesh; GUJ-Gujarat; MP-Madhya Pradesh; UP-Uttar Pradesh.
Urban Survey-NNMB
Cereals and millets (320 g/CU/day) formed major portion of diet in urban population. Less than 70% of HH met the RDI requirement. While 81% of HH met the RDI requirement of intake of milk and milk products, only 67% of HH met the RDA of calcium (25).
Other Studies
The dietary calcium intake drawn from various studies from 1999–2019 (Table 2) (26–64) shows intake less than the RDA for various age groups, gender, and physiological states. From a study in South India, the dietary calcium intake of rural, urban, and metropolitan subjects was 268 ± 2,308 ± 2.3, 526 ± 8(mg/day ± SEM)(P<0.001)(RDA-600) (36).
To summarize, the highest intake of cereals and lowest intake of milk & milk products was observed in rural and tribal subjects whereas, the intake of cereals, milk & milk products were similar in both urban and metropolitan subjects. There are similar reports of low dietary calcium intake in postmenopausal women and adolescents migrant workers in metropolitan cities (33, 37, 56, 65). One of the reasons for lower calcium intake was the proportion of calcium derived from dairy sources. As per 1990 Food and Agricultural Organisation (FAO) report, the average per capita calcium intake in developing countries is 344 mg/day compared to 850 mg/day in developed countries.
Modern India-Historical Changes in Milk and Cereal Production and Consumption Pattern Since Independence
There is a decline in the dietary intake of calcium in the past four and a half decades, as evidenced by NNMB data (1981–2011) in both rural (Figures 2E, F, K, L) and tribal(Figures 3E, F, L) population. The average daily dietary calcium intake(from cereals, milk and milk products) across various age groups in both genders, and, pregnant and lactating women were well below the RDA (Table 1). Cereals were the only source of calcium, followed by milk and milk products in both rural and urban areas. The quinquennial surveys of the National sample survey organization(NSSO)(68th Round 1987-8 and 2009-10) showed that there is a fall in share of total consumer expenditure for food from 64 to 54% in rural and 56%–47% in urban areas (66).
Production and Consumption of Milk
White revolution started in India in 1970 (67). India is the leading producer of milk in the world (187.7 Million tonnes in 2018–2019 with per capita availability of 394 g/day;Source : National Dairy Development Board) accounting for 22% of global production, with an estimated compounded annual growth rate of ~14.8% between FY 2018 and FY 2023 (68). The milk production and per capita availability of milk in India for the year 1991–1992, 2000–2001, 2010–2011, 2018–2019 are 55.6, 80.6, 121.8, 187.7 million tonnes and 178, 217, 281, 394 g/day respectively (69). Milk and milk products constituted 9.42% and 9.91% (1990–1991), 9.31% and 10.5%(1992), 8.68% and 8.30% (2000–2001), 9.1% and 7.8% (2011–2012) of per capita monthly consumption expenditure of rural and urban subjects (National Sample Survey Office -NSSO 46th, 48th, 56th, and 68th rounds) (69). There are regional differences in milk consumption pattern which may be attributed to lower purchasing power and deviant food habits in the country.
The average consumption of milk & milk products of children and adults from the rural survey of NNMB for 1975–1979, 1988–1990, 1996–1997, 2011–2012 shows about 80%–84% of the children and 56%–62% of adult men and women consumed less than 50% of the RDI(Figures 2B, D) (22, 23). Similarly, in the NNMB tribal survey 1985–1987, 1998–1999, 2007–2008 shows 85%–97% of children and adults consumed less than 50% of RDI of milk & milk products (Figures 3B, D) (24). Though the consumption of milk and milk products has increased over time, the difference between consumption of various economic strata is quiet glaring. In 1983, the per capita milk consumption by rich households was 8.6, 3.9, 2.2 times of very poor, poor and non-poor households. The gap has reduced to 6.15, 3.5, and 2.05 respectively in the year 2004–2005 and to 6.8, 3.3, and 1.8 respectively, in the year 2009–2010 (70). About 80% of milk production comes from small farmers (69, 71, 72).The per capita consumption of milk is grossly below the per capita availability and the Recommended Dietary Intake (RDI) during the period of respective surveys (Figures 2G and 3G).
Production and Consumption of Cereals
According to FAO(2010), India is the world’s largest producer as well as largest exporter of millets and 2nd largest producer of wheat, rice, pulses (73, 74). Rice occupies 64.4% of India’s cereal exports (2013–2014) (74, 75). In the past decades, the quantity of coarse cereals production has dramatically reduced with increase in production of rice and wheat in food supply. Green revolution transformed India to cereal exporting country. The focus of production was on high yielding rice and wheat. Several government programs were launched—National Food Security Mission (NFSM, 2007–2008) and Bring Green Revolution in Eastern India (BGREI, 2010–2011), which led to increase in production of rice, wheat and cereals (74, 75). There was a change in the consumption pattern with rice and wheat dominating and decline in coarse cereals. Moreover, the Public Distribution System (PDS) allows subsidizing rice and wheat to large percentage of poor households (PDS supplies food grains to 800 million of 1.3 billion population). Proportionally, the total cereal consumption declined from 35% to 5% in rural, 17% to 3% in urban areas in 1961–2012 over the past half a century (74, 76).
Coarse cereals (defined as cereal grains other than wheat & rice) are directly consumed in many developing countries. The nutrient content-kcal, calcium(mg), phytate(mg) per 100 g of edible portion(12% moisture) for various cereals are rice(milled,oryza sativa) 356,33,266; wheat(atta,tricium aestivum) 320,30,632; sorghum(jowar;sorghum vulgare) 334,25,549; pearl millet(bajra;penniselum glaucum) 348,42,485; maize(zeus maize) 334,26,646; finger millet(ragi;eleusine coracana) 320,350,306 respectively (74–79). Finger millets contain highest amount of calcium but with high amount of antinutrient-phytates. Phytates inhibits the micronutrient absorption(calcium) and reduce the bioavailability.
Majority of the Indian population use food grains as the main component of their diet, although there are variations in diet found across different parts of the country. The principal food grain in the North India is wheat followed by rice. In the Western India, wheat comprises of 50% of total grain consumption followed equally by coarse cereals & rice together. In South India, rice is consumed as main food grain. Wheat is the staple food across India consumed using whole wheat flour(atta) in the form of unleavened flat bread(roti,chapattis) and as bakery products. Approximately, 47% urban and 57% of rural subjects’ energy intake comes from cereals for low income populations who obtain high proportion of nutrients and calories from cereals. Cereals contribute to 1 kg/per person/per month in rural India, and 0.8 kg/per person/per month(other than rice and wheat) in urban India (2011–2012) (74).
In 1961–1962, the average 30-day consumption(kg/30 day/person) for cereals in rural subjects in India for rice 8.8, wheat 2.6 and coarse cereals 6.1 which constitute 50%, 15%, 35% of the total consumption respectively. In 2011–2012, it was 6, 4.3, 0.6, constituting 53%, 38%, 5.2% of total consumption respectively. In the urban population, in 1961–1962, the average 30-day consumption(kg/30 day/person) for rice 6.2, wheat 4.1,coarse cereals 2.1 which constitute 50%, 33.2%, 17% of total consumption. In the year 2011–2012, the corresponding values were 4.5, 4, 0.2 constituting 48.4%, 43.2%, 2.6% of total consumption. Hence, for a period of half a century, the 30-day total cereal consumption decreased from 17.6 to 10.8 in rural subjects and 12.3 to 8.6 in urban subjects despite ample availability (74, 80–84).
Changing Rural Urban Consumption Patterns
As per the NSSO data, the Per Capita Cereal Consumption(PCCC) has been declining despite a sustained raise in Monthly Per Capita Consumption Expenditure (MPCE) across the country among both urban and rural households (85).The PCCC depends on region, food habits, education and occupation; and gives consumption data during the preceding 30 days which is a sum of wheat, rice and other cereals. The PCCC (kg/month) in rural India declined from 15.53 (1970–1991) to 11.76 (2007–2008). When the PCCC for each MPCE class are examined, there was a positive and monotonic relation between PCCC and MPCE, the well-off households consumed more cereals than poorer households (in terms of MPCE) (85). In the past decade, the PCCC has declined particularly among higher MPCE classes. The sedentary workers consumed less cereals compared to manual laborers because cereals acted as inexpensive calories for low wage-heavy labor workers with high calorie requirement.
With increasing monthly per capita expenditure (MPCE), there has been a progressive fall in cereal intake. In the urban population, 29% of top and 69% of bottom 5% of population consumed cereals as ranked by MPCE. In the rural population, the cereal consumption was 42% in top and 70% in bottom 5% of population (66, 85). As per the NSSO 68th Round, the consumption of cereal was the highest in the lowest income group, despite spending smaller portions of their income, because the Public Distribution System (PDS) supplied cereals (66, 85). In the middle- and high-income groups, the decline in cereal consumption has been mainly due to consuming fast foods and diet diversification.
Trends in Consumption and Expenditure
For nearly half a century, the Private Final Consumption Expenditure (PFCE) as percentage of GDP had declined from 79% (1980–1981) to 58% (2014–2015) (66, 85, 86). The PFCE on food items as percent of total PFCE had declined from 61% to 36% and on non-food items has increased from 39% to 64%, between 1972–1973(NSSO 27th round) and 2011–2012 (NSSO 68th round) (66, 87–92). For the corresponding period, the share of expenditure on total food items declined from 72.9% to 48.6% in the rural areas and from 64.5% to 38.5% in urban areas. The expenditure on non-food items increased 27% to 51.4% in rural areas and from 35.5% to 61.5% in urban areas (87–92). Similarly, the share of expenditure on consumption of cereals declined from 57% to 25% in rural areas and 37% to 19% in urban areas. Whereas, the share of expenditure on milk & milk products increased from 10% to 19% in rural areas and 14% to 20% in urban areas (87–92).
Importance of Cereal as a Source of Calcium in India
In India, the consumption of home-based cereal-pulse vegetarian diets and low intake of dairy products is common. Furthermore, availability and consumption of packaged fortified foods is negligible among Indians. Populations in developing countries, however, have been found to subsist on much lower calcium intakes (~500 mg/day) (31, 93). The main reasons responsible for these differences in calcium requirements are pronounced differences in the intakes of animal protein and sodium between the Indian and Western populations. The animal protein intake in India is far less than in the West (93, 94). Furthermore, in developing countries, non-dairy sources form the major source of calcium intake, especially in India (94, 96). Only 14.3% of urban and 8.7% of rural population consumes the recommended intake of milk and milk products (94).
Interactions of Vitamin D and Calcium Deficiencies
About 80%–85% of population from India are suffering from various degrees of vitamin D deficiency (97). Vitamin D deficiency in India was documented for the first time while studying a cohort of patients for the cause of bone disease in primary hyperparathyroidism and their control subject (98). Later, other reports documenting with low 25(OH)D levels in children, adults, pregnant and lactating women, adults and elderly subjects ensued (99). The 25(OH)D levels in South Indian subjects are relatively higher than those residing in the north because of equatorial proximity (99). There are in vitro studies done at Tirupati, South India (Latitude13.24°) to show adequate vitamin D synthesis on exposure to sunlight (99). In India, the dietary habits vary with different socioeconomic classes and culture across different regions. With mechanization, the lifestyle in modern India has changed to less labor intensive work and prolonged indoor working hours limiting sun exposure which is further amplified by the dress code, use of skin creams with SPF>15 which could account for vitamin D deficiency.
In India, there is a combination of dietary calcium deficiency and vitamin D deficiency (despite adequate sunlight). The secondary hyperparathyroidism (SHPT) which sets in, because of dietary calcium deficiency(declining dietary cereal and milk intake in India) accelerates the conversion of 25(OH)D to 1,25(OH)2D, thereby reducing the serum 25(OH)D concentrations (Figure 1). Thus, there is primary calcium and vitamin D deficiency and secondary vitamin D deficiency due to calcium deprivation (18, 100). Growing skeleton requires calcium requirements to be met. In the background of low dietary calcium intake and poor vitamin D status, the problem is compounded. Similar scenario is encountered in a pregnant, lactating women to meet the demands of the fetus and new born. The intake of milk and milk products coupled with cereals containing high phytate content(ragi), the calcium deficiency is accelerated.
Impact and Magnitude of the Problem
The combination of changing dietary habits, urbanization and changing lifestyle, magnify the calcium and vitamin D deficiency. Calcitriol supplies the minerals calcium and phosphate, essential for bone stiffness by increasing the intestinal absorption. Calcitriol cannot do this job with low dietary calcium supply, ultimately leading to SHPT causing structural damage to bone—rickets/osteomalacia.
Vitamin D plays an important role in absorption of dietary calcium when its bioavailability is low. When calcium intake is high, passive paracellular calcium transport plays a major role. When the calcium intake is low, vitamin D dependant intestinal calcium absorption is mainly transcellular and dependant on active transport involving calmodulin D9k and vitamin D dependant TRPV6 (2). Approximately, 1/3 of dietary calcium intake is absorbed in vitamin D replete individuals with adequate calcium intake. This is reduced to 10%–15% in vitamin D deficient individuals. Body adapts to the low intake of calcium by reducing the calcium excretion and increasing the fractional intestinal absorption.
From the nutritional data available for past half a century, the dietary calcium intake of infants and children, adults, pregnant and lactating mothers are far below the RDA (Tables 1–3). The peak bone mass is achieved in early adulthood, second and third decade of life tracks through the childhood and adolescence. With advancing age, the bone mass declines and is accelerated at menopause. In a population where there is uniform dietary calcium and vitamin D deficiency across all age groups and in both genders (Tables 1, 2), the peak bone mass achieved is lower compared to the West.
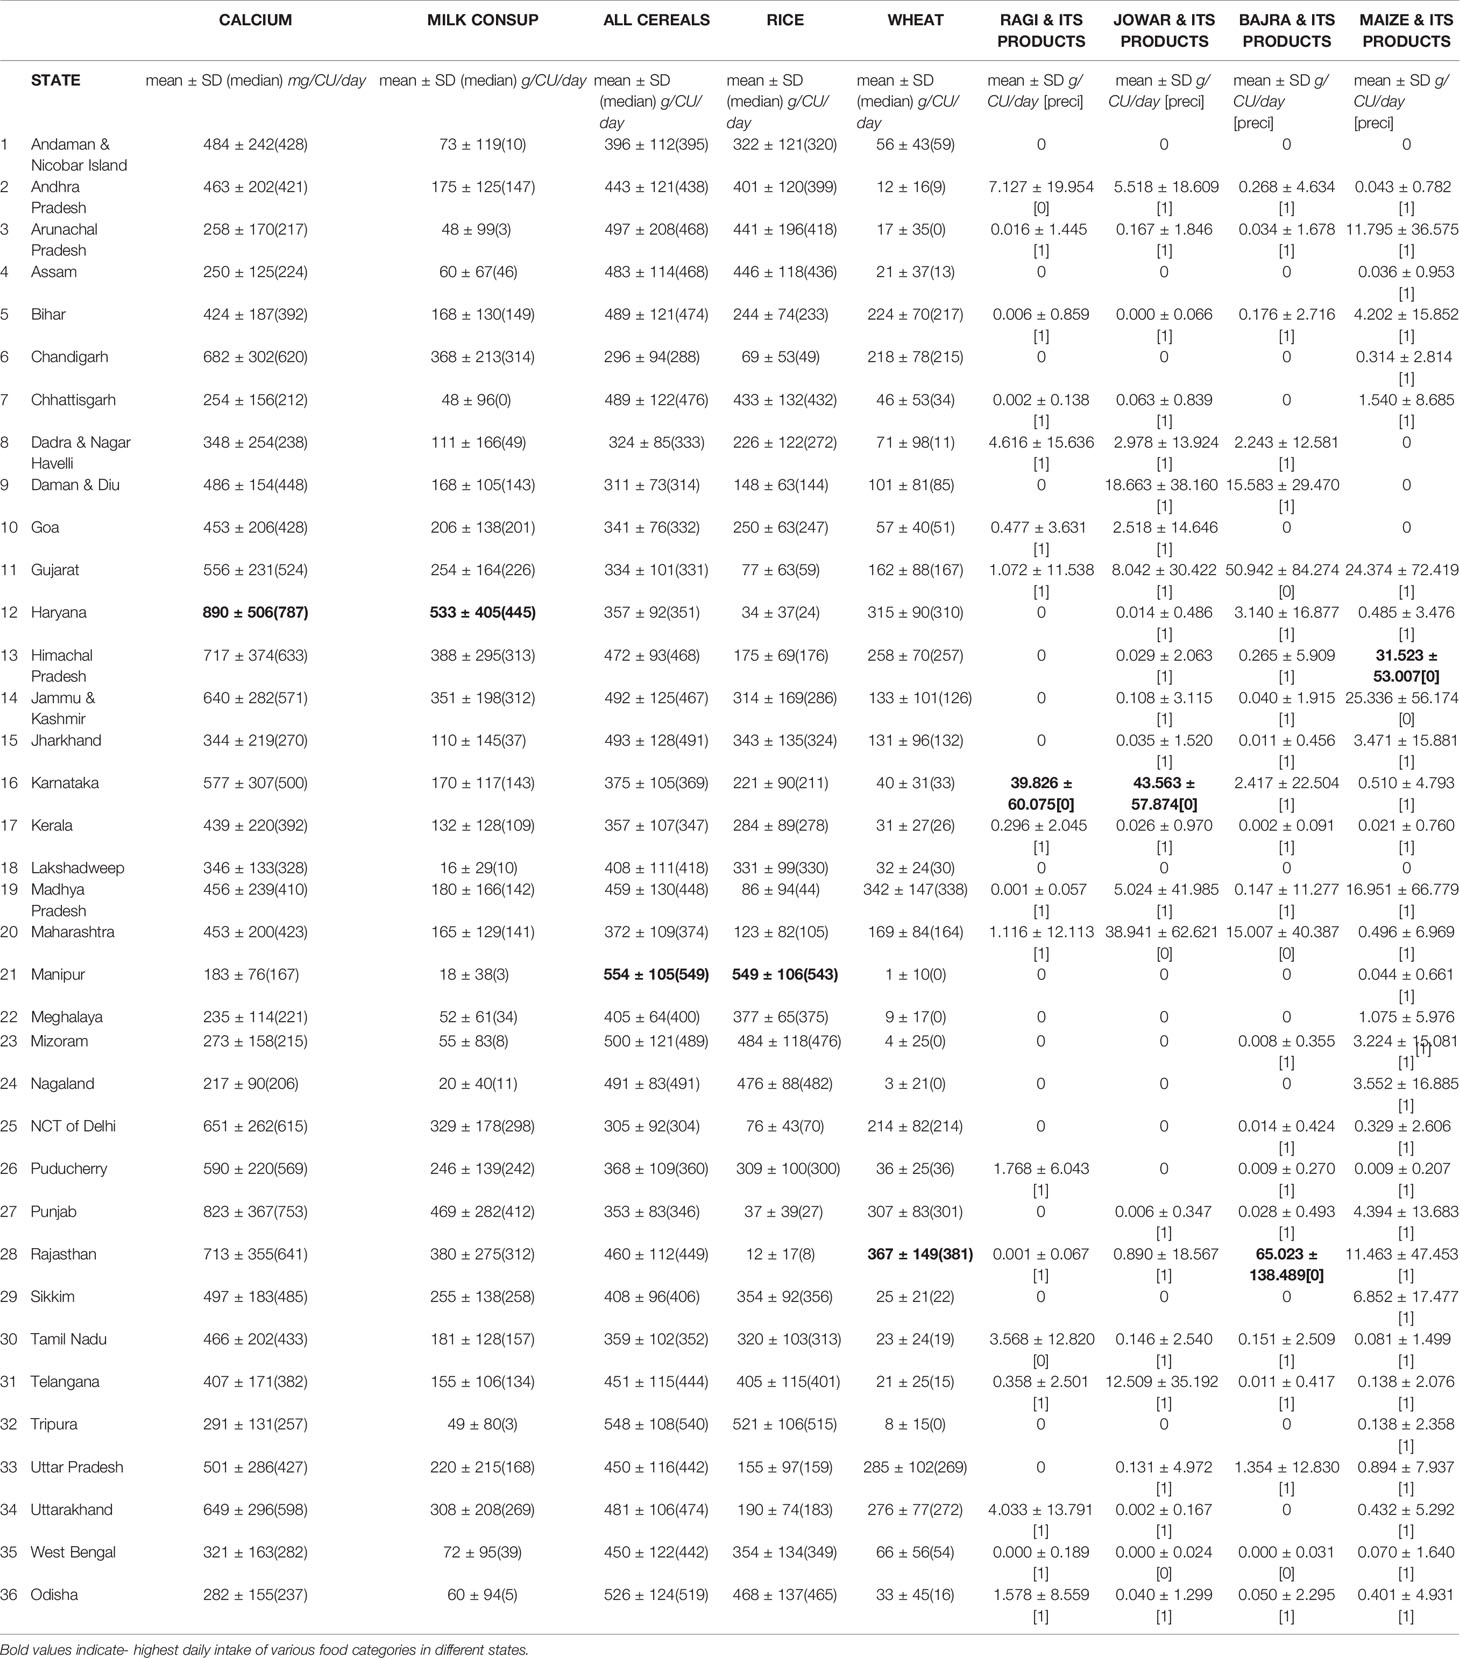
Table 3 (104, 105) The daily intake of various food categories in grams per capita per day and nutrients in grams per consumer unit in different states in India[Precision is > 0.05 happens due to low coverage/sample size or high coefficient of variation (SD/Mean) or both].
Globally, 800 million people are undernourished. More than 3.5 billion people are at risk of calcium deficiency and 90% of those at risk, are in Africa and Asia (101). In one of the longest (1963–2005) and largest study from India, nutritional bone disease constituted 52% of the population (102). The commonest disorders are rickets (7.6%), osteomalacia (35.3%), and osteoporosis due vitamin D deficiency, because of inadequate sunlight exposure and dietary calcium deficiency(<300 mg/day) (102). In India, osteoporotic fractures occur in both males and females a decade earlier (103). There is good evidence to show that low dietary calcium intake of 200 mg/day is associated with impaired mineralization and rickets.
ICMR-NIN TATA center dashboard (104) provides information on intake of different macronutrients and micronutrients by age and gender population categories using the latest Indian Food Composition Tables to estimate nutrient content of raw food items (77). A total of 101,204 households comprising of 463,622 members of all age groups, both genders of rural and urban were evaluated across the country to derive population category estimates(Consumer Units). The daily dietary intake of various food categories in grams per capita per day and nutrients in grams per consumer unit in different states in India are shown in Table 3.The table shows the diversity of cereal intake across different states in India. The total daily intake of calcium(mg/cu/day) in India is 462 ± 179(rural-447 ± 192, urban-493 ± 155), is far below the RDA (77, 104).
RDA and Recent Revisions
The ICMR-NIN (105) Recommended Dietary Allowances(RDA)(mg/day) 2020 for various age groups as follows(values from USA-Institute Of Medicine-IOM 2011 is given in brackets): 0–1 year:300(200–260); 1–3 years:500(700); 4–6years:550(1000); 7–9 years 650(1000–1300);10–12 years:850(1300); 13–15 years:1000(1300); 16–18 years:1050(1300);>18 years:1000(1000); >65+: NA(1200); pregnant women 1000(1300) and lactating:1200(1300). The values recommended by FAO and USA-IOM are similar (106, 107). The RDA has undergone upward revision(since 1979) and is still not at par with RDA of West. The revised ICMR-NIN guidelines are well intended but needs some updates (108). Added to this, there is uniform vitamin D deficiency in Indian population as well.
To summarize, though India is the largest producer of milk and cereals, the major source of calcium in India is through non-dairy products. With modernization the PCCC has declined in population with higher MPCE. The lowest income group gets the cereals from the PDS. In the middle and high income group there is a decline in the cereal consumption due to consumption of fast food and diet diversification. Strengthening cereal intake and encouraging dairy products goes a long way in addressing the problem of dietary calcium deficiency in India.
Strategies to Combat Dietary Calcium Deficiency—the Way Forward
In India, there is dietary calcium deficiency across various age groups and gender coupled with vitamin D deficiency. Addressing both simultaneously, is most important (109). The main source of dietary calcium across the population in India has been from non-dairy sources. India should focus on multi-pronged strategy with three main focus areas to tackle the problem of strong bone health while solving the problem of nutritional deficiency. Firstly, while the government has many initiatives targeted to achieve nutrition sufficiency, the impact of these are yet to be realized and more emphasis is needed on strong bone health. Secondly, corporate India needs to focus on bone health as a part of Corporate Social Responsibility (CSR), along with government and non-profit organizations. Lastly, as we are living in a digital world, it becomes imperative to leverage technology to solve societal problems and realize the impact of initiatives targeting nutrition sufficiency through innovative approaches.
Governmental Initiatives
India has plethora of polices and nutrition programs to address several decades of malnutrition, but there is paucity of impact. The Indian social safety net program(SSNP) (110) is a platform to address three major nutrition and feeding programs: a) The Integrated Child Development Scheme(ICDS) by the Ministry of Women and Child Development(MOWCD) providing food supplements at community-level, Anganwadi centers addressing the need of pregnant and lactating women and children under 6 years of age, b) Mid–Day–Meals scheme(MDM) catering primary and upper primary school children, and, c) Targeted Public Distribution System(TPDS) supplying food grains to three target populations namely, 1) Below Poverty Line (BPL) (to the poorest families), 2) Anatyodaya Anna Yojana (AAY) (poorest 20% BPL), and, 3) Above poverty line (APL) (low income not among the poorest (Table 4A). Apart from these, there are micronutrient supplementation programs and Food Fortification programs. There has not been much emphasis on calcium as a supplement, in micronutrient supplementation or food fortification programs in India (110, 111).
a. Integrated Child Development Services (ICDS) is the world largest community based program launched in 1975. It is an excellent program for mother and child development. It is a symbol of India’s commitment to her children (111, 112) (Table 4A).
b. National Guidelines for Calcium Supplementation during Pregnancy and Lactation by Maternal Health Division of Ministry of Health & Family Welfare, Government of India, advocates supplementation of calcium to all pregnant women (113). However, the dose of vitamin D advocated is far less keeping in view of the widespread vitamin D deficiency, and the endocrine society guidelines for treatment vitamin D deficiency for population at risk (Table 4A) (114, 115). The government can mandate inclusion of RDA percentage along with the nutrient information provided in packaged food items to increase awareness and to ensure nutrient intake in both rural and urban India.
c. Mid–Day–Meals Scheme (MDM): In the year 1925, MDM was introduced in Madras Corporation for disadvantageous children (120, 121). The Special Nutrition Program (SNP) and Applied Nutrition Program(ANP) was started in the years 1970 and 1973. In the year 1975, Tamil Nadu, Gujarat, Kerala, and Pondicherry universalized the cooked MDM for children at primary school stage with the concept “an undernourished and hungry child(classroom hunger) can never be attentive in class room”. Realizing this relationship, the National Program of Nutrition Support to Primary Education (NP-NSPE) or MDM was universalized for the whole country in the year 1995. This scheme was supposed to promote the enrolment, attendance, and retention of students apart from enhancing gender and caste parity and fostering social equality to those belonging to disadvantaged group. Today, it is the world’s largest school meal program.
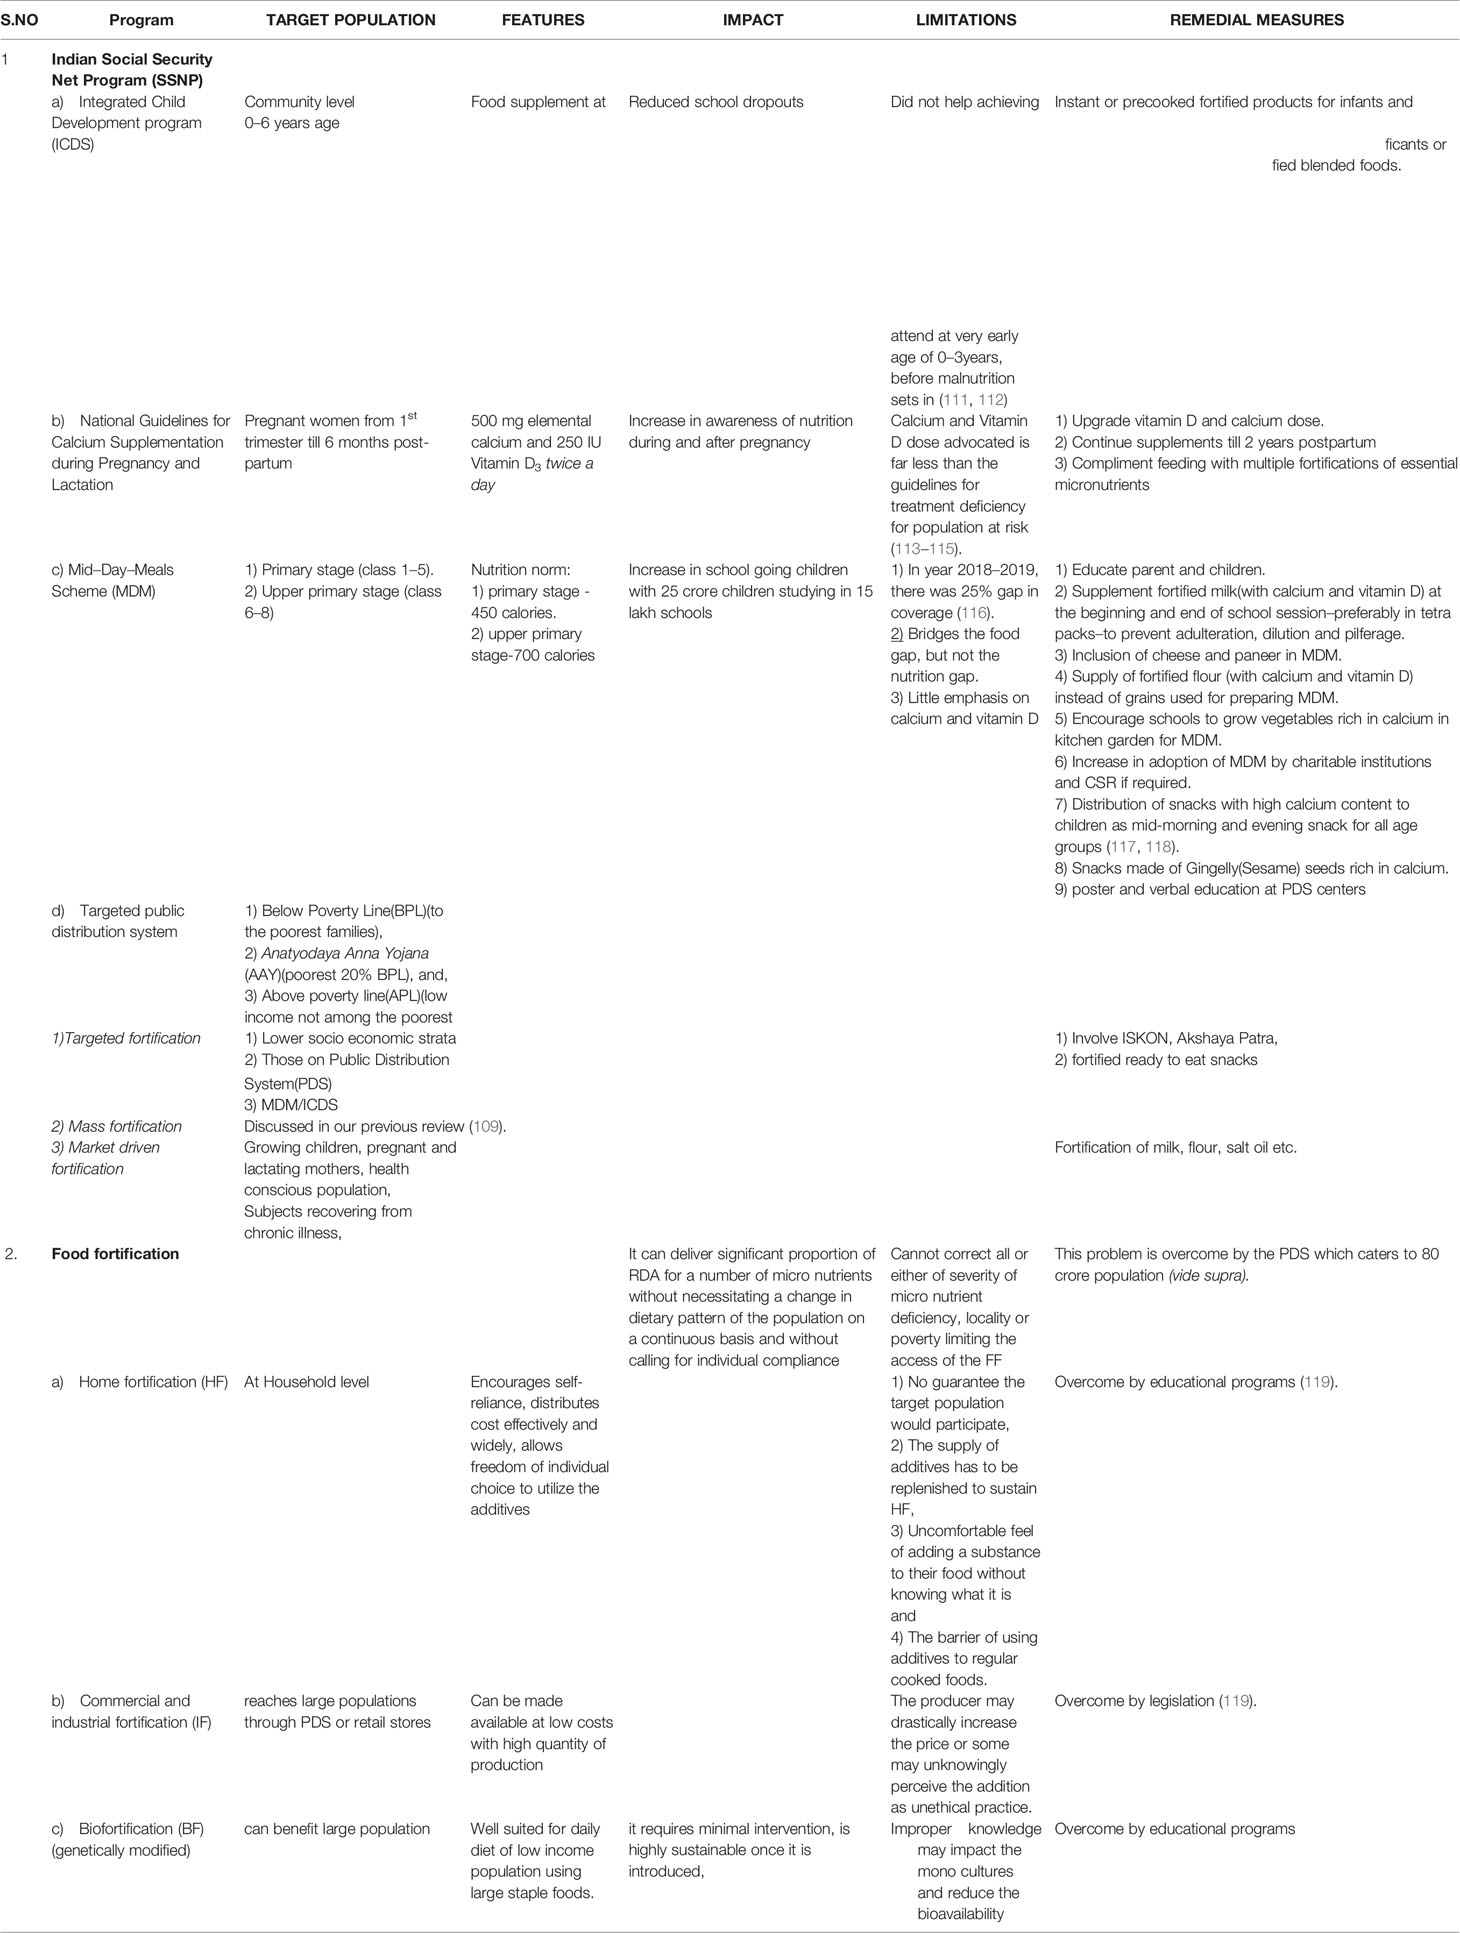
Table 4A Table showing strategies to combat dietary calcium deficiency governmental and digital in rural and urban region.
Limitations: The standard nutrition norm of MDM are: for primary stage (class 1–5) is 450 calories, food grains (100 g), pulses (20 g), protein (12 g), vegetables (50 g), oil and fats (5 g) and upper primary stage (class 6–8)-700 calories, food grains (150 g), pulses (30 g), protein (20 g), vegetables (75 g), oils and fat (7.5 g). There are many evaluation studies of nutrition analysis of MDM found based on a number of evaluation criteria (122). In a study aimed at improving the nutrition quality of mid-day-meal scheme, baseline nutrient intake data of children showed high prevalence of undernourishment with micronutrient deficiencies(especially iron, calcium and vitamin A). The percentage of children consuming less than 50% RDA of calcium were:7–9 years-43.8%; 10–12 years-Boys-60.6%, Girls-65.2%; 13–15 years Boys 56.9%,Girls-57.8%; and 16–17 years-Boys-49.2%, Girls-48% (123, 124). In another study from Ludhiana district of Punjab, showed that MDM was found to be a substitute rather than supplement for the home meal. The average daily calcium intake by urban and rural school children was 375 ± 79 and 400 ± 128 (mean ± SD) mg/day. The nutritional contribution of MDM was 108 ± 11 and 107 ± 12 (mean ± SD) mg/day respectively. The percentage contribution of MDM to calcium intake was only 27% of required nutrient intake and 17.8% of RDA intake (125). Similar studies from Haryana of 50 girl children (7–10 years), only 51% consumed RDI of milk and milk products (mean ± SD : RDI) (128 ± 80:250) as per ICMR standards and 60% of them met the RDA of calcium (mean ± SD : RDA) (364 ± 153:600) (126). In another study from Tirupati, with MDM in school going boys and girls of 8, 9, and 10 years, the dietary calcium intake (mean ± SD : RDA) of boys was 234 ± 34:400;237 ± 57:400 and 341 ± 53:600 and for girls218 ± 36:400; 215 ± 55:400 and 303 ± 54:600 respectively. Only 39% of children of both genders consumed milk and milk products daily (127, 128) (Table 4A).
Majority of the states do not supply milk or milk products in the MDM, despite India being the largest milk producer in the world. Milk has been started as a supplement in Chandigarh, Daman & Diu, Delhi, Gujarat, Haryana, Jharkhand, Karnataka, Kerala, Madhya Pradesh, Pondicherry, Rajasthan, Uttarakhand, and West Bengal only for primary stage students with intake varying from one to five times a week.
Road Ahead: MDM bridges the food gap, but not the nutrition gap. The focus of nutrient supplementation was aimed at calories, protein, iron and vitamin A with little emphasis on calcium and vitamin D which are essential for bone health. The solutions for improving nutrition intake in children are dealt in Table 4A.
Targeted Public Distribution System: Targeted, mass and market driven fortification has been extensively dealt with in our previous review (109).
Food Fortification: Addition of one or more essential nutrient to food for the purpose of correcting or preventing a demonstrated deficiency in a population is called Food fortification(FF). It differs from enrichment where the lost nutrients during refinement or production is restored. Different types of FF are: home fortification(HF), commercial and industrial fortification(IF), biofortification(BF) (genetically modified), microbial fortification and synthetic biology (119). The pros and cons of each of these types are enumerated in Table 4A.
a. Advantages of FF: It helps maintain body stores which are essential for growing children. For those who don’t like or allergic to dairy products, calcium fortified foods are a good option.
b. Limitations of FF: When the micronutrient deficiency affects a large proportion of population, the targeted population FF alone, this problem is overcome by the PDS which caters to 80 crore population (vide supra).
The Pros and cons of HF, IF, and BF dealt in Table 4A.
Importance of Cereals as a Source of Calcium Methods to Enhance Its Bioavailability
Amongst the cereals, finger millets has the richest source of calcium (350 mg/100 g) and highest phytate content (306/100 g). It requires minimal inputs for growth. It is stress resilient and best suited for sustainable agriculture. The calcium content is 10 folds higher than brown rice, wheat or maize and three times more than milk (129). Besides, it contains high content of other nutrients and is called as “super cereal”. But the phytate in the cereal chelates calcium in the gut and reduces its bioavailability. The methods to improve the nutritive value and reduce the phytate content include biofortification and genetic improvement, pre-treatment methods as enzymatic treatment with phytase of grains, precooking treatment methods as fermentation and soaking.
There are gene banks across the globe to develop ca-biofortified finger millets (129). Other methods to enhance the bioavailability of calcium and to reduce phytic acid content of the grains are: a) sprouting – lowers phytate and improves extractability of calcium after 4 days of germination and reduces phytic acid content to undetectable levels (130), b) flour made from whole grains have higher calcium content(325 mg/100 g) compared to decorticated ones (222 mg/100 g), c) fermentation reduces the phytic acid levels by 72.3% and 54.3% after 96 and 72 h, and, d) other methods, as co-fermenting with horse gram increases the nutritive value (131–133).
Comparison of Calcium Salts for Fortification and Bioavailability
The bioavailability of calcium in fortified food varies. Meal load is inversely related to calcium absorption. Solubility of calcium salt is not proportionate to its bioavailability. It has little effect on absorption of calcium per se. The solubility and absorption are extremely low for calcium oxalate. On the other end of the spectrum is calcium citrate malate (CCM) and amino acid chelate bisglycinocalcium, with high solubility and fractional absorption. Inhibitors in the food matrix inhibit calcium absorption(oxalic acid found in spinach, sweet potatoes and legumes. Exception – soybeans have high oxalate content and also high calcium bioavailability). Phytates (phytic acid) reduce calcium absorption. The inhibitory effects can be reduced substantially by processing methods which hydrolyze or remove phytates–fermentation, use of phytase sprays and selective precipitation of proteins. Dietary fiber is another inhibitor of calcium absorption and the effect is serious when the calcium intake is low. It can be overcome by small increase in dietary calcium (134, 135). Certain digestive products, milk proteins(caseinphosphopeptides) and lysine-an amino acid, enhance calcium absorption.
Selecting the Calcium Fortificant: To fortify food the ideal calcium source should be inexpensive, safe, compatible with food delivery vehicle, highly absorbable and should enhance the bone mass. Only CCM and calcium carbonate(CC) have undergone rigors testing in this way. CC is the least expensive salt and is ideal for flour fortification. Thermal processing liberates CO2 from CC. But in fruit beverages CCM is very compatible. CC is used where chalky mouth feel and clarity would not be noticed(food bars and cereals), especially soy and meal replacement beverages. In nonclear beverages, calcium phosphate acts as a buffer to control acidity. In clear beverages, calcium citrate is soluble at certain pH, works and with change in concentration and pH the choice moves to calcium lactate, gluconate and gluconate salts with undesirable acceptance with usage over 10% DV. Calcium fumarate has significant slower dissolution and useful for clear beverage for taste. Syrups and slurries are achievable with lactate and lactate gluconate.
Calcium supplementation has significant impact on BMD and BMC. It has been shown in prepubertal girls that it has a positive impact on the stature/height (136). Calcium deficiency along with other micronutrient deficiency may be the cause of stunting in India.
Barriers to Effective Fortification: The focus of FF should be on the quantity added and the quality of fortificant added. This depends on the choice of salt, manufacturing process, taste effects and stability of the product. Quality related issue is bioavailability and the risk of renal stone formation. In the only published RCT, dietary calcium at recommended levels resulted in 50% fewer stones compared to calcium-restricted diet (137). Similar observations are recorded with rise in calcium intake from low to currently recommended levels (138). The explanation being that the digestive residue complexes which contain unabsorbed calcium blocks the dietary oxalates which is a potent risk factor.
Vitamin D status of an individual affects calcium absorption. The intestinal calcium absorption improves by 68% when the 25OD levels are >30 ng/ml (139, 140). Calcium is best absorbed in smaller amounts taken throughout the day several times. The most effective fortification is levels up to 30% DV (Daily value) i.e. 300 mg per serving: a) Foods containing 10% of DV are–calcium enriched or more calcium or calcium fortified, b) 10%–19% of DV– provides calcium or contains calcium or good source of calcium, and c) >20% of DV– rich or high in calcium or excellent source of calcium. Remedial measures of vitamin deficiency is addressed in our previous publication (109).
Role of Corporate Sectors in Tackling Nutrition Deficiency in India
There are many government initiatives to address nutrition deficiency, however, the impact of these initiatives is yet to be realized. As a part of CSR, the corporate sector has invested to help address the issue of nutrition deficiency in India. To support Indian government’s Poshan Abhiyaan, Tata Trusts, UNICEF, Sight and Life, CSRBOX, CII, WeCan and NASSCOM Foundation launched an initiative - IMPAct4Nutrition. This initiative allows private sectors to build strategies to combat nutrition deficiency and actively engage to build a social movement as well as build assets to convey the importance of nutrition sufficiency (141). This initiative is expected to be adopted by various corporate bodies to work on tackling the problem of nutrition deficiency. While this initiative is in its nascent stage, government needs to create more such opportunities for corporate sector, either through tangible benefits (tax rebate, allowances) or through intangible benefits (awards, accolades), to have a larger impact on nutrition and wellbeing.
National Dairy Development Board (NDDB), through its NDDB Foundation for Nutrition(NFN) has started “gift milk” program wherein the state milk unions or dairy cooperatives provides milk to children in government schools. The NFN mobilizes funds through CSR to run this initiative and is providing milk to about 118 schools across Delhi, Gujarat, Jharkhand, Maharashtra, Tamil Nadu, Telangana (142, 143). Reckitt Benckiser and Apollo Hospital Group have partnered to launch “Arogya Rakshak - Protected by Dettol, Cared by Apollo” initiative which targets health outcomes of people. This initiative is aimed to complement Dettol’s Swasth India program and Apollo’s Total Health program. The two brands are planning to launch a Center of Excellence(CoE) for community nutrition. One of the initiatives for this CoE is to train the frontline health workers through virtual reality and gamification as well as use of artificial intelligence to assist healthcare workers in detecting malnutrition (144). Microsoft has helped develop Child Growth Monitor to help fight malnutrition. Powered by Microsoft’s artificial intelligence technology and Azure services, the app monitors children’s growth and levels of nutrition (145). There have been some initiatives targeting nutrition by various corporates, however, there are few corporates who are focusing on nutrition for strong bone health across children, pregnant women and adults.
Many corporate hospitals have separate nutrition department. However, this segment provides services mostly for patients with co-morbidities to help them manage their diet. There is very minimal focus or no focus on nutrition for children and adults, specifically for bone health. The corporate India can increase its focus on helping India tackle the nutrition deficiency. There are many cases where the corporate India has helped in tackling the problems of hunger and wasting, however, we are yet to see significant impact of corporate India in helping deal with nutrition deficiency. As a motivator for the corporate sector to support strong bone health of children and adults, it will become necessary for the government to provide tangible and intangible benefits for companies that may help realize significant impact on nutrition deficiency.
E-Health and M-Health Approaches for Adequate Calcium Intake Across Rural and Urban India
Traditionally, delivery of services was based purely on the physical presence of healthcare workers, non-profit organizations and local knowledge among the communities. With the advent of digital technologies, the healthcare workers have been able to deliver services to the rural regions, thereby increasing the penetration of delivery of healthcare across the remote regions. Digitalization of healthcare sector has also led to advancements in add-on services targeted at nutritional intake of individuals across urban sectors. All these mechanisms use technologies such as mobile apps, analytics, artificial intelligence delivered through internet connectivity and are known as e-health and m-health services.
The problems of nutritional deficiency dealt at rural and urban regions remain divergent. The rural India lacks the understanding and benefits of adequate nutrient intake while the urban India understands the importance of nutrient intake but struggles with consistent intake of balanced diet due to dietary and lifestyle habits. The e-health and m-health services help to address these problems and aid in adequate nutrition intake including calcium for strong bone health.
The technological solutions or the strategic approaches that can be taken across rural and urban India are listed in both the Table 4B.
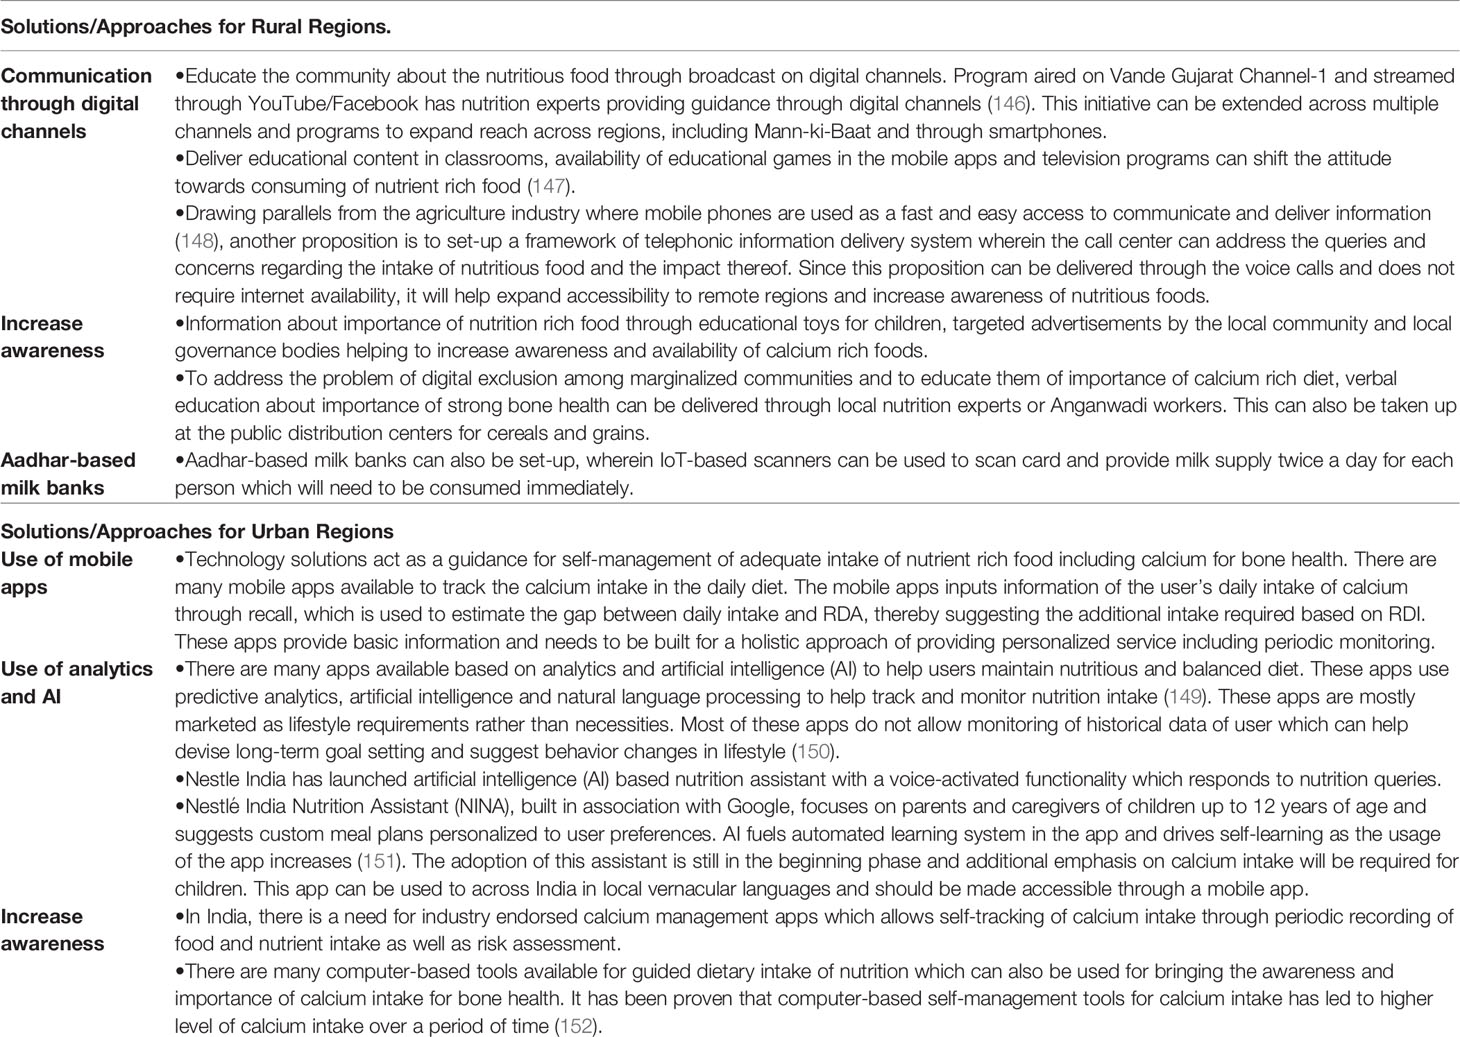
Table 4B Table showing strategies to combat dietary calcium deficiency governmental and digital in rural and urban region.
While there are myriad of solutions available to tackle the deficient intake of nutrition in both urban and rural India, they are not utilized to its full potential. Innovative ideas need to be leveraged to improve the awareness and impact of nutrition sufficient diet in both rural and urban India to achieve the target of Swasth Bharat.
Conclusion
Despite India being the largest milk and cereal producer in the world, there is widespread dietary calcium deficiency in India in the background of vitamin D deficiency. This indicates a gap between production and consumption in Indian dietary pattern with reference to dietary calcium. In the “production-supply-consumption chain”, India needs to introspect and adopt measures to increase the dairy and non-dairy sources of calcium which can address various segments of population with diverse cultural habits. Correction of dietary calcium deficiency will also partially correct secondary vitamin D deficiency. This can be achieved by targeting through the Indian Social Safety Net Program (SSNP) and also using technology to address this issue. The existing measures like MDM are viewed by beneficiaries as “food substitute” rather than as “food supplement” which was the concept while introducing the program—this misconception needs to be addressed. On the part of the government they should aim at bridging the “nutrient gap” and not the “food gap” in the MDM. The government should consider a legislation for fortification of food with calcium and to bring the calcium supplements under price control act to make it affordable for the common people. Till these programs are implemented, it is prudent on the part of people to meet the RDA of calcium either by choosing their dietary pattern to be calcium sufficient or by supplementing calcium to meet the goals (109, 116, 117). India needs to introspect and to plan in prospect the way ahead to combat this dietary calcium deficiency.
Search Strategy and Selection Criteria
References for this review were identified through searches of PubMed and Google scholar for articles published from January 1971 to December 2018, by using the terms “dietary Calcium Intake India”, “dietary calcium status India”, “calcium and Vitamin D India”. Studies which contained dietary calcium intake were taken for major consideration. For data on dietary calcium intake from 1970 till date, time trends were sourced from NIN-ICMR (national Institutes of Nutrition and Indian council of Medical Research) and NFI (nutrition foundation of India) websites. Most of the data was collected in previous searches of article on Modern India and Twin nutrient deficiency. Data was also sourced from National Sample Survey Office (NSSO)—Ministry of statistics and program implementation (MOSPI)-India, National Family Health Survey (NFHS) by International Institute of population sciences (IIPS), National dairy development board (NDDB) for data on milk consumption of India and FAO web site—Food and agricultural Organization of the United nations. Data was sourced from NINTATA website, Ministry of Human resources website. Searches were also conducted using the terms “Fortification of Milk India”, “RDA India, IOM, USA, and Canada”, “Nutrition apps”, “technology nutrition”, “mobile apps vitamin D calcium”, “mobile internet India”. Article resulting from these searches and relevant references cited in these articles were reviewed.
Author Contributions
CH conceptualized study design and did relevant literature search, data collection, analysis, interpretation, preparation of figures, writing of the manuscript. HA was practically and intellectually involved in the strategy section including digital technologies for tackling calcium deficiency and role of corporate sectors, searched and reviewed relevant literature, participated in data collection, analysis and interpretation. ES was involved in development of figures, literature search for the article. All authors contributed to the article and approved the submitted version.
Conflict of Interest
The authors declare that the research was conducted in the absence of any commercial or financial relationships that could be construed as a potential conflict of interest.
References
1. Bouillon R, Suda T. Vitamin D: calcium and bone homeostasis during evolution. Bonekey Rep (2014) 3:480. doi: 10.1038/bonekey.2013.214
2. Christakos S, Lieben L, Masuyama R, Carmeliet G. Vitamin D endocrine system and the intestine. Bonekey Rep (2014) 3:496. doi: 10.1038/bonekey.2013.230
3. Yeung BH, Law AY, Wong CK. Evolution and roles of stanniocalcin. Mol Cell Endocrinol (2012) 349(2):272–80. doi: 10.1016/j.mce.2011.11.007
4. Lieben L, Carmeliet G. Vitamin D signaling in osteocytes: effects on bone and mineral homeostasis. Bone (2013) 54(2):237–43. doi: 10.1016/j.bone.2012.10.007
5. Eisman JA, Bouillon R. Vitamin D: direct effects of vitamin D metabolites on bone: lessons from genetically modified mice. Bonekey Rep (2014) 3:499. doi: 10.1038/bonekey.2013.233
6. Bikle DD. Vitamin D: An ancient hormone. ExpDermatol (2011) 20(1):7–13. doi: 10.1111/j.1600-0625.2010.01202.x
7. Holick MF. Vitamin D: evolutionary, physiological and health perspectives. Curr Drug Targets (2011) 12(1):4–18. doi: 10.2174/138945011793591635
8. Rao DS, Raghuramulu N. Is vitamin D redundant in an aquatic habitat? JNutrSciVitaminol (1999) 45(1):1–8. doi: 10.3177/jnsv.45.1
9. Holick MF. The photobiology of vitamin D and its consequences for humans. Ann N Y Acad Sci (1985) 453:1–13. doi: 10.1111/j.1749-6632.1985.tb11793.x
10. Copping AM. Origin of vitamin D in cod-liver oil: vitamin D content of zooplankton. Biochem J (1934) 28(4):1516–20. doi: 10.1042/bj0281516
11. Krasowski MD, Yasuda K, Hagey LR, Schuetz EG. Evolutionary selection across the nuclear hormone receptor superfamily with a focus on the NR1I subfamily(vitamin D, pregnane X, and constitutive androstane receptors). Nucl Recept (2005) 3:2. doi: 10.1186/1478-1336-3-2
12. Haussler MR, Whitfield GK, Kaneko I, Haussler CA, Hsieh D, Hsieh JC, et al. Molecular mechanisms of vitamin D action. Calcif Tissue Int (2013) 92(2):77–98. doi: 10.1007/s00223-012-9619-0
13. Hochberg Z, Hochberg I. Evolutionary Perspective in Rickets and Vitamin D. Front Endocrinol (Lausanne) (2019) 10:306. doi: 10.3389/fendo.2019.00306
14. Jönsson T, Granfeldt Y, Ahrén B, Branell UC, Pålsson G, Hansson A, et al. Beneficial effects of a Paleolithic diet on cardiovascular risk factors in type 2 diabetes: a randomized cross-over pilot study. CardiovascDiabetol (2009) 8:35. doi: 10.1186/1475-2840-8-35
15. Gallagher J, Riggs BL, Eisman J, Hamstra A, Arnaud SB, Deluca HF. Intestinal calcium absorption and serum vitamin D metabolites in normal subjects and osteoporotic patients: effect of age and dietary calcium. JClin Invest (1979) 64(3):729–36. doi: 10.1172/JCI109516
16. Schlemmer U, Frølich W, Prieto RM, Grases F. Phytate in foods and significance for humans: food sources, intake, processing, bioavailability, protective role and analysis. Mol Nutr Food Res (2009) 53(Suppl 2):S330–375. doi: 10.1002/mnfr.200900099
17. Feskanich D, Willett WC, Colditz GA. Calcium, vitamin D, milk consumption, and hip fractures: a prospective study among postmenopausal women. Am J Clin Nutr (2003) 77(2):504–11. doi: 10.1093/ajcn/77.2.504
18. Clements MR. The problem of rickets in UK Asians. J Hum Nutr Diet (1989) 2(2):105–16. doi: 10.1111/j.1365-277X.1989.tb00015.x
19. Munns CF, Shaw N, Kiely M, Specker BL, Thacher TD, Ozono K, et al. Global Consensus Recommendations on Prevention and Management of Nutritional Rickets. J Clin Endocrinol Metab (2016) 101(2):394–415. doi: 10.1210/jc.2015-2175
20. Pettifor JM. Calcium and vitamin D metabolism in children in developing countries. Ann Nutr Metab (2014) 64(Suppl 2):15–22. doi: 10.1159/000365124
21. Holick MF. Vitamin D is not as toxic as was once thought: a historical and an up-to-date perspective. Mayo Clin Proc (2015) 90(5):561–4. doi: 10.1016/j.mayocp.2015.03.015
22. Diet and nutritional status of rural population, prevalence of hypertension and diabetes among adults and infant and young child feeding practices. Report of third repeat survey. Technical report No: 26. Hyderabad: National Institute of Nutrition, Indian Council of Medical Research; 2012. National Nutrition Monitoring Bureau. Available from: http://www.nnmbindia.org/1_NNMB_Third_Repeat_Rural_Survey_Technicl_Report_26.pdf.
23. Arlappa N, Balakrishna N, Kokku SB, Harikumar R, Rao KM, Ravindranath M, et al. Diet and Nutritional Status of the Older Adults in Rural India. J Of Aging Res And Healthcare (2016) 1:44–57. doi: 10.14302/issn.2474-7785.jarh-16-1157
24. Diet and Nutritional status of Tribal population and prevalence of Hypertension among Adults-Report of second repeat survey. Tech Rep No 25. https://www.nin.res.in/downloads/NNMBTribalReport.pdf.
25. Diet and Nutritional status of urban population in India and prevalence of obesity, hypertension, diabetes and hyperlipidemia in urban men and women. NNMB Brief Report on Urban Nutrition. Technical report No: 27. Hyderabad: National Institute of Nutrition, Indian Council of Medical Research (2017). Available at: https://www.nin.res.in/downloads/NNMB%20Urban%20Nutrition%20Report%20-Brief%20report.pdf. National Nutrition Monitoring Bureau.
26. Mandlik RM, Mughal ZM, Khadilkar AV, Ekbote VH, Kajale NA, Patwardhan VG, et al. Paradoxical Response of Parathyroid Hormone to Vitamin D-Calcium Supplementation in Indian Children. J Pediatr (2020) 216:197–203. doi: 10.1016/j.jpeds.2019.09.028
27. Mandlik R, Kajale N, Ekbote V, Patwardhan V, Khadilkar V, Chiplonkar S, et al. Determinants of Vitamin D status in Indian school-children. Indian J Endocr Metab (2018) 22(2):244–8. doi: 10.4103/ijem.IJEM_622_17
28. Raj JP, Venkatachalam S, Shekoba M, Norris JJ, Amaravati RS. Dietary calcium intake and physical activity levels among people living in Karnataka, India – An observational hospital-based study. J Family Med Prim Care (2018) 7(6):1411–6. doi: 10.4103/jfmpc.jfmpc_153_18
29. Patil S, Joglekar C, Desai M, Yadav A, Sonawane S, Chavan R, et al. Nutritional Status and Psychological Impairment in Rural Adolescent Girls: Pilot Data From “KOKAN” Region of Western India. Front Public Health (2018) 6:160. doi: 10.3389/fpubh.2018.00160
30. Shaki O, Rai SK, Kashid M, Chakrabarty BK. Prevalence of Osteoporosis in Peri- and Post-menopausal Women in Slum Area of Mumbai. India J Midlife Health (2018) 9(3):117–22. doi: 10.4103/jmh.JMH_84_17
31. Ekbote VH, Khadilkar AV, Khadilkar VV, Chiplonkar SA, Mughal Z. Dietary patterns with special reference to calcium intake in 2–16-year-old Urban Western Indian children. Indian J Public Health (2017) 61(3):188–93. doi: 10.4103/ijph.IJPH_85_16
32. Patel PP, Patel PA, Zulf MM, Yagnik B, Kajale N, Mandlik R, et al. Association of dental and skeletal fluorosis with calcium intake and serum vitamin D concentration in adolescents from a region endemic for fluorosis. Indian J Endocrinol Metab (2017) 21(1):190–5. doi: 10.4103/2230-8210.196013
33. Goswami R, Saha S, Sreenivas V, Singh N, Lakshmy R. Vitamin D-binding protein, vitamin D status and serum bioavailable 25(OH)D of young Asian Indian males working in outdoor and indoor environments. J Bone Miner Metab (2017) 35(2):177–84. doi: 10.1007/s00774-016-0739-x
34. Kajale N, Khadilkar A, Chiplonkar S, Mughal Z, Khadilkar V. Mansukhani N. A Cross-Sectional Study of Postpartum Changes in Bone Status in Indian Mothers. J Obstet Gynaecol India (2016) 66(4):218–25. doi: 10.1007/s13224-015-0746-1
35. Gupta A, Kant S, Pandav CS, Gupta SK, Rai SK, Misra P. Dietary calcium intake, serum calcium level, and their association with preeclampsia in rural North India. Indian J Community Med (2016) 41(3):223–7. doi: 10.4103/0970-0218.183591
36. Harinarayan CV, Ramalakshmi T. Patterns of dietary calcium intake in south Indian rural, urban and metropolitan city subjects. J Clin Sci Res (2015) 4(2):143–8. doi: 10.15380/2277-5706.JCSR.15.003
37. Raj JP, Oommen AM, Paul TV. Dietary calcium intake and physical activity levels among urban South Indian postmenopausal women. J Family Med Prim Care (2015) 4(3):461–4. doi: 10.4103/2249-4863.161355
38. Ghosh-Jerath S, Devasenapathy N, Singh A, Shankar A, Zodpey S. Ante natal care(ANC) utilization, dietary practices and nutritional outcomes in pregnant and recently delivered women in urban slums of Delhi, India: an exploratory cross-sectional study. Reprod Health (2015) 12:20. doi: 10.1186/s12978-015-0008-9
39. Kamalanathan S, Nambiar V, Shivane V, Bandgar T, Menon P, Shah N. Bone mineral density and factors influencing it in Asian Indian population with type 2 diabetes mellitus. Indian J Endocrinol Metab (2014) 18(6):831–7. doi: 10.4103/2230-8210.140268
40. Matsuzaki M, Kuper H, Kulkarni B, Radhakrishna KV, Viljakainen H, Taylor AE, et al. Life-course determinants of bone mass in young adults from a transitional rural community in India: the Andhra Pradesh Children and Parents Study (APCAPS). Am J Clin Nutr (2014) 99(6):1450–9. doi: 10.3945/ajcn.113.068791
41. Vazir S, Engle P, Balakrishna N, Griffiths PL, Johnson SL, Creed-Kanashiro H, et al. Cluster-randomized trial on complementary and responsive feeding education to caregivers found improved dietary intake,growth and development among rural Indian toddlers. Matern Child Nutr (2013) 9(1):99–117. doi: 10.1111/j.1740-8709.2012.00413.x
42. Shridhar K, Dhillon PK, Bowen L, Kinra S, Bharathi AV, Prabhakaran D, et al. Nutritional profile of Indian vegetarian diets–the Indian Migration Study (IMS). Nutr J (2014) 13:55. doi: 10.1186/1475-2891-13-55
43. Aggarwal V, Seth A, Marwaha RK, Sharma B, Sonkar P, Singh S, et al. Management of Nutritional Rickets in Indian Children: A Randomized Controlled Trial. J Trop Pediatr (2013) 59(2):127–33. doi: 10.1093/tropej/fms058
44. Zargar AH, Ahmad S, Masoodi SR, Wani AI, Bashir MI, Laway BA, et al. Vitamin D status in apparently healthy adults in Kashmir Valley of Indian subcontinent.Postgrad. Med J (2007) 83(985):713–6. doi: 10.1136/pgmj.2007.059113
45. Shivane VK, Sarathi V, Bandgar T, Menon P, Shah NS. High prevalence of hypovitaminosis D in young healthy adults from the western part of India. Postgrad Med J (2011) 87(1030):514–8. doi: 10.1136/pgmj.2010.113092
46. Marwaha RK, Puri S, Tandon N, Dhir S, Agarwal N, Bhadra K, et al. Effects of sports training & nutrition on bone mineral density in young Indian healthy females. Indian J Med Res (2011) 134:307–13.
47. Ramakrishnan S, Bhansali A, Bhadada SK, Sharma R, Walia R, Ravikiran M, et al. Vitamin D status and its seasonal variability in healthy young adults in an Asian Indian urban population. Endocr Pract (2011) 17(2):185–91. doi: 10.4158/EP10155.OR
48. Ekbote VH, Khadilkar AV, Chiplonkar SA, Hanumante NM, Khadilkar VV, Mughal MZ. A pilot randomized controlled trial of oral calcium and vitamin D supplementation using fortified laddoos in underprivileged Indian toddlers. Eur J Clin Nutr (2011) 65(4):440–6. doi: 10.1038/ejcn.2010.288
49. Sanwalka NJ, Khadilkar AV, Mughal MZ, Sayyad MG, Khadilkar VV, Shirole SC, et al. A study of calcium intake and sources of calcium in adolescent boys and girls from two socioeconomic strata, in Pune, India. Asia Pac J Clin Nutr (2010) 19(3):324–9.
50. Marwaha RK, Tandon N, Agarwal N, Puri S, Agarwal R, Singh S, et al. Impact of two regimens of vitamin D supplementation on calcium — vitamin D — PTH axis of schoolgirls of Delhi. Indian Pediatr (2010) 47(9):761–9. doi: 10.1007/s13312-010-0116-0
51. Puri S, Marwaha RK, Agarwal N, Tandon N, Agarwal R, Grewal K, et al. Vitamin D status of apparently healthy schoolgirls from two different socioeconomic strata in Delhi: relation to nutrition and lifestyle. Br J Nutr (2008) 99(4):876–82. doi: 10.1017/S0007114507831758
52. Goswami R, Gupta N, Ray D, Singh N, Tomar N. Pattern of 25-hydroxy vitamin D response at short (2 months) and long (1 year) interval after 8 weeks of oral supplementation with cholecalciferol in Asian Indians with chronic hypovitaminosis D. Br J Nutr (2008) 100(3):526–9. doi: 10.1017/S0007114508921711
53. Goswami R, Kochupillai N, Gupta N, Goswami D, Singh N, Dudha A. Presence of 25(OH) D deficiency in a rural North Indian village despite abundant sunshine. J Assoc Phys India (2008) 56:755–7.
54. Harinarayan CV, Ramalakshmi T, Prasad UV, Sudhakar D, Srinivasarao PVLN, Sarma KVS, et al. High prevalence of low dietary calcium, high phytate consumption, and vitamin D deficiency in healthy south Indians. Am J Clin Nutr (2007) 85(4):1062–7. doi: 10.1093/ajcn/85.4.1062
55. Ganpule A, Yajnik CS, Fall CH, Rao S, Fisher DJ, Kanade A, et al. Bone mass in Indian children–relationships to maternal nutritional status and diet during pregnancy: the Pune Maternal Nutrition Study. J Clin Endocrinol Metab (2006) 91(8):2994–3001. doi: 10.1210/jc.2005-2431
56. Harinarayan CV. Prevalence of vitamin D insufficiency in postmenopausal south Indian women. Osteoporos Int (2005) 16(4):397–402. doi: 10.1007/s00198-004-1703-5
57. Sachan A, Gupta R, Das V, Agarwal A, Awasthi PK, Bhatia V. High prevalence of vitamin D deficiency among pregnant women and their newborns in northern India. Am J Clin Nutr (2005) 81(5):1060–4. doi: 10.1093/ajcn/81.5.1060
58. Sahu M, Bhatia V, Aggarwal A, Rawat V, Saxena P, Pandey A, et al. Vitamin D deficiency in rural girls and pregnant women despite abundant sunshine in northern India. Clin Endocrinol (2009) 70(5):680–4. doi: 10.1111/j.1365-2265.2008.03360.x
59. Gulati S, Sharma RK, Gulati K, Singh U, Srivastava A. Longitudinal follow-up of bone mineral density in children with nephrotic syndrome and the role of calcium and vitamin D supplements. Nephrol Dialysis Transplant (2005) 20(8):1598–603. doi: 10.1093/ndt/gfh809
60. Harinarayan CV, Ramalakshmi T, Venkataprasad U. High prevalence of low dietary calcium and low vitamin D status in healthy south Indians. Asia Pac J Clin Nutr (2004) 13(4):359–64.
61. Rajeswari J, Balasubramanian K, Bhatia V, Sharma VP, Agarwal AK. Aetiology and clinical profile of osteomalacia in adolescent girls in northern India. Natl Med J India (2003) 16(3):139–42.
62. Tandon N, Marwaha RK, Kalra S, Gupta N, Dudha A, Kochupillai N. Bone mineral parameters in healthy young Indian adults with optimal vitamin D availability. Natl Med J India (2003) 16(6):298–302.
63. Goswami R, Gupta N, Goswami D, Marwaha RK, Tandon N, Kochupillai N. Prevalence and significance of low 25-hydroxyvitamin D concentrations in healthy subjects in Delhi. Am J Clin Nutr (2000) 72(2):472–5. doi: 10.1093/ajcn/72.2.472
64. Kapil U, Tandon M, Nayar D, Pathak P, Yadav R, Dwivedi SN. Dietary intake of trace elements, minerals and vitamins among severely malnourished children and its interrelationship with nutritional status:A prospective study. Asia Pac J Clin Nutr (1999) 8(4):268–71. doi: 10.1046/j.1440-6047.1999.00122.x
65. Harinarayan CV. Letter to the editor on “Vitamin D-binding protein, vitamin D status and serum bioavailable 25(OH)D of young Asian Indian males working in outdoor and indoor environments”. J Bone Miner Metab (2017) 35(2):243–4. doi: 10.1007/s00774-016-0776-5
66. NSS. 68th Round. Available at: http://mospi.nic.in/sites/default/files/publication_reports/nss_report_560_19dec14.pdf.
67. Deka R, Lindahl J, Randolph T, Grace D. The White Revolution In India -The End Or New Beginning? https://www.slideshare.net/ILRI/white-revolution-in-india.
68. FAO statistics. . http://www.fao.org/dairy-production-products/production/en/.
69. National Diary Development Board. Available at: https://www.nddb.coop/information/stats/milkprodindiahttps://www.nddb.coop/information/stats/percapitacomsp (Accessed on 11 july 2020). National Diary Development Board.
70. Kumar A, Joshi PK, Kumar P, Parappurathu S. Trends in the consumption of milk and milk products in India: Implications for self-sufficiency in milk production. Food Sec (2014) 6(5):719–26. doi: 10.1007/s12571-014-0376-y
71. FAOSTAT. . http://www.fao.org/faostat/en/?#search/milk.
72. Dawson-Hughes B, Harris SS, Krall EA, Dallal GE. Effect of calcium and vitamin D supplementation on bone density in men and women 65 years of age or older. NEngl J Med (1997) 337(10):670–6. doi: 10.1056/NEJM199709043371003
73. FAOSTAT. FAOSTAT Data—Food Balance. Rome, Italy: FAOSTAT (2017). Available at: http://www.fao.org/faostat/en/#data.
74. Khatkar BS, Chaudhary N, Dangi GJ. Production and Consumption of Grains. India Encyclopedia Food Grains (2016) 1:367–73. doi: 10.1016/B978-0-12-394437-5.00044-9
75. Halawar SV. The trend analysis of major food grains in India. Int J Curr Microbiol App Sci (2019) 8(3):353–60. doi: 10.20546/ijcmas.2019.803.044
76. DeFries R, Chhatre A, Davis KF, Dutta A, Fanzo J, Jerath SG, et al. Impact of Historical Changes in Coarse Cereals Consumption in India on Micronutrient Intake and AnemiaPrevalence. Food Nutr Bull (2018) 39(3):377–92. doi: 10.1177/0379572118783492
77. Longvah T, Ananthan R, Bhaskarachary K, Venkaiah K. Indian Food Composition 017. Hyderabad, India: National Institute of Nutrition, Ministry of Health and Family Welfare (2017).
78. Kaur KD, Jha A, Sabikhi L, Singh AK. Significance of coarse cereals in health and nutrition: a review. J Food Sci Technol (2014) 51(8):1429–41. doi: 10.1007/s13197-011-0612-9
79. Chavan JK, Kadam SS. Nutritional improvement of cereals by fermentation. Crit Rev Food Sci Nutr (1989) 28(5):349–400. doi: 10.1080/10408398909527507
80. Hulse JH, Laing EM, Pearson OE. Sorghum and the millets: their composition and nutritive value. New York: Academic (1980) p. 81–91.
81. Kumar P. Long term change in dietary patterns and food demand in Asia: India 1970-1990. Palawija News (1996) 13(3):1–14.
82. National Sample Survey Organisation. Household consumption of various goods and services in India 2011-12. Ministry of Statistics and Programme Implementation, Government of India, Report no.558(68/1.0/2).NSS 68th Round. (2014). Available at: http://mospi.nic.in/sites/default/files/publication_reports/Report_no558_rou68_30june14.pdf.
83. Deaton A, Drèze J. Food and nutrition in India: facts and interpretations. EconomicEcon Polit Wkly (2009) 44(7):42–65. doi: 10.2307/40278509.http://www.princeton.edu/~deaton/downloads/Food_and_Nutrition_in_India_Facts_and_Interpretations.pdf
84. Srivastava S, Mathur V, Sivaramane N, Kumar R, Hasan R, Meena P. Unravelling food basket of Indian households: revisiting underlying changes and future food demand. Ind Jn Agri Econ (2013) 68(4):535–51. doi: 10.22004/ag.econ.206353
85. NSSO. ”Level and Pattern of Consumer Expenditure, 2004-05”, Report 508, National Sample Survey Organisation, New Delhi. (2006). http://mospi.nic.in/sites/default/files/publication_reports/508_final.pdf.
86. Oldiges C. Cereal Consumption and Per Capita Income in India. EconomicEcon Polit Wkly (2012) 47(6):63–71.
87. Gupta S, Singh K. An Analysis of Changing Rural-Urban Consumption Pattern in India. IOSR J Humanit Soc Sci (2016) 21:56–71. doi: 10.9790/0837-2109085671
88. RBI. Handbook of Statistics on Indian Economy 2014-15. (2015), Reserve Bank of India. Available at: https://www.rbi.org.in/scripts/AnnualPublications.aspx?head=Handbook+of+Statistics+on+Indian+Economy¨fromdate=09%2F15%2F2015¨todate=09%2F17%2F2015.
89. Ministry of Statistics & Programme Implementation, GOI. Level and Pattern of Consumer Expenditure in India. NSSO 68thRound(2011-12), Report No.555. (2014). http://mospi.nic.in/sites/default/files/publication_reports/Report_no558_rou68_30june14.pdf.
90. Private Final Consumption Expenditure by Object in India, National Accounts Statistics Reports, CSO. Retrieved from. https://www.indiastat.com/.
91. Ministry of Statistics & Programme Implementation, GOI. Level and Pattern of Consumer Expenditure in India. NSSO 50th Round (1993-94), Report No.402. (. (1996). http://mospi.nic.in/sites/default/files/publication_reports/402_final.pdf.
92. Ministry of Statistics & Programme Implementation, GOI. Key Indicators of Household Consumer Expenditure in India. NSSO 68th Round (2011-12). (2013). http://mospi.nic.in/sites/default/files/publication_reports/KI-68th-HCE.pdf.
93. Mandlik R, Mughal Z, Khadilkar A, Chiplonkar S, Ekbote V, Kajale N, et al. Occurrence of infections in schoolchildren subsequent to supplementation with vitamin D-calcium or zinc: a randomized, double-blind, placebo-controlled trial. Nutr Res Pract (2020) 14(2):117–26. doi: 10.4162/nrp.2020.14.2.117
94. What India Eats. Available at: https://www.nin.res.in/nutrition2020/what_india_eats.pdf.
95. https://www.ars.usda.gov/ARSUserFiles/80400530/pdf/DBrief/29_Protein_Intake_of_Adults_1516.pdf (Accessed on 8-12-2020).
96. Sanwalka NJ, Khadilkar AV, Mughal MZ, Sayyad MG, Khadilkar VV, Shirole SC, et al. Aa study of calcium intake and sources of calcium in adolescent boys and girls from two socioeconomic strata, in Pune, India. Asia Pac J Clin Nutr (2010) 19(3):324–9.
97. Harinarayan CV, Ramalakshmi T, Prasad UV, Sudhakar D. Vitamin D status in Andhra Pradesh: a population-based study. Indian J Med Res (2008) 127(3):211–8.
98. Harinarayan CV, Gupta N, Kochupillai N. Vitamin D status in primary hyperparathyroidism in India. Clin Endocrinol (1995) 43(3):351–8. doi: 10.1111/j.1365-2265.1995.tb02043.x
99. Harinarayan CV, Holick MF, Prasad UV, Vani PS, Himabindu G. Vitamin D status and sun exposure in India. Dermatoendocrinol (2013) 5(1):130–41. doi: 10.4161/derm.23873
100. Mellanby E. An experimental investigation on rickets. Lancet (1919) 1:407–12.doi 10.1016/S0140-6736(01)25465-8.
101. Kumssa DB, Joy EJM, Ander EL, Watts MJ, Young SD, Walker S, et al. Dietary calcium and zinc deficiency risks are decreasing but remain prevalent. Sci Rep (2015) 5:10974. doi: 10.1038/srep10974
102. Teotia SP, Teotia M. Nutritional bone disease in Indian population. Indian J Med Res (2008) 127:219–8.
104. Tata-NIN. Centre of Excellence in Public Health Nutrition. The state of food and nutrition in India. (2017). https://www.dashboard.nintata.res.in/#/dashboard/nutrient-intake.
105. ICMR. Nutrient requirements and Recommended dietary allowances for Indians, A Report of the Expert Group of the National Institute of Nutrition (ICMR). (2020). https://www.nin.res.in/RDA_Full_Report_2020.html.
106. Ross AC, Manson JE, Abrams SA, Aloia JF, Brannon PM, Clinton SK, et al. The 2011 report on dietary reference intakes for calcium and vitamin D from the institute of medicine: what clinicians need to know. JClin Endocrinol Metab (2011) 96(1):53–8. doi: 10.1210/jc.2010-2704
107. FAO. dietary calcium intake recommendations. http://www.fao.org/3/y2809e/y2809e11.pdf.
108. Harinarayan CV, Khadilkar A, Mandlik R. Twin Nutrient Deficiencies in Modern India – Revised ICMR-NIN Calcium and Vitamin D Intake Recommended Dietary Allowances (RDA) 2020 - Well Intended but Needs some updates. (in communication).
109. Harinarayan CV, Akhila H. Modern India and the Tale of Twin Nutrient Deficiency-Calcium and Vitamin D-Nutrition Trend Data 50 Years-Retrospect, Introspect, and Prospect. FrontEndocrinol(Lausanne) (2019) 10:493. doi: 10.3389/fendo.2019.00493
110. Fiedler JL, Babu S, Smitz MF, Lividini K, Bermudez O. Indian social safety net programs as platforms for introducing wheat flour fortification: a case study of Gujarat, India. Food Nutr Bull (2012) 33(1):11–30. doi: 10.1177/156482651203300102
111. Dixit P, Gupta A, Dwivedi LK, Coomar D. Impact Evaluation of Integrated Child Development Services in Rural India: Propensity Score Matching Analysis. SAGE J (2018) 8(2):1–7. doi: 10.1177/2158244018785713
112. Naresh S, Nisha S. ICDS in India: Policy, design and delivery issues. IDS Bull (2009) 40(4):45–52. doi: 10.1111/j.1759-5436.2009.00058.x
113. Ray A. National Guidelines for Calcium Supplementation During Pregnancy and Lactation, India. (2014). https://www.researchgate.net/publication/282337540_National_Guidelines_for_Calcium_Supplementation_During_Pregnancy_and_Lactation_India.
114. Holick MF, Binkley NC, Bischoff-Ferrari HA, Gordon CM, Hanley DA, Heaney RP, et al. Evaluation, treatment, and prevention of vitamin D deficiency: an Endocrine Society clinical practice guideline. J Clin Endocrinol Metab (2011) 96(7):1911–30. doi: 10.1210/jc.2011-0385
115. Harinarayan CV. How to treat Vitamin D deficiency in sun-drenched India - guidelines. J Clin Sci Res (2018) 7(3):131–40. doi: 10.4103/JCSR.JCSR_1_19 http://www.jcsr.co.in/text.asp?2018/7/3/131/255663
117. Ritu G, Gupta A. Vitamin D deficiency in India: prevalence, causalities and interventions. Nutrients (2014) 6(2):729–75. doi: 10.3390/nu6020729
118. Ritu G, Gupta A. Fortification of foods with vitamin D in India(2014). (Accessed on 11 July 2020).
119. Liyanage C, Hettiarachchi M. Food fortification. Ceylon Med J (2011) 56(3):124–7. doi: 10.4038/cmj.v56i3.3607
120. Sirohi A, Pundhir A, Ghosh S. Food Fortification: A Nutritional Management Strategy in India. Innovare J Food Sci (2018) 6(2):1–8.
121. Mansoor M, Rawoof R. A Study on Nutrient Analysis of Mid-Day Meal. Int J Res Appl Sci Eng Technol (2018) 6(VI):1364–9. doi: 10.22214/ijraset.2018.6198
122. Deodhar SY, Mahandiratta S, Ramani KV, Mavalankar D, Ghosh S, Braganza V. Mid-day meal scheme: understanding critical issues with reference to Ahmedabad City. Working paper No. 2007-03-03. Ahmedabad: Indian Institute of Management (2007).
123. Bhagwat S, Sankar R, Sachdeva R, , Sivaranjani JL. Improving the nutrition quality of the school feeding program(Mid-day meal) in India through fortification: a case study. Asia Pac J Clin Nutr (2014) 23(Suppl-1):S12–9. doi: 10.6133/apjcn.2014.23.s1.01
124. Diet and nutritional status of population and prevalence of hypertension among adults in rural areas, National Nutrition Monitoring Bureau report no. 24, National Institute of Nutrition, Indian Council of Medical Research. (2006). https://www.nin.res.in/downloads/NNMBReport06Nov20.pdf.
125. Mehta B. Nutritional Contribution of Mid-Day Meal to Dietary Intake of School Children in Ludhiana District of Punjab. J Nutr Food Sci (2013) 3:183. doi: 10.4172/2155-9600.1000183
126. Nutan, Preja. To Assess the Nutritional Status of the Midday meal consuming rural School Going Girls(7–10 years). Int J Eng Sci Invent (2014) 3)3:31–3.
127. Sireesha G, Kusuma D. andMid-Day Meal Programme and Nutritional Status of School Going Children – A Study 53. Indian J Soc Dev (2014) 14(1):53–65.
128. Department of School Education & Literacy. Ministry of Human Resource Development, Government of India. http://dashboard.udiseplus.gov.in/#!/sedashboardhttps://mhrd.gov.in/Dashboard/index.html.
129. Puranik S, Kam J, Sahu PP, Yadav R, Srivastava RK, Ojulong H, et al. Harnessing Finger Millet to Combat Calcium Deficiency in Humans: Challenges and Prospects. Front Plant Sci (2017) 8:1311. doi: 10.3389/fpls.2017.01311
130. Mbithi-Mwikya S, Camp JV, Yiru Y, Huyghebaert A. Nutrient and antinutrient changes in finger millet (Eleusinecoracan) during sprouting. Lebensm Wiss Technol (2000) 33(1):9–14. doi: 10.1006/fstl.1999.0605
131. Makokha AO, Oniang o, Njoroge S, Kamar OK. Effect of Traditional Fermentation and Malting on Phytic Acid and Mineral Availability from Sorghum (Sorghum Bicolor) and Finger Millet (EleusineCoracana) Gssrain Varieties Grown in Kenya. Food Nutr Bull (2002) 23:241–5. doi: 10.1177/15648265020233S147
132. Palanisamy BD, Rajendran V, Sathyaseelan S, Bhat R, Venkatesan BP. Enhancement of nutritional value of finger millet-based food (Indian dosa) by co-fermentation with horse gram flour. Int J Food Sci Nutr (2012) 63(1):5–15. doi: 10.3109/09637486.2011.591367
133. Gupta RK, Gangoliya SS, Singh NK. Reduction of phytic acid and enhancement of bioavailable micronutrients in food grains. J Food Sci Technol (2015) 52(2):676–84. doi: 10.1007/s13197-013-0978-y
134. Rafferty K, Walters G, Heaney RP. Calcium fortificants: overview and strategies for improving calcium nutriture of the U.S. population. J Food Sci (2007) 72(9):R152–8. doi: 10.1111/j.1750-3841.2007.00521.x
135. Heaney RP, Rafferty K, Dowell MS, Bierman J. Calcium fortification systems differ in bioavailability. J Am Diet Assoc (2005) 105(5):807–9. doi: 10.1016/j.jada.2005.02.012
136. Weaver CM. Calcium in Food Fortification Strategies. Int Dairy J (1998) 8(5-6):443–9. doi: 10.1016/S0958-6946(98)00067-3
137. Bonjour JP, Carrie AL, Fenari S, Clavien H, Slosman D, Thientz G, et al. Calcium-enriched foods and bone mass growth in prepubertal girls-A randomized, double-blind, placebo-controlled trial. J Clin Invest (1997) 99(6):1287–94. doi: 10.1172/JCI119287
138. Borghi L, Schianchi T, Meschi T, Guerra A, Allegri F, Maggiore U, et al. Comparison of two diets for the prevention of recurrent stones in idiopathic hypercalciuria. NEng J Med (2002) 346(2):77–84. doi: 10.1056/NEJMoa010369
139. Curhan GC, Willett WC, Rimm EB, Stampfer MJ. A prospective study of dietary calcium and other nutrients and the risk of symptomatic kidney stones. NEngl J Med (1993) 328(12):833–8. doi: 10.1056/NEJM199303253281203
140. Heaney RP, Dowell MS, Hale DA, Bendich A. Calcium absorption varies within the reference range for serum 25-hydroxyvitamin D. J Am Coll Nutr (2003) 22(2):142–6. doi: 10.1080/07315724.2003.10719287
141. https://www.ipeglobal.com/we-can/impact4nutrition-a-public-private-sector-collaboration-for-poshan-abhiyaan-35.html.
142. https://timesofindia.indiatimes.com/city/vadodara/gift-milk-programme-launched-for-1000-students-in-anand/articleshow/74142920.cms.
144. https://www.outlookindia.com/magazine/story/outlook-spotlight-reckitt-benckiser-apollo-hospitals-to-partner-in-ambitious-nutrition-initiative/302611.
145. https://www.techradar.com/in/news/a-new-app-to-track-malnutrition-in-india-using-microsofts-ai-tech.
148. Chhachhar AR, Hassan Md, Salleh. The Use of Mobile Phone Among Farmers for Agriculture Development. Int J Sci Res (2013) 2(6):95–8. doi: 10.15373/22778179/JUNE2013/31. https://www.researchgate.net/publication/244484894_The_Use_of_Mobile_Phone_Among_Farmers_for_Agriculture_Development.
149. https://analyticsindiamag.com/5-ai-powered-nutrition-apps-that-help-fitness-enthusiasts-with-their-calorie-intake/.
150. Tay I, Garland S, Gorelik A, Wark JD. Development and Testing of a Mobile Phone App for Self-Monitoring of Calcium Intake in Young Women. JMIRMhealthUhealth (2017) 5(3):e27. doi: 10.2196/mhealth.5717
151. https://www.nutritioninsight.com/news/parents-meet-nina-nestl%C3%A9-india-pilots-nations-first-ai-nutrition-assistant-developed-with-google.html.
Keywords: modern India, recommended dietary allowances, recommended dietary intake, vitamin D, dietary calcium deficiency, fortification, Ragi (Eleusine coracana), production supply consumption chain
Citation: Harinarayan CV, Akhila H and Shanthisree E (2021) Modern India and Dietary Calcium Deficiency—Half a Century Nutrition Data—Retrospect–Introspect and the Road Ahead. Front. Endocrinol. 12:583654. doi: 10.3389/fendo.2021.583654
Received: 15 July 2020; Accepted: 28 January 2021;
Published: 06 April 2021.
Edited by:
Jonathan H. Tobias, University of Bristol, United KingdomReviewed by:
Jessica Smith, General Mills, United StatesFilippo Maffezzoni, Civil Hospital of Brescia, Italy
Copyright © 2021 Harinarayan, Akhila and Shanthisree. This is an open-access article distributed under the terms of the Creative Commons Attribution License (CC BY). The use, distribution or reproduction in other forums is permitted, provided the original author(s) and the copyright owner(s) are credited and that the original publication in this journal is cited, in accordance with accepted academic practice. No use, distribution or reproduction is permitted which does not comply with these terms.
*Correspondence: Chittari Venkata Harinarayan, Y3ZoYXJpNWVuZG9AcmVkaWZmbWFpbC5jb20=