 Viktória B. Horváth1
 Eszter Soltész-Katona1,2
 Éva Wisniewski1Anikó Rajki1,2Eszter Halász1,2Balázs Enyedi1,3,4
 László Hunyady1,2
 András Dávid Tóth2,5
 Gergő Szanda1,2*
- 1Department of Physiology, Semmelweis University, Budapest, Hungary
- 2MTA-SE Laboratory of Molecular Physiology, Eötvös Loránd Research Network, Budapest, Hungary
- 3MTA-SE Lendület Tissue Damage Research Group, Hungarian Academy of Sciences and Semmelweis University, Budapest, Hungary
- 4HCEMM-SE Inflammatory Signaling Research Group, Department of Physiology, Semmelweis University, Budapest, Hungary
- 5Department of Internal Medicine and Haematology, Semmelweis University, Budapest, Hungary
The G protein-coupled type 1 cannabinoid receptor (CB1R) mediates virtually all classic cannabinoid effects, and both its agonists and antagonists hold major therapeutic potential. Heterologous expression of receptors is vital for pharmacological research, however, overexpression of these proteins may fundamentally alter their localization pattern, change the signalling partner preference and may also spark artificial clustering. Additionally, recombinant CB1Rs are prone to intense proteasomal degradation, which may necessitate substantial modifications, such as N-terminal truncation or signal sequence insertion, for acceptable cell surface expression. We report here that tuning down the expression intensity of the full-length CB1R reduces proteasomal degradation and offers receptor levels that are comparable to those of endogenous CB1 receptors. As opposed to high-efficiency expression with conventional promoters, weak promoter-driven CB1R expression provides ERK 1/2 and p38 MAPK signalling that closely resemble the activity of endogenous CB1Rs. Moreover, weakly expressed CB1R variants exhibit plasma membrane localization, preserve canonical Gi-signalling but prevent CB1R-Gs coupling observed with high-expression variants. Based on these findings, we propose that lowering the expression level of G protein-coupled receptors should always be considered in heterologous expression systems in order to reduce the pressure on the proteasomal machinery and to avoid potential signalling artefacts.
Introduction
The cannabinoid type-1 receptor (CB1R) is a G protein-coupled receptor (GPCR) that conveys both the therapeutic and the side-effects and of plant-derived phyto- and synthetic cannabinoids, and also mediates the actions of the body’s own cannabinoids (the endocannabinoids). CB1Rs play important regulatory role in virtually all central nervous areas (1, 2), whereas peripheral receptors are now well-documented contributors to the development of diet-induced obesity (3, 4), pancreatic β-cell dysfunction (5, 6), leptin and insulin resistance (7, 8) and to the complications of metabolic syndrome (9, 10). By virtue of such multifaceted actions under physiological and pathological conditions, both CB1R agonists and antagonists hold considerable therapeutic promise (11, 12) with encouraging new-generation ligands being under development (4, 13–15).
The heterologous expression of recombinant receptors is often the first step of drug development. Vector-driven expression in cell lines provides invaluable knowledge of receptor function and ligand characteristics. However, caution should be taken when interpreting in vitro data as high expression level of recombinant receptors may lead to altered localization, artificial dimerization or clustering of receptors (16–18) and may even cause membrane deformations (19). Moreover, high receptor amounts may alter the receptor-G protein stoichiometry and, in turn, bring about non-canonical signalling events, as reported in the case of A1 adenosine (20), α2-adrenergic (21) and, prominently, CB1 receptors (15).
Another possible drawback of receptor overexpression may be the intense degradation of the recombinant receptor via proteolytic pathways that are not significantly involved in receptor turnover normally. This certainly applies for the CB1R, in which the combination of an unusually long N-terminal tail and the lack of a signal sequence impedes normal co-translational translocation across the ER membrane and marks the recombinant receptor for proteasomal degradation (22, 23). This undesired degradation can be overcome by N-terminal truncation or by N-terminal insertion of a signal sequence, nevertheless, such manoeuvres may alter receptor maturation and trafficking in an unpredictable manner (23, 24).
In the light of the abovementioned pitfalls, heterologous expression of the CB1R and of other GPCRs ought to be optimized on a regular basis so as to minimize the risk of signalling artefacts and the overload of the proteasomal machinery. We speculated that simply lowering the expression level of the CB1R to close-to-endogenous amounts may provide such benefits. We report here that, in fact, reducing the transcription level of the recombinant CB1R is sufficient to reduce proteasomal degradation and to eliminate non-canonical signalling events without the need to modulate the receptor sequence itself.
Materials and Methods
Materials and Pharmacons
Unless otherwise noted, drugs were dissolved in sterile dimethyl sulfoxide (DMSO) (To avoid water absorption into the solvent, the sterile filtered DMSO was stored in small aliquots at -20°C.) The stock solutions were split into small aliquots and a maximum of 2 freeze-thaw cycles were allowed. In all experiments, the final concentration of DMSO was limited to 0.15%. (For the origin of chemicals, final concentrations and for further methodological details see Supplementary Table I).
Cell Culture, Transfection and Cell Stimulation
GT1-7 cells (25) were from Sigma Aldrich, Neuro 2a and HEK 293 cells were from American Type Culture Collection (ATCC). All cells were cultured in Dulbecco’s Modified Eagle Medium (DMEM) containing 10% foetal bovine serum and supplemented with 100 μg/ml streptomycin and 100 U/ml penicillin (“complete DMEM”). (1.5 g/L NaHCO3 formulations were used exclusively to achieve pH 7.4 at 5% CO2 and 37°C.) Cells were plated into poly-L-lysine-coated 6-well or 12-well plates at a density of 6-7.5-10×104/cm2 (GT1-7), 3-4×10⁴/cm2 (Neuro 2a) or 2-3×10⁴/cm2 (HEK 293) on day 1. GT1-7 cells were electroporated (1350 V, 30 ms; 1x) on the day of plating with the Neon Transfection system (Invitrogen) following the manufacturer’s protocol or transfected in Ultra-MEM with Lipofectamine 2000 (0.3 µL/cm2) for 6 h on day 2 and subsequently on day 3 with Lipofectamine LTX + Plus Reagent (0.5 µL/cm2 Lipofectamine LTX + 0.67 µL/µg total DNA Plus Reagent) in complete DMEM. HEK 293 cells were transfected on day 2 in Ultra-MEM with Lipofectamine 2000 (0.2-0.3 µL/cm2) or in complete DMEM with Lipofectamine LTX + Plus Reagent (0.6 µL/cm2 Lipofectamine LTX + 0.5 µL/µg total DNA Plus Reagent). Neuro 2a cells were transfected in complete DMEM using Lipofectamine LTX + Plus Reagent (0.6 µL/cm2 Lipofectamine LTX + 0.5 µL/µg total DNA Plus Reagent). Transfection of siRNA into Neuro 2a cells was performed as follows: on day 2 cells were treated with siRNA in Ultra-MEM for 6 h in the presence of Lipofectamine RNAiMAX (0.5 µL/cm2). Then, on day 3, cells were treated again with siRNA in complete DMEM for 6 h with Lipofectamine RNAiMax. Unless otherwise indicated, siRNA concentration was 20 nM and construct DNA amount was 0.05-0.07 µg/cm2/construct. Serum deprivation was performed by changing the complete medium to empty DMEM 14 h (GT1-7) or 4 h (Neuro 2a and HEK293) prior to experimentation. One hour prior to stimulation, medium was changed to DMEM + HEPES (Pan-Biotech) and cell stimulation was carried out in this incubation medium. In most of the experiments, 6-well plates and 12-well plates were snap frozen with liquid nitrogen and stored at -80°C until analysis. Passages numbers 4–30 were used. At all steps, bicarbonate-containing media were equilibrated at 37°C and 5% CO2 for at least 6 h before application.
Constructs, siRNA
Human wild-type CB1R and Δ64 CB1R [lacking the N-terminal 1-64 amino acids (22)] were expressed in pcDNA3.1 vectors (driven by the early-immediate CMV promoter for high-level expression; sequence of the CMV promoter: CGCCCCATTGACGCAAATGGGCGGTAGGCGTGTACGGTGGGAGGTCTATATAAGCAGAGCTGGTTTAGTGAACCGTCAGATC. For mild heterologous expression a pEYFP-N1 backbone was modified by omitting YFP and changing the promoter to the human herpes simplex virus thymidine kinase (TK) promoter (in order to gain moderate expression of the transgene). Sequence of the thymidine kinase promoter was: ATGACACAAACCCCGCCCAGCGTCTTGTCATTGGCGAATTCGAACACGCAGATGCAGTCGGGGCGGCGCGGTCCCAGGTCCACTTCGCATATTAAGGTGACGCGTGTGGCCTCGAACACCGAGCGACCCTGCAGCGACCCGCTTAA. The cloning was performed with the help of the following enzymes: HindIII, AgeI, BamHI (Thermo Fisher Scientific). For fluorescent labelling, human wild-type and Δ64 CB1Rs were inserted into pEGFP-N1, or promoter modified (CMV to TK) pEYFP-N1 or promoter modified pEGFP expression vectors. Control (non-silencing) dsRNA sequences were designed based on the “C9-11” method (26). For dsRNA sequences, please refer to Supplementary Table 2.
Western Blotting
The cultured cells were suspended in 4°C complete lysis buffer (v.i.) in a volume of 150-200 µL/9.5 cm2 growth area. After a 30 min incubation period on ice, insoluble material was removed by centrifugation at ~20.000 g (4°C for 10 min) and protein concentration was determined with BCA Assay (Thermo Fisher Scientific). The complete lysis buffer was based on a modified RIPA buffer containing: 150 mM NaCl, 1% sodium deoxycholate, 1% Triton X-100, 0.1% SDS, 1 mM EGTA 1 mM EDTA and 20 mM Tris-HCl (pH 7.35 at 4°C). This modified RIPA buffer was supplemented with 1 mM sodium orthovanadate, 1 mM phenylmethylsulfonyl fluoride, aprotinin, protease inhibitor cocktail, phosphatase inhibitor cocktail 1 and 2 (all 1:100). After the addition of 4x Laemmli sample buffer (Bio-Rad), proteins were separated in reducing mini or midi format Tris-glycine polyacrylamide gradient gels (4-15%, Bio-Rad). (Final concentration of β-mercaptoethanol in the samples was set to 5%). Alternatively, 2x Laemmli sample buffer with 10% of β-mercaptoethanol was used to suspend the cultured cells, so that the samples were directly loaded to the Tris-glycine polyacrylamide gradient gels. Proteins were then blotted onto nitrocellulose membranes using the Transblot-cell semi-dry transfer system with the fitting transfer packs (Bio-Rad).
Membranes were blocked with Tris buffered saline + 0.1% Tween-20 (TBST) supplemented with 5% milk and incubated overnight at 4°C with primary antibodies in TBST + 5% BSA + 0.1% sodium azide (for the list of antibodies, please see Supplementary Table 3). Horseradish peroxidase conjugated secondary antibodies (PerkinElmer) were diluted in TBST + 5% milk and incubated at room temperature for 1 h. Luminescence was measured with Azure 600 (Azure Biosystems, Dublin, CA, USA) chemiluminescence imaging device. West Pico Plus (ThermoFisher) or custom-made solution (100 mM Tris-Cl, 0.2 mM p-coumaric acid, 1.1 mM luminol, 2.6 mM H2O2, pH 8.5) was used as substrate for the peroxidase.
For densitometry, captured images were background subtracted with the apt module of Image J (NIH). The integrated density of individual protein bands was measured also with the Image J software and the ratio of phosphorylated to total protein (p/t ratio) was regarded as the degree of activation. Representative images were brightness and contrast adjusted with the appropriate modules of Image J (NIH) and blots were aligned in Adobe Illustrator. (Since chemiluminescent images have 16-bit depth, when needed, both high and low contrast versions of the same raw image are presented to provide a better representation. Please also note that western blots images comparing phosphorylated and total protein amounts of ERK1/2 and p38 MAPKs were exposed to identical conditions throughout the entire immunoblot process including image capture and brightness/contract adjustments. Therefore, phospho- and total blot images of different CB1R constructs within the same cell type are directly comparable.) Unless otherwise specified, data were normalized to the vehicle treated or the lowest agonist concentration treated TK-CB1R group.
Protease Inhibition and ER-Stress Measurements
For the assessment of CB1R degradation, cells were treated with various protease and proteasome inhibitors or vehicle for 8 h in serum-free DMEM on day 4. For further details on pharmacons, please see Supplementary Table 1. To evaluate the intact-to-cleaved receptor relationship, the ratio of integrated densities between 50 to 100 kDa to that below 40 kDa was calculated.
Measurement of Cytosolic [cAMP]
For BRET measurements, Neuro 2a or HEK 293 cells were transfected in suspension using Lipofectamine 2000 (Invitrogen; 0.5 μl/well) and plated on white poly-L-lysine coated 96-well plates in 50.000 cells/well density. The DNA amounts were 0.175 μg Epac-BRET sensor/well (27, 28) and 0.25 μg CB1 receptor construct/well. Before the BRET measurement, cells were serum starved for 3 hours. Experiments were performed on adherent cells 24 hours after the transfection using a Varioskan Flash multimode plate reader (Thermo Scientific, Waltham, MA). Prior to stimulation, the medium was changed to a modified Krebs-Ringer buffer containing 120 mM NaCl, 4.7 mM KCl, 1.2 mM CaCl2, 0.7 mM MgSO4, 10 mM glucose, and Na-HEPES 10 mM, pH 7.4, experiments were carried out at 37°C. The BRET measurements were started by adding cell-permeable coelenterazine h (Regis Technologies, Morton Grove, IL) to the wells at a final concentration of 5 μM. The luminescence intensities were recorded at 530 nm and 480 nm using filters (0.5 s/well). Since within the Epac-BRET sensor the intramolecular BRET decreases with the increase of [cAMP] (27), the 485 to 530 nm emission intensity ratio (BRET ratio) was regarded as a measure of [cAMP] (as opposed to the conventional 530:480 nm ratio). BRET ratios were normalized to the average of baseline (i.e. prior to the addition of any drug or vehicle).
Confocal Microscopy
Cells expressing various GFP-tagged CB1R constructs were imaged on a spinning disk confocal imaging setup at room temperature (~26°C) using a Nikon Eclipse Ti2 microscope equipped with a CFI SR HP Plan Apochromat Lambda S 100XC silicon immersion objective lens, a Yokogawa CSU-W1 Spinning Disk unit, a Photometrics Prime BSI sCMOS camera and an Omicron LightHUB+ diode laser light engine. EGFP fluorescence was excited using the 488 laser line and emission was collected using a 525/20 bandpass filter (Chroma). Up to 70 Z-stack slices with a resolution of 0.3 µm were acquired per field of view with the NIS-Elements software (Nikon). Plasma membrane and cytosolic CB1R fluorescence in non-processed raw images were determined at approx. the bottom 1/3 in the z-axis (i.e. closer to the cell-coverslip interface) along a profile running through the cell. The first peak above the cell-free background was interpreted as plasmalemmal fluorescence whereas cytosolic florescence was defined as the intensity ‘below’ the plasma membrane, at a position exactly 1 µm towards the cell centre. For the purpose of demonstration, background subtraction and brightness/contrast adjustments were performed with Image J (NIH) on representative images.
Data Analysis and Statistics
Means + s.e.m. or ± s.e.m. are shown, unless indicated otherwise. Data were obtained from at least 3 independent experiments or specified otherwise. In some experiments, minimal and maximal values have been uniformly excluded in all groups based on the ROUT method. For calculating significance of differences, one and two-way parametric or non-parametric ANOVA and post-hoc tests were applied, as appropriate. Concentration-response curves were fitted using the 3-parameter log[agonist] – response equation [(Y=Bottom + (Top-Bottom)/(1 + 10(LogEC50-X))]. Data were analysed with Microsoft Excel (Microsoft), Image J (NIH) and GraphPad Prism 5 (GraphPad Software Inc.) software.
Results
Weak Promoter-Driven Expression of the Full-Length CB1R Provides Close-to-Endogenous Receptor Levels
In order to study the effect of expression level and the long N-terminal tail on CB1 receptor abundance in heterologous systems, we cloned the full-length and the N-terminally truncated (Δ64) human CB1R into vectors that use either the conventional, strong early-immediate CMV (cytomegalovirus) or the weak HSV (herpes simplex virus) thymidine kinase (TK) promoter for transcription initiation (Figure 1A). We transfected the constructs into 3 different cell types, namely into HEK 293 cells, into undifferentiated Neuro 2a neuroblasts (29) and into highly-differentiated GT1-7 neurons (30). Neuro 2a cells express functional CB1Rs (Supplementary Figure 1A and Supplementary Figure 2A), therefore, non-transfected Neuro 2a cells served as endogenous CB1R controls. As expected, TK promoter-driven CB1R expression was about 1-1.5 order of magnitude lower than that provided by the conventional CMV promoter (Figures 1B, C). In all 3 cell types, shortening the long N-terminal tail (22) by 64 amino acids also enhanced receptor expression by approx. 2 to 5-fold independently of the promoter (Figures 1B, C). Most importantly, however, the expression of the full-length TK-CB1R was comparable to that of endogenous receptors (Figures 1B, C) suggesting that this construct may be sufficient to provide close-to-physiological receptor levels in heterologous systems.
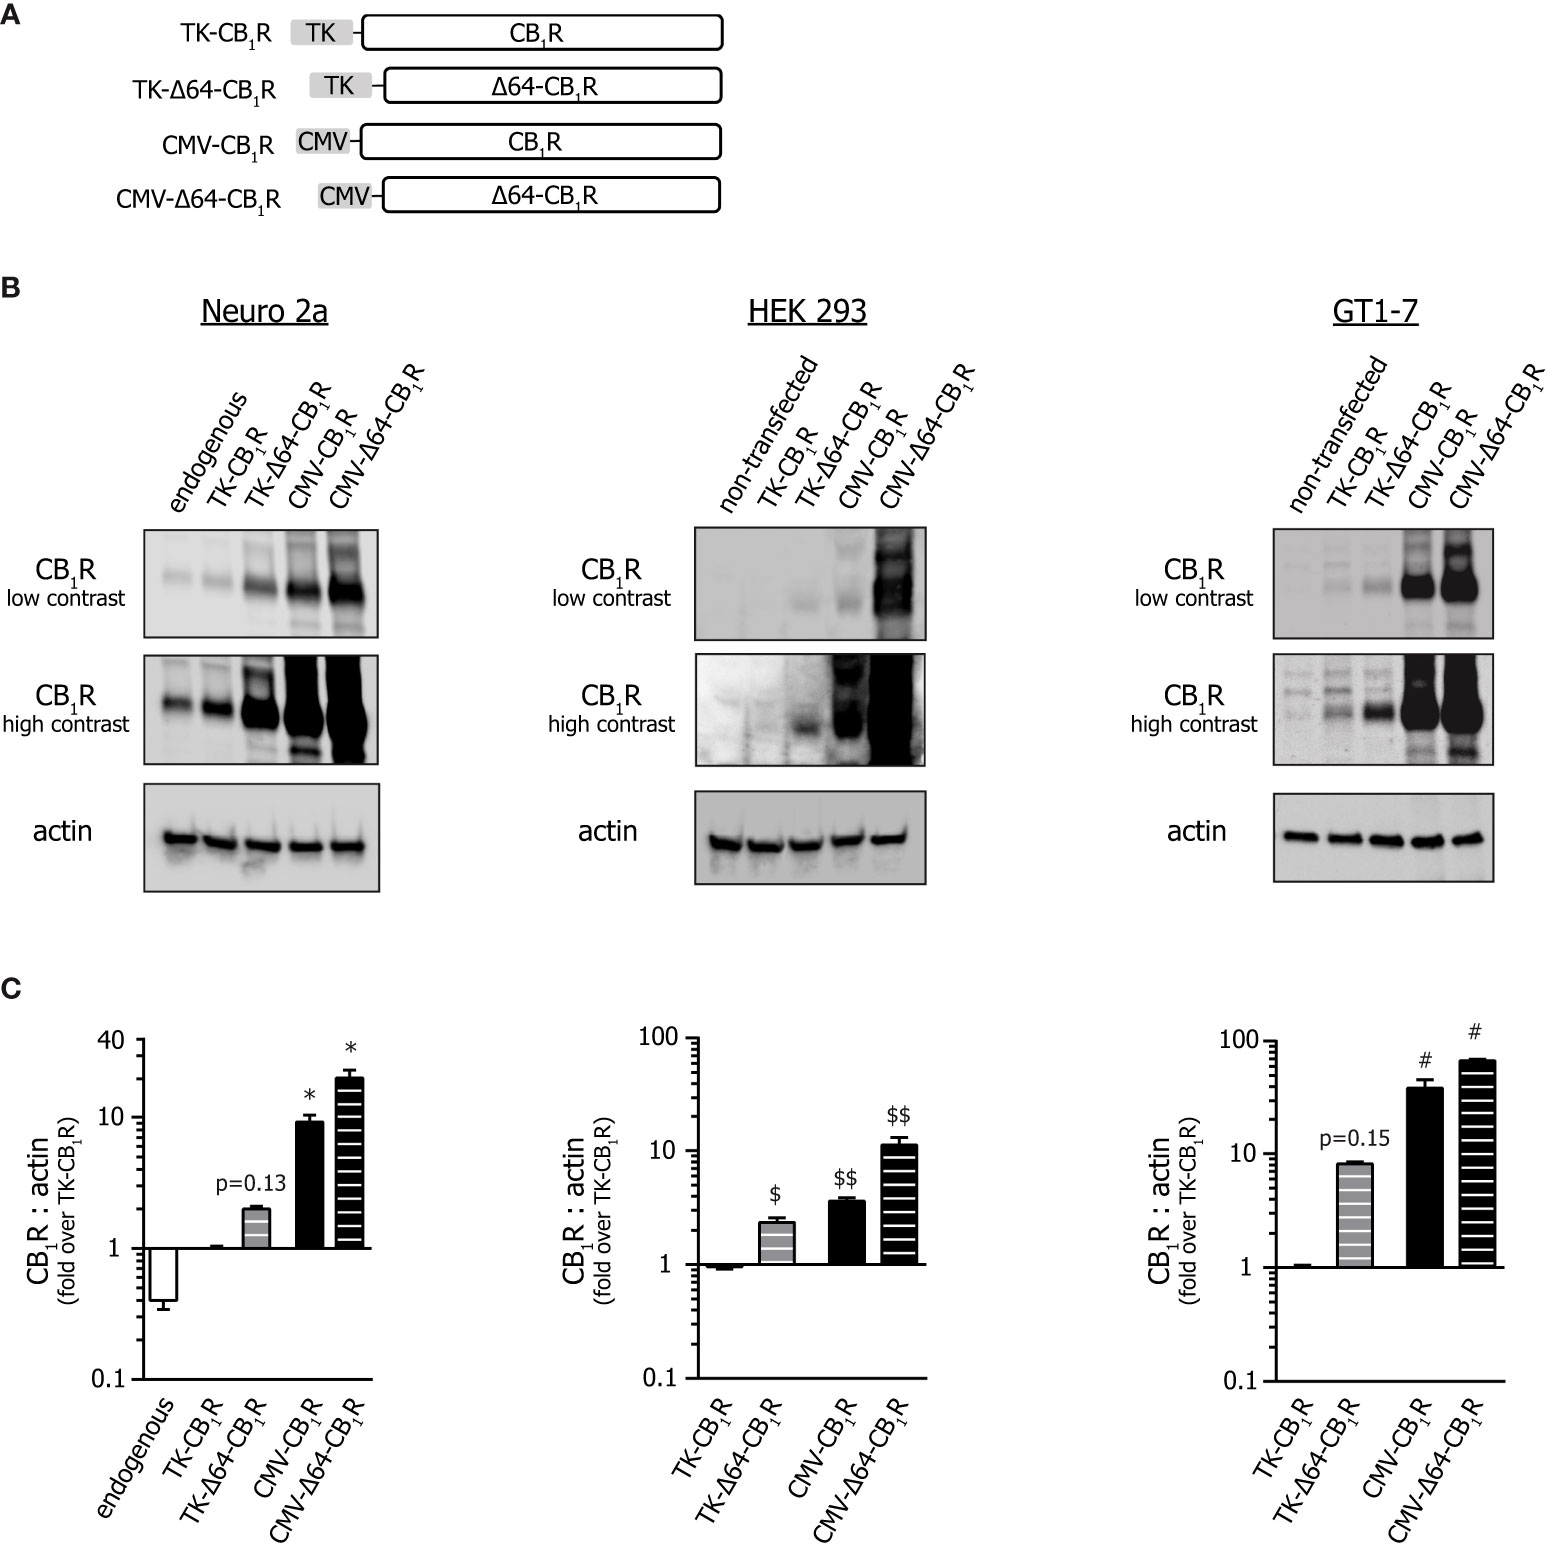
Figure 1 Effect of promoter and N-terminal truncation on CB1R expression. (A) Schematic representation of the various CB1R clones used throughout the study. (For GFP-tagged versions, see Supplementary Figure 3A.) (B) Western blot analysis of the expression of various CB1R constructs in Neuro 2a, HEK 293 and GT1-7 cells. Cells were transfected with different CB1R constructs or with empty plasmid (pcDNA3.1(+); ‘non-transfected’); in order to perceive the differences in expression better, both low and high contrast representations of the same 16-bit raw images are presented. (C) Statistical analysis of immunoblots shown on Panel (B). CB1R to actin expression ratios were normalized to that obtained in TK-CB1R expressing samples. From left to right n= 9-13-14-12-11 (Neuro 2a); 14-13-11-10 (HEK 293) and 11-9-10-10 (GT1-7); *p < 0.0003, $p = 0.0152, $$p < 0.0001 and #p < 0.0001 as compared to pertinent TK-CB1R group (Kruskal-Wallis ANOVA followed by Dunn’s multiple comparisons test).
Tuning Down CB1R Expression Is Sufficient to Prevent Its Overt Proteasomal Degradation
The instability of CB1R in heterologous expression systems has been primarily attributed to the receptor’s long N-terminal tail that complicates receptor positioning across the ER membrane and thus triggers rapid proteasomal degradation (22). Indeed, in harmony with previous reports (22), N-terminal ablation eliminated the sensitivity of the CMV-CB1R construct to the proteasome inhibitor Mg-132 (Supplementary Figure 1C) indicating that the full-length CMV-CB1R is in fact prone to ubiquitination and subsequent proteasomal degradation. Similar observations were made in HEK 293 cells as well (data not shown). However, no significant proteasomal degradation was observed with the low-expression TK-CB1R variants (Supplementary Figure 1D). Instead, these low expression receptors displayed sensitivity to chloroquine (Supplementary Figure 1D), an inhibitor of endolysosomal degradation, similarly to that observed for the endogenous CB1 receptor (Supplementary Figure 1B). Interestingly, despite the substantial proteasomal degradation of the CMV-CB1 receptor, caused most likely by abnormal folding (22), none of the constructs induced measurable ER unfolded protein response, as assessed by the phosphorylation of eukaryotic initiation factor 2 subunit α (eIF2α) (Supplementary Figure 1E). Thus, weak promoter-driven, low-level expression of the full-length CB1R precludes drastic proteasomal degradation without the need for truncation of the receptor. Additionally, weakly expressed CB1R variants retain endolysosomal processing resembling endogenous CB1Rs in this respect.
Parallel MAPK Signalling Cascades Exhibit Different Sensitivity to CB1R Abundancy
Next, we assessed whether changes in expression level translates into different signalling behaviour of the CB1R. To this end, we first monitored the phosphorylation of ERK1/2 (p42/44 MAPK) by western blotting. HEK 293, Neuro 2a and GT1-7 cells were stimulated with increasing concentrations of the CB1R specific anandamide analogue arachidonyl-2-chloroethylamide (ACEA) (31), which brings about ERK 1/2 activation in a CB1R dependent manner (Supplementary Figure 2A). In non-transfected HEK and GT1-7 cells, ACEA failed to induce ERK1/2 or p38 MAPK phosphorylation (data not shown). In Neuro 2a cells, the full length TK-CB1R variant produced a stimulus-response curve that practically overlapped with that produced by endogenous CB1 receptors in non-transfected cells (Figures 2A, B). On the other hand, CMV promoter-driven high expression CB1R variants increased the basal phosphorylation of ERK1/2 and tended to shift the dose-response curve to the left. Congruent ERK 1/2 activation data were obtained in HEK 293 cells (but not in GT1-7 neurons) (Figure 2A, B). In contrast, ACEA-induced activation of p38 MAPK, another downstream target of CB1Rs that may be recruited independently of ERK1/2 (32, 33), proved to be much less sensitive to CB1R abundance or N-terminal Δ64 truncation than observed for ERK1/2 phosphorylation (Supplementary Figures 2B, C).
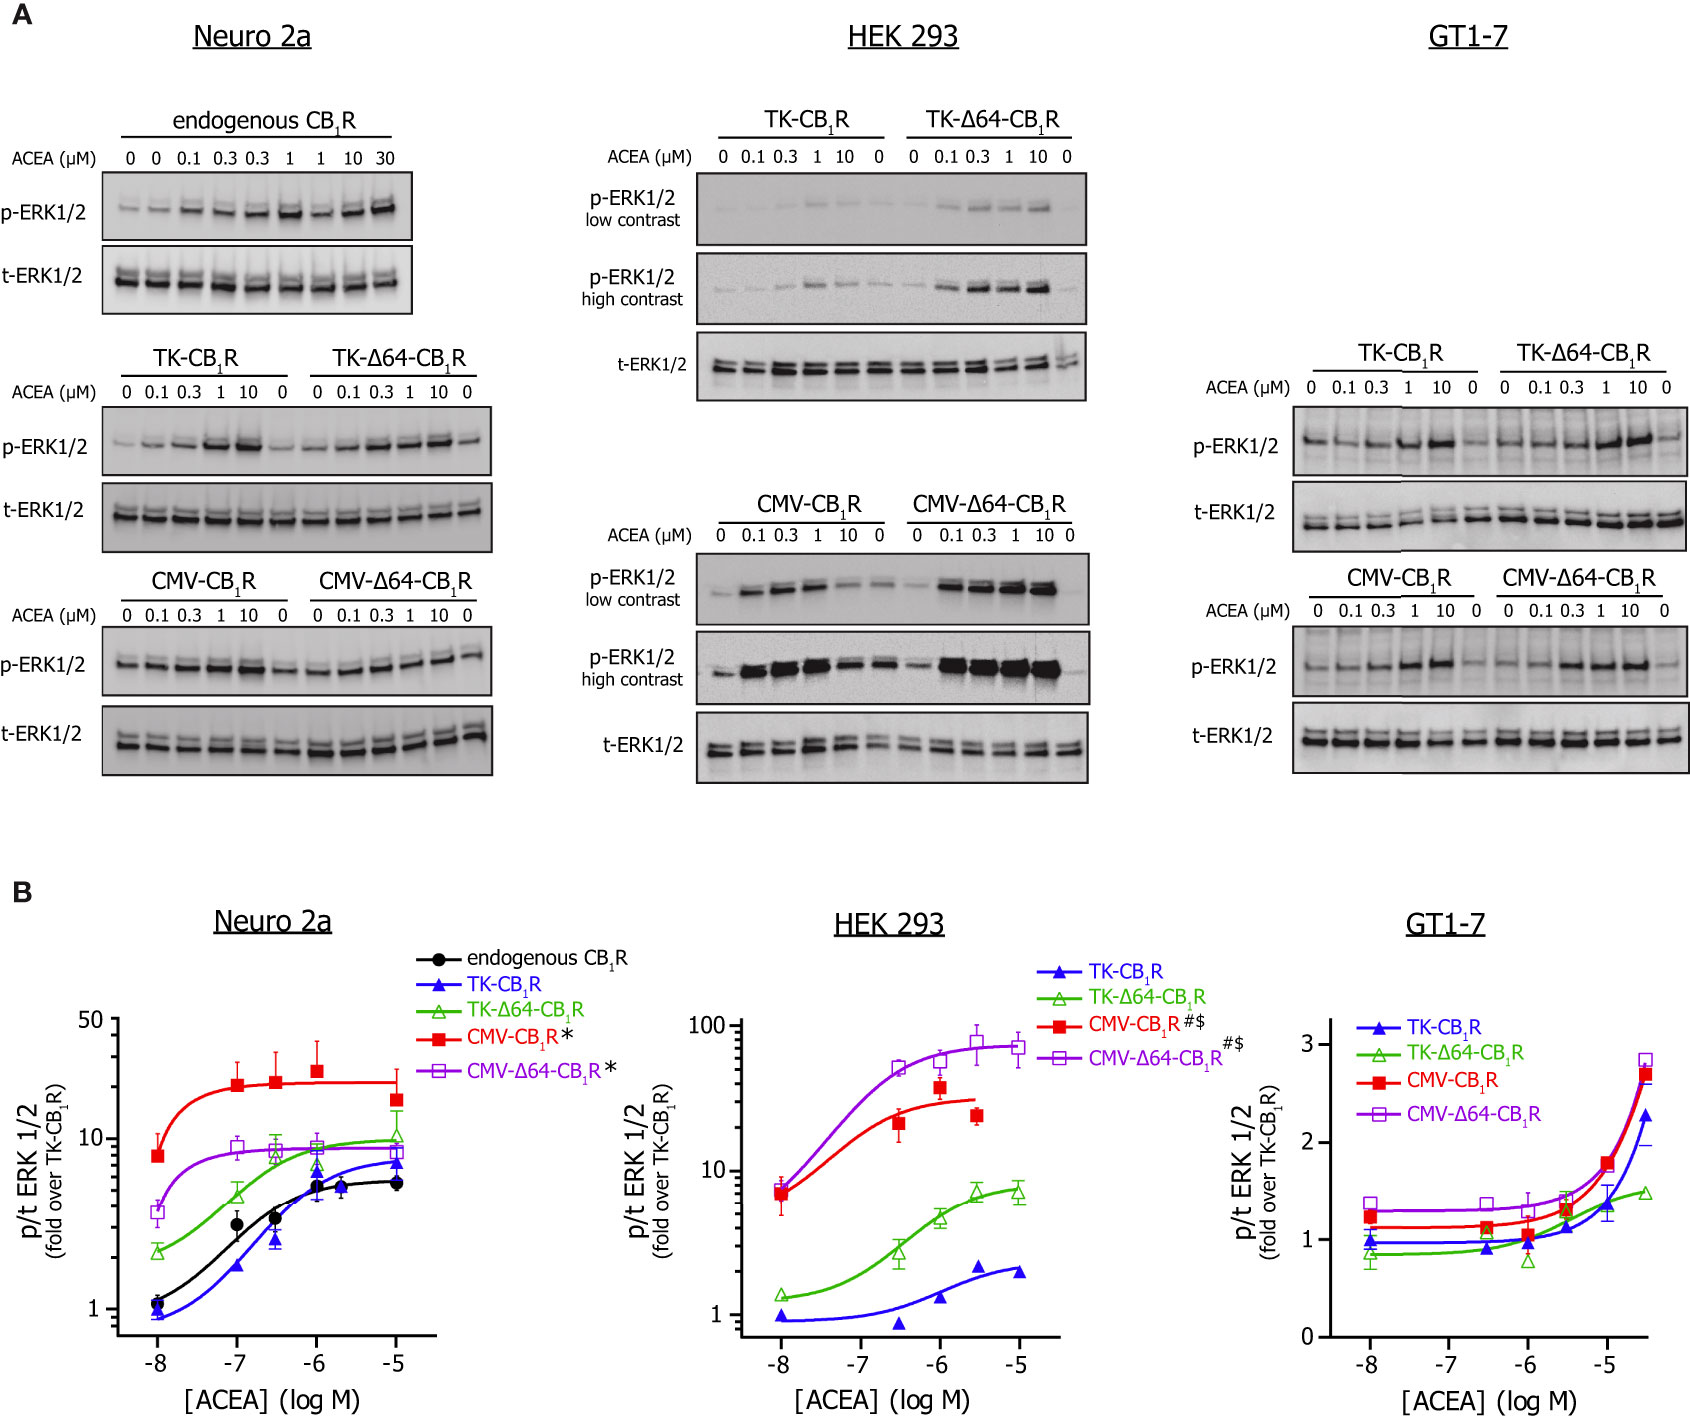
Figure 2 ERK 1/2 activation by CMV or TK promoter-driven full-length and Δ64-CB1 receptor variants. (A) Western blot analysis of ERK 1/2 phosphorylation mediated by the various CMV and TK promoter-driven or endogenous CB1 receptors stimulated with ACEA. Neuro 2a, HEK 293 and GT1-7 cells expressing the indicated CB1R variants or endogenous receptors (Neuro 2a) were stimulated with various concentrations of ACEA in at 37°C in DMEM + HEPES for 5 min. Representative western blots are shown; please note that, although presented as separate blots, p-ERK and t-ERK membranes were actually developed under identical conditions (incl. exposure times) so these images may be directly compared within the pertinent cell type. (B) Dose-response analysis of ACEA-evoked p-ERK 1/2 signals from western blot experiments as the one presented on Panel (A). Phospho- to total ERK 1/2 values were normalized to the minimum response of the TK-CB1R group and the 3-parametered log[agonist] – response equation was used to fit concentration-response curves. Number of observations was 3-8/construct/ACEA concentration; *p = 0.036 for the effect of CMV promoter on basal ERK activity and p = 0.19 for the effect of CMV promoter on EC50 when compared to TK promoter in Neuro 2a cells; #p = 0.0002 for the effect of CMV promoter on basal phosphorylation and $p = 0.0288 for the effect of CMV promoter on EC50 value vs. TK promoter in HEK 293 cells (2-way ANOVA).
Confocal microscopy in Neuro 2a and HEK 293 cells revealed that the ability to increase basal ERK1/2 activity corresponds well to the cell surface expression of CB1R constructs, with CMV-CB1R variants having around an order of magnitude higher plasmalemmal abundance than their TK-CB1R counterparts (Figures 3A, B). Intriguingly, whereas Δ64 truncation improved plasma membrane targeting of CB1Rs under high-expression conditions, the same ablation did not enhance cell surface localization of weakly expressing TK-CB1R variants. These data together imply that CB1R-activated parallel MAPK signalling pathways display different sensitivity to supraphysiological CB1R expression, and that weak-expression recombinant CB1 receptor variants mimic the behaviour of the endogenous receptors more closely than conventional high-expression CB1R constructs.
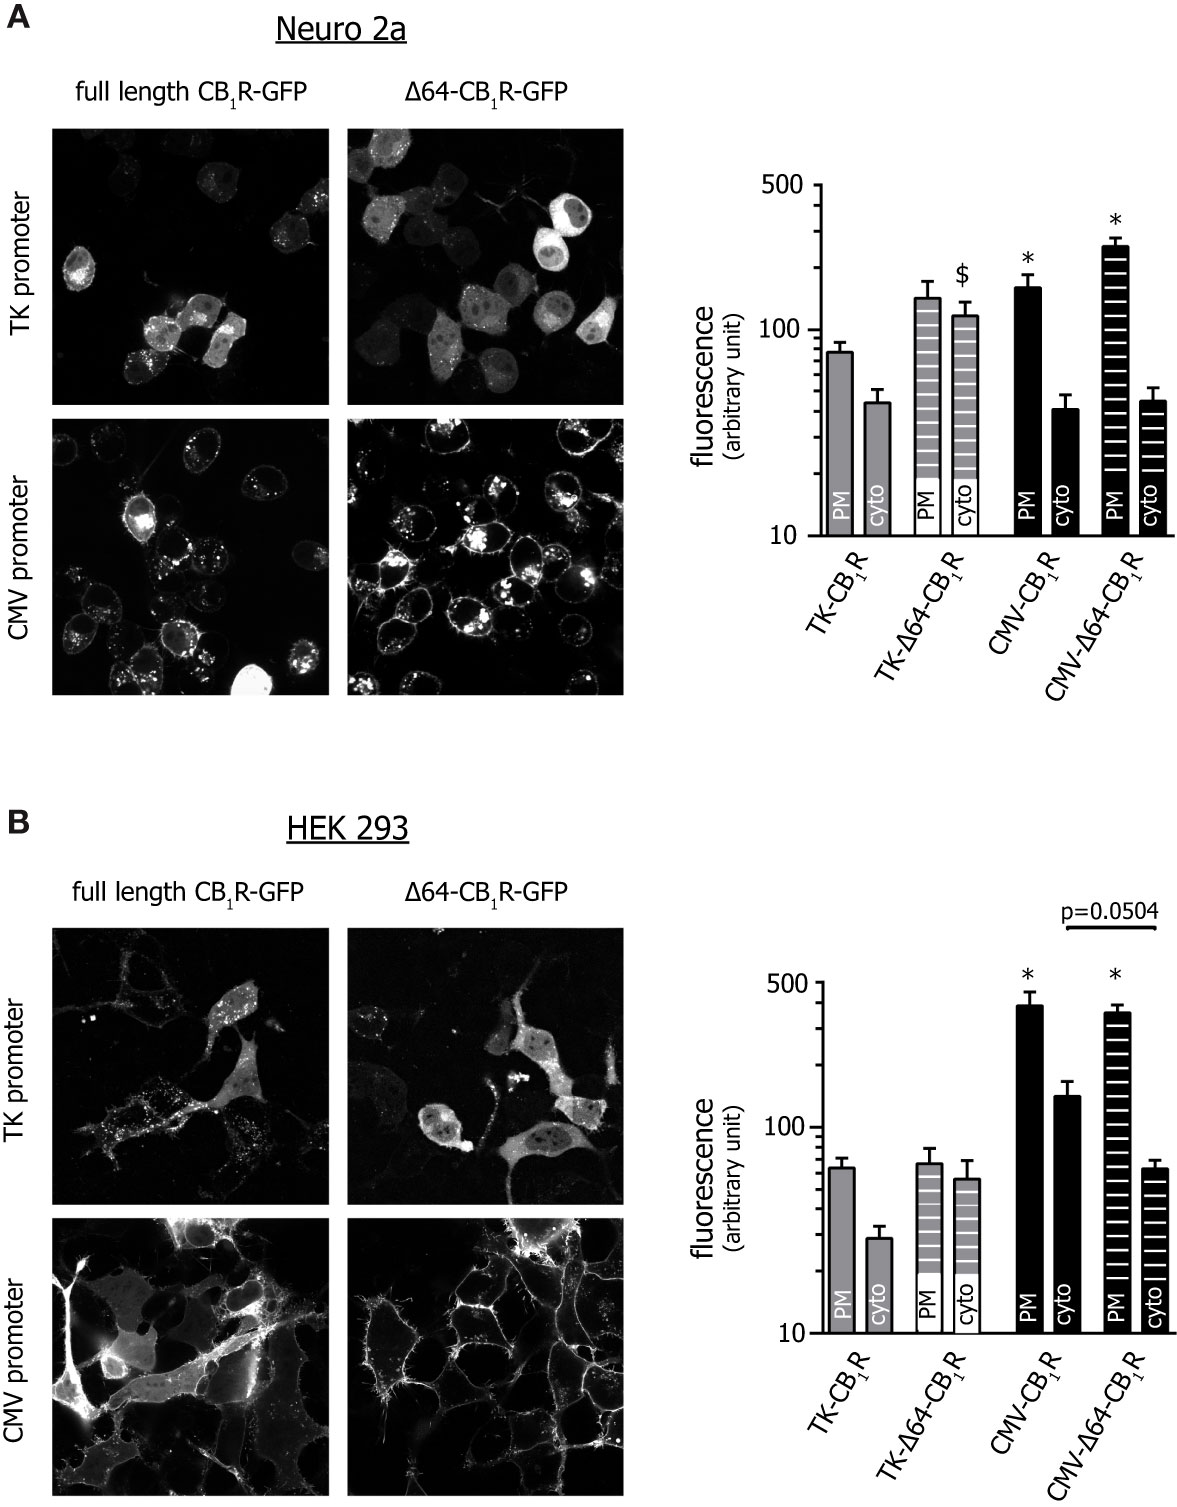
Figure 3 Confocal microscopic assessment of the localization of various CB1R mutants. Images of Neuro 2a (A) and HEK 293 (B) cells expressing GFP-tagged versions of the pertinent CB1 receptor variants were acquired with spinning disk confocal microscopy along the entire z-axis of the cell. Slices positioned at the bottom 1/3 (i.e. close to the cell-coverslip interface) are presented and show an area of approx. 100 x 100 µm. (Please note that due to the significant differences in expression, the brightness of images showing TK promoter-driven receptor variants was increased to a higher extent.) Bar graphs show average plasma membrane and cytosolic fluorescent intensity after background subtraction. In all groups n=16; *p < 0.05 when compared to TK-CB1R PM (one-way ANOVA followed by Dunn’s or Holm-Sidak’s multiple comparisons test for Neuro 2a and HEK 293, respectively), $p = 0.012 vs. TK-CB1R-cyto (one-way ANOVA and Dunn’s test), for the comparison between CMV-CB1R-cyto and CMV-Δ64-CB1R-cyto one-way ANOVA and Holm-Sidak’s test were applied.
Low CB1R Expression Levels Ensure Predominant Gi/o Coupling
The coupling preference of CB1Rs may be swayed from Gi/o proteins towards the Gs pathway by several factors (34–36) including the expression level of the receptor itself (15). Therefore, we tested the effect of ACEA and the CB1R full agonist WIN 55,212-2 on cytosolic cAMP in Neuro 2a neuroblasts and HEK 293 cells expressing various CB1R clones. In Neuro 2a cells expressing endogenous CB1Rs only, both ligands reduced the basal and forskolin-stimulated cAMP concentrations signifying Gi/o coupling. This Gi/o preference was clearly retained in Neuro 2a and HEK 293 cells transfected with either the TK-CB1R or the TK-Δ64-CB1R clones but was lost or shifted towards Gs when CB1R expression was driven by the CMV promoter (Figure 4). Thus, as seen with the other cannabinoid signalling pathways and receptor degradation, the weakly expressed full-length CB1Rs satisfyingly resemble the signalling behaviour of endogenous receptors.
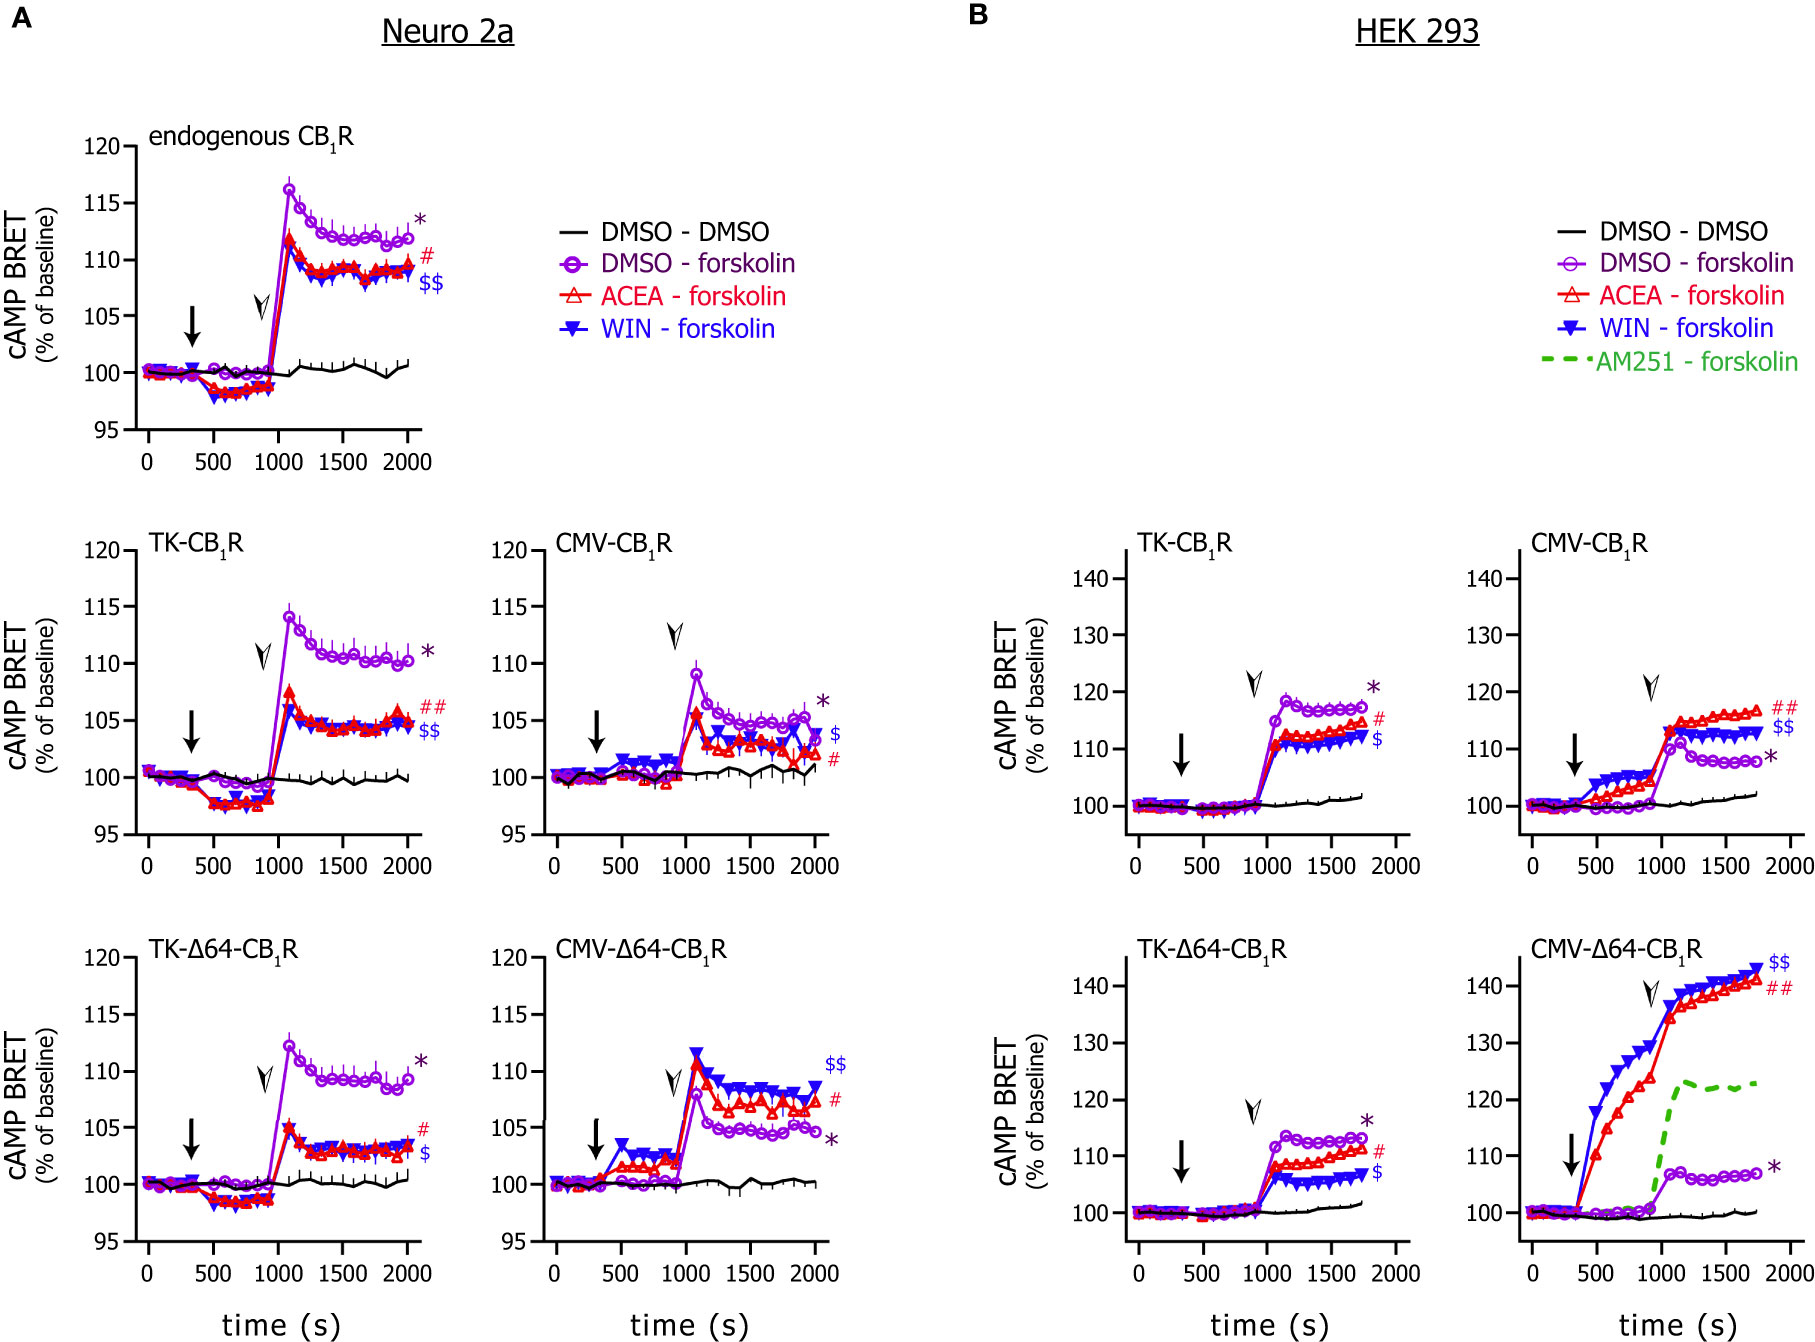
Figure 4 Effect of CB1R stimulation on cytosolic cAMP. Neuro 2a (A) and HEK 293 (B) cells expressing the EPAC-based intramolecular cAMP sensor together with the indicated CB1R variant were stimulated first with the CB1R agonists ACEA (20 µM) or WIN55,212-2 (1 µM) or vehicle (arrows) followed by the addition of forskolin (1 µM) or vehicle (arrowheads). BRET ratios were normalized to the average measured during control period. (In one experiment, the effect of the CB1R inverse agonist AM251 (2 µM) was also tested instead of CB1R agonist; average of 3 wells are shown.) Number of observations was min. 8 wells from 3 independent experiments. In some cases, to aid perceptibility, mean + or – S.E.M are presented only; in some graphs, symbols are larger than error bars and thus the latter are not visible. Data were analysed with 2-way ANOVA in combination with Dunnett’s multiple comparisons test. Symbols represent significances as follows: *: significant difference (p < 0.0001) vs. DMSO-DMSO detected after the addition of forskolin; # and $: significant difference (p < 0.0001) vs. DMSO-forskolin detected after the addition of forskolin; ## and $$: significant difference (p < 0.05) vs. DMSO-forskolin detected already after the addition of the CB1R agonist and before forskolin stimulation and significance increased (p < 0.0001) after the addition of forskolin.
Discussion
Meticulous characterization of receptor-ligand interactions is vital for pharmacological research and can reduce the risk of severe side-effects and idiosyncratic drug reactions. This is well illustrated by the caveats in cannabinoid ligand development – brain-penetrant CB1R inverse antagonist proved to be potent anti-obesity drugs (37) but exerted serious psychiatric side effects and had to be eventually withdrawn (38, 39). Such side effects may be hidden deeply in the pharmacological properties of drugs and thus may be hard to recognize at first. Nevertheless, meticulous pharmacological profiling can overcome these pitfalls to exploit the real therapeutic potential of future pharmacons (4, 13, 40). Artificially induced expression of GPCRs in cell lines is key to deciphering almost all aspects of receptor function, and it represents a key tool for pharmacological studies. However, overexpression of a receptor may fundamentally change its biological properties such as receptor trafficking and coupling to signalling partners (15–18, 41, 42).
In the present study, we explored the role of expression level on CB1R function. To this end, we changed the conventional high-efficiency CMV promoter to the less effective HSV thymidine kinase promoter. The HSV thymidine kinase promoter was shown to yield significantly reduced but still detectable fluorescent protein levels, when compared to the CMV promoter (43). In our hands, TK promoter-driven weak CB1R expression was still sufficient to decrease cytosolic cAMP and induce detectable ERK 1/2 and p38 MAPK signalling upon CB1R stimulation. Furthermore, the full-length TK-CB1R construct was functional in 3 different cell types – HEK 293 cells, a general model of mammalian cells widely used in pharmacological research, in Neuro 2a murine neuroblasts (29) with high differentiation potential (44), and also in highly differentiated GnRH-secreting GT1-7 neurons (30).
CB1Rs are known to couple to several parallel downstream signal transduction pathways (5, 33, 45). Amongst these, reduction of cytosolic cAMP via the recruitment of the Gi/o heterotrimeric G-protein was the first recognized intracellular effect of cannabinoids (46) and it is still appreciated as a crucial signalling step conveying many of the therapeutic effects (or side-effects) of cannabinoids (13, 47). However, preference of CB1Rs may be shifted towards the Gs pathway by several factors (34) (35, 36), including the expression level of the receptor itself (15). Indeed, whereas endogenous receptors and low-expression recombinant CB1R variants displayed Gi/o engagement predominantly, the G protein preference of CMV-driven CB1Rs was switched to the non-canonical Gs pathway in our cAMP paradigm. This shift in cAMP signalling of cannabinoids was recognized early on (41, 48) and was further characterized in an elegant recent study (15). Finlay and co-workers used HEK 293 cell lines stably expressing the CB1R with either high or low efficiency to show an analogous shift in G protein preference (15). Although stable cell lines offer several advantages over transient expression, this strategy can be laborious, and it can hardly be applied for mutational analysis of the receptor, when numerous permutations are usually examined.
It is noteworthy that a change in G protein preference is not a unique feature of the CB1R, as coupling of several GPCRS to G proteins is sensitive to the receptor - G protein ratio (20, 21), to the available G protein pool, to net receptor density (49, 50) and possibly to the applied ligand (34, 42, 45). For instance the luteinizing hormone receptor, the V2 vasopressin receptor, the β1- and β2-adrenergic receptors were shown to induce inositol trisphosphate formation at high receptor counts only (51). Our present findings complement these literary data well and they together underline that receptor density, ligand properties and cell type must all be taken into account to draw reliable conclusions about physiological receptor signalling.
Phosphorylation of ERK 1/2 is a canonical effect of CB1R activation (33, 52), and its mechanism depends on the cell type, the agonist, on receptor internalization, β-arrestin expression pattern and on the presence of allosteric modulators (53–55). Despite this complexity, weakly overexpressed full-length and endogenous CB1Rs produced practically identical ERK 1/2 concentration-response curves suggesting that these receptors engage the same combination of signalling partners to initiate ERK signalling. The highly expressed CMV-CB1Rs, on the other hand, shifted the dose-response curves to the left, in accordance with their higher plasma membrane expression. It has to be added here that higher plasma membrane expression did not shift the concentration-response curve in all scenarios. For instance, p38 MAPK activation appeared to be less sensitive to CB1R density in Neuro 2a cells. This phenomenon lays out of the scope of the present study and remains to be elucidated.
CMV-driven high-expression CB1 receptors appear to have substantial basal activity compared to weakly expressed receptor variants. This notion is supported by i) the significant increase in basal ERK 1/2 phosphorylation ii) by the smaller forskolin-induced cAMP increase in CMV-CB1R expressing cells indicating basal Gs engagement iii) and by the formation of cytosolic protrusions in non-stimulated CMV-CB1R expressing Neuro 2a neuroblast (Supplementary Figure 3) that may signify increased basal CB1R activity in these cells (56, 57). Basal endocannabinoid production and CB1R activity is most probably inherent to most cells (58, 59) but overactive CB1R signalling under resting conditions may have several uncontrolled effects that need to be carefully considered when interpreting experimental results.
Similarly to signalling, the weakly expressed TK-CB1R also mimicked the distribution pattern of endogenous receptors. The presence of receptors in intracellular vesicle-like structures was easily notable with low-expression full length TK-CB1Rs, closely resembling the distribution of endogenous CB1Rs in Neuro 2a and primary hippocampal neurons (60). Intracellular receptors associate to both non-endolysosomal vesicles (60) and to endolysosomes as a result of internalization (58, 61). In this regard, it is noteworthy to recall that weakly expressed bradykinin type-2 receptors also display higher internalization rate than highly expressed counterparts (62).
In an elegant series of experiments, Andersson and colleagues showed that high-expression CB1R variants exhibit substantial proteasomal degradation that can be mitigated by truncating the long N-terminal tail (22). Our data corroborates their findings as we also observed that Δ64 modification ameliorates proteasomal degradation and improves plasmalemmal localization of CMV-CB1R variants. We further extended this paradigm by showing that tuning down the expression level alone is sufficient to redirect CB1 receptors from proteasomal degradation pathways towards endolysosomal processing, which is characteristic of endogenous receptors (33). Intriguingly, as opposed to high-expression variants, Δ64 deletion in low expression TK-CB1R variants increased the diffuse cytoplasmic fluorescence, implying that the long N-terminal tail may be a limiting factor of normal ER translocation under high-expression conditions only. Altogether, the weakly expressed full-length CB1R mimics the intracellular distribution as well as the receptor degradation properties of the endogenous receptor reasonably well.
In conclusion, our data demonstrate that using vectors with low efficiency promoters for the heterologous expression of CB1Rs is a favourable option for studying cannabinoid ligands and CB1R function. Low-level CB1R expression provides receptor distribution, Gi/o, ERK 1/2 and p38 MAPK signalling that are comparable to that observed with endogenous receptors, and precludes non-canonical signalling and overt proteasomal degradation. Whether these benefits also extend to other CB1R-mediated signalling events, such as ceramide production, Gq recruitment or protein-tyrosine kinase activation, needs to be elucidated by future studies.
Data Availability Statement
The raw data supporting the conclusions of this article will be made available by the authors, without undue reservation.
Author Contributions
VH, AT, and GS conceived and designed the study. VH and GS performed the majority of experiments and analysed most of the data. ES-K, AT, and GS planned, carried out and analysed cAMP measurements. ÉW assisted with molecular biological work. AR and EH cultured the cells. AR performed transfection, western blot, and analytical work. BE performed confocal microscopy. LH contributed to data analysis, manuscript amendment, discussion, and proofreading. GS, AT, and VH wrote the MS. All authors read the manuscript and agreed with the final version.
Funding
This work was supported by the following grants: National Research, Development and Innovation Office grants (NKFI-6/FK_124038) to GS and by the Scientific and Innovation Fund (26303/AOELT/2019) of the Semmelweis University, Budapest, Hungary, to GS. The laboratories were also funded by the Hungarian National Research, Development and Innovation Fund (grant numbers: NVKP_16-1-2016-0039 and NKFI K116954) to LH. BE was supported by a “Lendület” grant from the Hungarian Academy of Sciences (LP2018-13/2018) and funding form EU’s Horizon 2020 research and innovation program (grant agreement No. 739593). The Department of Physiology also received funds from Higher Education Institutional Excellence Programme (FIKP) of the Ministry of Human Capacities in Hungary, within the framework of the Molecular Biology thematic programme of the Semmelweis University.
Conflict of Interest
The authors declare that the research was conducted in the absence of any commercial or financial relationships that could be construed as a potential conflict of interest.
Publisher’s Note
All claims expressed in this article are solely those of the authors and do not necessarily represent those of their affiliated organizations, or those of the publisher, the editors and the reviewers. Any product that may be evaluated in this article, or claim that may be made by its manufacturer, is not guaranteed or endorsed by the publisher.
Acknowledgments
We are indebted to Dr. András Balla and to Prof. Péter Várnai (Semmelweis University, Budapest, Hungary) for providing the cAMP-EPAC sensor, assistance with cloning and for valuable discussion.
Supplementary Material
The Supplementary Material for this article can be found online at: https://www.frontiersin.org/articles/10.3389/fendo.2021.740913/full#supplementary-material
Supplementary Figure 1 | (A) Neuro 2a cells express CB1R endogenously as assessed by siRNA-mediated knock-down. Cells were transfected with siRNA directed against murine cnr1 or with a minimally-altered non-silencing double-stranded RNA (control dsRNA) and with various CB1R mutants or empty plasmid as indicated. Actin immunoreactivity was used as loading control. Representative for 3 independent experiments (p < 0.05 for the effect of siRNA on CB1R expression; ANOVA and Holm-Sidak’s test). (B) Endogenous CB1Rs in Neuro 2a cells are primarily processed/degraded in the endolysosome system. Neuro 2a cells were treated with the proteasome inhibitor MG-132, the lysosomal inhibitor chloroquine (200 µM) or with DMSO (vehicle) for 8 h, as indicated, and CB1R protein expression was evaluated with immunoblotting. Bar graph represents the ratio of CB1R band density between ~50-100 kDa to that below 40 kDa. n = 4 in all groups; *p < 0.05 when compared to vehicle (Kruskal-Wallis ANOVA followed by Dunn’s multiple comparisons test). (C) The high-expression CMV-CB1R variant exhibits high turnover proteasomal degradation while TK promoter-driven receptors are processed in the endolysosomal system. GT1-7 neurons transfected with the CMV (left and middle blots) or TK (right blots) promoter-driven full-length or Δ64-CB1 receptor variants were exposed to the lysosomal inhibitor chloroquine (200 µM), the proteasome inhibitor Mg-132 (200 nM), the calpain and cathepsin B inhibitor MDL-28170 (25 µM), or the trypsin-like/cysteine protease inhibitors E64 (20 µM) and leupeptin (10 mg/mL) for 8 h and CB1R expression pattern was analysed by western blotting. For statistical analysis, see Panel D. (D) Statistical analysis of blots shown on Panel C; ratio of CB1R band density between ~50-100 kDa to that measured below 40 kDa were evaluated. Number of observations was 4 in all groups except for CMV-Δ64-CB1R n=3; *p < 0.05 vs. vehicle control (one-way parametric or Kruskal-Wallis ANOVA with Holm-Sidak’s or Dunn’s post-hoc tests, respectively). (E) None of the recombinant CB1R variants induce significant ER stress response. Neuro 2a, HEK 293 and GT1-7 cells transfected with various CB1R constructs or empty plasmid (non-transfected) were analysed for ER stress by monitoring eIF2α phosphorylation with immunoblotting. As positive control, non-transfected Neuro 2a cells were exposed to 200 nM thapsigargin, an inhibitor of SERCA Ca2+ pumps, for 4 h in serum-free DMEM. Number of observations from left to right, Neuro 2a n = 4-4-9-9-9-9, HEK 293 n=3 in all groups, GT1-7 n = 4-5-5-5-5; *p < 0.0001 vs. non-transfected DMSO treated group (ANOVA and Holm-Sidak’s test).
Supplementary Figure 2 | (A) ACEA-evoked ERK 1/2 activation requires the presence of CB1Rs. Neuro 2a cells were transfected with non-silencing dsRNA or with siRNA directed against endogenous CB1Rs or exposed to transfection reagent only (‘no dsRNA’) and were stimulated with the anandamide analogue ACEA for 3 min. Representative for 2 independent experiments; p = 0.035 for the effect of siRNA on phospho-ERK 1/2 response (Mann-Whitney test; n = 5 and 4 for dsRNA treated ACEA exposed and siRNA treated ACEA exposed). (B) Western blot analysis of p38 MAPK phosphorylation evoked by ACEA via the different CMV and TK promoter-driven and endogenous CB1 receptors stimulated with ACEA. Neuro 2a, HEK and GT1-7 cells expressing the indicated CB1R variants or endogenous receptors (Neuro 2a) were stimulated with various doses of ACEA in at 37°C in DMEM + HEPES for 5 min. Representative western blots are shown. Please note that, although presented as separate blots, p-ERK and t-ERK membranes were actually developed under identical conditions (incl. exposure times) so these images may be directly compared within the pertinent cell type. (C) Dose-response curves for p38 MAPK activation calculated as described for Fig.2.B. Number of observations was min 3/construct/[ACEA].
Supplementary Figure 3 | (A) Structure of GFP-tagged CB1R constructs used in microscopic experiments. (B) CMV promoter-driven heterologous expression of CB1Rs triggers extensive filopodium formation in Neuro 2a and HEK 293 cells as compared to TK-CB1R constructs. Images along the entire z-axis of cells were obtained as described for Figure 3. To give a 2-dimensional representation of the entire cell, z-stacks were compressed into a single image using the ZProjection-maximal intensity algorithm of Image J (Fiji version). (Please note again that the brightness of images showing TK-CB1R variants was increased stronger than of CMV images for representative purposes).
References
1. Katona I, Freund TF. Multiple Functions of Endocannabinoid Signaling in the Brain. Annu Rev Neurosci (2012) 35:529–58. doi: 10.1146/annurev-neuro-062111-150420
2. Zou S, Kumar U. Cannabinoid Receptors and the Endocannabinoid System: Signaling and Function in the Central Nervous System. Int J Mol Sci (2018) 19(3). doi: 10.3390/ijms19030833
3. Ravinet Trillou C, Delgorge C, Menet C, Arnone M, Soubrie P. CB1 Cannabinoid Receptor Knockout in Mice Leads to Leanness, Resistance to Diet-Induced Obesity and Enhanced Leptin Sensitivity. Int J Obes Related Metab Disord (2004) 28(4):640–8. doi: 10.1038/sj.ijo.0802583
4. Tam J, Cinar R, Liu J, Godlewski G, Wesley D, Jourdan T, et al. Peripheral Cannabinoid-1 Receptor Inverse Agonism Reduces Obesity by Reversing Leptin Resistance. Cell Metab (2012) 16(2):167–79. doi: 10.1016/j.cmet.2012.07.002
5. Jourdan T, Szanda G, Cinar R, Godlewski G, Holovac DJ, Park JK, et al. Developmental Role of Macrophage Cannabinoid-1 Receptor Signaling in Type-2 Diabetes. Diabetes (2017) 66(4):994–1007. doi: 10.2337/db16-1199
6. Jourdan T, Godlewski G, Cinar R, Bertola A, Szanda G, Liu J, et al. Activation of the Nlrp3 Inflammasome in Infiltrating Macrophages by Endocannabinoids Mediates Beta Cell Loss in Type 2 Diabetes. Nat Med (2013) 19(9):1132–40. doi: 10.1038/nm.3265
7. Tam J, Szanda G, Drori A, Liu Z, Cinar R, Kashiwaya Y, et al. Peripheral Cannabinoid-1 Receptor Blockade Restores Hypothalamic Leptin Signaling. Mol Metab (2017) 6(10):1113–25. doi: 10.1016/j.molmet.2017.06.010
8. Osei-Hyiaman D, Liu J, Zhou L, Godlewski G, Harvey-White J, Jeong WI, et al. Hepatic CB1 Receptor Is Required for Development of Diet-Induced Steatosis, Dyslipidemia, and Insulin and Leptin Resistance in Mice. J Clin Invest (2008) 118(9):3160–9. doi: 10.1172/jci34827
9. Simon V, Cota D. Mechanisms in Endocrinology: Endocannabinoids and Metabolism: Past, Present and Future. Eur J Endocrinol (2017) 176(6):R309–r24. doi: 10.1530/eje-16-1044
10. Jourdan T, Szanda G, Rosenberg AZ, Tam J, Earley BJ, Godlewski G, et al. Overactive Cannabinoid 1 Receptor in Podocytes Drives Type 2 Diabetic Nephropathy. Proc Natl Acad Sci USA (2014) 111(50):E5420–8. doi: 10.1073/pnas.1419901111
11. Lattanzi S, Brigo F, Trinka E, Zaccara G, Cagnetti C, Del Giovane C, et al. Efficacy and Safety of Cannabidiol in Epilepsy: A Systematic Review and Meta-Analysis. Drugs (2018) 78(17):1791–804. doi: 10.1007/s40265-018-0992-5
12. Shrestha N, Cuffe JSM, Hutchinson DS, Headrick JP, Perkins AV, McAinch AJ, et al. Peripheral Modulation of the Endocannabinoid System in Metabolic Disease. Drug Discov Today (2018) 23(3):592–604. doi: 10.1016/j.drudis.2018.01.029
13. Liu Z, Iyer MR, Godlewski G, Jourdan T, Liu J, Coffey NJ, et al. Functional Selectivity of a Biased Cannabinoid-1 Receptor (CB1R) Antagonist. ACS Pharmacol Trans Sci (2021) 4(3):1175–87. doi: 10.1021/acsptsci.1c00048
14. Cinar R, Iyer MR, Liu Z, Cao Z, Jourdan T, Erdelyi K, et al. Hybrid Inhibitor of Peripheral Cannabinoid-1 Receptors and Inducible Nitric Oxide Synthase Mitigates Liver Fibrosis. JCI Insight (2016) 1(11). doi: 10.1172/jci.insight.87336
15. Finlay DB, Cawston EE, Grimsey NL, Hunter MR, Korde A, Vemuri VK, et al. Gα(s) Signalling of the CB(1) Receptor and the Influence of Receptor Number. Br J Pharmacol (2017) 174(15):2545–62. doi: 10.1111/bph.13866
16. Calebiro D, Rieken F, Wagner J, Sungkaworn T, Zabel U, Borzi A, et al. Single-Molecule Analysis of Fluorescently Labeled G-Protein–Coupled Receptors Reveals Complexes With Distinct Dynamics and Organization. Proc Natl Acad Sci (2013) 110(2):743–8. doi: 10.1073/pnas.1205798110
17. Ma X, Hu Y, Batebi H, Heng J, Xu J, Liu X, et al. Analysis of β(2)AR-G(s) and β(2)AR-G(i) Complex Formation by NMR Spectroscopy. Proc Natl Acad Sci USA (2020) 117(37):23096–105. doi: 10.1073/pnas.2009786117
18. Asher WB, Geggier P, Holsey MD, Gilmore GT, Pati AK, Meszaros J, et al. Single-Molecule FRET Imaging of GPCR Dimers in Living Cells. Nat Methods (2021) 18(4):397–405. doi: 10.1038/s41592-021-01081-y
19. Chung I, Reichelt M, Shao L, Akita RW, Koeppen H, Rangell L, et al. High Cell-Surface Density of HER2 Deforms Cell Membranes. Nat Commun (2016) 7(1):12742. doi: 10.1038/ncomms12742
20. Cordeaux Y, Briddon SJ, Megson AE, McDonnell J, Dickenson JM, Hill SJ. Influence of Receptor Number on Functional Responses Elicited by Agonists Acting at the Human Adenosine A(1) Receptor: Evidence for Signaling Pathway-Dependent Changes in Agonist Potency and Relative Intrinsic Activity. Mol Pharmacol (2000) 58(5):1075–84. doi: 10.1124/mol.58.5.1075
21. Nasman J, Kukkonen JP, Ammoun S, Akerman KEO. Role of G-Protein Availability in Differential Signaling by Alpha 2-Adrenoceptors. Biochem Pharmacol (2001) 62(7):913–22. doi: 10.1016/S0006-2952(01)00730-4
22. Andersson H, D’Antona AM, Kendall DA, Von Heijne G, Chin CN. Membrane Assembly of the Cannabinoid Receptor 1: Impact of a Long N-Terminal Tail. Mol Pharmacol (2003) 64(3):570–7. doi: 10.1124/mol.64.3.570
23. Fletcher-Jones A, Hildick KL, Evans AJ, Nakamura Y, Henley JM, Wilkinson KA. Protein Interactors and Trafficking Pathways That Regulate the Cannabinoid Type 1 Receptor (CB1R). Front Mol Neurosci (2020) 13:108(108). doi: 10.3389/fnmol.2020.00108
24. Nordström R, Andersson H. Amino-Terminal Processing of the Human Cannabinoid Receptor 1. J Recept Signal Transduct Res (2006) 26(4):259–67. doi: 10.1080/10799890600758252
25. Mellon PL, Windle JJ, Goldsmith PC, Padula CA, Roberts JL, Weiner RI. Immortalization of Hypothalamic GnRH Neurons by Genetically Targeted Tumorigenesis. Neuron (1990) 5(1):1–10. doi: 10.1016/0896-6273(90)90028-e
26. Buehler E, Chen YC, Martin S. C911: A Bench-Level Control for Sequence Specific siRNA Off-Target Effects. PloS One (2012) 7(12):e51942. doi: 10.1371/journal.pone.0051942
27. Klarenbeek JB, Goedhart J, Hink MA, Gadella TW, Jalink K. A Mturquoise-Based cAMP Sensor for Both FLIM and Ratiometric Read-Out has Improved Dynamic Range. PloS One (2011) 6(4):e19170. doi: 10.1371/journal.pone.0019170
28. Erdélyi LS, Balla A, Patócs A, Tóth M, Várnai P, Hunyady L. Altered Agonist Sensitivity of a Mutant V2 Receptor Suggests a Novel Therapeutic Strategy for Nephrogenic Diabetes Insipidus. Mol Endocrinol (2014) 28(5):634–43. doi: 10.1210/me.2013-1424
29. Klebe RJ. Neuroblastoma: Cell Culture Analysis of a Differentiating Stem Cell System. J Cell Biol (1969) 43:69A.
30. Chappell PE, White RS, Mellon PL. Circadian Gene Expression Regulates Pulsatile Gonadotropin-Releasing Hormone (GnRH) Secretory Patterns in the Hypothalamic GnRH-Secreting GT1-7 Cell Line. J Neurosci (2003) 23(35):11202–13. doi: 10.1523/jneurosci.23-35-11202.2003
31. Hillard CJ, Manna S, Greenberg MJ, DiCamelli R, Ross RA, Stevenson LA, et al. Synthesis and Characterization of Potent and Selective Agonists of the Neuronal Cannabinoid Receptor (CB1). J Pharmacol Exp Ther (1999) 289(3):1427–33.
32. Jourdan T, Nicoloro SM, Zhou Z, Shen Y, Liu J, Coffey NJ, et al. Decreasing CB(1) Receptor Signaling in Kupffer Cells Improves Insulin Sensitivity in Obese Mice. Mol Metab (2017) 6(11):1517–28. doi: 10.1016/j.molmet.2017.08.011
33. Turu G, Hunyady L. Signal Transduction of the CB1 Cannabinoid Receptor. J Mol Endocrinol (2010) 44(2):75–85. doi: 10.1677/jme-08-0190
34. Eldeeb K, Leone-Kabler S, Howlett AC. CB1 Cannabinoid Receptor-Mediated Increases in Cyclic AMP Accumulation are Correlated With Reduced Gi/o Function. J Basic Clin Physiol Pharmacol (2016) 27(3):311–22. doi: 10.1515/jbcpp-2015-0096
35. Bagher AM, Laprairie RB, Kelly MEM, Denovan-Wright EM. Antagonism of Dopamine Receptor 2 Long Affects Cannabinoid Receptor 1 Signaling in a Cell Culture Model of Striatal Medium Spiny Projection Neurons. Mol Pharmacol (2016) 89(6):652–66. doi: 10.1124/mol.116.103465
36. Kearn CS, Blake-Palmer K, Daniel E, Mackie K, Glass M. Concurrent Stimulation of Cannabinoid CB1 and Dopamine D2 Receptors Enhances Heterodimer Formation: A Mechanism for Receptor Cross-Talk? Mol Pharmacol (2005) 67(5):1697–704. doi: 10.1124/mol.104.006882
37. Pi-Sunyer FX, Aronne LJ, Heshmati HM, Devin J, Rosenstock J. Effect of Rimonabant, a Cannabinoid-1 Receptor Blocker, on Weight and Cardiometabolic Risk Factors in Overweight or Obese Patients: RIO-North America: A Randomized Controlled Trial. Jama (2006) 295(7):761–75. doi: 10.1001/jama.295.7.761
38. Beyer CE, Dwyer JM, Piesla MJ, Platt BJ, Shen R, Rahman Z, et al. Depression-Like Phenotype Following Chronic CB1 Receptor Antagonism. Neurobiol Dis (2010) 39(2):148–55. doi: 10.1016/j.nbd.2010.03.020
39. Christensen R, Kristensen PK, Bartels EM, Bliddal H, Astrup A. Efficacy and Safety of the Weight-Loss Drug Rimonabant: A Meta-Analysis of Randomised Trials. Lancet (London England) (2007) 370(9600):1706–13. doi: 10.1016/s0140-6736(07)61721-8
40. Iyer MR, Cinar R, Liu J, Godlewski G, Szanda G, Puhl H, et al. Structural Basis of Species-Dependent Differential Affinity of 6-Alkoxy-5-Aryl-3-Pyridinecarboxamide Cannabinoid-1 Receptor Antagonists. Mol Pharmacol (2015) 88(2):238–44. doi: 10.1124/mol.115.098541
41. Bonhaus DW, Chang LK, Kwan J, Martin GR. Dual Activation and Inhibition of Adenylyl Cyclase by Cannabinoid Receptor Agonists: Evidence for Agonist-Specific Trafficking of Intracellular Responses. J Pharmacol Exp Ther (1998) 287(3):884–8.
42. Cordeaux Y, IJzerman AP, Hill SJ. Coupling of the Human A1 Adenosine Receptor to Different Heterotrimeric G Proteins: Evidence for Agonist-Specific G Protein Activation. Br J Pharmacol (2004) 143(6):705–14. doi: 10.1038/sj.bjp.0705925
43. Klockenbusch C, Kast J. Optimization of Formaldehyde Cross-Linking for Protein Interaction Analysis of Non-Tagged Integrin Beta1. J Biomed Biotechnol (2010) 2010:927585. doi: 10.1155/2010/927585
44. Wu G, Fang Y, Lu ZH, Ledeen RW. Induction of Axon-Like and Dendrite-Like Processes in Neuroblastoma Cells. J Neurocytol (1998) 27(1):1–14. doi: 10.1023/a:1006910001869
45. Laprairie RB, Bagher AM, Kelly ME, Dupré DJ, Denovan-Wright EM. Type 1 Cannabinoid Receptor Ligands Display Functional Selectivity in a Cell Culture Model of Striatal Medium Spiny Projection Neurons. J Biol Chem (2014) 289(36):24845–62. doi: 10.1074/jbc.M114.557025
46. Howlett AC, Fleming RM. Cannabinoid Inhibition of Adenylate Cyclase. Pharmacology of the Response in Neuroblastoma Cell Membranes. Mol Pharmacol (1984) 26(3):532–8.
47. Pacher P, Batkai S, Kunos G. The Endocannabinoid System as an Emerging Target of Pharmacotherapy. Pharmacol Rev (2006) 58(3):389–462. doi: 10.1124/pr.58.3.2
48. Maneuf YP, Brotchie JM. Paradoxical Action of the Cannabinoid WIN 55,212-2 in Stimulated and Basal Cyclic AMP Accumulation in Rat Globus Pallidus Slices. Br J Pharmacol (1997) 120(8):1397–8. doi: 10.1038/sj.bjp.0701101
49. Luttrell LM, Maudsley S, Bohn LM. Fulfilling the Promise of “Biased” G Protein-Coupled Receptor Agonism. Mol Pharmacol (2015) 88(3):579–88. doi: 10.1124/mol.115.099630
50. Tóth AD, Turu G, Hunyady L, Balla A. Novel Mechanisms of G-Protein-Coupled Receptors Functions: AT1 Angiotensin Receptor Acts as a Signaling Hub and Focal Point of Receptor Cross-Talk. Best Pract Res Clin Endocrinol Metab (2018) 32(2):69–82. doi: 10.1016/j.beem.2018.02.003
51. Zhu X, Gilbert S, Birnbaumer M, Birnbaumer L. Dual Signaling Potential is Common Among Gs-Coupled Receptors and Dependent on Receptor Density. Mol Pharmacol (1994) 46(3):460–9.
52. Nogueras-Ortiz C, Yudowski GA. The Multiple Waves of Cannabinoid 1 Receptor Signaling. Mol Pharmacol (2016) 90(5):620–6. doi: 10.1124/mol.116.104539
53. Delgado-Peraza F, Ahn KH, Nogueras-Ortiz C, Mungrue IN, Mackie K, Kendall DA, et al. Mechanisms of Biased Beta-Arrestin-Mediated Signaling Downstream From the Cannabinoid 1 Receptor. Mol Pharmacol (2016) 89(6):618–29. doi: 10.1124/mol.115.103176
54. Flores-Otero J, Ahn KH, Delgado-Peraza F, Mackie K, Kendall DA, Yudowski GA. Ligand-Specific Endocytic Dwell Times Control Functional Selectivity of the Cannabinoid Receptor 1. Nat Commun (2014) 5:4589. doi: 10.1038/ncomms5589
55. Ahn KH, Mahmoud MM, Shim JY, Kendall DA. Distinct Roles of β-Arrestin 1 and β-Arrestin 2 in ORG27569-Induced Biased Signaling and Internalization of the Cannabinoid Receptor 1 (CB1). J Biol Chem (2013) 288(14):9790–800. doi: 10.1074/jbc.M112.438804
56. He JC, Gomes I, Nguyen T, Jayaram G, Ram PT, Devi LA, et al. The G Alpha(O/I)-Coupled Cannabinoid Receptor-Mediated Neurite Outgrowth Involves Rap Regulation of Src and Stat3. J Biol Chem (2005) 280(39):33426–34. doi: 10.1074/jbc.M502812200
57. Gaffuri AL, Ladarre D, Lenkei Z. Type-1 Cannabinoid Receptor Signaling in Neuronal Development. Pharmacology (2012) 90(1-2):19–39. doi: 10.1159/000339075
58. Turu G, Simon A, Gyombolai P, Szidonya L, Bagdy G, Lenkei Z, et al. The Role of Diacylglycerol Lipase in Constitutive and Angiotensin AT1 Receptor-Stimulated Cannabinoid CB1 Receptor Activity. J Biol Chem (2007) 282(11):7753–7. doi: 10.1074/jbc.C600318200
59. Howlett AC, Reggio PH, Childers SR, Hampson RE, Ulloa NM, Deutsch DG. Endocannabinoid Tone Versus Constitutive Activity of Cannabinoid Receptors. Br J Pharmacol (2011) 163(7):1329–43. doi: 10.1111/j.1476-5381.2011.01364.x
60. Rozenfeld R, Devi LA. Regulation of CB1 Cannabinoid Receptor Trafficking by the Adaptor Protein AP-3. FASEB J (2008) 22(7):2311–22. doi: 10.1096/fj.07-102731
61. Gyombolai P, Boros E, Hunyady L, Turu G. Differential Beta-Arrestin2 Requirements for Constitutive and Agonist-Induced Internalization of the CB1 Cannabinoid Receptor. Mol Cell Endocrinol (2013) 372(1-2):116–27. doi: 10.1016/j.mce.2013.03.013
Keywords: CB1 receptor, receptor degradation, cannabinoids, weak promoters, heterologous expression, non-canonical signaling
Citation: Horváth VB, Soltész-Katona E, Wisniewski É, Rajki A, Halász E, Enyedi B, Hunyady L, Tóth AD and Szanda G (2021) Optimization of the Heterologous Expression of the Cannabinoid Type-1 (CB1) Receptor. Front. Endocrinol. 12:740913. doi: 10.3389/fendo.2021.740913
Received: 13 July 2021; Accepted: 21 September 2021;
Published: 20 October 2021.
Edited by:
Marta Letizia Hribal, University of Catanzaro, ItalyReviewed by:
Miles Douglas Thompson, University of California, San Diego, United StatesShupeng Li, Peking University, China
Copyright © 2021 Horváth, Soltész-Katona, Wisniewski, Rajki, Halász, Enyedi, Hunyady, Tóth and Szanda. This is an open-access article distributed under the terms of the Creative Commons Attribution License (CC BY). The use, distribution or reproduction in other forums is permitted, provided the original author(s) and the copyright owner(s) are credited and that the original publication in this journal is cited, in accordance with accepted academic practice. No use, distribution or reproduction is permitted which does not comply with these terms.
*Correspondence: Gergő Szanda, c3phbmRhLmdlcmdvQG1lZC5zZW1tZWx3ZWlzLXVuaXYuaHU=