 Jing Fu
 Jia Liu
- Department of Endocrinology, Beijing Chao-Yang Hospital, Capital Medical University, Beijing, China
Objectives: Bilirubin is a biochemical substance with metabolic benefits. The objective of this research was to elucidate the association between serum bilirubin levels and metabolic alterations in different obesity phenotypes.
Methods: In total, 1,042 drug-naive participants were included in the study. Of them, 541 were obese patients and 501 were age-matched and sex-matched healthy control subjects. The obese patients were divided into metabolically healthy obesity (MHO) group and metabolically unhealthy obesity (MUHO) group according to the levels of fasting plasma glucose (FBG), triglyceride (TG), high-density lipoprotein cholesterol (HDL-C) and blood pressure (BP). Clinical and biochemical parameters including total bilirubin (TBil), indirect bilirubin (IBil) and direct bilirubin (DBil) were measured. ANOVA or Kruskal-Wallis H test was used to test differences among the three groups. Pearson and Spearman correlations were used to analyze the relationships between two parameters. The relationships between bilirubin and other variables were analyzed using Multivariate regression analysis.
Results: MHO group had favorable blood pressure, glucose and lipids profiles, along with increased TBil and DBil, and decreased high-sensitivity C-reactive protein (hsCRP) and homeostasis model assessment of insulin resistance (HOMA-IR) levels when compared to MUHO group (P < 0.05 for all). TBil and DBil were negatively correlated with total cholesterol (TC), low-density lipoprotein cholesterol (LDL-C), fasting insulin (FINS), hsCRP and HOMA-IR, even after adjusted for age, gender and BMI (all P <0.01). Multivariate regression analysis demonstrated that HOMA-IR was independently correlated with TBil and DBIi levels (β = -0.400, P < 0.01).
Conclusion: MHO group harbors increased bilirubin level compared with MUHO group. HOMA-IR was independently correlated with TBil and DBIi levels.
Introduction
Obesity has become a global health problem due to its epidemic proportions and health hazard (1–3). Obesity is confirmed as one of the most important risk factors for dyslipidemia, type 2 diabetes and metabolic syndrome (1–3). Interestingly, a part of obese subjects show normal metabolism, which is defined as “metabolically healthy obesity (MHO)” (4, 5). However, exact mechanisms of MHO remain unclear.
Bilirubin, a product of heme metabolism, exerts anti-inflammatory and antioxidative effects (6, 7). Circulating bilirubin level is reported to be negatively correlated with the risk of cardio-metabolic diseases, including type 2 diabetes, NAFLD etc (7–11). As an intermediate state between health and metabolic disorders, MHO would manifest different bilirubin levels (12). However, the association between bilirubin and MHO is rarely reported.
The research aimed to elucidate the associations between serum bilirubin levels and metabolic parameters in different obesity phenotypes.
Material and Methods
Study Subjects
A total of 541 obese patients were consecutively enrolled in our study. The included patients were no less than 18 years, with BMI (body mass index) ≥ 28.0 kg/m2. All of the subjects received physical examinations in Beijing Chao-Yang Hospital, Capital Medical University between January 2018 and January 2019 (2). Meanwhile, 501 healthy individuals with normal weight (18.5 kg/m2 ≤ BMI < 24.0 kg/m2) were recruited as controls, and they were matched with obese cases in age and gender (2). The subjects had no evidences for alcohol abuse, cardiovascular disease, thyroid dysfunction, anemia, hematological disease, chronic hepatitis/cirrhosis, biliary obstruction disease, acute or chronic infections, renal insufficiency, systemic inflammation, or cancer. Individuals in pregnancy or taking medications known to influence bilirubin, liver function, insulin, glucose, lipid or blood pressure were excluded, such as glycyrrhizic acid, ursodeoxycholic acid, potassium magnesium aspartate, “Yinzhihuang” granules, Metformin, Reserpine, Guanethidine, etc. In addition, persons meeting any one of the following conditions were also removed: serum bilirubin levels ≥ 2 times of upper limit of normal (ULN) (ULNs: TBIL: 21.0 μmol/L and DBIL : 6.8 μmol/L) or serum ALT and/or AST and/or GGT levels ≥ 3ULN (ULNs: alanine aminotransferase (ALT) : 50 U/L, aspartate aminotransferase (AST) : 40 U/L, and gamma-glutamyl transferase (GGT) : 60 U/L).
When obese individuals (BMI ≥28 kg/m2) did not conform to the following criteria, they were categorized as MHO (13): (1) elevated FBG (≥5.6 mmol/L), (2) elevated TG (≥1.7 mmol/L), (3) reduced HDL-C (<1.0 mmol/L for men and <1.3 mmol/L for women), and (4) elevated SBP (≥130 mmHg) or/and DBP (≥85 mmHg). Obese patients who had one or more of these four metabolic risk components were categorized as metabolically unhealthy obesity (MUHO) (13).
This research was performed according to the Declaration of Helsinki ethical principles. Ethics approval was given by the Institutional Review Board (IRB) of Beijing Chao-Yang Hospital, Capital Medical University. Written informed consents were obtained from all subjects.
Clinical and Biochemical Indicators’ Measurement
Both health status and medical history were collected through a standard questionnaire during a face-to-face interview, including alcohol consumption, medication status, physical activity, and history of diseases. Height was measured, with an accuracy of 0.1 cm, and weight was accurate to 0.1 kg, by professional medical staff, while participants were wearing light clothing without shoes. Body mass index (BMI) was calculated as weight/body height (kg/m2). We employed a sphygmomanometer to measure sitting blood pressure for non-dominant arm after at least ten-minute rest.
After overnight fasting, blood samples were collected from median cubital vein. All biochemical indicators were measured using an automatic biochemical analyzer (Hitachi 747, Roche Diagnostics, Germany), except for fasting plasma insulin (FINS), glycated hemoglobin A1c (HbA1c) and high-sensitivity C-reactive protein (hsCRP). Alanine aminotransferase (ALT), aspartate aminotransferase (AST) and gamma-glutamyl transpeptidase (GGT) were measured via velocity method. Total bilirubin (TBil) and direct bilirubin (DBil) were measured through vanadate oxidation method. Indirect bilirubin (IBil) was calculated based on TBil minus DBil. Total cholesterol (TC), triglyceride (TG), high-density lipoprotein cholesterol (HDL-C) and low-density lipoprotein cholesterol (LDL-C) were assessed adopting colorimetric enzymatic methods. Plasma TC and TG were tested employing enzymatic cholesterol oxidase reaction and glycerol lipase oxidase reaction, respectively. HDL-C and LDL-C were assessed via direct measurement. Fasting plasma glucose (FBG) were estimated utilizing glucose oxidase assay. FINS concentrations were tested using chemiluminescence assay (Dimension Vista, Siemens Healthcare Diagnostics, Germany). HbA1c was measured applying high-performance liquid chromatography (HPLC) on an automatic biochemical analyzer (HLC-723G7, Tosoh Corporation, Tokyo, Japan). hsCRP levels were determined with immunonephelometric analysis. To estimate insulin resistance, homeostasis model assessment of insulin resistance (HOMA-IR) was calculated: HOMA-IR = [FINS (μIU/mL) * FBG (mmol/L)/22.5] (14).
Statistical Analysis
All statistical analyses were performed using SPSS 21.0 (SPSS, Chicago, IL, USA). Continuous variables in normal distribution were recorded as mean values ± standard deviation (SD). Because values for ALT, GGT, TG, FINS, hsCRP and HOMA-IR did not conform to normal distribution, they were represented by the median, 25% quartile and 75% quartile. Chi-squared test was adopted to analyze categorical variables. ANOVA or Kruskal-Wallis H test was used to compare differences among the three groups. Post hoc analyses were performed. The relationships between two parameters were analyzed using Pearson and Spearman correlations. The relationship between bilirubin and other variables was analyzed using Multivariate regression analysis. P < 0.05 (two-tailed) revealed statistical significance of results.
Results
Baseline Characteristics of control, MHO and MUHO Groups
Baseline characteristics of the included subjects were summarized in Table 1. Analysis results showed that age and gender were similar among control, MHO and MUHO groups. Among these three groups, no significant differences were observed in serum IBil levels. Significant differences were identified in BMI, SBP, DBP, ALT, AST, GGT, TBil, DBil, TC, TG, HDL-C, LDL-C, FBG, FINS, HbA1c, hsCRP and HOMA-IR levels among control, MHO and MUHO groups (all P < 0.01).
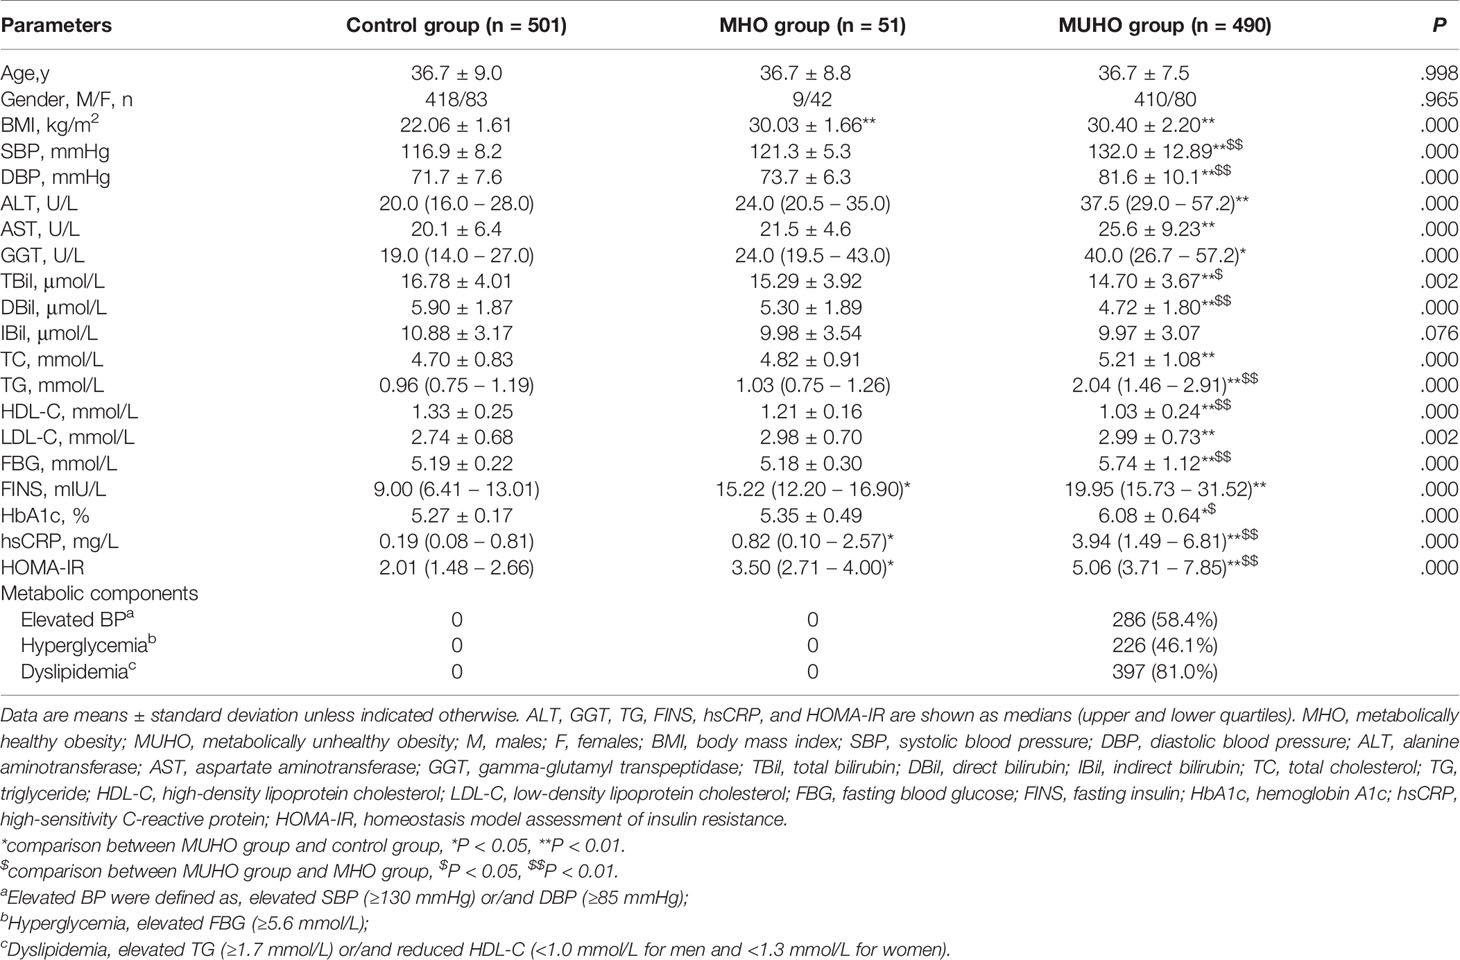
Table 1 Baseline characteristics of control, MHO and MUHO groups.
Further post hoc analysis showed that both of MHO and MUHO groups had significantly increased BMI, FINS, hsCRP and HOMA-IR compared with control group (Table 1). Moreover, patients in MUHO group had significantly increased SBP, DBP, ALT, AST, GGT, TC, TG, LDL-C, FBG and HbA1c levels, and decreased Tbil, DBil and HDL-C levels when compared to healthy controls (Table 1). MHO and MUHO groups showed similar tendencies in BMI, ALT, AST, GGT, IBil, TC, LDL-C and FINS levels (Table 1). Interestingly, MHO group had relatively lower SBP, DBP, TG, FBG, HbA1c, hsCRP and HOMA-IR levels, and higher TBil, DBil and HDL-C levels than MUHO group (Table 1).
Comparison on Bilirubin Levels Among Control, MHO and MUHO Groups
We compared TBil, DBil and IBil levels among control, MHO and MUHO groups. As displayed in Supplementary Figure 1, MUHO group showed significantly lower level of TBil than control (P<0.01) and MHO (P<0.05) groups. MHO and control groups showed similar TBil values (P>0.05). As for IBil level, there were no significant differences among control, MHO and MUHO groups (P>0.05 for all) (Supplementary Figure 2). In addition, the level of DBil was decreased in MUHO group, compared with control and MHO groups (P<0.01 for both). Meanwhile, control and MHO groups showed insignificant difference in DBil level (P>0.05) (Supplementary Figure 3).
The Associations Between Bilirubin and Clinical Parameters in All Subjects
TBil level showed negative association with BMI, GGT, TC, TG, LDL-C, FINS, hsCRP and HOMA-IR, and positive association with HDL-C level (Table 2). Moreover, these significant correlations did not show remarkable alteration after adjusted for age, gender and BMI (P <0.01 for all).
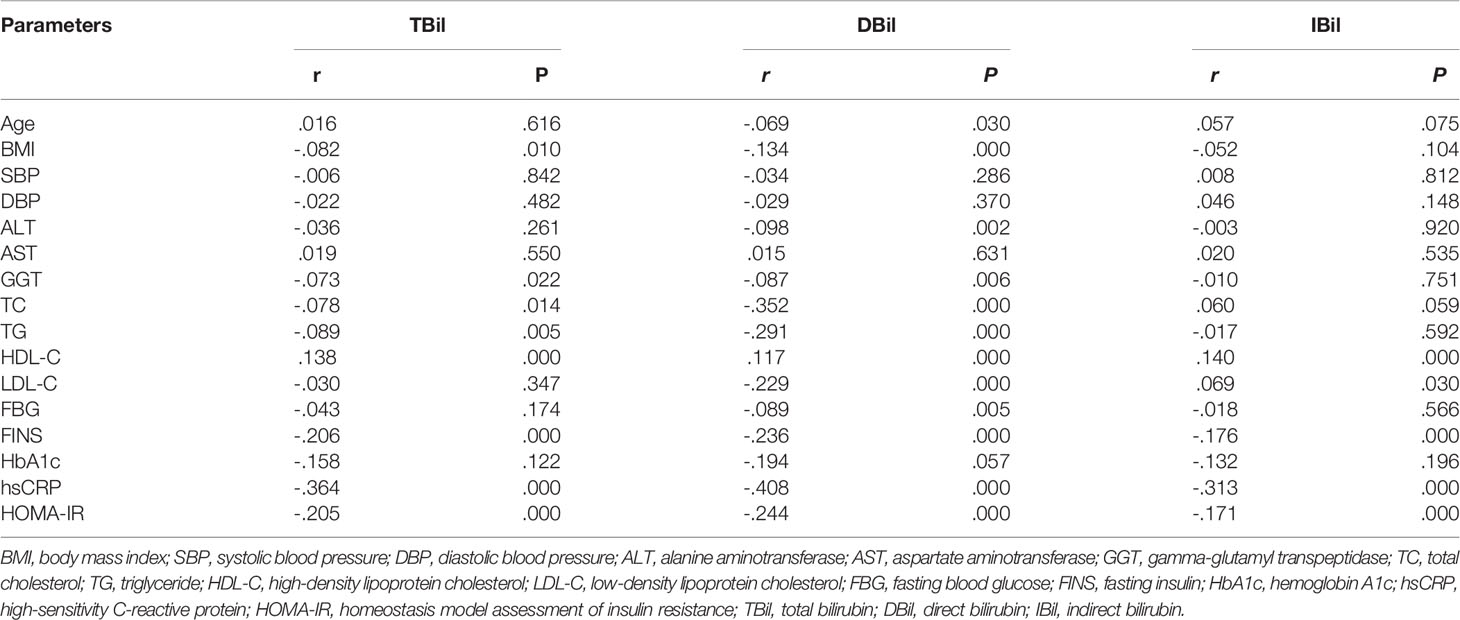
Table 2 Correlation between bilirubin and clinical parameters in all participants.
Serum DBil level was negatively correlated with age, BMI, ALT, GGT, TC, TG, LDL-C, FBG, FINS, hsCRP and HOMA-IR, and positively associated with HDL-C levels (Table 2). After adjusted for age, gender and BMI, the associations of DBil level with TC, LDL-C, FINS, hsCRP and HOMA-IR were still significant (TC: r = - 0.493; LDL-C: r = - 0.530; FINS: r = - 0.441; hsCRP: r = - 0.335; HOMA-IR: r = - 0.380; all P <0.01).
Serum IBil level was negatively correlated with hsCRP and HOMA-IR, and positively correlated with HDL-C and LDL-C levels (Table 2). However, these associations were insignificant after adjusted for age, gender and BMI.
Multivariate Stepwise Regression Analysis on Relationships Between Serum Bilirubin Level and Other Clinical Parameters
Multivariate regression analysis was used to evaluate the correlation between serum bilirubin level and clinical and biochemical parameters, including age, gender, BMI, TG, FBG, hsCRP and HOMA-IR. Results showed HOMA-IR was independently correlated with TBil and DBil levels (β = -0.400, P < 0.01).
Discussion
Compared with MUHO group, MHO group had favorable blood pressure, glucose and lipid profiles, increased TBil and DBil levels, and decreased hsCRP and HOMA-IR levels, even in a comparable BMI level. Serum TBil and DBil levels were negatively correlated with TC, LDL-C, FINS, hsCRP and HOMA-IR. HOMA-IR was independently correlated with TBil and DBil levels.
Apart from favorable metabolic parameters, MHO group had decreased hsCRP and HOMA-IR levels when compared to MUHO group, even in a comparable BMI level. Insulin resistance is a major mechanism for metabolic syndrome (15, 16). Chronic overfeeding induces adipocyte hypertrophy, and then activates inflammatory pathways and accelerates inflammatory cells’ infiltration in adipose tissue, which further promote chronic low-grade inflammation and systemic insulin resistance in diet-induced obese mice (15–17). A recent human study showed that serum bilirubin level was negatively associated with inflammatory cytokines such as TNF-α, IL-6 and CRP, and positively associated with anti-inflammatory adiponectin (18). Consistently, our study showed that relatively reduced inflammatory state and heightened insulin sensitivity predicted favorable metabolic parameters in MHO patients.
Bilirubin has been recognized as a biochemical substance with metabolic benefits in recent years (19). Bilirubin includes two subtypes: DBil and IBil. DBil could be converted from IBil by UDP-glucuronyl transferase 1A1 (UGT1A1) in liver. The present research displayed that MHO patients had higher Tbil and DBil levels compared with MUHO group. Moreover, serum DBIL level was negatively correlated with HOMA-IR level. Multivariate regression analysis displayed that HOMA-IR was independently correlated with TBil and DBil levels. Consistently, previous studies showed that higher plasma TBil and DBil levels were associated with better metabolic parameters and lower risk of NAFLD (10, 20, 21). Morbid obesity decreases UGT1A1 activity, which may lead to low DBil level (22). In our study, both of MHO and MUHO groups showed decreased TBil and DBil levels. Moreover, IBil level in MHO group was similar to that in MUHO group. So significant down-regulation of TBil level in MUHO group could be attributed to decreased DBil level caused by UGT1A1 defect. Bilirubin administration for 14 days significantly reduced body weights, improved glucose tolerance and elevated insulin sensitivity in DIO mice (23). Bilirubin treatment reduced macrophage infiltration, and inhibited the expressions of TNF-α, IL-1β and MCP-1 in adipose tissue of diet-induced obese mice (24). Bilirubin also regulated T helper type 17 (Th17) immune responses and inhibited the generation of ROS induced by toll-like receptor 4 (25, 26). In the present study, correlation analysis found that serum DBil level was negatively associated with hsCRP level. These findings from our study and previous ones suggested that increased TBil and DBil levels predicted normal metabolism among obese subjects. In normal physiological pH condition, bilirubin is a fat soluble substance difficult to dissolve in water. In blood, bilirubin binds to albumin for transportation. It was reported that DBil was weakly bound to albumin, while IBil was strongly bound to albumin (27). So DBil might be easily separated from albumin, and played protective roles in metabolic processes.
In addition, serum levels of TBil and DBil were negatively correlated with atherogenic blood lipids (TC and LDL-C). In diet-induced obese mice, bilirubin treatment significantly reduced TC level, accompanied by reduced hepatic expression of SREBP-1, a factor required for de novo lipogenesis (23). Consistently, patients with Gilbert’s syndrome had reduced TC and LDL-C levels when compared to matched controls (19, 28, 29). Bilirubin could promote lipid catabolism and inhibit lipid accumulations (30, 31). Bilirubin might bind to PPARα and promote β-hydroxybutyrate, and then activate hepatic β-oxidation pathway, thus boosting lipid metabolism (32, 33).
Several limitations in our research should be acknowledged here. First, this cross-sectional study cannot render causal inferences. Besides, Gilbert’s syndrome, caused by reduced activity of UGT enzyme, is a common hereditary disease featured by hyperbilirubinemia. Although participants with serum bilirubin level ≥ 2ULN were excluded, Gilbert’s syndrome cases with serum bilirubin levels ≤ 2ULN might be recruited due to the absence of genetic examination. Finally, we only observed the association between bilirubin and metabolic parameters, and precise mechanism was not explored. In addition, only 51 patients were included in MHO group that might reduce statistical power of our analysis. Moreover, the prevalence of MHO was 9.43% in our study population, which was lower than previously reported occurrence rate (10%-30%) (5). Selection bias might contribute to this difference. More prospective and larger-scale studies are needed to determine the function and mechanisms of bilirubin in the progression of metabolic disorders in obese patients.
Conclusions
Comparing with MUHO group, MHO group has favorable blood pressure, glucose and lipid profiles, apart from increased TBil and DBil levels and decreased hsCRP and HOMA-IR levels. Multivariate regression analysis shows that HOMA-IR is independently correlated with TBil and DBil levels.
Data Availability Statement
The original contributions presented in the study are included in the article/Supplementary Material. Further inquiries can be directed to the corresponding author.
Ethics Statement
The studies involving human participants were reviewed and approved by the Institutional Review Board (IRB) of Beijing Chao-Yang Hospital, Capital Medical University. The patients/participants provided their written informed consent to participate in this study.
Author Contributions
JF, QW, and LZ conceived and designed the experiments, analyzed the data, and wrote the paper. JL and GW performed the experiments. All authors contributed to the article and approved the submitted version.
Funding
This work was supported by grants from the Beijing Talents foundation [2018-12] to JL, and the Chinese National Natural Science Foundation [No. 81770792] and Key Projects of Science and Technology Planning of Beijing Municipal Education Commission [KZ201810025038] to GW. The funders had no role in study design, data collection and analysis, decision to publish, or preparation of the manuscript.
Conflict of Interest
The authors declare that the research was conducted in the absence of any commercial or financial relationships that could be construed as a potential conflict of interest.
Publisher’s Note
All claims expressed in this article are solely those of the authors and do not necessarily represent those of their affiliated organizations, or those of the publisher, the editors and the reviewers. Any product that may be evaluated in this article, or claim that may be made by its manufacturer, is not guaranteed or endorsed by the publisher.
Acknowledgments
We are grateful to all the patients for their participation.
Supplementary Material
The Supplementary Material for this article can be found online at: https://www.frontiersin.org/articles/10.3389/fendo.2021.792795/full#supplementary-material
References
1. Expert Panel Members, Jensen MD, Ryan DH, Donato KA, Apovian CM, Ard JD. Executive Summary: Guidelines, (2013) for the Management of Overweight and Obesity in Adults: A Report of the American College of Cardiology/American Heart Association Task Force on Practice Guidelines and the Obesity Society Published by the Obesity Society and American College of Cardiology/American Heart Association Task Force on Practice Guidelines. Based on a Systematic Review From the The Obesity Expert Panel 2013. Obes (Silver Spring) (2014) 22(Suppl 2):S5–39. doi: 10.1002/oby.20821
2. Jensen MD, Ryan DH, Apovian CM, Ard JD, Comuzzie AG, Donato KA, et al. 2013 AHA/ACC/TOS Guideline for the Management of Overweight and Obesity in Adults: A Report of the American College of Cardiology/American Heart Association Task Force on Practice Guidelines and The Obesity Society. Circulation (2014) 129:S102–138. doi: 10.1161/01.cir.0000437739.71477.ee
3. Joshy G, Korda RJ, Attia J, Liu B, Bauman AE, Banks E. Body Mass Index and Incident Hospitalisation for Cardiovascular Disease in 158 546 Participants From the 45 and Up Study. Int J Obes (Lond) (2014) 38:848–56. doi: 10.1038/ijo.2013.192
4. Stefan N, Haring HU, Hu FB, Schulze MB. Metabolically Healthy Obesity: Epidemiology, Mechanisms, and Clinical Implications. Lancet Diabetes Endocrinol (2013) 1:152–62. doi: 10.1016/S2213-8587(13)70062-7
5. Bluher M. Metabolically Healthy Obesity. Endocr Rev (2020) 41:bnaa004. doi: 10.1210/endrev/bnaa004
6. Stocker R. Antioxidant Activities of Bile Pigments. Antioxid Redox Signal (2004) 6:841–9. doi: 10.1089/ars.2004.6.841
7. Hinds TD Jr., Stec DE. Bilirubin, A Cardiometabolic Signaling Molecule. Hypertension (2018) 72:788–95. doi: 10.1161/HYPERTENSIONAHA.118.11130
8. Jung CH, Lee MJ, Kang YM, Hwang JY, Jang JE, Leem J, et al. Higher Serum Bilirubin Level as a Protective Factor for the Development of Diabetes in Healthy Korean Men: A 4 Year Retrospective Longitudinal Study. Metabolism (2014) 63:87–93. doi: 10.1016/j.metabol.2013.09.011
9. Nano J, Muka T, Cepeda M, Voortman T, Dhana K, Brahimaj A, et al. Association of Circulating Total Bilirubin With the Metabolic Syndrome and Type 2 Diabetes: A Systematic Review and Meta-Analysis of Observational Evidence. Diabetes Metab (2016) 42:389–97. doi: 10.1016/j.diabet.2016.06.002
10. Tian J, Zhong R, Liu C, Tang Y, Gong J, Chang J, et al. Association Between Bilirubin and Risk of Non-Alcoholic Fatty Liver Disease Based on a Prospective Cohort Study. Sci Rep (2016) 6:31006. doi: 10.1038/srep31006
11. Kunutsor SK, Frysz M, Verweij N, Kieneker LM, Bakker SJL, Dullaart RPF. Circulating Total Bilirubin and Risk of non-Alcoholic Fatty Liver Disease in the PREVEND Study: Observational Findings and a Mendelian Randomization Study. Eur J Epidemiol (2020) 35:123–37. doi: 10.1007/s10654-019-00589-0
12. Camhi SM, Must A, Gona PN, Hankinson A, Odegaard A, Reis J, et al. Duration and Stability of Metabolically Healthy Obesity Over 30 Years. Int J Obes (Lond) (2019) 43:1803–10. doi: 10.1038/s41366-018-0197-8
13. Ortega FB, Lavie CJ, Blair SN. Obesity and Cardiovascular Disease. Circ Res (2016) 118:1752–70. doi: 10.1161/CIRCRESAHA.115.306883
14. Matthews DR, Hosker JP, Rudenski AS, Naylor BA, Treacher DF, Turner RC. Homeostasis Model Assessment: Insulin Resistance and Beta-Cell Function From Fasting Plasma Glucose and Insulin Concentrations in Man. Diabetologia (1985) 28:412–9. doi: 10.1007/BF00280883
15. Heilbronn LK, Campbell LV. Adipose Tissue Macrophages, Low Grade Inflammation and Insulin Resistance in Human Obesity. Curr Pharm Des (2008) 14:1225–30. doi: 10.2174/138161208784246153
16. Olefsky JM, Glass CK. Macrophages, Inflammation, and Insulin Resistance. Annu Rev Physiol (2010) 72:219–46. doi: 10.1146/annurev-physiol-021909-135846
17. Chawla A, Nguyen KD, Goh YP. Macrophage-Mediated Inflammation in Metabolic Disease. Nat Rev Immunol (2011) 11:738–49. doi: 10.1038/nri3071
18. Petelin A, Jurdana M, Jenko Praznikar Z, Ziberna L. Serum Bilirubin Correlates With Serum Adipokines in Normal Weight and Overweight Asymptomatic Adults. Acta Clin Croat (2020) 59:19–29. doi: 10.20471/acc.2020.59.01.03
19. Seyed Khoei N, Grindel A, Wallner M, Molzer C, Doberer D, Marculescu R, et al. Mild Hyperbilirubinaemia as an Endogenous Mitigator of Overweight and Obesity: Implications for Improved Metabolic Health. Atherosclerosis (2018) 269:306–11. doi: 10.1016/j.atherosclerosis.2017.12.021
20. Chang Y, Ryu S, Zhang Y, Son HJ, Kim JY, Cho J, et al. A Cohort Study of Serum Bilirubin Levels and Incident non-Alcoholic Fatty Liver Disease in Middle Aged Korean Workers. PLoS One (2012) 7:e37241. doi: 10.1371/journal.pone.0037241
21. Kwak MS, Kim D, Chung GE, Kang SJ, Park MJ, Kim YJ, et al. Serum Bilirubin Levels are Inversely Associated With Nonalcoholic Fatty Liver Disease. Clin Mol Hepatol (2012) 18:383–90. doi: 10.3350/cmh.2012.18.4.383
22. Rougée LR, Miyagi SJ, Collier AC. Obstetric Obesity is Associated With Neonatal Hyperbilirubinemia With High Prevalence in Native Hawaiians and Pacific Island Women. Hawai'i J Med Public health: J Asia Pacific Med Public Health (2016) 75:373–8.
23. Liu J, Dong H, Zhang Y, Cao M, Song L, Pan Q, et al. Bilirubin Increases Insulin Sensitivity by Regulating Cholesterol Metabolism, Adipokines and PPARgamma Levels. Sci Rep (2015) 5:9886. doi: 10.1038/srep09886
24. Dong H, Huang H, Yun X, Kim DS, Yue Y, Wu H, et al. Bilirubin Increases Insulin Sensitivity in Leptin-Receptor Deficient and Diet-Induced Obese Mice Through Suppression of ER Stress and Chronic Inflammation. Endocrinology (2014) 155:818–28. doi: 10.1210/en.2013-1667
25. Idelman G, Smith DLH, Zucker SD. Bilirubin Inhibits the Up-Regulation of Inducible Nitric Oxide Synthase by Scavenging Reactive Oxygen Species Generated by the Toll-Like Receptor 4-Dependent Activation of NADPH Oxidase. Redox Biol (2015) 5:398–408. doi: 10.1016/j.redox.2015.06.008
26. Longhi MS, Vuerich M, Kalbasi A, Kenison JE, Yeste A, Csizmadia E, et al. Bilirubin Suppresses Th17 Immunity in Colitis by Upregulating CD39. JCI Insight (2017) 2:e92791. doi: 10.1172/jci.insight.92791
27. Nakagami T, Toyomura K, Kinoshita T, Morisawa S. A Beneficial Role of Bile Pigments as an Endogenous Tissue Protector: Anti-Complement Effects of Biliverdin and Conjugated Bilirubin. Biochim Biophys Acta (1993) 1158:189–93. doi: 10.1016/0304-4165(93)90013-X
28. Tapan S, Karadurmus N, Dogru T, Ercin CN, Tasci I, Bilgi C, et al. Decreased Small Dense LDL Levels in Gilbert's Syndrome. Clin Biochem (2011) 44:300–3. doi: 10.1016/j.clinbiochem.2010.12.003
29. Wallner M, Marculescu R, Doberer D, Wolzt M, Wagner O, Vitek L, et al. Protection From Age-Related Increase in Lipid Biomarkers and Inflammation Contributes to Cardiovascular Protection in Gilbert's Syndrome. Clin Sci (Lond) (2013) 125:257–64. doi: 10.1042/CS20120661
30. Hana CA, Tran LV, Mölzer C, Müllner E, Hörmann-Wallner M, Franzke B, et al. Serum Metabolomics Analysis Reveals Increased Lipid Catabolism in Mildly Hyperbilirubinemic Gilbert's Syndrome Individuals. Metabolism: Clin Exp (2021) 125:154913. doi: 10.1016/j.metabol.2021.154913
31. Hana CA, Klebermass EM, Balber T, Mitterhauser M, Quint R, Hirtl Y, et al. Inhibition of Lipid Accumulation in Skeletal Muscle and Liver Cells: A Protective Mechanism of Bilirubin Against Diabetes Mellitus Type 2. Front Pharmacol (2021) 11:636533. doi: 10.3389/fphar.2020.636533
32. Stec DE, John K, Trabbic CJ, Luniwal A, Hankins MW, Baum J, et al. Bilirubin Binding to Pparα Inhibits Lipid Accumulation. PLoS One (2016) 11:e0153427. doi: 10.1371/journal.pone.0153427
Keywords: bilirubin, obesity, metabolically benign, morbid, MHO
Citation: Fu J, Wang Q, Zhang L, Liu J and Wang G (2022) Serum Bilirubin Level Is Increased in Metabolically Healthy Obesity. Front. Endocrinol. 12:792795. doi: 10.3389/fendo.2021.792795
Received: 11 October 2021; Accepted: 07 December 2021;
Published: 30 March 2022.
Edited by:
Carla Lubrano, Sapienza University of Rome, ItalyReviewed by:
Claudia Anna Hana, University of Vienna, AustriaLovro Ziberna, University of Ljubljana, Slovenia
Copyright © 2022 Fu, Wang, Zhang, Liu and Wang. This is an open-access article distributed under the terms of the Creative Commons Attribution License (CC BY). The use, distribution or reproduction in other forums is permitted, provided the original author(s) and the copyright owner(s) are credited and that the original publication in this journal is cited, in accordance with accepted academic practice. No use, distribution or reproduction is permitted which does not comply with these terms.
*Correspondence: Jia Liu, bmRnb2RzZmdAMTI2LmNvbQ==