 Chih-Yiu Tsai1,2†
 Hsiu-Chen Lu3†Yu-Hsien Chou1
 Po-Yu Liu4,5Hsin-Yun Chen6Meng-Chuan Huang7,8
 Chia-Hung Lin1,9*
 Chi-Neu Tsai2,10*
- 1Division of Endocrinology and Metabolism, Chang Gung Memorial Hospital, Taoyuan, Taiwan
- 2Graduate Institute of Clinical Medical Sciences, Chang Gung University, Taoyuan, Taiwan
- 3Department of Life Science, College of Life Science, National Taiwan University, Taipei, Taiwan
- 4Department of Internal Medicine, National Taiwan University College of Medicine, Taipei, Taiwan
- 5Department of Pathobiology and Population Sciences, Royal Veterinary College, University of London, Hatfield, United Kingdom
- 6Department of Medical Nutrition Therapy, Chang Gung Memorial Hospital, Taoyuan, Taiwan
- 7Department of Nutrition and Dietetics, Kaohsiung Medical University Hospital, Kaohsiung, Taiwan
- 8Graduate Institute of Medicine and Department of Public Health and Environmental Medicine, School of Medicine, Kaohsiung Medical University, Kaohsiung, Taiwan
- 9Department of Chinese Medicine, College of Medicine, Chang Gung University, Taoyuan, Taiwan
- 10Department of Surgery, New Taipei Municipal Tucheng Hospital, New Taipei City, Taiwan
Backgrounds: Glucagon-like peptide-1 receptor agonist (GLP-1 RA) is probably one of more effective antidiabetic agents in treatment of type 2 diabetes mellitus (T2D). However, the heterogenicity in responses to GLP-1 RA may be potentially related to gut microbiota, although no human evidence has been published. This pilot study aims to identify microbial signatures associated with glycemic responses to GLP-1 RA.
Materials and Methods: Microbial compositions of 52 patients with T2D receiving GLP-1 RA were determined by 16S rRNA amplicon sequencing. Bacterial biodiversity was compared between responders versus non-responders. Pearson’s correlation and random forest tree algorithm were used to identify microbial features of glycemic responses in T2D patients and multivariable linear regression models were used to validate clinical relevance.
Results: Beta diversity significantly differed between GLP-1 RA responders (n = 34) and non-responders (n = 18) (ADONIS, P = 0.004). The top 17 features associated with glycohemoglobin reduction had a 0.96 diagnostic ability, based on area under the ROC curve: Bacteroides dorei and Roseburia inulinivorans, the two microbes having immunomodulation effects, along with Lachnoclostridium sp. and Butyricicoccus sp., were positively correlated with glycemic reduction; Prevotella copri, the microbe related to insulin resistance, together with Ruminococcaceae sp., Bacteroidales sp., Eubacterium coprostanoligenes sp., Dialister succinatiphilus, Alistipes obesi, Mitsuokella spp., Butyricimonas virosa, Moryella sp., and Lactobacillus mucosae had negative correlation. Furthermore, Bacteroides dorei, Lachnoclostridium sp. and Mitsuokella multacida were significant after adjusting for baseline glycohemoglobin and C-peptide concentrations, two clinical confounders.
Conclusions: Unique gut microbial signatures are associated with glycemic responses to GLP-RA treatment and reflect degrees of dysbiosis in T2D patients.
Introduction
An increasing incidence of type 2 diabetes mellitus (T2D) is a severe health issue worldwide, causing high morbidity and mortality with resulting healthcare costs expected to reach US$825B annually by 2030 (1). Therefore, glycemic control in T2D patients is critical to reduce diabetic complications, cardiovascular consequences, and costs (2).
Glucagon-like peptide-1 receptor agonist (GLP-1 RA) has pleotropic effects on pancreas, brain, and other target organs, acting through systemic or enteric neuroendocrine cell pathways (3). Augmented GLP-1 actions include anti-inflammatory, potent glycemic and body weight reduction effects (4); therefore, GLP-1 RA is highly recommended for T2D patients with cardiovascular risk factors (5). However, responses to GLP-1 RA are heterogeneous, with ~ 30 to 50% of patients having an inadequate response or treatment failure (6, 7), representing both a treatment barrier and an economic burden (8). Perhaps loss of efficacy is due to target cells becoming resistant to GLP-1 (9). Risk factors for development of GLP-1 RA treatment failure are prolonged disease duration, previous insulin use, lower C-peptide concentrations or positive islet autoantibodies, partially implicating β-cell failure (10, 11). Regardless, apart from insulin deficiency, GLP-1 resistance has no specific marker.
Gut microbiota is increasingly implicated in the pathogenesis of T2D. Based on metagenome-wide association studies, there were decreased abundances of some butyrate-producing bacteria and increased opportunistic pathogens in patients with T2D (12). Gut microbial dysbiosis could impair gut barriers and cause endotoxemia, insulin resistance and hyperglycemia (13). For T2D patients with different degrees of severity, gut microbiota could serve as an indicator. Furthermore, there is an interplay between gut microbiota and some antidiabetic agents. Metformin is the first example showing that T2D patients with different microbiota may have diverse treatment efficacy (14). As a novel biomarker, gut microbiota may be implicated in responses to GLP-1 RA treatment as well, but there is no human evidence.
Interactions between gut microbiota and GLP-1 RA have been investigated in few animal models (15, 16). In a study of diabetic mice, microbiota-induced vagal afferent neural impairment decreased incretin effects, implying gut dysbiosis may cause GLP-1 resistance via a gut-brain axis (17). As GLP-1 resistance is relatively common and gut microbiota composition varies widely among populations (18), perhaps specific gut microbial signatures determine responses to GLP-1 RA treatment. However, there are insufficient data to access relationships between gut microbiota composition and GLP-1 RA treatment efficacy (19, 20). Therefore, in the pilot study, we analyzed gut microbiota of T2D patients treated with GLP-1 RA and determined clinical implications of gut microbiota in patients with distinct responses.
Materials and Methods
Participants’ Enrollment and Clinical Data Collection
All participants (n = 52) were enrolled from outpatient departments at the Taipei, Linkou and Taoyuan branches of Chang Gung Memorial Hospital, certified Diabetes Health Promotion Centers in Taiwan. Individualized management was performed by diabetes care teams. Main inclusion criteria included diagnosis of T2D, age > 20 years and currently on GLP-1 RA (liraglutide or dulaglutide) treatments with successful adherence. Main exclusion criteria included recent gastrointestinal discomfort (e.g., abdominal pain or diarrhea) within the previous month, recent use of antibiotics, use of probiotics or prebiotics within the previous month, and advanced chronic kidney disease or other metabolic disorders (thyroid dysfunction, Cushing syndrome, acromegaly, and pheochromocytoma). An informed consent form approved by the Institutional Review Board of Chang Gung Memorial Hospital was signed by each participant (certificate number: 201900467B0).
Baseline characteristics before GLP-1 RA treatment including age, gender, duration of diabetes mellitus, body mass index (BMI), serum creatinine, alanine aminotransferase, fasting plasma glucose, glycohemoglobin (HbA1c), C-peptide, lipid profiles, urine albumin-to-creatinine ratio (UACR) and concurrent antidiabetic medication use were recorded. Kidney function, as assessed with eGFR (estimated glomerular filtration rate), was calculated with the IDMS traceable MDRD-study equation. A validated 45-item food frequency questionnaire designed for T2D patients of Han Chinese descent was used to evaluate habitual dietary contents (21). Each participant completed the questionnaire with assistance from a certified dietician. Raw data was transformed into daily dietary fiber intake and estimated daily calorie intake, apportioned among protein, fat, and carbohydrate.
Changes in HbA1c and BMI from the baseline to week 12 were reviewed. To adjust the impact of baseline HbA1c concentration on decreased blood glucose concentrations, GLP-1 RA responders were defined as an HbA1c reduction ratio [(HbA1c level at week 12) – (HbA1c level at baseline)/(HbA1c level at baseline)] ≥ 0.12, whereas GLP-1 RA non-responders were defined as an HbA1c reduction ratio < 0.12. This cut-off ratio was adopted from approximate HbA1c concentrations associated with a 1% change from an 8% HbA1c baseline (22, 23).
To have enough responders and non-responders to identify the relationships between their gut microbiota and treatment effects of GLP-1 RA, we used information from a Taiwan cohort study to estimate sample sizes (24). A sample size of 45 patients with 2:1 ratio of responders (n = 30) and non-responders (n = 15) was calculated, based on 70% power to detect superiority of responders versus non-responders on the 12% reduction HbA1c ratio from baseline (mean = 9.6 with a standard deviation of 1.6) and a one-sided α of 0.05.
Stool Collection and DNA Extraction
A stool sample (0.5 to 3 g) was collected from each participant using a Longsee Profecal kit (Longsee Biomedical Corporation, Guangzhou, China) and processed and stored in accordance with the manufacturer’s protocol. Non-human DNA was extracted from the stool with a QIAamp® DNA Stool Mini Kit (Qiagen, Hilden, Germany), according to manufacturer’s recommendations. The suspension was heated (5 min at 95°C) to lyse Gram positive bacteria, followed by a beads-beating process with Roche MagNALyser (6500 rpm, 30 seconds, 3 times, with 60 seconds cooling on ice). Final DNA products were stored at −20°C.
16S rRNA Gene Amplicon Sequencing
Library preparation for 16s rRNA gene V3 and V4 regions amplicon sequencing was done according to the Illumina protocol (25). Microbial genomic DNA samples (8 to 15 ng) were prepared. A two-step polymerase chain reaction (PCR) workflow of amplicon PCR, first PCR clean-up, index PCR, second PCR clean-up and library validation, was done. Pooled libraries were sequenced on the Illumina Miseq platform (Illumina, San Diego, CA, USA) with v3 reagents for paired-end sequencing (2 × 300 bps). All 16S library preparation and sequencing were done and validated by the Genomic Medicine Core Laboratory, Chang Gung Memorial Hospital at Linkou.
Processing Sequence Reads
Raw sequence reads were acquired from libraries and processed with QIIME 2 version 2020.2, following the Amplicon SOP v2 of microbiome helper (26, 27). Raw paired-end demultiplexed reads were first trimmed using Cutadapt QIIME 2 plugin to remove primer sequences from reads and from those that did not begin with a primer sequence (28), followed by denoising into amplicon sequence variants (ASVs) using DADA2 to exclude low-quality reads. Taxonomy was assigned to the representative ASV sequences using the Naïve Bayesian classifier against the SILVA database (v. 132) (29, 30). In total, 5,503,725 high quality paired-end sequence reads were obtained after filtering out rare, contaminant and unclassified ASVs, ranging from 48,155 to 205,487 per sample. Then, the filtered table was rarefied to minimum sample-length of reads per sample. After QIIME 2 pipeline processing, 1,553 ASVs shared among 52 subjects were identified for analysis.
Microbiota and Statistical Analyses
R software and packages were used for subsequent microbiota analyses on the final filtered table obtained from the QIIME 2 pipeline (31). The R package vegan was used to calculate alpha and beta diversities (32). Observed ASV numbers and Shannon index were used to calculate alpha diversity and a Wilcoxon rank sum test was done to detect differences (α = 0.05) between responders and non-responders. Principal coordinate analysis (PCoA) with Bray-Curtis dissimilarity of each sample was performed to compare, between the two groups, beta diversity of gut microbiota; these were compared using an ADONIS (permutational multivariate analysis of variance using distance matrices) method (33). The Firmicutes/Bacteroidetes ratio and relative abundances of bacterial genera known for association with T2D (Bacteroides, Faecalibacterium, Roseburia, Bifidobacterium, and Akkermansia) were also compared between the two groups (34, 35).
Pearson’s correlation between the HbA1c reduction ratio and the log-transformed abundance of each ASV was calculated. A prevalence of 10% was applied to exclude rare ASVs which were either with positive correlation, but present in < 10% of responders, or with negative correlation, but present in < 10% of non-responders. A random forest algorithm was further applied to filtered ASVs to select the most important features that distinguished responders versus non-responders. Receiver-operating characteristic (ROC) analysis was used to evaluate the performance of selected features and significant clinical variables as classifiers. The dataset was divided into training and validation sets in an 80:20 ratio.
The Basic Local Alignment Search Tool (BLAST) was used to verify the scientific names of ASVs selected as most important features by searching against NCBI non-redundant (nr) and rRNA databases with parameters: query coverage = 100%, percent identity > 99% and E value = 0 (access date: Jan 23, 2021) (36). R package igraph and SpiecEasi were used for construction of the co-occurrence network with SparCC correlation coefficients (37–39). Correlation coefficients were calculated by bootstrapping 99 repetitions with a defined significance (α = 0.05). Edges with coefficients > |0.2| were plotted. The R codes for plots of alpha and beta diversity, random forest, ROC analysis and network were modified from the MARco website (40).
The mean and standard error of the mean of continuous clinical variables were calculated. Wilcoxon rank sum test was applied for assessing differences (α = 0.05) between the two groups. Wilcoxon singed rank test was used to test the significant difference of paired samples, Pearson’s correlation was used to determine linear relationships between two variables and two-tailed Fisher’s Exact Test was used for testing significant differences (α = 0.05) in categorical variables between two groups. Multivariable linear regression analysis of HbA1c reduction was done. Selected microbial features and important clinical variables (P < 0.2) were used for model building. All variables were checked with diagnostic tests to avoid multicollinearity. Backward variable elimination was used to obtain explanatory variables in regression models.
Results
Clinical Characteristics and Treatment Results
A total of 52 T2D patients treated with either liraglutide (n = 22) or dulaglutide (n = 30) were enrolled in this study from June, 2019 to Dec, 2020 (Table 1, Supplementary Figure 1), with 34 and 18 patients defined as responders and non-responders, respectively. Baseline HbA1c differed between groups (9.9 ± 0.2 and 8.9 ± 0.5% for responders versus non-responders, respectively; P = 0.012), as did triglyceride concentrations (356.6 ± 66.3 versus 145.8 ± 14 mg/ml, P = 0.003). Compared to baseline values, HbA1c and BMI were decreased at week 12 in responders (HbA1c: P < 0.001, BMI: P = 0.041), whereas in non-responders, there was no change in these two variables over time (HbA1c: P = 0.267, BMI: P = 0.078) (Figures 1A, B). Furthermore, at week 12, HbA1c differed in responders versus non-responders (7.5 ± 0.2 versus 9.1 ± 0.4%, P < 0.001). There were no significant correlations for change of HbA1c level from baseline and change of BMI for either responders (r = 0.06, P = 0.665) or non-responders (r = 0.31, P = 0.201; Figure 1C). Estimated calorie intake, macro-nutrients intake proportion, dulaglutide or liraglutide use, and concurrent medication were not different between groups (Table 1).
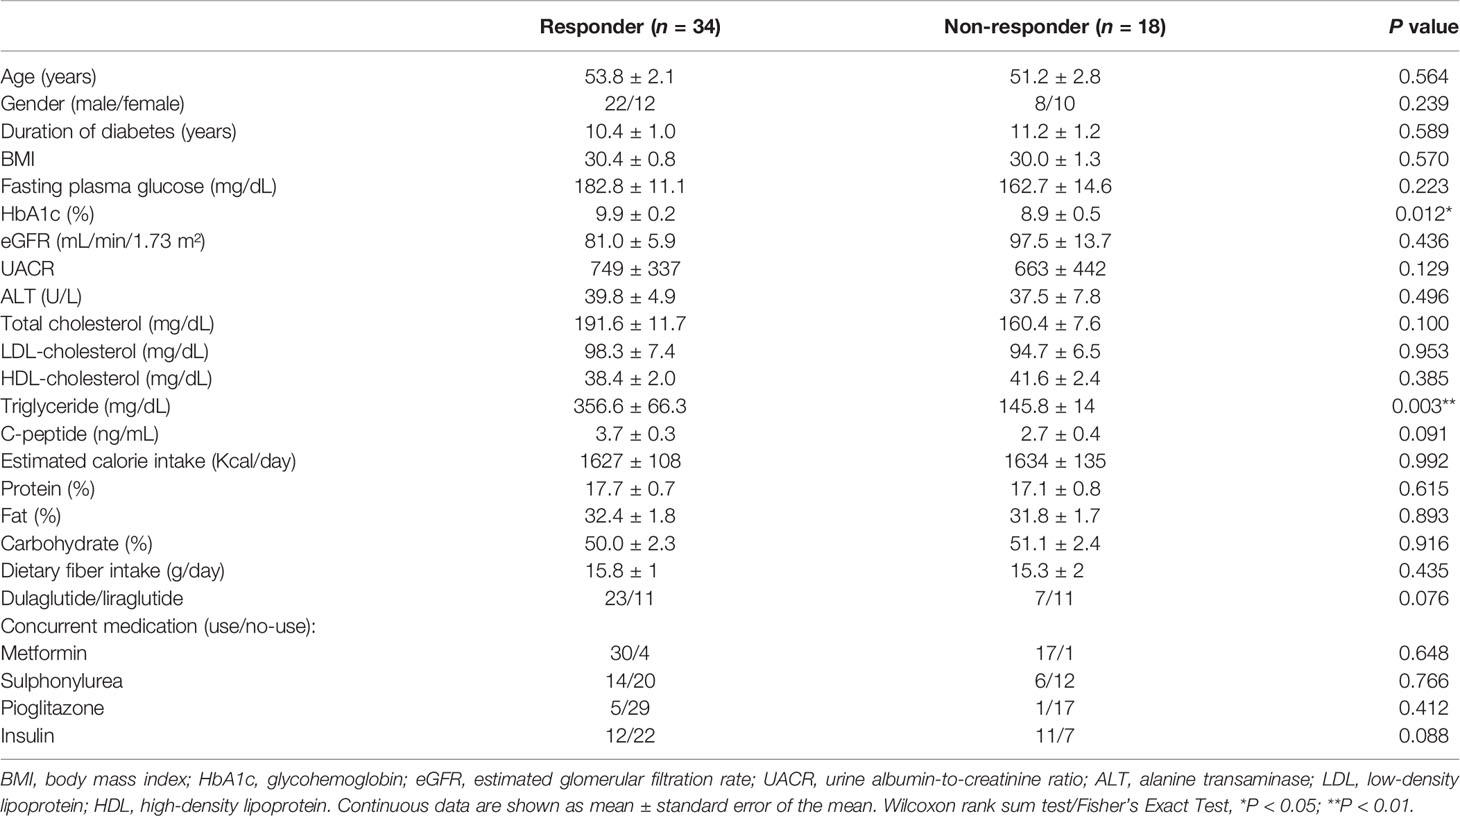
Table 1 Clinical characteristics of type 2 diabetic patients receiving GLP-1 RA (baseline).
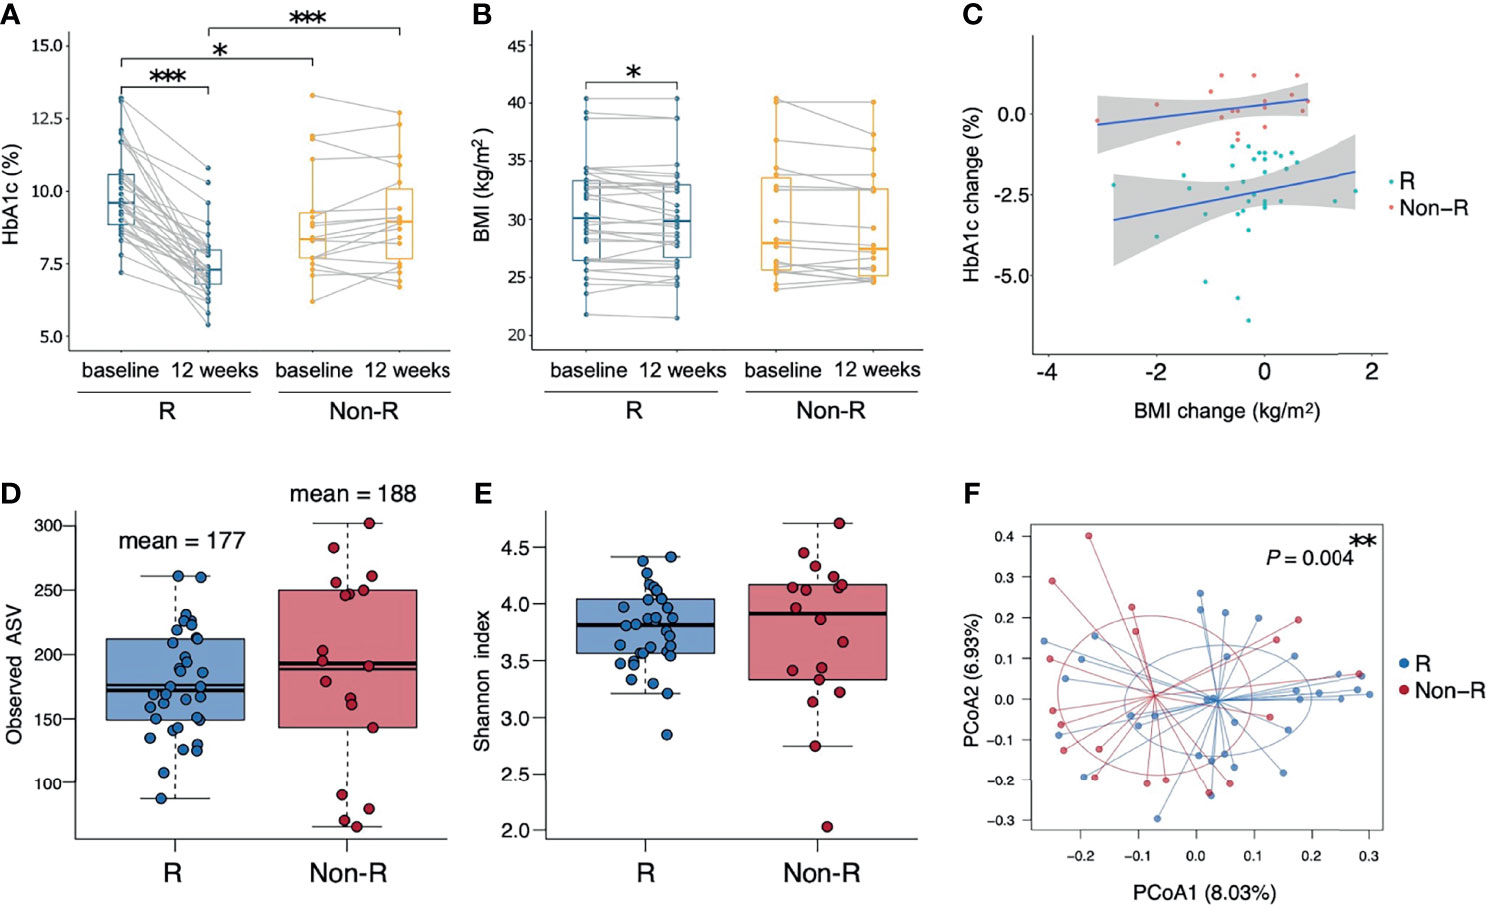
Figure 1 Therapeutic outcomes and microbiota biodiversity of type 2 diabetic patients receiving GLP-1 RA treatment. (A, B) Responders had significant reductions in both HbA1c and BMI (P < 0.001 and P = 0.041 respectively, Wilcoxon signed rank tests), whereas non-responders had insignificant changes. Responders had a higher HbA1c than non-responders at baseline and a lower HbA1c at week 12 (P = 0.012 and P < 0.001 respectively, Wilcoxon rank sum tests). (C) Correlations between the change from the baseline of HbA1c and BMI in the two groups were not significant (P > 0.05, Pearson’s correlation). (D, E) Similar alpha diversity of the bacterial microbiota in the two groups, based on observed ASV numbers and Shannon index (P = 0.376 and P = 0.832 respectively, Wilcoxon rank sum tests). The mean observed ASVs are shown as additional thin lines in boxes. (F) There was a difference in beta diversity between the two groups by PCoA (P = 0.004, ADONIS). Each point represented each individual, colored according to treatment responses. In all panels: *P < 0.05; **P < 0.01; ***P < 0.001. Groups are responders (R) and non-responders (Non-R). HbA1c, glycohemoglobin; BMI, body mass index; ASV, amplicon sequence variant; PCoA, principal coordinate analysis.
Analysis of Biodiversity and Similarity of Gut Microbiota Between Groups
Alpha diversity did not differ between responders versus non-responders, based on observed ASV numbers (P = 0.376) (Figure 1D) and Shannan index (P = 0.832) (Figure 1E). However, microbiota composition differed between groups (P = 0.004), with responders and non-responders slightly separated in the PCoA plot (Figure 1F). The most abundant phylum was Bacteroidetes (48.1 ± 1.5%); it was the dominant taxa at the phylum level in most samples (74% in responders and 56% in non-responders), whereas phylum Firmicutes dominated in other samples (Figure 2A). The Firmicutes/Bacteroidetes ratio, a hallmark of obesity, was not different between groups (responders: 0.83 ± 0.06, non-responder: 1.07 ± 0.19, P = 0.272; Figure 2B). Beta diversity was the only macro-metric marker of microbiota composition that differed between the two groups.
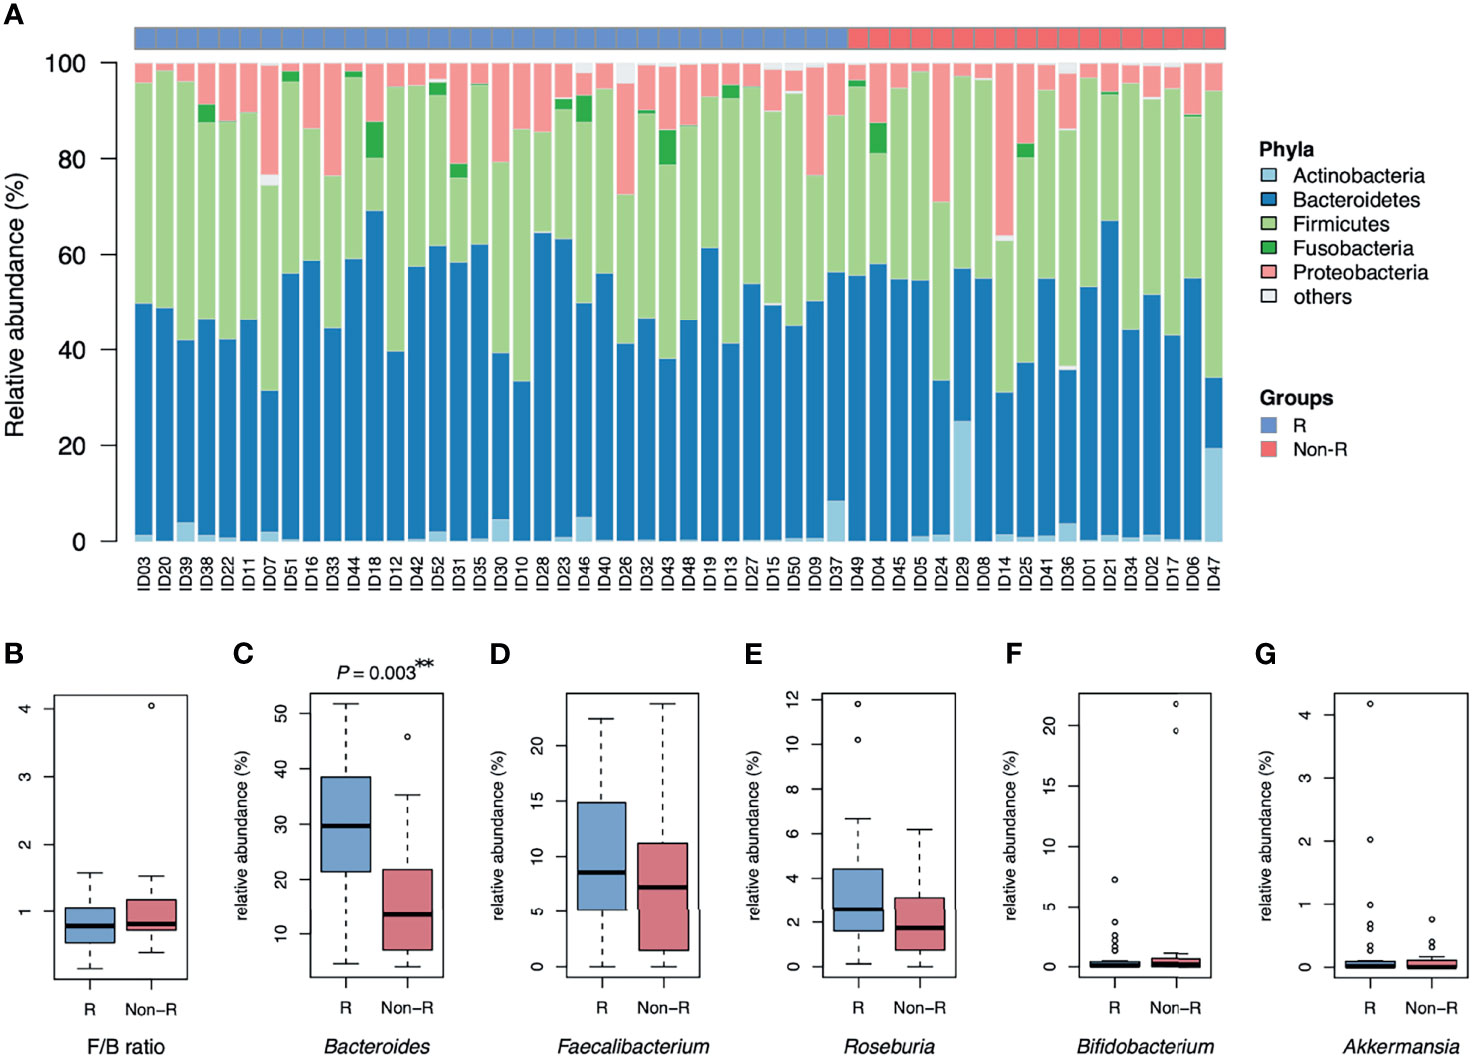
Figure 2 Microbiota composition of type 2 diabetic patients receiving GLP-1 RA treatment: responders and non-responders. (A) The barplot is relative abundance of bacteria at the phylum level. Samples are in a sequence of HbA1c reduction across the x-axis. Bacteroidetes was the dominant taxa in most samples. (B) The Firmicutes/Bacteroidetes ratio (F/B) was not different between groups. (C) The relative abundance of Bacteroides was higher in responders than non-responders (**P < 0.01, Wilcoxon rank sum tests). (D, E) No significant difference in relative abundance of Faecalibacterium and Roseburia in both groups. (F, G) Bifidobacterium and Akkermansia were scarce in both groups. Groups are responders (R) and non-responders (Non-R). HbA1c, glycohemoglobin.
The relative abundance of Bacteroides was profoundly higher in responders than non-responders (28.5 ± 2.2 and 16.9 ± 2.8%, respectively; P = 0.003; Figure 2C). However, relative abundance of other genera known for negative association with T2D were not significantly different between groups (Faecalibacterium: P = 0.376, Roseburia: P = 0.063, Bifidobacterium: P = 0.563 and Akkermansia: P = 0.696; Figures 2D–G). At the bacterial genus level, Bacteroides was the taxa that was both dominant in abundance and had good discrimination between the two groups.
Associations Between Gut Microbiota and Treatment Glycemic Responses
To address the gut microbiota and glycemic control in T2D patients, the 65 ASVs with differential abundance across subjects were significantly correlated with their HbA1c reduction ratios. After applying the random forest algorithm, 17 distinct features were selected (Figures 3A, B). The 6 updated scientific names that were adopted for 7 of the distinct features were: Bacteroides dorei (accession number: NR_041351.1), Roseburia inulinivorans (accession number: NR_042007.1), Dialister succinatiphilus (accession number: NR_041666.1), Prevotella copri DSM 18205 (accession number: NR_113411.1), Butyricimonas virosa (accession number: NR_041691.1) and Mitsuokella multacida (accession number: NR_027596.1). Among the 17 distinct features, we identified 9 species, 6 genera, 1 family (Ruminococcaceae) and 1 order (Bacteroidales) of taxonomy levels. The 4 distinct features in positive correlation with HbA1c reduction were defined as positive microbial signatures, whereas the 13 distinct features in negative correlation were defined as negative microbial signatures in GLP-1 RA treatment of T2D patients. The area under the receiver-operating characteristic curve (AUROC) of this microbiota-based classification was 0.96 (Figure 3C). In addition, the discrimination of traditional predictors including baseline HbA1c and C-peptide concentrations were also evaluated (AUROC were 0.71 and 0.66, respectively). Therefore, the significance of the distinct 17 microbial signatures to indicate a GLP-1 RA glycemic responder or non-responder was demonstrated.
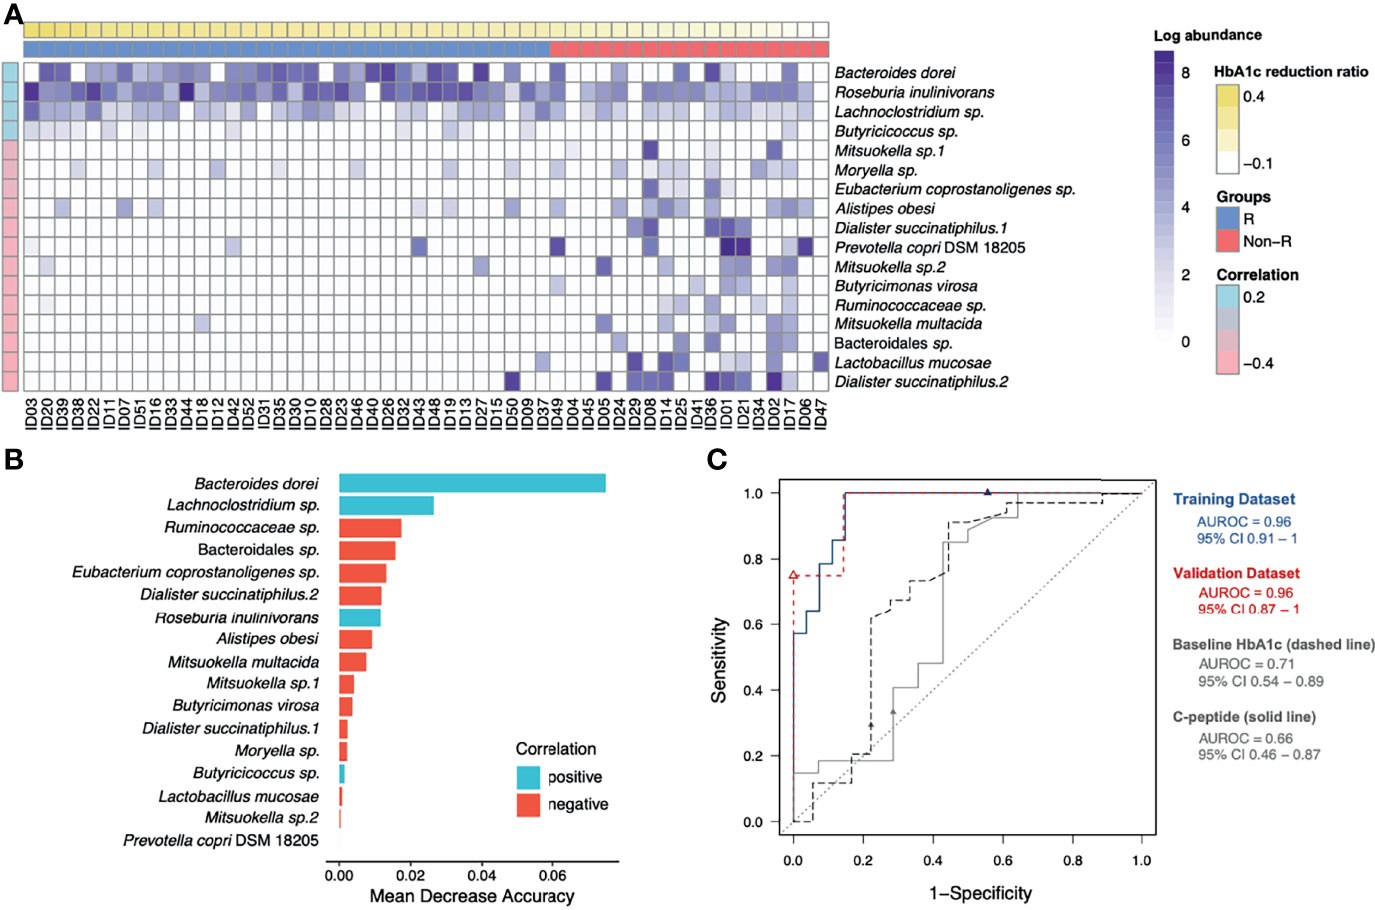
Figure 3 Identification of glycemic response-associated microbial signatures for GLP-1 RA treatment. (A) Based on the heatmap, the log-transformed abundance of 17 microbial features were significantly correlated with blood glucose reductions. Samples are in a sequence of the HbA1c reduction levels across the x-axis and 17 microbial features are in a sequence of their correlation coefficient values (P < 0.05, Pearson’s correlation) in the y-axis. Purple grading in a cell represents the log-transformed abundance of the microbial feature. Responders (R) and non-responders (Non-R) are colored in blue and red, respectively. (B) The selected 17 distinct features were plotted by their mean decrease accuracy scores, based on random forest model. The higher the value of mean decrease accuracy score was, the higher importance of the microbial features in the model ranked. (C) The ROC curves illustrate the diagnostic ability of the microbial signatures, baseline HbA1c and C-peptide (areas under the ROC curves equal to 0.96, 0.71 and 0.66, respectively). HbA1c, glycohemoglobin; ROC, receiver-operating characteristic.
Prediction Models of GLP-1 RA Glycemic Responses
A linear regression model of HbA1c reduction was built with the 17 microbial signatures (Model 1) (Table 2). Five ASVs (Eubacterium coprostanoligenes sp., Dialister succinatiphilus.1, Mitsuokella sp.2, Ruminococcaceae sp., and Dialister succinatiphilus.2) were excluded due to high degrees of collinearity. This model was further adjusted with important clinical variables including baseline HbA1c concentration, UACR, total cholesterol and C-peptide (Model 2). Triglyceride concentration, dulaglutide or liraglutide user and concurrent use of insulin were excluded due to high degrees of collinearity. Model 2 revealed that Bacteroides dorei, Lachnoclostridium sp., Mitsuokella multacida in gut microbiota and baseline of HbA1c in patients were significant indicators for reductions in HbA1c in T2D patients treated with GLP-1 RA.
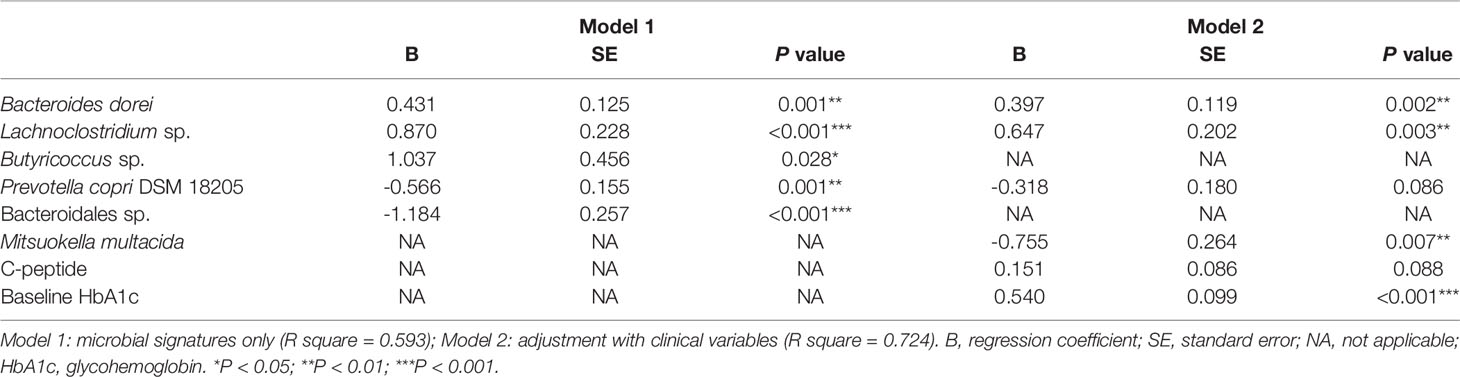
Table 2 Prediction of HbA1c reductions in type 2 diabetic patients receiving GLP-1 RA.
Finally, relationships among the 17 microbial signatures were plotted in a network (Figure 4). Positive microbial signatures had close and positive interactions, whereas negative microbial signatures had relatively loose connections in small clusters. In conclusion, by adjusting for confounding effects of baseline HbA1c and β-cell function, Bacteroides dorei and Lachnoclostridium sp. served as representative positive signatures for GLP-1 RA glycemic responses, whereas Mitsuokella multacida served as a negative signature.
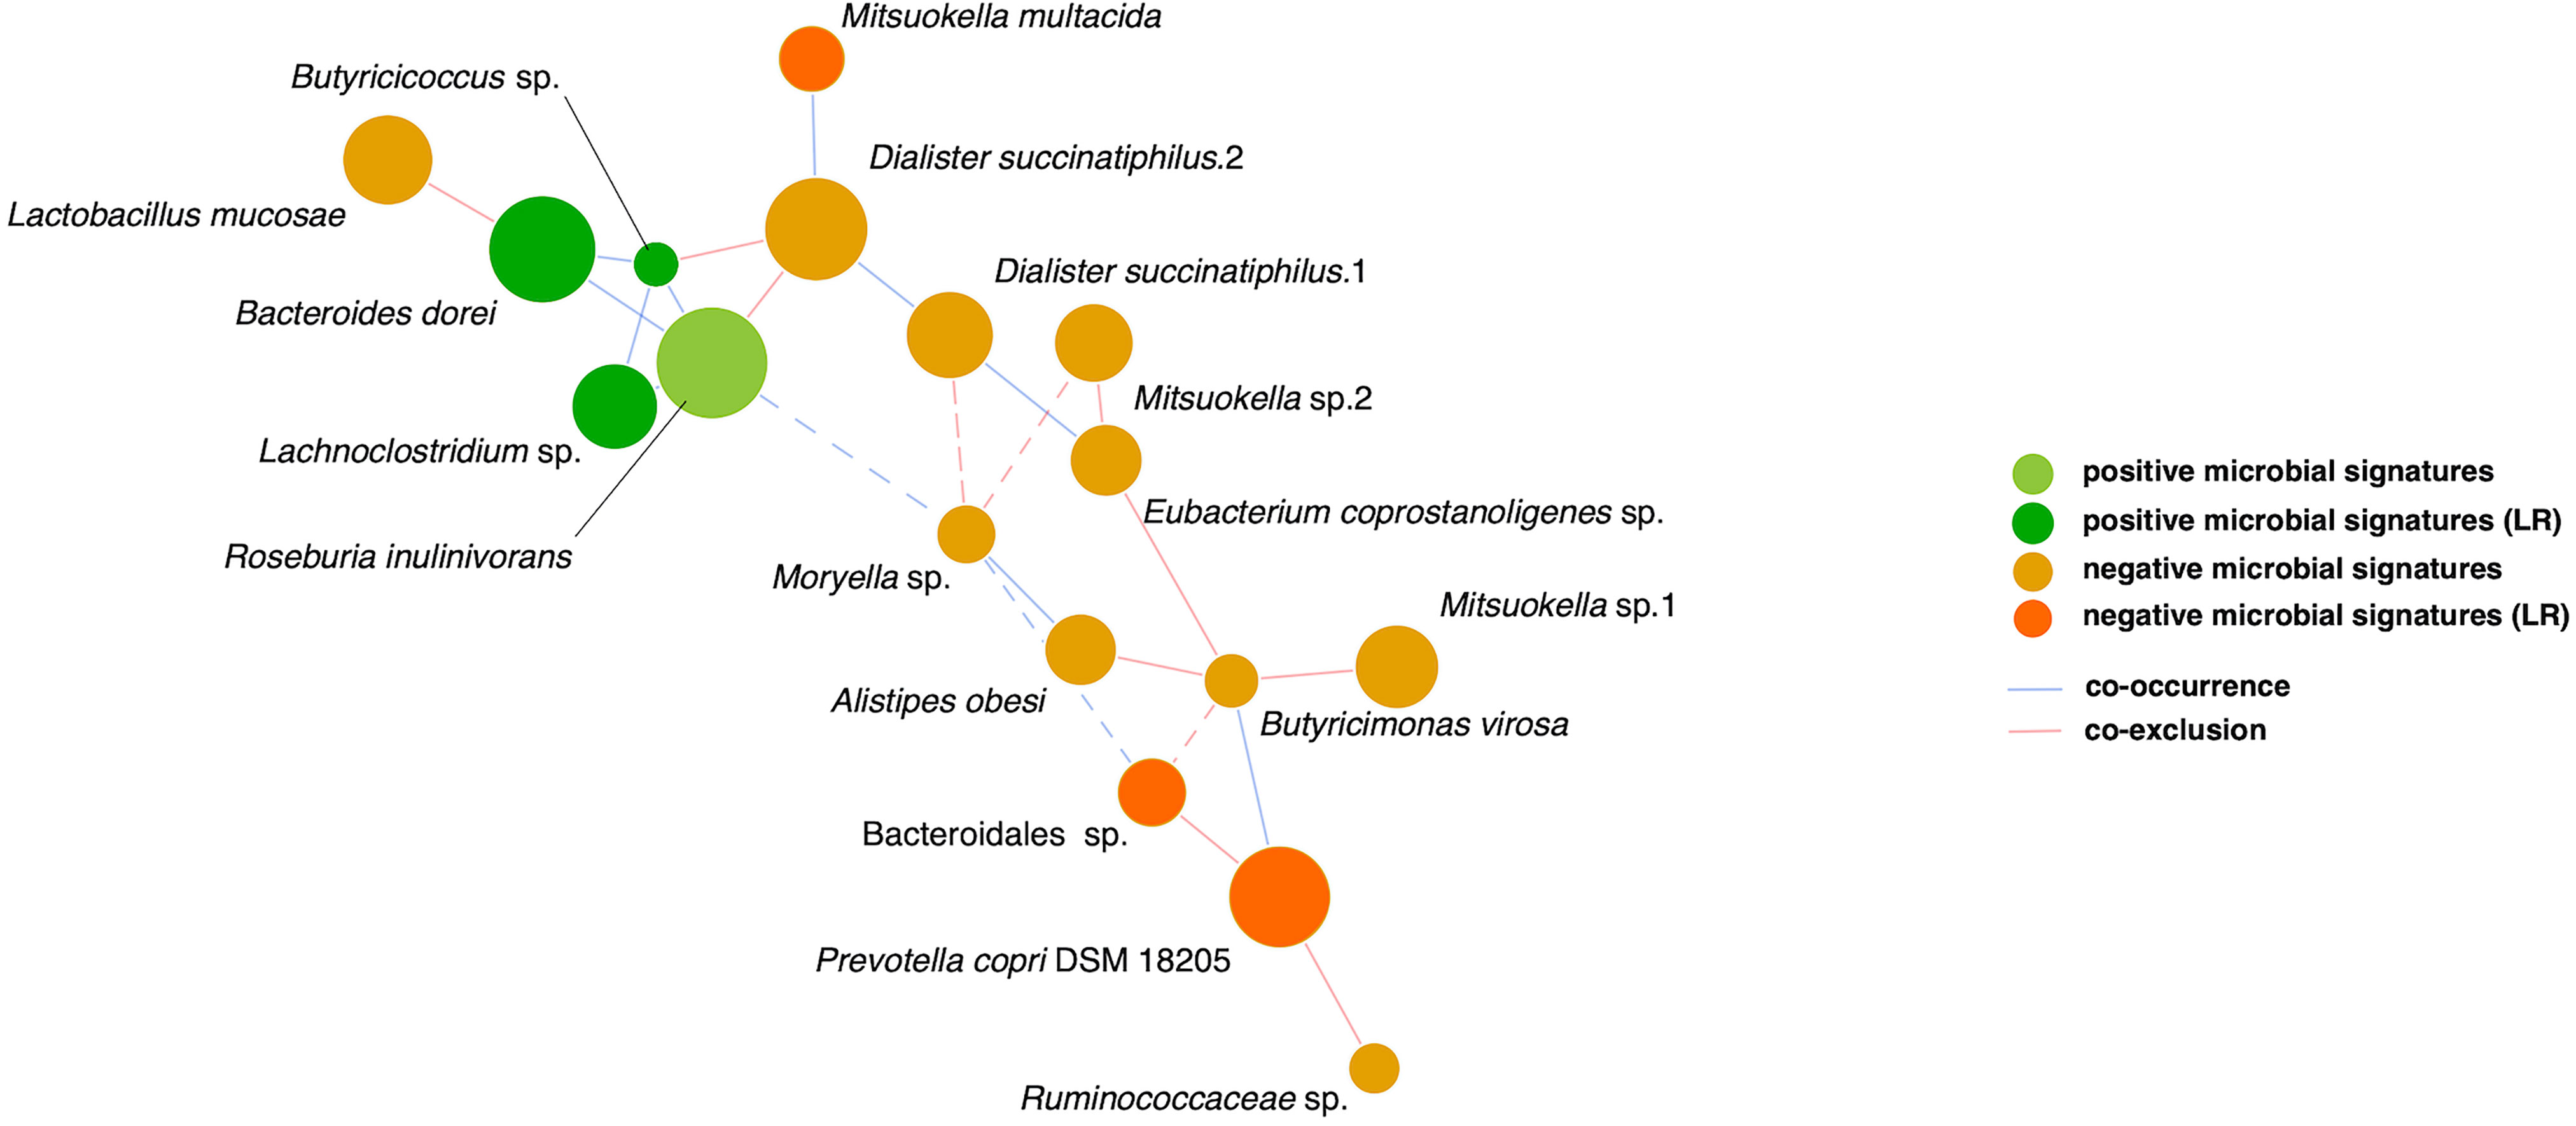
Figure 4 SparCC network of glycemic response-associated microbial signatures for GLP-1 RA treatment. The 17 distinct features with either positive correlation (green nodes) or negative correlation (orange nodes) to blood glucose reduction show co-occurrence (blue edges) or co-exclusion (red edges) between others in relationships. The 6 features remained in linear regression (LR) models are shown as deep color nodes. The size of a node is directly correlated to the respective abundance of microbial feature. The magnitude of the correlation is expressed as the inverse length of the respective edge. An absolute correlation magnitude < 0.2 (SparCC correlation) is presented in dotted edges.
Discussion
The gut microbiota was investigated in a cohort of T2D patients with poor glycemic control, features of diabesity, and at risk for cardiovascular diseases. Participants were regarded as a population that would benefit from GLP-1 RA therapy; nevertheless, glycemic responses to treatment were heterogeneous. Beta diversity in gut microbiota significantly differed between GLP-1 RA responders and non-responders. The top 17 microbial signatures correlated to HbA1c reductions in T2D patients treated with GLP-1 RA were identified and Bacteroides dorei, Lachnoclostridium sp., Mitsuokella multacida and Prevotella copri were all still remarkable after adjustment with clinical variables by linear regression model. This was apparently the first study characterizing impacts of gut microbiota composition on treatment efficacy of GLP-1 RA.
To analyze gut microbiota in our T2D cases with mild to moderate gut microbial dysbiosis, Bacteroidetes and Firmicutes were the dominant phyla, similar to healthy populations (41). The Firmicutes/Bacteroidetes ratio and alpha diversity were not associated with drug responsiveness in our T2D patients. These macro-metric tools often failed to differentiate T2D from healthy controls, perhaps due to the population heterogenicity of diabesity (35). The BMI of our cohort was overweight in both responders and non-responders. Nonetheless, microbial compositions had significantly different beta diversity, according to drug responsiveness. As a prominent genus within the Bacteroidetes phylum, Bacteroides has an important role in maintaining a healthy gut ecosystem (42) and in this study, relative abundance of Bacteroides was higher in GLP-1 RA responders. Conversely, a decrease of genera Bacteroides was a major observation associated with T2D (18). We inferred that a GLP-1 RA non-responder with lower relative Bacteroides abundance may indicate microbial dysbiosis.
Bacteroides dorei and Roseburia inulinivorans, the 2 identified positive microbial signatures at a species level, may cause immunomodulation (43, 44). Bacteroides dorei upregulated expression of tight junction genes in the colon and reduced microbial lipopolysaccharide production, thereby reducing gut permeability, and ameliorating endotoxemia (45). In contrast to healthy controls, there was a lower abundance of Bacteroides dorei in patients with coronary artery diseases (46). Roseburia inulinivorans had butyrate-producing and anti-inflammatory properties. Butyrate may modulate host energy expenditure by activating expression of peptide YY and GLP-1 in colonic epithelial cells (43). Roseburia inulinivorans has also been reported as a biomarker to discriminate healthy people from pulmonary tuberculosis patients and to predict remission of inflammatory bowel diseases (47, 48). In addition, Bacteroides, Roseburia and Butyricicoccus were reported as genera negatively associated with obesity and dyslipidemia (49). These findings were consistent with positive roles of Bacteroides dorei, Roseburia inulinivorans and Butyricicoccus sp. in GLP-1 RA treatment of T2D patients in our study.
The genus Prevotella is usually negatively correlated to genus Bacteroides within the Bacteroidetes phylum (42). Prevotella copri induces insulin resistance by augmenting circulating concentrations of branched-chain amino acids (50). The abundance of Prevotella copri was positively correlated to blood concentrations of interferon gamma and lipopolysaccharide in T2D patients (51). Interestingly, Mitsuokella was reported in association with dental infections (52). In a recent large cross-sectional analysis, both genera Prevotella and Mitsuokella were reported as trimethylamine-producing bacteria taxa (53). Trimethylamine N-oxide is closely linked to cardiometabolic diseases, including atherosclerosis and T2D (54). Therefore, Prevotella copri and Mitsuokella may be related to pathogenesis of T2D and its complications.
Some of the negative microbial signatures for GLP-1 RA treatment in T2D patients might be related to diseases. Four of six species of the Dialister genus were isolated from oral cavities, nasopharyngeal secretions and clinical samples and associated with dental infections or gastric carcinogenesis (55). Dialister succinatiphilusis was the first species isolated from human feces, but the clinical significance remains unclear (56). The Alistipes genus is isolated primarily from clinical samples and may be relevant to inflammation and cancer (57). Alistipes obesi was isolated from the fecal microbiota of an obese French patient (58). Butyricimonas virosa has caused bacteremia (59), the Moryella genus may be a biomarker for cervical intraepithelial lesions (60), and Dialister, Alistipes, Butyricimonas virosa and Moryella shared common features of pro-inflammatory or neoplastic diseases.
The increased relative abundance of Bacteroides dorei and Roseburia inulinivorans may indicate a lower inflammatory status of GLP-1 RA responders. Fermentation of indigestible polysaccharides by Roseburia may augment endogenous GLP-1 secretions that promote an incretin effect, and responders might harbor a favorable environment for GLP-1 action. Conversely, Prevotella copri, Butyricimonas virosa, Mitsuokella, Dialister, Alistipes or Moryella may indicate a profound inflammatory status of non-responders. The microbiota composition directly reflects human host health and determines therapeutic efficiency. GLP-1 RA modulates enteric immune responses as well as gut microbiota in murine models (61). Although humans have more heterogeneous microbial biodiversity, we inferred that the beneficial effects of GLP-1 action may have been obscured in non-responders due to profound dysbiosis and GLP-1 resistance.
In this study, microbial signatures had potential to serve as biomarkers for GLP-1 RA treatment response. However, there were some important limitations: this pilot study was cross-sectional with a limited scale and clinical confounders were not perfectly controlled. The early prescription of GLP-1 RA was restricted by regulations of National Health Insurance in Taiwan, probably due to the high medical cost. Thus, a small number of cases were enrolled in this study. Mean serum triglyceride concentration of responders was affected by outliers in thousand-level. Users of dulaglutide and liraglutide were analyzed together because the two agents had similarity in clinical indication and efficacy, and both were available for participants to choose. Nonetheless, clinical characteristics and beta diversity were different between the two subgroups (Supplementary Table 1, Supplementary Figure 2). Dulaglutide users were mostly injection-naïve, whereas nearly all liraglutide users had used insulin therapy before initiation of GLP-1 RA. Autoinjector pen or weekly injection might be more preferred for an injection-naïve patient during a process of shared decision making. Dulaglutide users had less severity in T2D, better glycemic responses, and lower abundances in some negative microbial signatures (Supplementary Figure 3). In addition, paired stool samples were collected in another cohort study to investigate the associations of GLP-1 RA effects and change of microbiota composition. Preliminary analysis detected no difference in beta diversity between baseline versus post-treatment (Supplementary Figure 4) and distinct microbial features between two drug users (Supplementary Figure 5), but more data are needed for further interpretation. Because metformin is known for modulating effects on microbiota, an analysis with exclusion of non-metformin users was performed. Most of the distinct microbial features could still be identified in top 17 rankings (Supplementary Figure 6). Besides, 16S amplicon rRNA sequencing for bacterial identification has detection limitations at species or strain levels and some key microbial features remained unclassified. Furthermore, gut microbiota may differ across ethnicity and habitat, making our results unreliable in every population. Nonetheless, gut microbial signatures for functional phenotyping in T2D patients has merit. Further prospective trials with shot-gun sequencing should be done.
In summary, gut microbiota was closely related to pathophysiology of T2D and GLP-1 resistance in this pilot study. Microbial compositions of T2D patients were heterogeneous among individuals. The HbA1c reduction following GLP-1 RA treatment was related to the gradient of the gut microbial dysbiosis, as confirmed in our study. The positive microbial signatures with immunomodulation effects were dominant in responders, whereas negative microbial signatures with pro-inflammatory properties were dominant in non-responders. Gut microbial signatures may not only predict GLP-1 RA efficacy but also reflect severity of T2D. Therefore, T2D management should emphasize promotion and maintenance of gut health.
Data Availability Statement
The data sets presented in this study can be found in online repositories. The names of the repository/repositories and accession number(s) can be found below: https://www.ncbi.nlm.nih.gov/, PRJNA778609.
Ethics Statement
The studies involving human participants were reviewed and approved by the institutional review board of Chang Gung Memorial Hospital. The patients/participants provided their written informed consent to participate in this study.
Author Contributions
C-YT, C-HL, and C-NT designed the study. C-YT and C-HL enrolled participants. C-YT and Y-HC collected data. C-YT and H-CL processed/researched the data and wrote the manuscript. Y-HC performed DNA extraction. P-YL assisted data research. H-YC organized food frequency questionnaire interviews. M-CH designed the food frequency questionnaire and conducted nutrients transformation. Y-HC, P-YL, H-YC, M-CH, C-HL, and C-NT contributed to discussion. C-HL and C-N.T supervised the study and reviewed/edited the manuscript. All authors contributed to the article and approved the submitted version.
Funding
This work was supported by grants from the Chang Gung Memorial Hospital (CMRPG3J1021, CMRPG3K1171) awarded to C-YT.
Conflict of Interest
The authors declare that the research was conducted in the absence of any commercial or financial relationships that could be construed as a potential conflict of interest.
Publisher’s Note
All claims expressed in this article are solely those of the authors and do not necessarily represent those of their affiliated organizations, or those of the publisher, the editors and the reviewers. Any product that may be evaluated in this article, or claim that may be made by its manufacturer, is not guaranteed or endorsed by the publisher.
Acknowledgments
The authors thank all members of the Genomic Medicine Core Laboratory, Chang Gung Memorial Hospital, Linkou, for their invaluable help. The authors also acknowledge Professor Hon-Tsen Yu, PhD (Department of Life Science, College of Life Science, National Taiwan University, Taipei, Taiwan) for providing kind support and great cooperation. The authors thank Chih-Yi Li, Hsin-Yi Liu, Pei-Yu Lai, Wan-Ting Hsiao, and Yi-Ching Wang, the dietitians of Department of Medical Nutrition Therapy, Chang Gung Memorial Hospital, Linkou, for their help and expertise in food frequency questionnaire interviews. C-YT thanks Yu-Yao Huang, MD, PhD for valuable suggestions during manuscript writing.
Supplementary Material
The Supplementary Material for this article can be found online at: https://www.frontiersin.org/articles/10.3389/fendo.2021.814770/full#supplementary-material
References
1. Williams R, Karuranga S, Malanda B, Saeedi P, Basit A, Besancon S, et al. Global and Regional Estimates and Projections of Diabetes-Related Health Expenditure: Results From the International Diabetes Federation Diabetes Atlas, 9th Edition. Diabetes Res Clin Pract (2020) 162:108072. doi: 10.1016/j.diabres.2020.108072
2. Rawshani A, Rawshani A, Franzen S, Sattar N, Eliasson B, Svensson AM, et al. Risk Factors, Mortality, and Cardiovascular Outcomes in Patients With Type 2 Diabetes. N Engl J Med (2018) 379(7):633–44. doi: 10.1056/NEJMoa1800256
3. Drucker DJ. Mechanisms of Action and Therapeutic Application of Glucagon-Like Peptide-1. Cell Metab (2018) 27(4):740–56. doi: 10.1016/j.cmet.2018.03.001
4. Nauck MA, Meier JJ. The Incretin Effect in Healthy Individuals and Those With Type 2 Diabetes: Physiology, Pathophysiology, and Response to Therapeutic Interventions. Lancet Diabetes Endocrinol (2016) 4(6):525–36. doi: 10.1016/S2213-8587(15)00482-9
5. American Diabetes Association. 9. Pharmacologic Approaches to Glycemic Treatment: Standards of Medical Care in Diabetes-2020. Diabetes Care (2020) 43(Suppl 1):S98–S110. doi: 10.2337/dc20-S009
6. Mata-Cases M, Franch-Nadal J, Ortega E, Real J, Gratacos M, Vlacho B, et al. Glucagon-Like Peptide-1 Receptor Agonists in Patients With Type 2 Diabetes:Real-World Evidence From a Mediterranean Area. Curr Med Res Opin (2019) 35(10):1735–44. doi: 10.1080/03007995.2019.1618806
7. Simioni N, Berra C, Boemi M, Bossi AC, Candido R, Di Cianni G, et al. Predictors of Treatment Response to Liraglutide in Type 2 Diabetes in a Real-World Setting. Acta Diabetol (2018) 55(6):557–68. doi: 10.1007/s00592-018-1124-0
8. Wysham CH, Pilon D, Ingham M, Lafeuille MH, Emond B, Kamstra R, et al. HbA1c Control and Cost-Effectiveness in Patients With Type 2 Diabetes Mellitus Initiated on Canagliflozin or a Glucagon-Like Peptide 1 Receptor Agonist in a Real-World Setting. Endocr Pract (2018) 24(3):273–87. doi: 10.4158/EP-2017-0066
9. Herzberg-Schafer S, Heni M, Stefan N, Haring HU, Fritsche A. Impairment of GLP1-Induced Insulin Secretion: Role of Genetic Background, Insulin Resistance and Hyperglycaemia. Diabetes Obes Metab (2012) 14 Suppl 3:85–90. doi: 10.1111/j.1463-1326.2012.01648.x
10. Jones AG, McDonald TJ, Shields BM, Hill AV, Hyde CJ, Knight BA, et al. Markers of Beta-Cell Failure Predict Poor Glycemic Response to GLP-1 Receptor Agonist Therapy in Type 2 Diabetes. Diabetes Care (2016) 39(2):250–7. doi: 10.2337/dc15-0258
11. Lapolla A, Frison V, Bettio M, Dal Pos M, Rocchini P, Panebianco G, et al. Correlation Between Baseline Characteristics and Clinical Outcomes in a Large Population of Diabetes Patients Treated With Liraglutide in a Real-World Setting in Italy. Clin Ther (2015) 37(3):574–84. doi: 10.1016/j.clinthera.2014.11.015
12. Qin J, Li Y, Cai Z, Li S, Zhu J, Zhang F, et al. A Metagenome-Wide Association Study of Gut Microbiota in Type 2 Diabetes. Nature (2012) 490(7418):55–60. doi: 10.1038/nature11450
13. Jin C, Henao-Mejia J, Flavell RA. Innate Immune Receptors: Key Regulators of Metabolic Disease Progression. Cell Metab (2013) 17(6):873–82. doi: 10.1016/j.cmet.2013.05.011
14. Elbere I, Silamikelis I, Dindune II, Kalnina I, Ustinova M, Zaharenko L, et al. Baseline Gut Microbiome Composition Predicts Metformin Therapy Short-Term Efficacy in Newly Diagnosed Type 2 Diabetes Patients. PLoS One (2020) 15(10):e0241338. doi: 10.1371/journal.pone.0241338
15. Zhao L, Chen Y, Xia F, Abudukerimu B, Zhang W, Guo Y, et al. A Glucagon-Like Peptide-1 Receptor Agonist Lowers Weight by Modulating the Structure of Gut Microbiota. Front Endocrinol (2018) 9:233. doi: 10.3389/fendo.2018.00233
16. Madsen MSA, Holm JB, Palleja A, Wismann P, Fabricius K, Rigbolt K, et al. Metabolic and Gut Microbiome Changes Following GLP-1 or Dual GLP-1/GLP-2 Receptor Agonist Treatment in Diet-Induced Obese Mice. Sci Rep (2019) 9(1):15582. doi: 10.1038/s41598-019-52103-x
17. Grasset E, Puel A, Charpentier J, Collet X, Christensen JE, Terce F, et al. A Specific Gut Microbiota Dysbiosis of Type 2 Diabetic Mice Induces GLP-1 Resistance Through an Enteric NO-Dependent and Gut-Brain Axis Mechanism. Cell Metab (2017) 25(5):1075–90.e5. doi: 10.1016/j.cmet.2017.04.013
18. He Y, Wu W, Zheng H-M, Li P, McDonald D, Sheng H-F, et al. Regional Variation Limits Applications of Healthy Gut Microbiome Reference Ranges and Disease Models. Nat Med (2018) 24(10):1532–5. doi: 10.1038/s41591-018-0164-x
19. Wang Z, Saha S, Van Horn S, Thomas E, Traini C, Sathe G, et al. Gut Microbiome Differences Between Metformin- and Liraglutide-Treated T2DM Subjects. Endocrinol Diabetes Metab (2018) 1(1):e00009. doi: 10.1002/edm2.9
20. Shang J, Liu F, Zhang B, Dong K, Lu M, Jiang R, et al. Liraglutide-Induced Structural Modulation of the Gut Microbiota in Patients With Type 2 Diabetes Mellitus. PeerJ (2021) 9:e11128. doi: 10.7717/peerj.11128
21. Huang MC, Lin KD, Chen HJ, Wu YJ, Chang CI, Shin SJ, et al. Validity of a Short Food Frequency Questionnaire Assessing Macronutrient and Fiber Intakes in Patients of Han Chinese Descent With Type 2 Diabetes. Int J Environ Res Public Health (2018) 15(6):1142. doi: 10.3390/ijerph15061142
22. Zinman B, Nauck MA, Bosch-Traberg H, Frimer-Larsen H, Orsted DD, Buse JB, et al. Liraglutide and Glycaemic Outcomes in the LEADER Trial. Diabetes Ther (2018) 9(6):2383–92. doi: 10.1007/s13300-018-0524-z
23. Gallwitz B, Dagogo-Jack S, Thieu V, Garcia-Perez LE, Pavo I, Yu M, et al. Effect of Once-Weekly Dulaglutide on Glycated Haemoglobin (HbA1c) and Fasting Blood Glucose in Patient Subpopulations by Gender, Duration of Diabetes and Baseline HbA1c. Diabetes Obes Metab (2018) 20(2):409–18. doi: 10.1111/dom.13086
24. Chang KC, Shao SC, Kuo S, Yang CY, Chen HY, Chan YY, et al. Comparative Effectiveness of Dulaglutide Versus Liraglutide in Asian Type 2 Diabetes Patients: A Multi-Institutional Cohort Study and Meta-Analysis. Cardiovasc Diabetol (2020) 19(1):172. doi: 10.1186/s12933-020-01148-8
25. Illumina. 16S Metagenomic Sequencing Library Preparation (2013). Available at: https://support.illumina.com/downloads/16s_metagenomic_sequencing_library_preparation.html (Accessed March 9, 2021).
26. Bolyen E, Rideout JR, Dillon MR, Bokulich NA, Abnet CC, Al-Ghalith GA, et al. Reproducible, Interactive, Scalable and Extensible Microbiome Data Science Using QIIME 2. Nat Biotechnol (2019) 37(8):852–7. doi: 10.1038/s41587-019-0209-9
27. Comeau AM, Douglas GM, Langille MG. Microbiome Helper: A Custom and Streamlined Workflow for Microbiome Research. mSystems (2017) 2(1):e00127–16. doi: 10.1128/mSystems.00127-16
28. Martin M. Cutadapt Removes Adapter Sequences From High-Throughput Sequencing Reads. 2011. EMBnet J (2011) 17(1):3. doi: 10.14806/ej.17.1.200
29. Yarza P, Yilmaz P, Pruesse E, Glöckner FO, Ludwig W, Schleifer KH, et al. Uniting the Classification of Cultured and Uncultured Bacteria and Archaea Using 16S rRNA Gene Sequences. Nat Rev Microbiol (2014) 12(9):635–45. doi: 10.1038/nrmicro3330
30. Bokulich NA, Kaehler BD, Rideout JR, Dillon M, Bolyen E, Knight R, et al. Optimizing Taxonomic Classification of Marker-Gene Amplicon Sequences With QIIME 2’s Q2-Feature-Classifier Plugin. Microbiome (2018) 6(1):90. doi: 10.1186/s40168-018-0470-z
31. Team RC. R: A Language and Environment for Statistical Computing. Vienna, Austria: R Foundation for Statistical Computing (2015).
32. Oksanen J, Blanchet FG, Friendly M, Kindt R, Legendre P, McGlinn D, et al. Vegan: Community Ecology Package. R Package Version 2. (2020). p. 5–7. Available at: https://cran.r-project.org/web/packages/vegan/index.html.
33. Anderson MJ. A New Method for non-Parametric Multivariate Analysis of Variance. Austral Ecol (2001) 26(1):32–46. doi: 10.1111/j.1442-9993.2001.01070.pp.x
34. Magne F, Gotteland M, Gauthier L, Zazueta A, Pesoa S, Navarrete P, et al. The Firmicutes/Bacteroidetes Ratio: A Relevant Marker of Gut Dysbiosis in Obese Patients? Nutrients (2020) 12(5):1474. doi: 10.3390/nu12051474
35. Gurung M, Li Z, You H, Rodrigues R, Jump DB, Morgun A, et al. Role of Gut Microbiota in Type 2 Diabetes Pathophysiology. EBioMedicine (2020) 51:102590. doi: 10.1016/j.ebiom.2019.11.051
36. Camacho C, Coulouris G, Avagyan V, Ma N, Papadopoulos J, Bealer K, et al. BLAST+: Architecture and Applications. BMC Bioinf (2009) 10:421. doi: 10.1186/1471-2105-10-421
37. Kurtz ZD, Müller CL, Miraldi ER, Littman DR, Blaser MJ, Bonneau RA. Sparse and Compositionally Robust Inference of Microbial Ecological Networks. PLoS Comput Biol (2015) 11(5):e1004226. doi: 10.1371/journal.pcbi.1004226
38. Csardi G, Nepusz T. The Igraph Software Package for Complex Network Research. InterJournal (2006) Complex Systems:1965.
39. Friedman J, Alm EJ. Inferring Correlation Networks From Genomic Survey Data. PLoS Comput Biol (2012) 8(9):e1002687. doi: 10.1371/journal.pcbi.1002687
41. Larsen N, Vogensen FK, van den Berg FW, Nielsen DS, Andreasen AS, Pedersen BK, et al. Gut Microbiota in Human Adults With Type 2 Diabetes Differs From non-Diabetic Adults. PLoS One (2010) 5(2):e9085. doi: 10.1371/journal.pone.0009085
42. Wexler AG, Goodman AL. An Insider’s Perspective: Bacteroides as a Window Into the Microbiome. Nat Microbiol (2017) 2:17026. doi: 10.1038/nmicrobiol.2017.26
43. Tamanai-Shacoori Z, Smida I, Bousarghin L, Loreal O, Meuric V, Fong SB, et al. Roseburia Spp.: A Marker of Health? Future Microbiol (2017) 12:157–70. doi: 10.2217/fmb-2016-0130
44. Di Lorenzo F, Pither MD, Martufi M, Scarinci I, Guzmán-Caldentey J, Łakomiec E, et al. Pairing Bacteroides Vulgatus LPS Structure With its Immunomodulatory Effects on Human Cellular Models. ACS Cent Sci (2020) 6(9):1602–16. doi: 10.1021/acscentsci.0c00791
45. Yoshida N, Emoto T, Yamashita T, Watanabe H, Hayashi T, Tabata T, et al. Bacteroides Vulgatus and Bacteroides Dorei Reduce Gut Microbial Lipopolysaccharide Production and Inhibit Atherosclerosis. Circulation (2018) 138(22):2486–98. doi: 10.1161/CIRCULATIONAHA.118.033714
46. Emoto T, Yamashita T, Kobayashi T, Sasaki N, Hirota Y, Hayashi T, et al. Characterization of Gut Microbiota Profiles in Coronary Artery Disease Patients Using Data Mining Analysis of Terminal Restriction Fragment Length Polymorphism: Gut Microbiota Could be a Diagnostic Marker of Coronary Artery Disease. Heart Vessels (2017) 32(1):39–46. doi: 10.1007/s00380-016-0841-y
47. Hu Y, Feng Y, Wu J, Liu F, Zhang Z, Hao Y, et al. The Gut Microbiome Signatures Discriminate Healthy From Pulmonary Tuberculosis Patients. Front Cell Infect Microbiol (2019) 9:90. doi: 10.3389/fcimb.2019.00090
48. Ananthakrishnan AN, Luo C, Yajnik V, Khalili H, Garber JJ, Stevens BW, et al. Gut Microbiome Function Predicts Response to Anti-Integrin Biologic Therapy in Inflammatory Bowel Diseases. Cell Host Microbe (2017) 21(5):603–10.e3. doi: 10.1016/j.chom.2017.04.010
49. Zeng Q, Li D, He Y, Li Y, Yang Z, Zhao X, et al. Discrepant Gut Microbiota Markers for the Classification of Obesity-Related Metabolic Abnormalities. Sci Rep (2019) 9(1):13424. doi: 10.1038/s41598-019-49462-w
50. Pedersen HK, Gudmundsdottir V, Nielsen HB, Hyotylainen T, Nielsen T, Jensen BA, et al. Human Gut Microbes Impact Host Serum Metabolome and Insulin Sensitivity. Nature (2016) 535(7612):376–81. doi: 10.1038/nature18646
51. Leite AZ, Rodrigues NC, Gonzaga MI, Paiolo JCC, de Souza CA, Stefanutto NAV, et al. Detection of Increased Plasma Interleukin-6 Levels and Prevalence of Prevotella Copri and Bacteroides Vulgatus in the Feces of Type 2 Diabetes Patients. Front Immunol (2017) 8:1107. doi: 10.3389/fimmu.2017.01107
52. da Silva ES, Feres M, Figueiredo LC, Shibli JA, Ramiro FS, Faveri M. Microbiological Diversity of Peri-Implantitis Biofilm by Sanger Sequencing. Clin Oral Implants Res (2014) 25(10):1192–9. doi: 10.1111/clr.12231
53. Fu BC, Hullar MAJ, Randolph TW, Franke AA, Monroe KR, Cheng I, et al. Associations of Plasma Trimethylamine N-Oxide, Choline, Carnitine, and Betaine With Inflammatory and Cardiometabolic Risk Biomarkers and the Fecal Microbiome in the Multiethnic Cohort Adiposity Phenotype Study. Am J Clin Nutr (2020) 111(6):1226–34. doi: 10.1093/ajcn/nqaa015
54. Miao J, Ling AV, Manthena PV, Gearing ME, Graham MJ, Crooke RM, et al. Flavin-Containing Monooxygenase 3 as a Potential Player in Diabetes-Associated Atherosclerosis. Nat Commun (2015) 6:6498. doi: 10.1038/ncomms7498
55. Coker OO, Dai Z, Nie Y, Zhao G, Cao L, Nakatsu G, et al. Mucosal Microbiome Dysbiosis in Gastric Carcinogenesis. Gut (2018) 67(6):1024–32. doi: 10.1136/gutjnl-2017-314281
56. Morotomi M, Nagai F, Sakon H, Tanaka R. Dialister Succinatiphilus Sp. Nov. And Barnesiella Intestinihominis Sp. Nov., Isolated From Human Faeces. Int J Syst Evol Microbiol (2008) 58(Pt 12):2716–20. doi: 10.1099/ijs.0.2008/000810-0
57. Parker BJ, Wearsch PA, Veloo ACM, Rodriguez-Palacios A. The Genus Alistipes: Gut Bacteria With Emerging Implications to Inflammation, Cancer, and Mental Health. Front Immunol (2020) 11:906. doi: 10.3389/fimmu.2020.00906
58. Hugon P, Ramasamy D, Lagier JC, Rivet R, Couderc C, Raoult D, et al. Non Contiguous-Finished Genome Sequence and Description of Alistipes Obesi Sp. Nov. Stand Genomic Sci (2013) 7(3):427–39. doi: 10.4056/sigs.3336746
59. Garcia-Agudo L, Nilsen E. Butyricimonas Virosa: A Rare Cause of Bacteremia. Anaerobe (2018) 54:121–3. doi: 10.1016/j.anaerobe.2018.08.001
60. Curty G, Costa RL, Siqueira JD, Meyrelles AI, Machado ES, Soares EA, et al. Analysis of the Cervical Microbiome and Potential Biomarkers From Postpartum HIV-Positive Women Displaying Cervical Intraepithelial Lesions. Sci Rep (2017) 7(1):17364. doi: 10.1038/s41598-017-17351-9
Keywords: gut microbiota, GLP-1 receptor agonists, type 2 diabetes mellitus, glycemic response, dysbiosis, GLP-1 resistance
Citation: Tsai C-Y, Lu H-C, Chou Y-H, Liu P-Y, Chen H-Y, Huang M-C, Lin C-H and Tsai C-N (2022) Gut Microbial Signatures for Glycemic Responses of GLP-1 Receptor Agonists in Type 2 Diabetic Patients: A Pilot Study. Front. Endocrinol. 12:814770. doi: 10.3389/fendo.2021.814770
Received: 14 November 2021; Accepted: 13 December 2021;
Published: 10 January 2022.
Edited by:
Cristina Giaroni, University of Insubria, ItalyReviewed by:
Eliana Piantanida, University of Insubria, ItalyElena Rampanelli, Amsterdam University Medical Center, Netherlands
Copyright © 2022 Tsai, Lu, Chou, Liu, Chen, Huang, Lin and Tsai. This is an open-access article distributed under the terms of the Creative Commons Attribution License (CC BY). The use, distribution or reproduction in other forums is permitted, provided the original author(s) and the copyright owner(s) are credited and that the original publication in this journal is cited, in accordance with accepted academic practice. No use, distribution or reproduction is permitted which does not comply with these terms.
*Correspondence: Chia-Hung Lin, YWRyb25saW5AY2dtaC5vcmcudHc=; Chi-Neu Tsai, cGluazdAY2d1LmVkdS50dw==
†These authors have contributed equally to this work and share first authorship