 Jingzheng Fan
 Yuyan Jiang2
 Qiang Zhang
- 1Department of Geriatrics, Tianjin Medical University General Hospital, Tianjin, China
- 2Department of Nuclear Medicine, Tianjin Medical University General Hospital, Tianjin, China
- 3Institute of Tianjin Geriatrics, Tianjin Medical University General Hospital, Tianjin, China
Background: Bone mineral density (BMD) loss is a major complication of menopause, and this loss is closely associated with Fat mass (FM). The relationship between FM, fat distribution (FD), and BMD in postmenopausal women, however, remains incompletely understood. The present study was thus developed to explore these associations between body fat accumulation, FD, and BMD among non-obese postmenopausal women over the age of 60.
Methods: This was a cross-sectional analysis of 357 healthy postmenopausal women between the ages of 60.2 and 86.7 years. Dual-energy X-ray absorptiometry (DXA) was utilized to measure total and regional BMD as well as fat-related parameters including total FM, android and gynoid fat, body fat percentage (BF%), and total lean mass (LM) for all subjects. The android-to-gynoid fat ratio (AOI) was used to assess FD. Pearson’s correlation testing and multiple regression analyses were used to explore relationships among AOI, LM, FM, and BMD.
Results: Both LM and FM were positively correlated with total and regional BMD in univariate analysis (all P < 0.01), whereas BMD was not significantly associated with AOI in any analyzed site other than the head. Multivariate linear regression models corrected for age, height, and years post-menopause, revealed a sustained independent positive relationship between FM and BMD (standard β range: 0.141 – 0.343, P < 0.01). The relationship between FM and BMD was unaffected by adjustment for LM (standard β range: 0.132 – 0.258, P < 0.01), whereas AOI had an adverse impact on BMD at most analyzed skeletal sites (total body, hip, femoral neck, arm, leg, and head) (standard β range: −0.093 to −0.232, P < 0.05). These findings were unaffected by using BF% in place of FM (standard β range: −0.100 to −0.232, P < 0.05).
Conclusions: In this cohort of non-obese postmenopausal women over the age of 60 from China, total FM was positively associated with BMD, while AOI was negatively correlated with BMD. As such, a combination of proper weight gain and the control of central obesity may benefit the overall bone health of women after menopause.
Introduction
Osteoporosis is a prevalent and often asymptomatic condition that commonly develops in women after menopause, contributing to significant reductions in quality of life over time. The diagnosis of osteoporosis is primarily made through measurements of bone mineral density (BMD) (1), which is in turn closely tied to body composition-related parameters including lean mass (LM) and fat mass (FM) (2). The relative degree to which LM and FM contribute to BMD, however, remains controversial. Some reports have found LM and FM to equally contribute to increases in bone mass among postmenopausal women (3–6). In contrast, other studies have suggested that FM has a significantly more pronounced beneficial impact on BMD relative to LM (7–10), while others have reported the exact opposite finding (11–13).
After menopause, woman commonly exhibit changes in body composition consisting of a reduction in gynoid fat together with an increase in central fat in the android region (14, 15). The android-to-gynoid fat ratio (AOI) has thus been reported to be a valuable indicator of central (visceral) fat accumulation that is correlated with BMD, but studies have yielded inconsistent findings regarding such a relationship (16–20). Shao et al., for example, found central fat accumulation to be negatively correlated with BMD (18), whereas Kapus et al. observed the opposite relationship (19). These contrasting results underscore the complex interplay between FM, fat distribution (FD), and BMD in postmenopausal women.
Most studies to date have either focused primarily on obese individual or have enrolled postmenopausal women without regard for their body weight, whereas few works have been selectively performed on healthy subjects with a body mass index (BMI) within non-obese limits (20–22). There have also been few studies to date exploring the relationships between FM, AOI, and BMD at different skeletal sites among elderly postmenopausal women (7). As such, this study was developed to examine the associations between FM, central FD, and total or regional BMD among non-obese postmenopausal Chinese women over the age of 60.
Methods
Subjects
In total, 357 non-obese (18.5 < BMI < 30 kg/m2) women 60 years of age or older were selected as a random sample from among patients at the Department of Geriatric Health Check-Up Centre, Tianjin Medical University General Hospital between January 2020 and August 2021. Participants were excluded from this study if they exhibited blood diseases, chronic renal diseases, pituitary disorders, thyroid diseases, a history of pathological fractures, known malignancies, rheumatoid arthritis, hypogonadism or were taking medicine with the potential to impact fat, lean mass, or bone metabolism (including calcium, vitamin D, hormone replacement therapy, oral contraceptives, anticonvulsants, diuretics, corticosteroid-containing asthma medications, oral anticoagulants, immunosuppressive drugs, or nonsteroidal ant-inflammatory drugs). None of the participants were heavy drinkers.
The Ethics Committee of the Tianjin Medical University General Hospital study approved the present study. With all subjects having provided written informed consent to participate.
Data Collection
Data collected from patients through self-reported questionnaires and standardized interviews included: age (in years) and years since menopause (YSM). Participants were considered postmenopausal when they reported having experienced amenorrhea for 12 consecutive months.
Standard approaches were used to gather anthropometric data. Standing height (cm) was measured using a stadiometer accurate to within 0.1 cm accuracy, while body weight (kg) was measured using a portable electronic beam scale accurate to within 0.1 kg while participants were wearing only light clothing without shoes. Both parameters were measured twice. BMI was determined as follow: body weight (kg)/height2 (m2).
Body Composition Analyses
FM, LM, body fat percentage (BF%), gynoid fat, android fat, and both total and regional BMD were assessed via whole-body DXA scanning (Software Version enCORE 13.40.038; Lunar Prodigy, GE Healthcare, USA). BF% was calculated as follows: BF%=total FM/total body weight x 100. Gynoid and android regions of interest (ROIs) were determined using the provided software base on the manufacturer’s instructions. The android ROI height was 20% of the distance from the pelvic horizontal cut line to the neck cut line, with the arm cut lines serving as lateral boundaries. The gynoid ROI height was two times that of the android ROI, with the leg cut lines serving as lateral boundaries, and the upper boundary being beneath the pelvic horizontal cut lines by 1.5 times the android ROI height (Figure 1). AOI was calculated by dividing the android FM by the gynoid FM. Regional BMD values were assessed for body regions including the head, ribs, legs, arms, lumbar spine, femoral neck, hip, and trunk. Prior to each measurement, densitometer standardization was performed. The absorptiometry machine was subject to daily quality control analysis. All DXA measurements were performed by a single trained technologist, yielding excellent precision for all measured parameters. The in vivo precision of such DXA-based body composition analyses has been demonstrated in prior reports, with coefficient of variation value of < 2% for all total and regional BMD measurements and < 3% for all body composition analyses. These measures were established using duplicate measures of the study cohort as in prior reports (18).
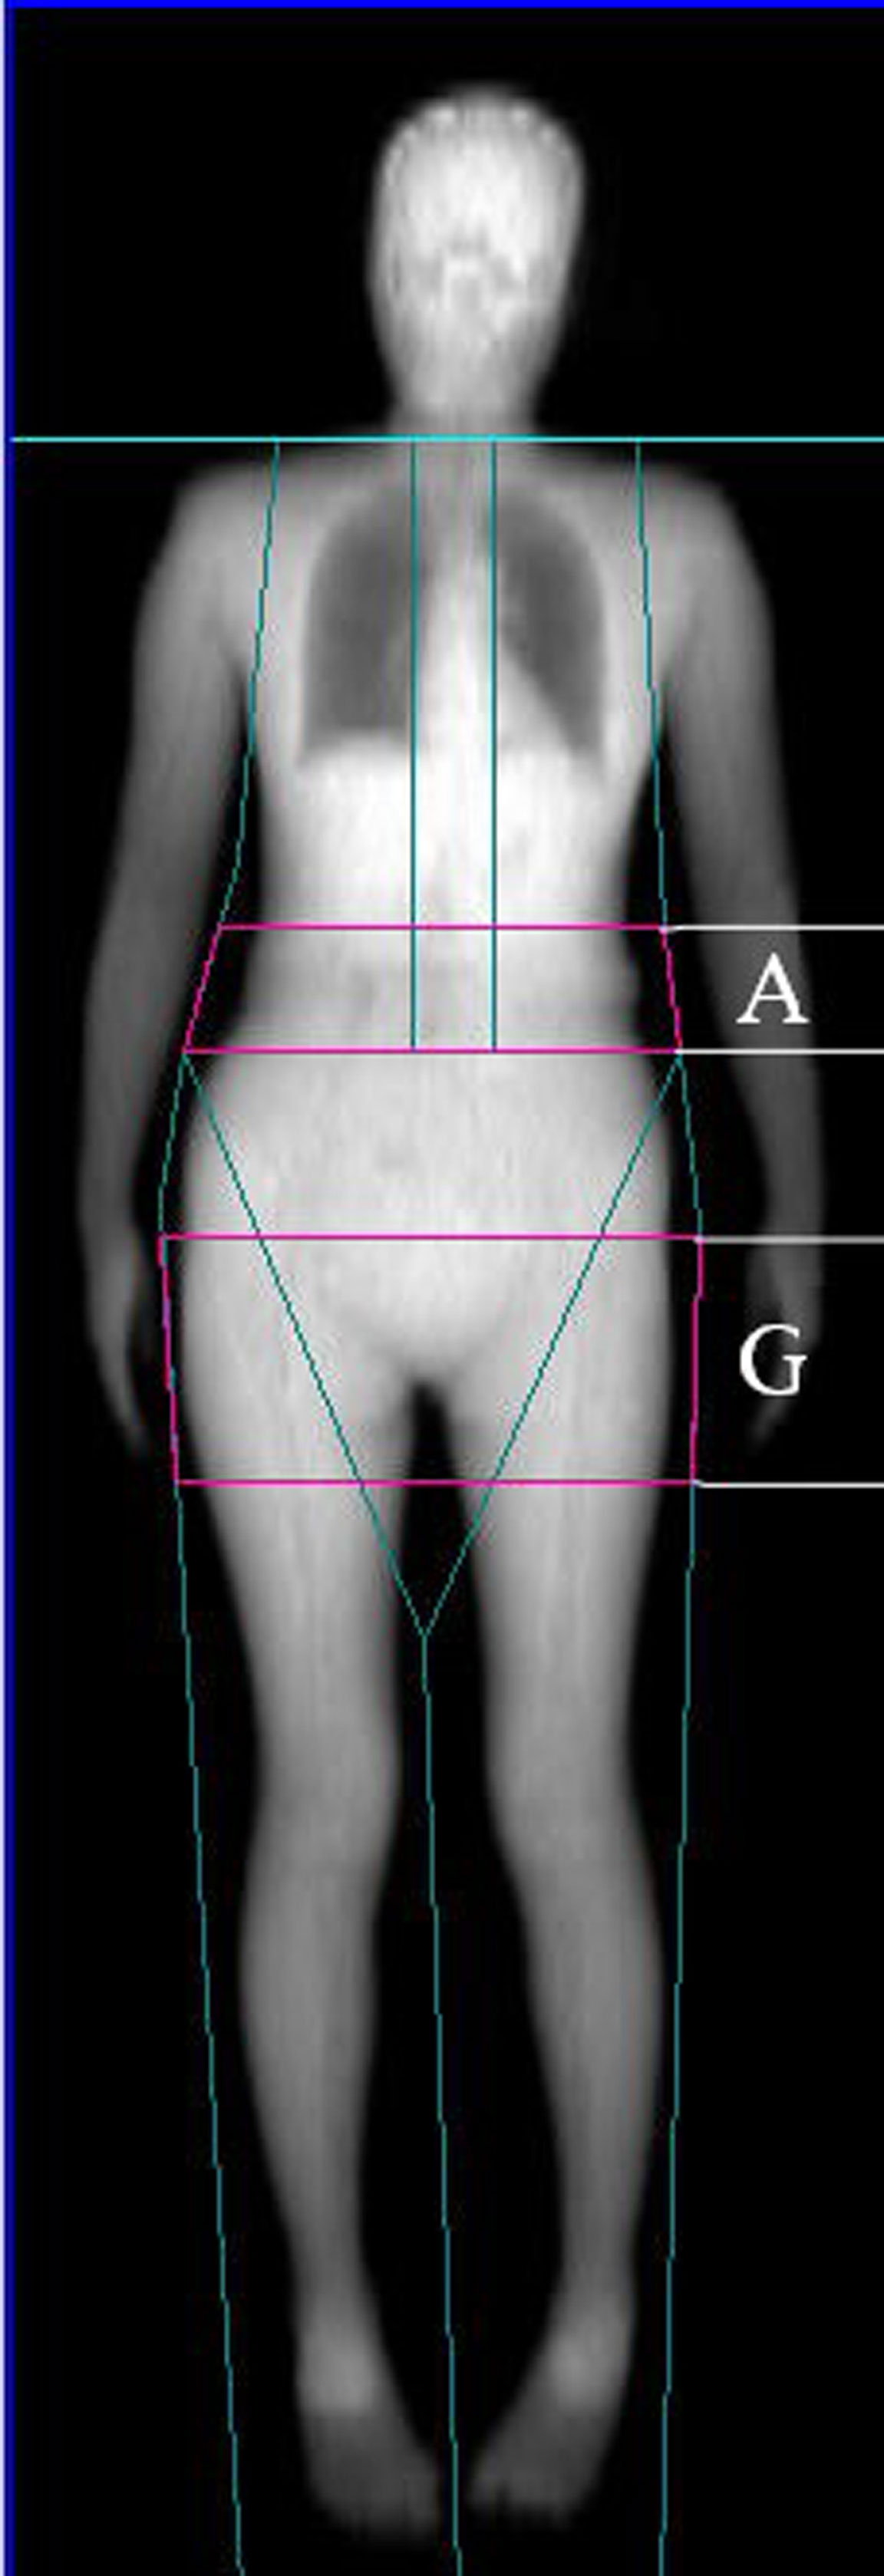
Figure 1 Dual-energy X-ray absorptiometry-based body composition measurement (A: android fat distribution ROI, G: gynoid fat distribution ROI).
Statistical Analysis
The Shapiro-Wilk test was used to assess the normality of data distributions. Continuous data are given as means ± standard deviation (SD). Pearson’s correlation analyses were used to explore relationships among different study variables, while multivariate linear regression models were utilized to evaluate relationships among BMD and AOI, LM, and FM, with age, height, and YSM serving as fixed covariates. In Model 1, the relationships between FM and AOI with total and regional BMD were assessed. Model 2 additionally explored the relationships between LM and total and regional BMD in a model incorporating FM and AOI. These regression analyses were then repeated, with BF% in place of FM. The results of these analyses are given as standardized regression coefficients. P < 0.05 was the threshold of significance, and data were analyzed using SPSS v16 (SPSS Inc., IL, USA).
Results
Descriptive Statistics
In total, 357 healthy, non-obese (BMI: 18.5 – 30) postmenopausal women were enrolled in the present study. Their demographic characteristics, anthropometric parameters, body composition-related findings, and BMD (total and regional) are compiled in Table 1. These participants had an average age of 69.1 years (range: 60.2 – 86.7 years). The mean number of years since menopause for these subjects was 18.6 (range: 6.1 – 38.7 years). The average FM of the overall study cohort was 20.36 kg, accounting for 34.7% of total body weight.
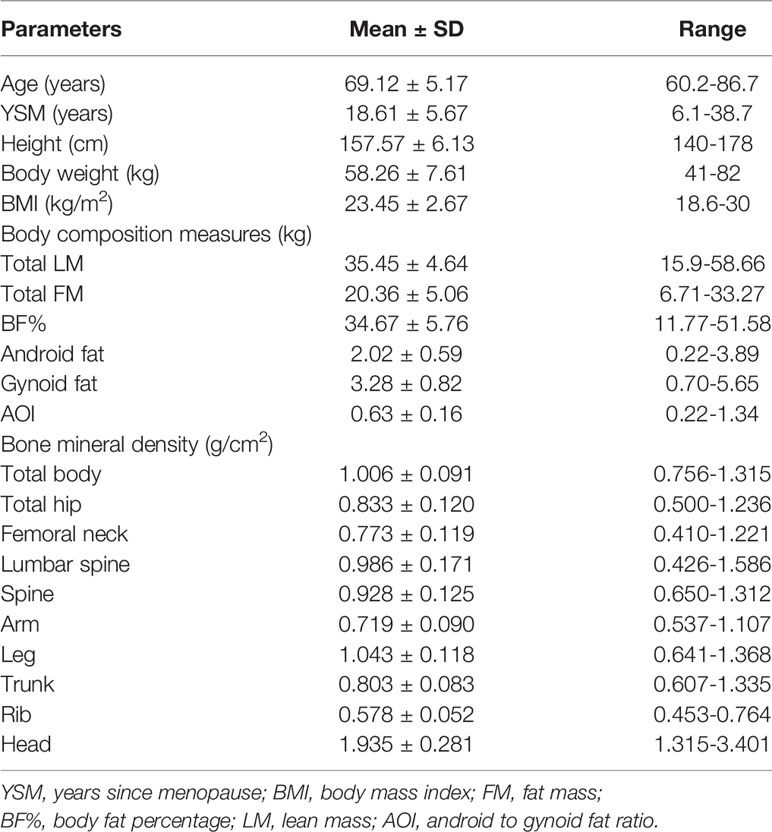
Table 1 Baseline characteristics of subjects.
The Relationships Among Anthropometric, Body Composition, and BMD Parameters
In univariate analyses, higher LM, FM, and BF% were associated with increases in both total and regional BMD (total body, head, ribs, legs, arms, spine, lumbar spine, femoral neck, hips) (r = 0.199–0.499, all P < 0.01). In contrast, AOI was not significantly associated with total or regional BMD among postmenopausal women with the exception of head BMD (r = −0.140, P < 0.01). Both increased age and YSM were significantly negatively correlated with total and regional BMD values (all P < 0.05; Table 2). In contrast, height, body weight, and BMI were positively correlated with total and regional BMD values (all P < 0.05).
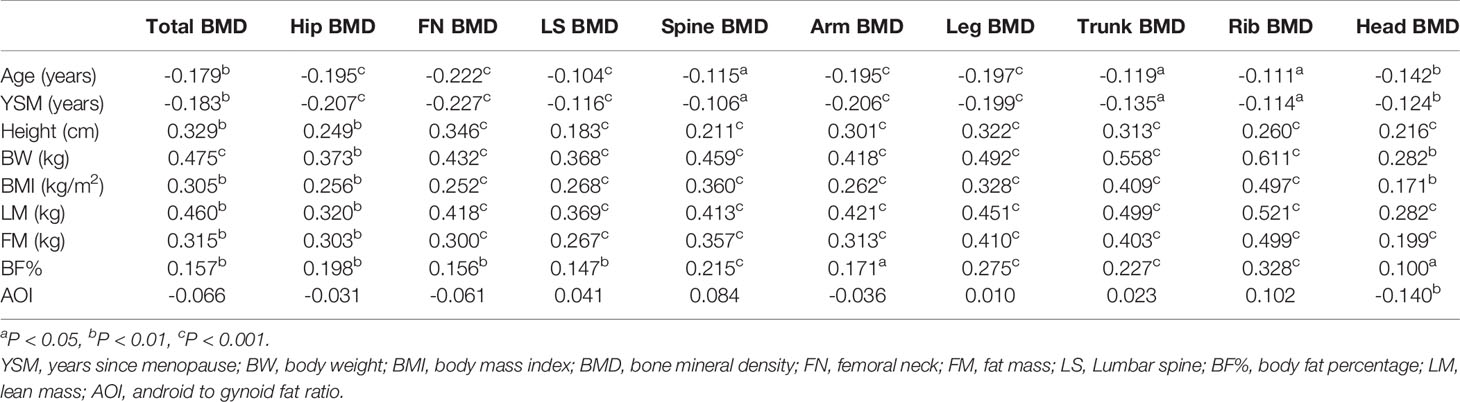
Table 2 Correlations between subject characteristics, body composition and total body. and regional BMD measurements.
Correlations between anthropometrics parameters and soft tissue-related variables are compiled in Table 3. These analyses revealed LM and FM to be positively correlated with the height, body weight, and BMI of postmenopausal women (all P < 0.001). While AOI was positively correlated with BMI and body weight, it was negatively correlated with height in this study cohort (all P < 0.05). BF% was positively associated with both body weight and BMI (all P < 0.001). Age or YSM were not correlated with FM, LM, AOI, or BF%.
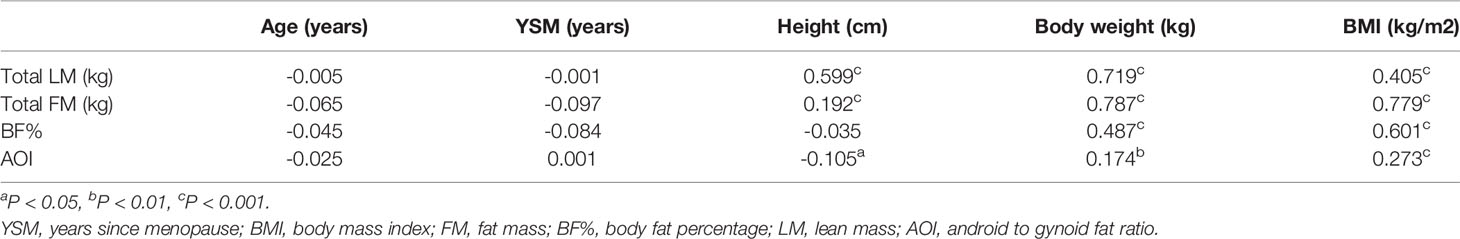
Table 3 Correlation of soft tissue components with anthropometric parameters.
Multivariate Analyses
Next, multivariate linear regression analyses were conducted to more fully explore the relationships among these different study variables (Table 4). Model 1 revealed a significant positive correlation between FM and both total and regional BMD values (total body, head, ribs, legs, arms, spine, lumbar spine, femoral neck, and hips) (standard β range: 0.141 to 0.343, all P < 0.001), while AOI was not significantly associated with any BMD parameters other than head BMD (r = -0.156, P < 0.01). Following adjustment for LM in Model 2, the positive correlations between FM and BMD remained significant (standard β range: 0.132 to 0.258, all P < 0.01). In addition, a significant relationship between LM and BMD was detected for all body regions (all P < 0.01), whereas AOI was significantly negatively correlated with head, leg, arm, femoral neck, hip, and total body BMD (standard β range: −0.093 to −0.232, all P < 0.05). When these analyses were repeated with BF% in place of FM, the results were largely the same (see Table 5), with BF% being significantly correlated with BMD. Following adjustment for LM, no change in the relationship between BF% and BMD was observed (standard β range: −0.100 to −0.232, all P < 0.05). A significant negative association between LM and BMD was also observed, while AOI was negatively correlated with head, femoral neck, arm, leg, hip, and total body BMD (standard β range: −0.100 to −0.232, P < 0.05).
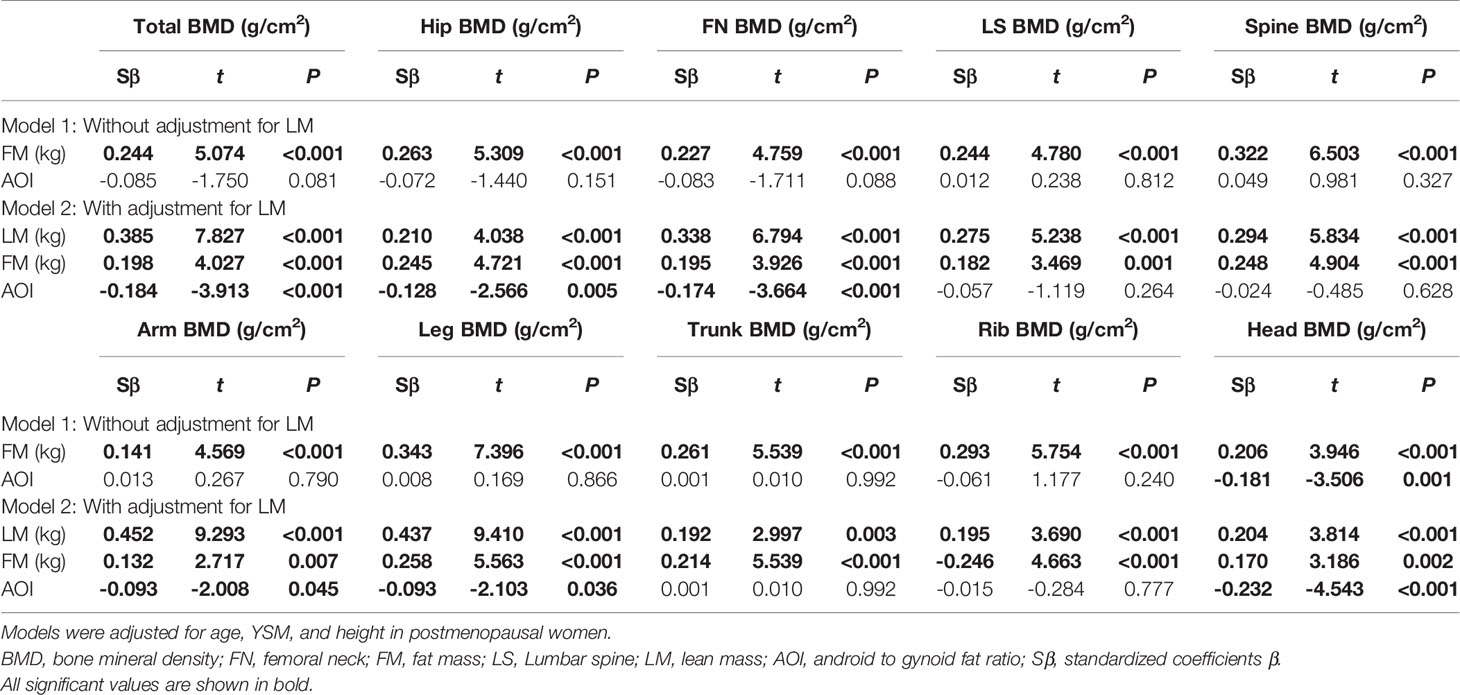
Table 4 Regression analysis of FM, AOI, and LM with total body and regional BMD.
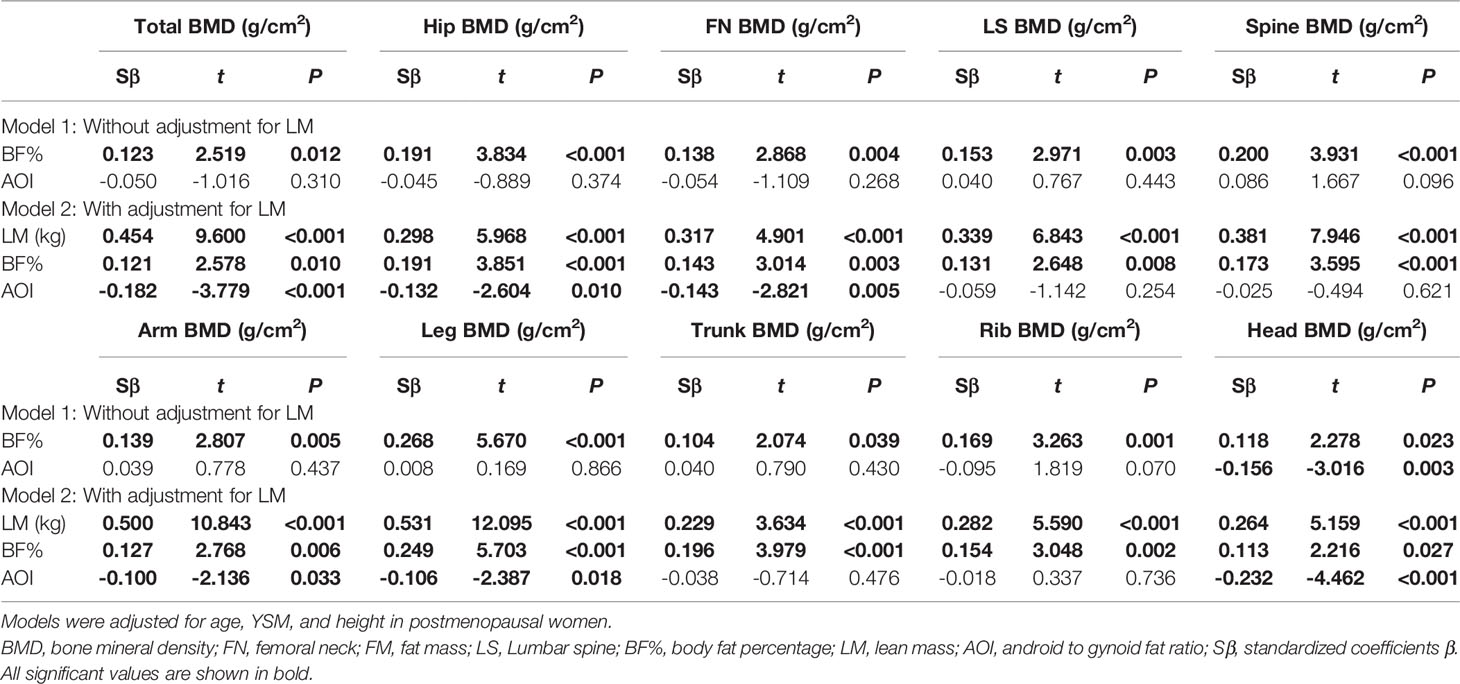
Table 5 Regression analysis of BF%, AOI, and LM with total body and regional BMD.
Discussion
These analyzes revealed total FM to be positively correlated with BMD for all analyzed skeletal regions, whereas AOI, serving as a readout for central FD, was negatively correlated with BMD for most skeletal regions following adjustment for age, height, YSM, total FM, and total LM among non-obese postmenopausal Chinese women over 60 years of age.
Consistent with our expectations, we found that most analyzed anthropometric parameters such as age and YSM were strongly correlated with BMD, both of which were negatively correlated with total and regional BMD values. In contrast, these BMD indices were positively correlated with the height, body weight, and BMI of study participants, although these relationships became less clear upon in-depth analyses of the relationships between anthropometric variables and soft tissue parameters. While some soft tissue parameters were positively correlated with height, weight, and BMI, others were negatively correlated with these variables or not clearly related to them. This suggests that the interplay between FD, anthropometric factors, and body fat accumulation has the potential to be beneficial or harmful with respect to BMD. It is thus vital that these anthropometric parameters be controlled for when evaluating relationships between bone mass and fat. However, prior studies have indicated that using body weight or BMI to correct for the effects of LM or FM on BMD has the potential to result in incorrect conclusions given that both LM and FM are tightly correlated with overall body weight (with correlation coefficients of 0.79 and 0.72 for FM vs. body weight and LM vs. body weight, respectively) (23). The incorporation of both total FM and body weight into a regression model has the potential to lead to inaccurate conclusions as a consequence of mathematical coupling (24–26). In contrast, height has been shown to be a more appropriate readout to use when seeking to control for body size (3). LM also has the potential to be leveraged as a variable for adjustment when assessing relationships between fat and bone mass (26). In the present analysis, we thus utilized age, height, and YSM as fixed covariates and total LM as an additional covariate for adjustment in our multivariate linear regression analyses exploring the associations between FM and BMD.
We observe a positive relationship between BMD and total FM among postmenopausal women, in line with prior reports (3, 7, 9). This relationship may be attributable to the elevated gravitational force associated with increased weight, in turn contributing to improvements in BMD (26). However, given that total FM accounts for a relatively small fraction of overall body weight, such gravitational forces are unlikely to fully explain the interplay between FM and BMD. Other research suggests that adipocytes can produce hormones including adiponectin, leptin, insulin, and adipocytic estrogens, all of which can impact bone metabolism via the endocrine pathway, thus potentially contributing to these results (27–30). These hormones may play a protective role, stimulating osteoblastogenesis and inhibiting the resorption of established bone tissue mediated by osteoclasts (31).
While increases in bone mass were observed with rising total FM in this analysis, BMD values for most analyzed regions were negatively correlated with central fat accumulation, as measured based on AOI, in non-obese postmenopausal elderly women. These findings are consistent with those from other studies suggesting that DXA-based AOI values are negatively correlated with bone health (16–18). This result may be attributable to a few underlying mechanisms. For one, adipose tissue sources can release high levels of inflammatory cytokines such as TNF-α or IL-6, thus contributing to bone loss and decreased BMD (32–34). Secondly, free fatty acid secretion from the visceral adipose tissue can inhibit insulin receptor expression, thereby contributing to the incidence of insulin resistance (35). Third, the osteoblastic and adipocytic differentiation of mesenchymal stem cells (MSCs) have been shown to be negatively correlated (36). The same mechanisms that are active in the bone marrow may thus be ties to the interplay between bone and central fat deposits.
In this study, we additionally observed strong positive correlations between LM and BMD in all analyzed body sites, with these correlations generally being stronger than those observed for FM. This suggests that muscle-mediated mechanical loads have a more robust beneficial impact on BMD as compared to FM in postmenopausal women (3, 9, 11, 12).
There are multiple strengths to the present study. For one, our research subjects were recruited from among a single well-defined population of individuals over 60 years of age of a specific ethnicity. Second, this study is among the few to have explored the association between central FD and BMD among non-obese postmenopausal women. Third, we assessed both total BMD and the regional BMD at multiple sites including the head, spine, lumbar spine, arms, legs, trunk, ribs, hips, and femoral neck, and we utilized DXA-based AOI as a measure for central FD rather than using alternative metrics such as the waist-to-thigh or waist-to-hip ratio.
There are a number of limitations to the present study. For one, this study was cross-sectional in design, thus precluding our ability to draw causal inferences pertaining to the relationships between FM, AOI, LM, and BMD. Secondly, no premenopausal women were included in this study, and all study participants were Chinese, thus limiting the degree to which these data are generalizable. Third, while we adjusted for age, height, and YSM when assessing the relationships between FM, FD, and BMD, we did not take other potential confounding variables such as serum sex hormone levels, vitamin D levels, dietary composition, smoking, or socioeconomic status into consideration when conducting multivariable regression analyses.
In conclusion, the results of this analysis suggest that FD and FM are associated with BMD among postmenopausal Chinese woman over the age of 60, even after adjusting for age, height, YSM, and LM. AOI can serve as an indicator of central FD, and was found to be negatively associated with both total and regional BMD, whereas total FM exhibit a positive relationship with BMD at all analyzed body sites, suggesting that it may serve as a protective factor. Total LM exhibited results consistent with total FM, thus suggesting that proper weight gain with appropriate control of central obesity may be beneficial to bone health among postmenopausal women. These data emphasize the important of regular physical activity, which can reduce central obesity even in the absence of weight loss while also reducing age-related muscle atrophy and increasing mechanical loading of the skeletal system (37).
Data Availability Statement
The original contributions presented in the study are included in the article/supplementary material. Further inquiries can be directed to the corresponding author.
Ethics Statement
The studies involving human participants were reviewed and approved by the Ethics Committee of the Tianjin Medical University General Hospital. The patients/participants provided their written informed consent to participate in this study. Written informed consent was obtained from the individual(s) for the publication of any potentially identifiable images or data included in this article.
Author Contributions
JF and YJ contributed equally to this work and share first authorship. JF and YJ designed the investigation. JQ and BH conducted the investigation and collected data. YJ performed the statistics. QZ wrote the main manuscript. All authors contributed to the article and approved the submitted version.
Funding
This work was funded by the National Natural Science Foundation of China (Grant No. 92163213, 81970085 and 82000844), and Science and Technology Talent Cultivation Project of Tianjin Municipal Health Commission (Grant No. KJ20216), and the Tianjin science and sechnology plan project (Grant No. 17ZXMFSY00080).
Conflict of Interest
The authors declare that the research was conducted in the absence of any commercial or financial relationships that could be construed as a potential conflict of interest.
Publisher’s Note
All claims expressed in this article are solely those of the authors and do not necessarily represent those of their affiliated organizations, or those of the publisher, the editors and the reviewers. Any product that may be evaluated in this article, or claim that may be made by its manufacturer, is not guaranteed or endorsed by the publisher.
References
1. Ho-Pham LT, Nguyen UD, Nguyen TV. Association Between Lean Mass, Fat Mass, and Bone Mineral Density: A Meta-Analysis. J Clin Endocrinol Metam (2014) 99:30–8. doi: 10.1210/jc.2013-3190
2. Hannan MT, Felson DT, Anderson JJ. Bone Mineral Density in Elderly Men and Women: Results From the Framingham Osteoporosis Study. J Bone Miner Res (1992) 7:547–53. doi: 10.1002/jbmr.5650070511
3. Ho-Pham LT, Nguyen ND, Lai TQ, Nguyen TV. Contributions of Lean Mass and Fat Mass to Bone Mineral Density: A Study in Postmenopausal Women. BMC Musculoskelet Disord (1992) 11:59. doi: 10.1186/1471-2474-11-59
4. Cheng Q, Zhu YX, Zhang MX, Li LH, Du PY, Zhu MH. Age and Sex Effects on the Association Between Body Composition and Bone Mineral Density in Healthy Chinese Men and Women. Menopause (2012) 19:448–55. doi: 10.1097/gme.0b013e31823a40ba
5. Fu X, Ma X, Lu H, He W, Wang Z, Zhu S. Associations of Fat Mass and Fat Distribution With Bone Mineral Density in Pre- and Postmenopausal Chinese Women. Osteoporos Int (2011) 22:113–9. doi: 10.1007/s00198-010-1210-9
6. Dytfeld J, Ignaszak-Szczepaniak M, Gowin E, Michalak M, Horst-Sikorska W. Influence of Lean and Fat Mass on Bone Mineral Density (BMD) in Postmenopausal Women With Osteoporosis. Arch Gerontol Geriatr (2011) 53:e237–42. doi: 10.1016/j.archger.2011.01.002
7. Hosseini SA, Hosseini SR, Ghadimi R, Noreddini H, Bijani A. Association Between Body Fat and Bone Mineral Density in non-Obese Post-Menopausal Women Over 60 Years Old. Caspian J Intern Med (2021) 12:200–6. doi: 10.22088/cjim.12.2.200
8. Chain A, Crivelli M, Faerstein E, Bezerra FF. Association Between Fat Mass and Bone Mineral Density Among Brazilian Women Differs by Menopausal Status: The Pro-Saude Study. Nutrition (2017) 33:14–9. doi: 10.1016/j.nut.2016.08.001
9. Namwongprom S, Rojanasthien S, Mangklabruks A, Soontrapa S, Wongboontan C, Ongphiphadhanakul B. Effect of Fat Mass and Lean Mass on Bone Mineral Density in Postmenopausal and Perimenopausal Thai Women. Int J Womens Health (2013) 5:87–92. doi: 10.2147/IJWH.S41884
10. Kim HY, Kim SS, Kim JS, Jung JG, Yoon SJ, Jo YH. Association Between Abdominal Obesity and Lumbar Bone Mineral Density According to the Postmenopausal Period in Korean Women. J Of Obes Metab Syndrome (2017) 26:210–6. doi: 10.7570/jomes.2017.26.3.210
11. Marin-Mio RV, Moreira L, Camargo M, Perigo N, Cerondoglo MS, Lazaretti-Castro M. : Lean Mass as a Determinant of Bone Mineral Density of Proximal Femur in Postmenopausal Women. Arch Endocrinol Metab (2018) 62:431–7. doi: 10.20945/2359-3997000000059
12. Ilesanmi-Oyelere BL, Coad J, Roy N, Kruger MC. Lean Body Mass in the Prediction of Bone Mineral Density in Postmenopausal Women. Biores Open Access (2018) 7:150–8. doi: 10.1089/biores.2018.0025
13. Kim JH, Choi HJ, Kim MJ, Shin CS, Cho NH. Fat Mass is Negatively Associated With Bone Mineral Content in Koreans. Osteoporos Int (2012) 23:2009–16. doi: 10.1007/s00198-011-1808-6
14. Anagnostis P, Paschou SA, Katsiki N, Krikidis D, Lambrinoudaki I, Goulis DG. Menopausal Hormone Therapy and Cardiovascular Risk: Where are We Now? Curr Vasc Pharmacol (2019) 17:564–72. doi: 10.2174/1570161116666180709095348
15. Liu X, Shi H. Regulation of Estrogen Receptor Alpha Expression in the Hypothalamus by Sex Steroids: Implication in the Regulation of Energy Homeostasis. Int J Endocrinol (2019) 2015:949085. doi: 10.1155/2015/949085
16. Xiao Z, Tan Z, Shang J, Cheng Y, Tang Y, Guo B, et al. Sex-Specific and Age-Specific Characteristics of Body Composition and its Effect on Bone Mineral Density in Adults in Southern China: A Cross-Sectional Study. BMJ Open (2020) 10:e32268. doi: 10.1136/bmjopen-2019-032268
17. Xiao Z, Xu H. Gender-Specific Body Composition Relationships Between Adipose Tissue Distribution and Peak Bone Mineral Density in Young Chinese Adults. BioMed Res Int (2020) 2020:6724749. doi: 10.1155/2020/6724749
18. Shao HD, Li GW, Liu Y, Qiu YY, Yao JH, Tang GY. Contributions of Fat Mass and Fat Distribution to Hip Bone Strength in Healthy Postmenopausal Chinese Women. J Bone Miner Metab (2015) 33:507–15. doi: 10.1007/s00774-014-0613-7
19. Kapus O, Gaba A, Lehnert M. Relationships Between Bone Mineral Density, Body Composition, and Isokinetic Strength in Postmenopausal Women. Bone Rep (2020) 12:100255. doi: 10.1016/j.bonr.2020.100255
20. Namwongprom S, Rojanasthien S, Wongboontan C, Mangklabruks A. Contribution of Android and Gynoid Adiposity to Bone Mineral Density in Healthy Postmenopausal Thai Women. J Clin Densitom (2019) 22:346–50. doi: 10.1016/j.jocd.2018.05.037
21. Bouchi R, Nakano Y, Ohara N, Takeuchi T, Murakami M, Asakawa M, et al. Clinical Relevance of Dual-Energy X-Ray Absorptiometry (DXA) as a Simultaneous Evaluation of Fatty Liver Disease and Atherosclerosis in Patients With Type 2 Diabetes. Cardiovasc Diabetol (2016) 15:64. doi: 10.1186/s12933-016-0384-7
22. Kim DH, Lim H, Chang S, Kim JN, Roh YK, Cho MK. Association Between Body Fat and Bone Mineral Density in Normal-Weight Middle-Aged Koreans. Korean J Fam Med (2019) 40:100–5. doi: 10.4082/kjfm.17.0082
23. Cole TJ, Fewtrell MS, Prentice A. The Fallacy of Using Percentage Body Fat as a Measure of Adiposity. Am J Clin Nutr (2008) 87:1959–60. doi: 10.1093/ajcn/87.6.1959
24. Gilthorpe MS, Tu YK. Mathematical Coupling: A Multilevel Approach. Int J Epidemiol (2004) 33:1399–400. doi: 10.1093/ije/dyh302
25. Tu YK, Clerehugh V, Gilthorpe MS. Ratio Variables in Regression Analysis can Give Rise to Spurious Results: Illustration From Two Studies in Periodontology. J Dent (2004) 32:143–51. doi: 10.1016/j.jdent.2003.09.004
26. Reid IR. Relationships Between Fat and Bone. Osteoporos Int (2008) 19:595–606. doi: 10.1007/s00198-007-0492-z
27. McTernan PG, Anderson LA, Anwar AJ, Eggo MC, Crocker J, Barnett AH, et al. Glucocorticoid Regulation of P450 Aromatase Activity in Human Adipose Tissue: Gender and Site Differences. J Clin Endocrinol Metab (2002) 87:1327–36. doi: 10.1210/jcem.87.3.8288
28. Faloni AP, Sasso-Cerri E, Rocha FR, Katchburian E, Cerri PS. Structural and Functional Changes in the Alveolar Bone Osteoclasts of Estrogen-Treated Rats. J Anat (2012) 220:77–85. doi: 10.1111/j.1469-7580.2011.01449.x
29. Williams GA, Wang Y, Callon KE, Watson M, Lin JM, Lam JB, et al. In Vitro and In Vivo Effects of Adiponectin on Bone. Endocrinology (2009) 150:3603–10. doi: 10.1210/en.2008-1639
30. Tu Q, Zhang J, Dong LQ, Saunders E, Luo E, Tang J, et al. Adiponectin Inhibits Osteoclastogenesis and Bone Resorption via APPL1-Mediated Suppression of Akt1. J Biol Chem (2011) 286:12542–53. doi: 10.1074/jbc.M110.152405
31. Pollock NK. Childhood Obesity, Bone Development, and Cardiometabolic Risk Factors. Mol Cell Endocrinol (2015) 410:52–63. doi: 10.1016/j.mce.2015.03.016
32. Cartier A, Lemieux I, Almeras N, Tremblay A, Bergeron J, Despres JP. Visceral Obesity and Plasma Glucose-Insulin Homeostasis: Contributions of Interleukin-6 and Tumor Necrosis Factor-Alpha in Men. J Clin Endocrinol Metab (2008) 93:1931–8. doi: 10.1210/jc.2007-2191
33. Pou KM, Massaro JM, Hoffmann U, Vasan RS, Maurovich-Horvat P, Larson MG, et al. Visceral and Subcutaneous Adipose Tissue Volumes are Cross-Sectionally Related to Markers of Inflammation and Oxidative Stress: The Framingham Heart Study. Circulation (2007) 116:1234–41. doi: 10.1161/CIRCULATIONAHA.107.710509
34. Wood IS, Wang B, Jenkins JR, Trayhurn P. The Pro-Inflammatory Cytokine IL-18 is Expressed in Human Adipose Tissue and Strongly Upregulated by TNFalpha in Human Adipocytes. Biochem Biophys Res Commun (2005) 337:422–9. doi: 10.1016/j.bbrc.2005.09.068
35. Rokoff LB, Rifas-Shiman SL, Switkowski KM, Young JG, Rosen CJ, Oken E, et al. Body Composition and Bone Mineral Density in Childhood. Bone (2019) 121:9–15. doi: 10.1016/j.bone.2018.12.009
36. Gimble JM, Zvonic S, Floyd ZE, Kassem M, Nuttall ME. Playing With Bone and Fat. J Cell Biochem (2006) 98:251–66. doi: 10.1002/jcb.20777
Keywords: bone mineral density, fat distribution, fat mass, lean mass, postmenopausal
Citation: Fan J, Jiang Y, Qiang J, Han B and Zhang Q (2022) Associations of Fat Mass and Fat Distribution With Bone Mineral Density in Non-Obese Postmenopausal Chinese Women Over 60 Years Old. Front. Endocrinol. 13:829867. doi: 10.3389/fendo.2022.829867
Received: 06 December 2021; Accepted: 03 January 2022;
Published: 25 January 2022.
Edited by:
Guanwu Li, Shanghai University of Traditional Chinese Medicine, ChinaReviewed by:
Yingchao Han, Shanghai JiaoTong University, ChinaCopyright © 2022 Fan, Jiang, Qiang, Han and Zhang. This is an open-access article distributed under the terms of the Creative Commons Attribution License (CC BY). The use, distribution or reproduction in other forums is permitted, provided the original author(s) and the copyright owner(s) are credited and that the original publication in this journal is cited, in accordance with accepted academic practice. No use, distribution or reproduction is permitted which does not comply with these terms.
*Correspondence: Qiang Zhang, emhhbmdxaWFuZ3l1bHZAMTYzLmNvbQ==