 Johann M. E. Jende1
 Christoph Mooshage1
 Zoltan Kender2
 Lukas Schimpfle2
 Alexander Juerchott1
 Peter Nawroth2
 Sabine Heiland3
 Martin Bendszus1
 Stefan Kopf2,4
 Felix T. Kurz1,5*
- 1Department of Neuroradiology, Heidelberg University Hospital, Heidelberg, Germany
- 2Department of Endocrinology, Diabetology and Clinical Chemistry (Internal Medicine 1) Heidelberg University Hospital, Heidelberg, Germany
- 3Division of Experimental Radiology, Department of Neuroradiology, Heidelberg, Germany
- 4German Center of Diabetes Research, Associated Partner in the Deutsches Zentrum für Diabetesforschung (DZD), München-Neuherberg, Germany
- 5German Cancer Research Center, Division of Radiology, Heidelberg, Germany
Objective: The pathogenesis of diabetic polyneuropathy (DN) is poorly understood and given the increasing prevalence of DN, there is a need for clinical or imaging biomarkers that quantify structural and functional nerve damage. While clinical studies have found evidence of an association between elevated levels of troponin T (hsTNT) and N-terminal pro brain natriuretic peptide (proBNP) with microvascular compromise in type 2 diabetes (T2D), their implication in mirroring DN nerve perfusion changes remains unclear. The objective of this study was, therefore, to investigate whether hsTNT and proBNP assays are associated with MRI nerve perfusion in T2D.
Methods: In this prospective cross-sectional single-center case-control study, 56 participants (44 with T2D, 12 healthy control subjects) consented to undergo magnetic resonance neurography (MRN) including dynamic contrast-enhanced (DCE) perfusion imaging of the right leg. Using the extended Tofts model, primary outcome parameters that were quantified are the sciatic nerve’s microvascular permeability (Ktrans), the extravascular extracellular volume fraction (ve), and the plasma volume fraction (vp), as well as hsTNT and proBNP values from serological workup. Further secondary outcomes were clinical, serological, and electrophysiological findings.
Results: In T2D patients, hsTNT was negatively correlated with Ktrans (r=-0.38; p=0.012) and ve (r=-0.30; p=0.048) but not with vp (r=-0.16; p=0.294). HsTNT, Ktrans, and ve were correlated with peroneal nerve conduction velocities (NCVs; r=-0.44; p=0.006, r=0.42; p=0.008, r=0.39; p=0.014), and tibial NCVs (r=-0.38;p=0.022, r=0.33; p=0.048, r=0.37; p=0.025). No such correlations were found for proBNP.
Conclusions: This study is the first to find that hsTNT is correlated with a decrease of microvascular permeability and a reduced extravascular extracellular volume fraction of nerves in patients with T2D. The results indicate that hsTNT may serve as a potential marker for the assessment of nerve perfusion in future studies on DN.
Introduction
Diabetic polyneuropathy (DN) is one of the most frequent and most disabling complications of diabetes mellitus (1). Especially in type 2 diabetes (T2D), the complex pathophysiological mechanisms that cause DN have not been understood completely (1–4). Evidence from clinical and histological studies suggests that nerve ischemia related to macro- and microangiopathy as well as cardiac insufficiency is a major contributor to demyelination and axonal damage in T2D (5–8). Recent studies have found cardiac biomarkers, high sensitivity troponin T (hsTNT) and N-terminal pro brain natriuretic peptide (proBNP), to be associated with microvascular complications in patients with T2D (9). It remains to be determined, however, whether hsTNT and proBNP are also associated with the occurrence of DN and whether both hsTNT and proBNP codify parameters of nerve perfusion such as plasma volume or microvascular permeability (9). To date, is has not been possible to assess the perfusion of peripheral nerves directly in the context of clinical studies. Magnetic resonance neurography (MRN) at 3 Tesla (3T) is a non-invasive method that allows to visualize and quantify structural and physiological changes of peripheral nerves along the entire anatomical course (10, 11). Recent studies on MRN in patients with T2D have found that structural nerve damage associated with demyelination in T2D is related to elevated levels of hsTNT but not proBNP (12). While there are several animal experimental MRI studies on the vascular supply of peripheral nerves and monitoring changes in microvasculature (13–16), only a recent pilot study on dynamic contrast enhanced (DCE) MRN in patients focusing on inflammatory neuropathies could, for the first time, demonstrate that DCE sequences allow investigating the perfusion of peripheral nerves by assessing parameters related to plasma volume and microvascular permeability (17). These parameters can be obtained from DCE MRN using the extended Tofts model, which allows calculating the constant of the examined nerve’s capillary permeability (Ktrans), the volume fraction of the plasma space (vp), and the volume fraction of the extracapillary extracellular space (ve) (18, 19). The aim of this study was to combine DCE imaging of nerves at thigh level in patients with T2D with hsTNT and proBNP assays, and demographic, clinical, and electrophysiological data in order to investigate potential associations between hsTNT and proBNP with parameters of nerve microcirculation in patients with T2D.
Methods
Study Design and Participants
This study was approved by the ethics committee of Heidelberg University Hospital (HEIST-DiC, clinicaltrials.gov identifier NCT03022721, local ethics number S-383/2016) and all participants gave written informed consent. Overall exclusion criteria were age <18, pregnancy, an estimated glomerular filtration rate (eGFR) <60ml/min, any contraindications for MR imaging or administration of MRI contrast agents. Further reasons for exclusion were history of myocardial infarction, coronary heart disease, heart surgery, spine surgery, lumbar disc extrusion, risk factors for sarcopenia or neuropathy other than diabetes such as malignant diseases, alcoholism, hypovitaminosis, previous or ongoing exposure to neurotoxic agents, chronic neurological diseases such as Parkinson’s disease, restless legs syndrome, or multiple sclerosis. The sample size was based on the results of previous MRN studies on DN (12, 20) and 44 patients with T2D (17 women, 27 men) and 12 controls (7 women, 5 men) were enrolled in this prospective single-center study between June 2016 and March 2020 and underwent DCE MRN with subsequent clinical, electrophysiological, and serological assessments.
Clinical and Electrophysiological Examination
For every participant, a detailed medical history was taken. Electrophysiological examinations (VikingQuest; Viasys Healthcare GmbH, Höchberg, Germany) included an assessment of nerve conduction velocities (NCVs) of the tibial, peroneal, and sural nerve, distal motor latencies (DMLs) of the right tibial and peroneal nerve, compound muscle action potentials (CMAPs) of the tibial and peroneal nerve, and sensory nerve action potentials (SNAPs) of the sural nerve of the right leg. Skin temperature was kept at 32°C throughout the examination. Electrophysiological studies were conducted by two specially trained medical technical assistants with more than 6 years of experience in electrophysiological assessments on patients with diabetes. An examination of neuropathic symptoms was performed comprising the neuropathy disability score (NDS) and the neuropathy severity scale (NSS) (21). In line with Gibbon’s criteria for DN, patients with an NDS ≥ 3 were assigned to the DN group (22).
MRI Imaging Protocol
All participants underwent high-resolution MRN of the right thigh in a 3.0 Tesla MR-scanner (Magnetom Tim TRIO, Siemens Healthineers, Erlangen, Germany). A 15-channel transmit-receive extremity coil was used and the following sequences were applied:
1) axial high resolution T2-weighted turbo spin echo (TSE) 2D sequence with spectral fat suppression; repetition time (TR) = 5970 ms, echo time (TE) = 55 ms, field of view (FOV) = 160 × 160 mm2, matrix size = 512 × 512, slice thickness = 4 mm, no interslice gap, voxel size = 0.3 × 0.3 × 4.0 mm3, 24 slices, 24 acquired images, total acquisition time = 4:42 min;
2) axial T1-weighted volume interpolated breathhold examination (VIBE) sequence; TR = 3.3 ms, TE = 1.11 ms, FOV = 160 × 160 mm2, matrix size = 128 × 128, slice thickness = 4 mm, interslice gap = 0.8 mm, voxel size = 1.3 × 1.3 × 4.0 mm3; single acquisition at a flip-angle of 5°, 8°, 11°, 14°, 17° (24 slices = 144 acquired images), total acquisition time = 30s;
3) axial T1-weighted volume interpolated breathhold examination (VIBE) sequence; TR = 3.3 ms, TE = 1.11 ms, FOV = 160 × 160 mm2, matrix size = 128 × 128, slice thickness = 4 mm, interslice gap = 0.8 mm, voxel size = 1.3 × 1.3 × 4.0 mm3 50 repetitions (1200 acquired images) at a flip angle of 15°, contrast agent administration (Dotarem®, Guerbet, France, 0.1 mmol/kg, flow rate 3.5ml/s) after completion of the sixth repetition, total acquisition time = 4:09 min.
The sequence was centered on the sciatic nerve bifurcation at distal thigh level in every participant.
MRI Data Analysis and Statistical Analysis
All images were pseudonymized and observers were blinded to all clinical data. For each patient, we segmented the sciatic nerve manually on all images of the T2-weighted sequence with ImageJ (23). T2-weighted images were also co-registered to the T1 VIBE sequence with affine transformations using custom-written code in Matlab (MathWorks, Natick, MA, R2020b) (24). The schematic process of image segmentation and co-registration is shown in Figure 1. We manually determined the arterial input function (AIF) by segmenting a region of interest of the femoral artery on a representative imaging slice. The average signal intensity of all artery voxels for consecutive imaging time points was then used to obtain the signal intensity curve during contrast administration. The signal intensity baseline end was determined as the last imaging time point before signal intensity would increase by more than 25% above the averaged signal intensity of all preceding imaging time points. The resulting AIF was smoothed with a moving average filter of 3 images.
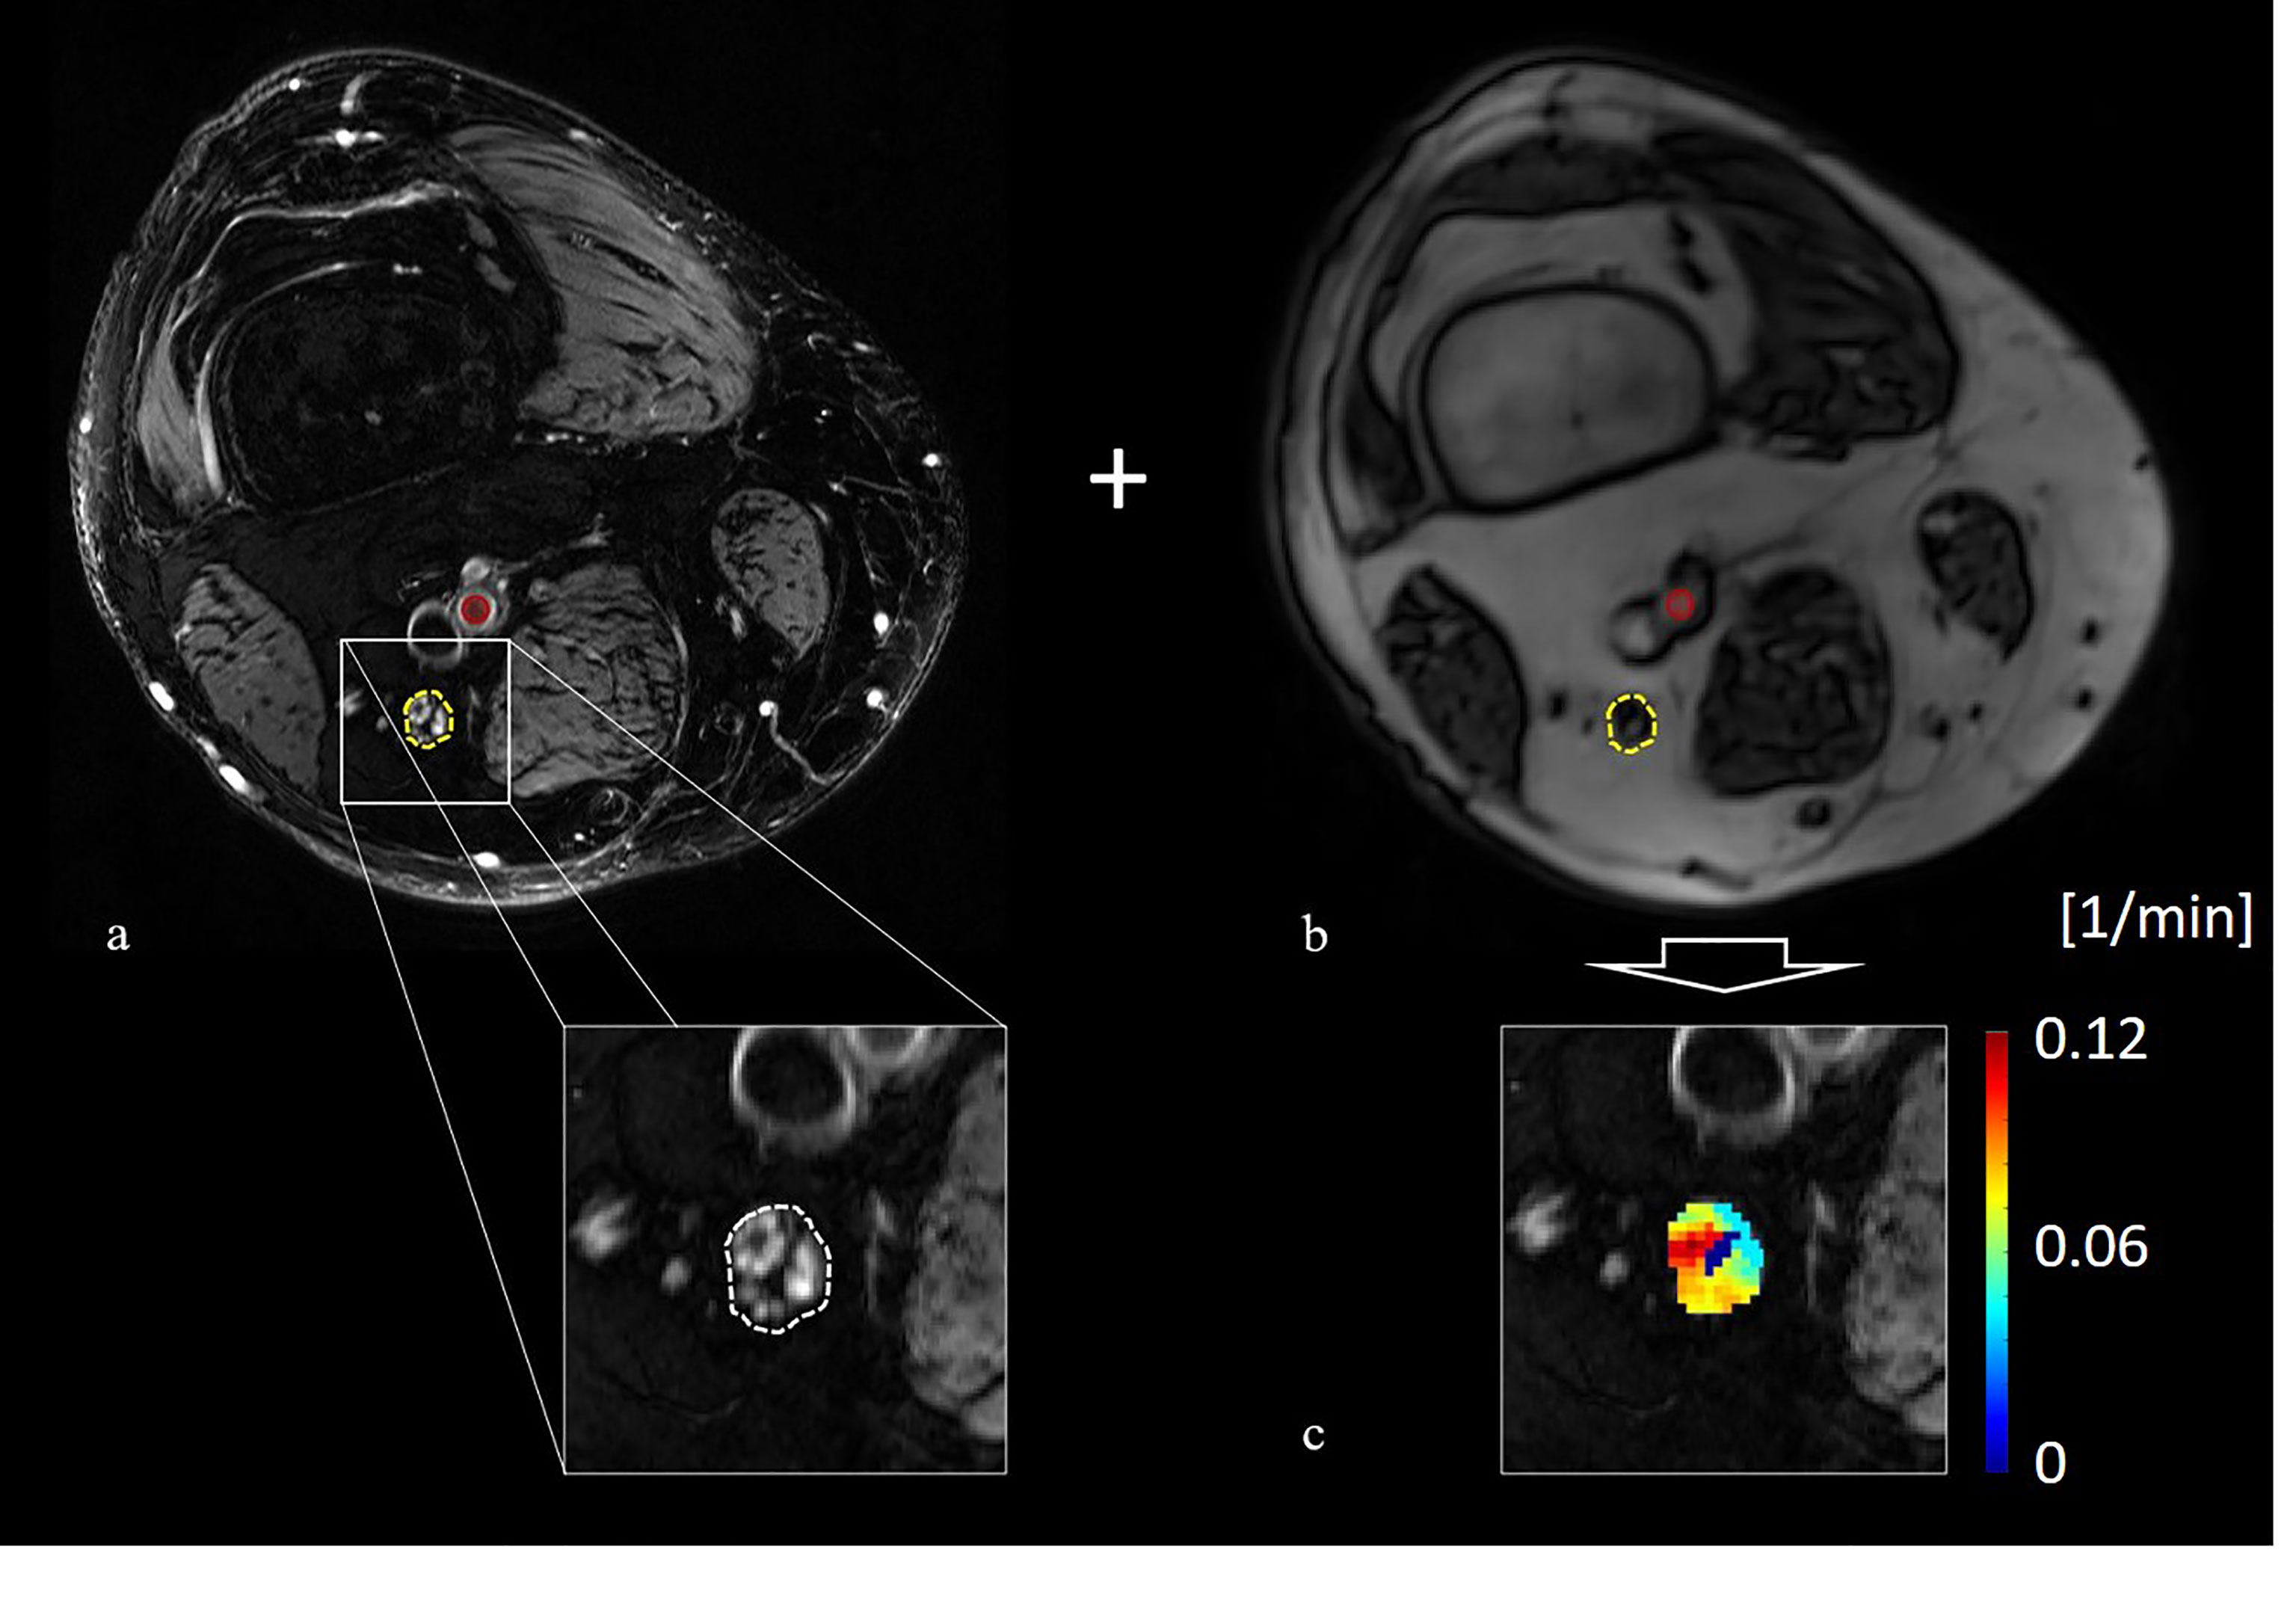
Figure 1 Principle of image co-registration and assessment of nerve perfusion parameters: (A) T2-weighted image of the distal right thigh showing the tibial compartment of the sciatic nerve (yellow circle) and the position of the femoral artery (red circle), (B) axial T1-weighted volume interpolated breathhold examination sequence of the same position a s in (A) with the co-registered position of the sciatic nerve (yellow circle) and the femoral artery (red circle), (C) color coded map of Ktrans values obtained from the extended Tofts model.
We determined the relaxation time T1,0 for the first imaging time point subsequently for each voxel in dependence on flip angle α by assigning T1,x(α) = SI0/tan(α) and T1,y(α) = SI0/sin(α), where SI0 represents the initial signal intensity. Subsequent linear regression on T1,x and T1,y yields the slope m (25). Spin-lattice relaxation time T1,0 follows as T1,0 = -TR/log(m), with repetition time TR. Using αR = 15°, we obtain with signal intensity SIt and relaxation time T1,t at time t: , where , c.f. Eq. (6) in (26). The tissue concentration C(t) at time t is then found as (26), where r1 = 3.43 L/mmol/s represents the relaxivity of blood at 3 Tesla (27).
We chose the extended Tofts model (ETM) which is used as a default perfusion model in central nervous system imaging and diabetes, see e.g., (19). It consists of a plasma and an extravascular extracellular compartment. Simpler perfusion models, such as the Patlak model, assume a negligible diffusion of contrast agent from the extravascular space back to the intravascular space, however, this a priori assumption cannot be justified in diabetes where it was shown that the permeability of the blood-brain barrier is generally increased (28). In the ETM, we have (29):
where Ktrans represents the volume transfer constant between plasma and the extravascular extracellular compartment, ve represents the volume fraction of extravascular extracellular space per unit volume of tissue, vp is blood plasma volume per unit volume of tissue, and CM(t) corresponds to the model tissue concentration at time t. To minimize the residual sum of least squares, Σt[CM(t) – C(t)]2, we used the Nelder-Mead simplex method for model parameters Ktrans, ve, and vp with starting values Ktrans = 0.007/s, ve = 0.15, vp = 0.025 (17, 30–32).
Statistical Analysis
Statistical data analysis was carried out with MATLAB (R2020b) and GraphPad Prism 7. The D’Agostino-Pearson omnibus normality test was used to test for Gaussian normal distribution. If a Gaussian normal distribution was given, t tests were used for comparisons of two groups, one-way ANOVAs were used for comparisons of more than two groups, and Pearson correlation coefficients were used for correlation analysis. If data were not Gaussian distributed, the Mann-Whitney test was used for comparisons of two groups, the Kruskal-Wallis test with post-hoc Dunn correction was used for multiple comparisons of more than two groups, and nonparametric Bonferroni-corrected Spearman correlation was used for correlation analysis. In case of multiple significant correlations for one parameter, partial correlation analysis with controlling for confounding variables was performed.
Results
Demographic and Clinical Data
This study comprised 44 patients with T2D (17 women, 27 men, mean age 66.14 ± 7.12) and 12 controls (7 women, 5 men mean age 61.58 ± 7.79). Between T2D patients and controls, there were no significant differences for age, gender, BMI, or glomerular filtration rate. In the T2D group, 26 patients suffered from DN. On electrophysiological examination, lower tibial and peroneal NCVs and CMAPs were found in T2D patients compared to controls. A summary and comparison of demographic and clinical data of patients with T2D and controls is provided in Table 1.
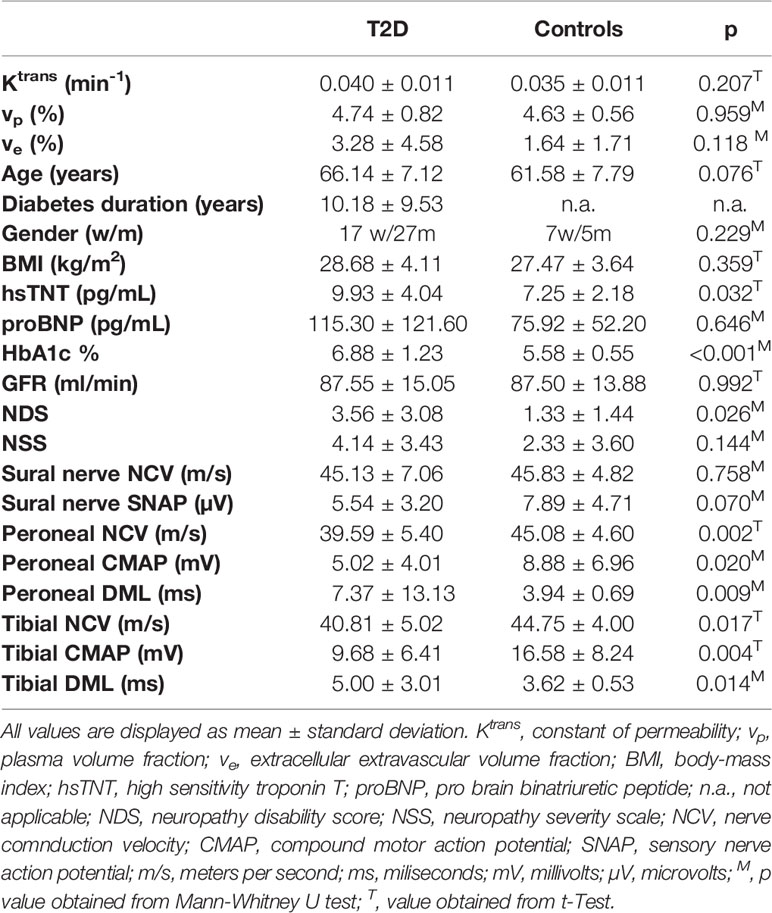
Table 1 Comparison of demographic, serologic, clinical, electrophysiological, and MRN imaging data of all study participants.
Group Comparisons of hsTNT and proBNP Levels for T2D Patients and Controls
Patients with T2D showed higher levels of hsTNT compared to controls (9.93 ± 0.04 pg/mL versus 7.25 ± 2.18 pg/mL, respectively, p=0.032), see Table 1. Also, ANOVA revealed that hsTNT was higher in T2D patients with DN compared to T2D patients without DN (11.67 ± 3.50 vs. 8.65 ± 4.05; p=0.015) and compared to controls (vs. 7.25 ± 2.18; p=0.002), no such differences were found for proBNP. In T2D patients, hsTNT correlated negatively with tibial and peroneal NCVs and with tibial CMAPs. A positive correlation was found between hsTNT and age. No such correlations were found for proBNP. A summary of all correlations of hsTNT and proBNP in T2D patients and controls is provided in Table 2, and correlations of hsTNT with tibial and peroneal NCVs are illustrated in Figures 2A, B.
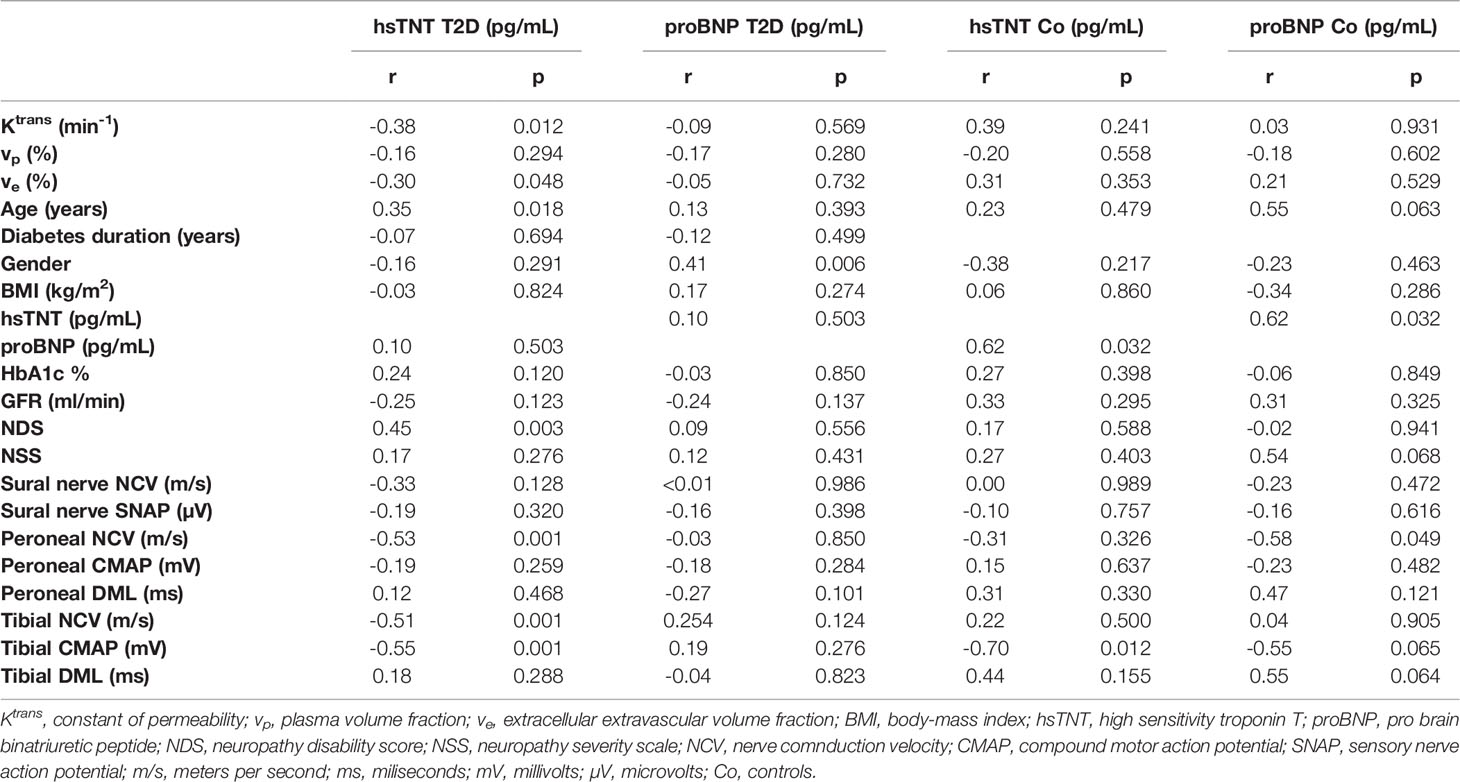
Table 2 Correlations of hsTNT and proBNP with MRN perfusion parameters and demographic, serologic, clinical, and electrophysiological data.
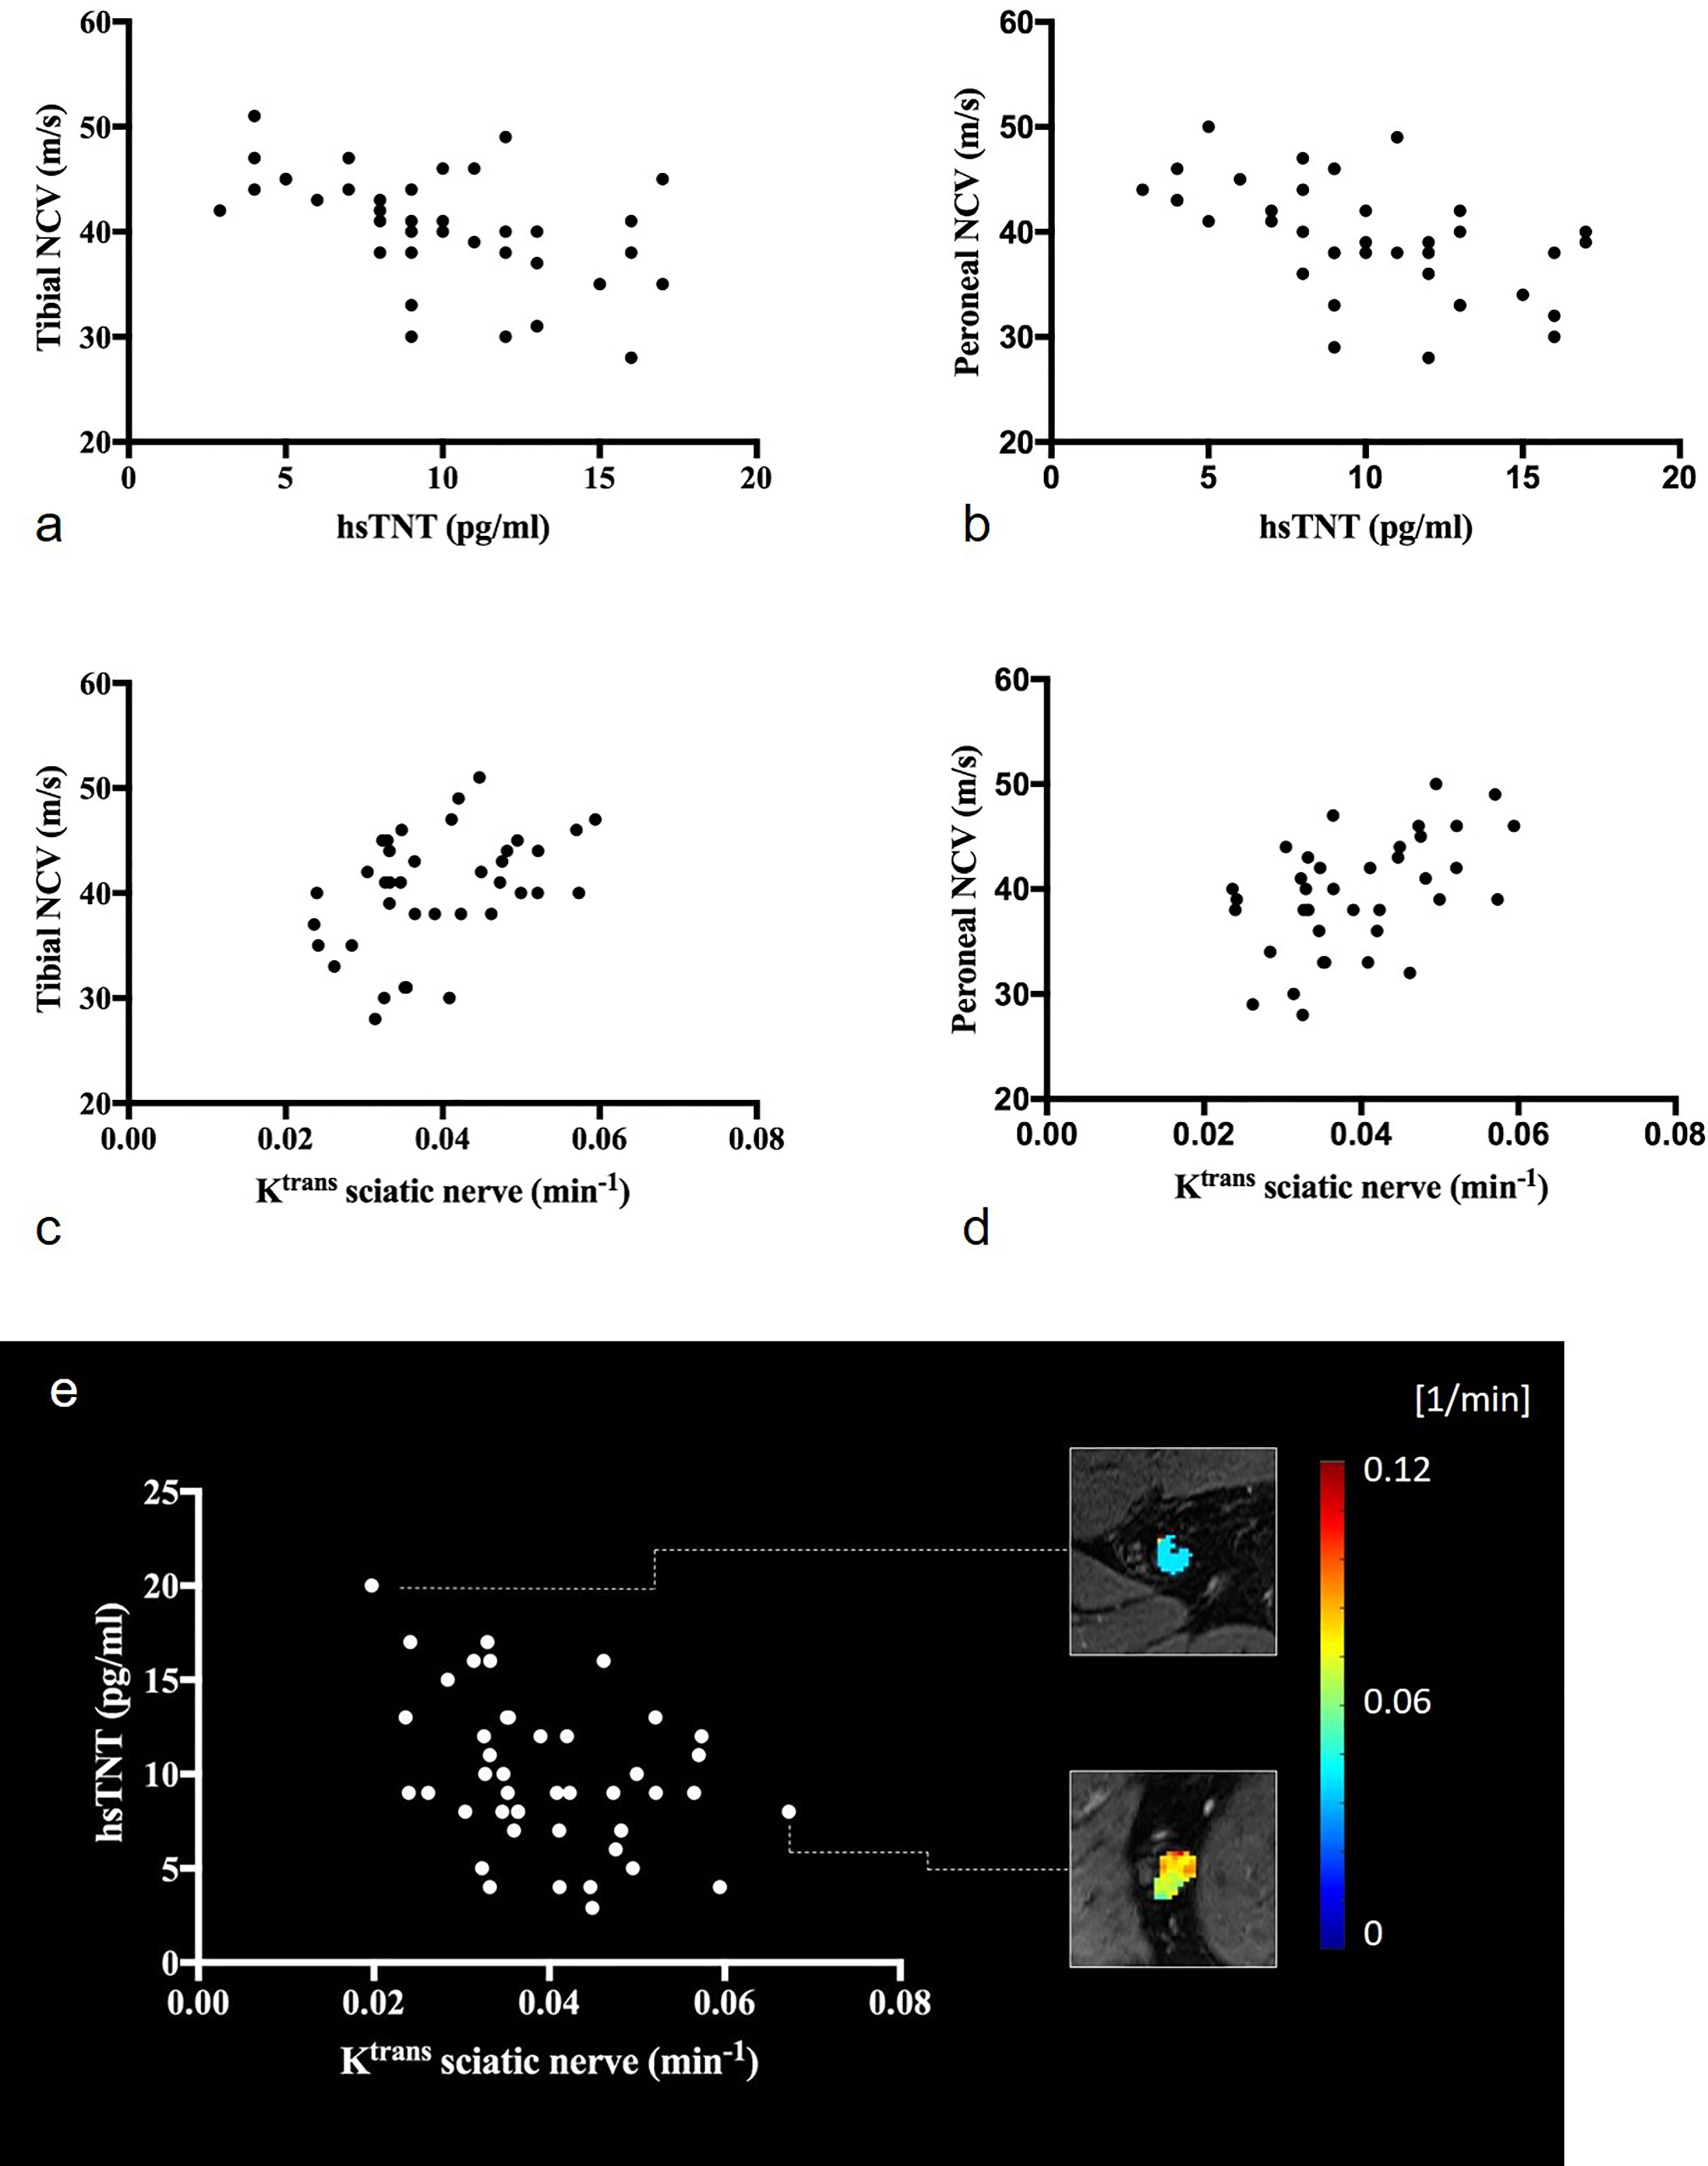
Figure 2 Correlations of the sciatic nerve’s Ktrans and hsTNT with electrophysiologic parameters: (A) correlation of hsTNT with tibial nerve conduction velocities (r=-0.51; p=0.001), (B) correlation of hsTNT and peroneal nerve conduction velocities (r=-0.53; p=0.001), (C) correlation of Ktrans with tibial nerve conduction velocities (r=0.42; p=0.008), (D) correlation of Ktrans and peroneal nerve conduction velocities (r=0.49; p=0.002), (E) illustration of the correlation between Ktrans and hsTNT (r=-0.38; p=0.012). Representative color-coded Ktrans maps of the sciatic nerve are shown. Upper rectangle: T2D patient with hsTNT levels of 20pg/ml and a sciatic nerve’s Ktrans of 0.020 (min-1), lower rectangle: T2D patient with hsTNT levels of 8pg/ml and a sciatic nerve’s Ktrans of 0.067 (min-1).
MRN Perfusion Parameters
No significant differences were found for perfusion parameters Ktrans, vp, and ve between T2D patients and the control group. ANOVA found lower Ktrans values in patients with DN compared to T2D patients without DN (0.037 ± 0.010 vs. 0.044 ± 0.010; p=0.042) but not compared to controls (0.037 ± 0.010 vs. 0.035 ± 0.011; p=0.882). In patients with T2D and in controls, Ktrans was strongly correlated with ve (r=0.75; p<0.001, and r=0.76; p=0.007, respectively). A summary of all correlations of perfusion parameters in T2D patients is provided in Table 3.
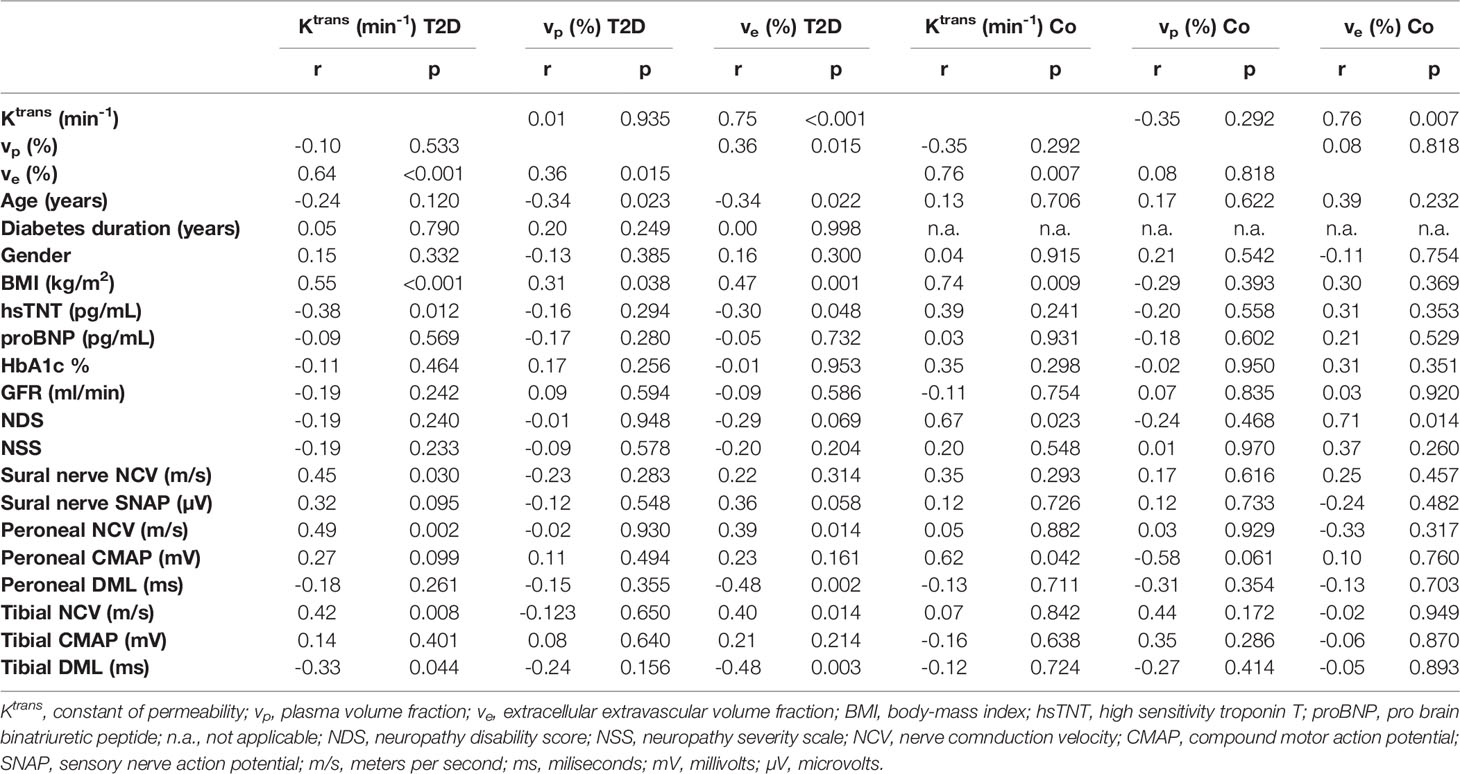
Table 3 Correlations of MRN perfusion parameters with demographic, serological, clinical, and electrophysiological data.
Correlation of Perfusion Parameters With Demographic Data
In patients with T2D and controls, Ktrans correlated positively with the BMI. Another correlation was found between ve and BMI in patients with T2D. Parameter vp was negatively correlated with age, while no such correlation was found for Ktrans or ve.
Correlation of Perfusion Parameters With Serological, Clinical, and Electrophysiological Data
In T2D patients, Ktrans was positively correlated with NCVs of tibial, peroneal, and sural nerves. Parameter ve was positively correlated with tibial and peroneal NCVs and DMLs. Correlations of Ktrans with tibial and peroneal NCVs are illustrated in Figures 2C, D. Ktrans and ve were negatively correlated with hsTNT (Figure 2E). In a partial correlation analysis, double-controlled for confounding variables age and BMI, correlations remained significant between Ktrans and hsTNT (r=-0.42; p=0.005) and between ve and hsTNT (r=0.33; p=0.034). No such correlations were found for Ktrans and ve with proBNP, HbA1c, or the glomerular filtration rate. No correlations were found for vp with hsTNT or electrophysiological parameters. A detailed summary of all correlations of MRN perfusion parameters with clinical and electrophysiological data in T2D patients and controls is provided in Table 3. Using a modified classification score for diabetic neuropathy severity based on electrophysiological parameters as proposed in (33), we allocated a score of 1 to patients with a sural nerve SNAP amplitude ≥ 5 µV, and a score of 2, 3, and 4 to patients with a sural nerve SNAP amplitude < 5 µV and a tibial nerve CMAP amplitude ≥ 5 mV, ≥ 2 mV and ≤ 5 mV, and < 2 mV, respectively, where neuropathy severity increases with score value. We subsequently found significant negative correlations between neuropathy severity score value and Ktrans (r=-0.41; p=0.007), and ve (r=-0.37; p=0.017), indicating that neuropathy severity is associated with reduced nerve perfusion in agreement with previous animal experimental studies, possibly due to the development of abnormal microvasculature and capillary dysfunction (34, 35).
Discussion
This study used DCE 3T MRN to investigate potential associations of peripheral nerve perfusion with cardiac biomarkers hsTNT and proBNP in patients with T2D. The main findings were (i) in T2D patients, hsTNT was negatively correlated with Ktrans and ve, while no such correlation was found for proBNP; (ii) in T2D, hsTNT, Ktrans, and ve were correlated with electrophysiological parameters and an electrophysiology-based neuropathy severity score; and (iii) hsTNT was increased while Ktrans and ve were decreased in DN patients compared to patients without DN.
The results of this study confirm the hypothesis that hsTNT codifies parameters of nerve perfusion in patients with T2D (9, 12, 36). Specifically, the correlation of hsTNT with Ktrans suggests that an increase in hsTNT is associated with a decrease in capillary permeability of peripheral nerves. The correlations of Ktrans with ve and between hsTNT and ve further indicate that a decrease in nerve capillary permeability accompanied by elevated hsTNT levels is associated with a reduction of the extracapillary extracellular volume (EEV) fraction, which may ultimately result in nerve ischemia and demyelination. This assumption is further supported by the finding that hsTNT was negatively correlated with nerve conduction velocities of tibial and peroneal nerves, while Ktrans, and ve were positively correlated with nerve conduction velocities. Since a decrease in nerve conduction velocity is generally assumed to represent myelin damage (37), these correlations indicate that a decrease in capillary permeability and EEV fraction result in demyelination. In addition, the finding that there were no correlations for vp with hsTNT or any of the acquired electrophysiological parameters further implies that there is no relevant impact of the capillary plasma volume fraction on structural nerve damage in the examined patients. The absence of correlations between proBNP and any of the acquired clinical and serological parameters in T2D patients is of importance for an understanding of the origin of elevated hsTNT levels in patients with T2D, meaning, that while there was a correlation of hsTNT and proBNP in healthy controls, no such correlation was found in the T2D group. This finding is of particular interest since it indicates that the well-established correlation of hsTNT and proBNP (38) does not apply in the T2D group. Since proBNP is an indicator for myocardial insufficiency, the lack of a correlation between hsTNT and proBNP indicates that elevated hsTNT levels in T2D patients and correlations of MRN perfusion parameters with hsTNT are not the consequence of myocardial insufficiency. Instead, our results are in line with previous studies suggesting that hsTNT represents myocardial damage due to microangiopathy that affects different organs in patients with T2D (9, 12). It remains to be determined, how much hyperglycemia or other metabolic factors, such as dyslipidemia, contribute to these microangiopathic changes (39–41).
One may of course argue, that hsTNT showed positive correlations with age while Ktrans showed positive correlations with BMI, therefore, the findings of this study only represent age- and obesity-related changes of perfusion in peripheral nerves. It should be considered, however, that negative correlations of Ktrans and ve with hsTNT remained significant in a partial correlation analysis which was controlled for both age and BMI as confounding variables.
This study only found differences in perfusion parameters Ktrans and ve between T2D patients with and without DN, while no such difference was found between controls and T2D patients with DN. This is in line with previous studies on animal models for diabetes that found an increased vascular permeability in nerves of diabetic rats without diabetic neuropathy, supposedly due to an increased permeability of the basement membrane in Schwann cells and a reduction of nerve permeability in rats with DN compared to rats without DN, supposedly due to microangiopathy (42, 43).
This study is limited by the fact that only patients without an impairment of renal function were included due to the administration of MRI contrast agent. Thus, we cannot draw conclusions on the impact of hsTNT levels on nerve perfusion in patients with impaired renal function, since hsTNT is usually elevated in those patients due to renal elimination. Another limitation is the cross-sectional nature of the study which does not allow any conclusions on the predictive value of hsTNT for the progression of DN. The study is further limited by the sample size of T2D patients and controls, which cannot rule out all potential confounders for the observed differences and correlations. It should be considered, however, that patients and controls were matched for age, BMI, and renal function to minimize confounding and that correlations between hsTNT and perfusion parameters remained stable in a double-controlled partial correlation analysis.
In summary, this study found correlations between hsTNT and parameters of nerve perfusion obtained from 3T DCE MRN. The results indicate that hsTNT codifies a decrease in capillary permeability of peripheral nerves which is associated with a decrease in extravascular extracellular volume that ultimately causes demyelination as a result of nerve ischemia. Further longitudinal studies on the predictive value of hsTNT for the progression of DN, including the effects of age and BMI on nerve perfusion, are warranted.
Data Availability Statement
The raw data supporting the conclusions of this article will be made available by the authors, without undue reservation.
Ethics Statement
The studies involving human participants were reviewed and approved by Ethikkommission der Medizinischen Fakultät HeidelbergAlte Glockengießerei 11/169115 Heidelberg. The patients/participants provided their written informed consent to participate in this study.
Author Contributions
JMEJ Study design and coordination, organization of participants, collection of MR data, image segmentation, data analysis and interpretation, literature search, writing of manuscript, arrangement of figures. CM: Collection of MR data, data analysis and interpretation, literature search, writing of manuscript, arrangement of figures. ZK: Collection of clinical, electrophysiological, and serological data, organization of participants; LS: Collection of clinical, electrophysiological, and serological data, organization of participants; AJ: organization of participants, collection of MR data, data analysis; SH: Conception of MRN sequence protocol; PN: Study design and coordination; MB: Study design and coordination, development of MR sequence protocol, writing of manuscript; SK: Development of clinical and electrophysiological study protocol, collection of clinical, electrophysiological, and serological data; FTK Study design and coordination, programming of image analysis tools, image segmentation, data analysis and interpretation, literature search, writing of manuscript, arrangement of figures. All authors contributed to the article and approved the submitted version.
Funding
The German Research Foundation (DFG, SFB 1158), the Else Kröner-Fresenius-Stiftung (EKFS), and the International Foundation for Research in Paraplegia (Grant No. P179) provided financial support for personnel expenditure, MR imaging costs, and the technical equipment costs required for electrophysiological and serological analysis. The DFG, the EKFS, and the IRP had no influence on the study design, collection, and analysis of data or on the writing of the article.
Conflict of Interest
JJ received grants from the German Research Foundation (SFB 1158), the Else Kröner-Fresenius-Stiftung, and from the International Foundation for Research in Paraplegia (Grant No. P179). ZK received grants from the Deutsches Zentrum für Diabetesforschung (DZD) e.V. SH received a grant from the Dietmar Hopp foundation and the German Research Council (DFG, SFB 1118). MB received grants and personal fees from Codman, Guerbet, Bayer and Novartis, personal fees from Roche, Teva, Springer, Boehringer, Grifols, Braun and grants from the European Union, Siemens, the Dietmar Hopp foundation, Stryker and the German Research Council (DFG, SFB 1118 and 1158). FK was supported by the German Research Foundation (KU 3555/1-1), the Hoffmann-Klose foundation and a research grant from Heidelberg University Hospital.
The remaining authors declare that the research was conducted in the absence of any commercial or financial relationships that could be construed as a potential conflict of interest.
Publisher’s Note
All claims expressed in this article are solely those of the authors and do not necessarily represent those of their affiliated organizations, or those of the publisher, the editors and the reviewers. Any product that may be evaluated in this article, or claim that may be made by its manufacturer, is not guaranteed or endorsed by the publisher.
References
1. Alleman CJM, Westerhout KY, Hensen M, Chambers C, Stoker M, Long S, et al. Humanistic and Economic Burden of Painful Diabetic Peripheral Neuropathy in Europe: A Review of the Literature. Diabetes Res Clin Pract (2015) 109:215–25. doi: 10.1016/j.diabres.2015.04.031
2. Toth PP, Simko RJ, Palli SR, Koselleck D, Quimbo RA, Cziraky MJ. The Impact of Serum Lipids on Risk for Microangiopathy in Patients With Type 2 Diabetes Mellitus. Cardiovasc Diabetol (2012) 11:109–9. doi: 10.1186/1475-2840-11-109
3. Feldman EL, Nave K-A, Jensen TS, Bennett DLH. New Horizons in Diabetic Neuropathy: Mechanisms, Bioenergetics, and Pain. Neuron (2017) 93:1296–313. doi: 10.1016/j.neuron.2017.02.005
4. Shillo P, Sloan G, Greig M, Hunt L, Selvarajah D, Elliott J, et al. Painful and Painless Diabetic Neuropathies: What Is the Difference? Curr Diabetes Rep (2019) 19:32–2. doi: 10.1007/s11892-019-1150-5
5. Dyck PJ, Karnes J, O’Brien P, Nukada H, Lais A, Low P. Spatial Pattern of Nerve Fiber Abnormality Indicative of Pathologic Mechanism. Am J Pathol (1984) 117:225–38.
6. Dyck PJ, Lais A, Karnes JL, O’Brien P, Rizza R. Fiber Loss is Primary and Multifocal in Sural Nerves in Diabetic Polyneuropathy. Ann Neurol (1986) 19:425–39. doi: 10.1002/ana.410190503
7. Johnson BF, Nesto RW, Pfeifer MA, Slater WR, Vinik AI, Chyun DA, et al. Cardiac Abnormalities in Diabetic Patients With Neuropathy: Effects of Aldose Reductase Inhibitor Administration. Diabetes Care (2004) 27:448–54. doi: 10.2337/diacare.27.2.448
8. Tesfaye S, Chaturvedi N, Eaton SEM, Ward JD, Manes C, Ionescu-Tirgoviste C, et al. Vascular Risk Factors and Diabetic Neuropathy. N Engl J Med (2005) 352:341–50. doi: 10.1056/NEJMoa032782
9. Li Q, Ryan L, Sattar N, Chalmers J, Woodward M, Poulter N, et al. Do Cardiac Biomarkers NT-proBNP and Hstnt Predict Microvascular Events in Patients With Type 2 Diabetes? Results From the ADVANCE Trial. Diabetes Care (2014) 37:2202–10. doi: 10.2337/dc13-2625
10. Jende JME, Groener JB, Kender Z, Rother C, Hahn A, Hilgenfeld T, et al. Structural Nerve Remodeling at 3-T MR Neurography Differs Between Painful and Painless Diabetic Polyneuropathy in Type 1 or 2 Diabetes. Radiology (2020) 294:405–14. doi: 10.1148/radiol.2019191347
11. Jende JME, Kender Z, Mooshage C, Groener JB, Alvarez-Ramos L, Kollmer J, et al. Diffusion Tensor Imaging of the Sciatic Nerve as a Surrogate Marker for Nerve Functionality of the Upper and Lower Limb in Patients With Diabetes and Prediabetes. Front Neurosci (2021) 15:642589. doi: 10.3389/fnins.2021.642589
12. Jende JME, Groener JB, Kender Z, Hahn A, Morgenstern J, Heiland S, et al. Troponin T Parallels Structural Nerve Damage in Type 2 Diabetes: A Cross-Sectional Study Using Magnetic Resonance Neurography. Diabetes (2020) 69:713–23. doi: 10.2337/db19-1094
13. Kurz FT, Ziener CH, Rückl M, Hahn A, Sturm VJF, Zhang K, et al. The Influence of Spatial Patterns of Capillary Networks on Transverse Relaxation. Magn Reson Imaging (2017) 40:31–47. doi: 10.1016/j.mri.2017.03.012
14. Buschle LR, Ziener CH, Zhang K, Sturm VJF, Kampf T, Hahn A, et al. Vessel Radius Mapping in an Extended Model of Transverse Relaxation. Magn Reson Mater Phys (2018) 31:531–51. doi: 10.1007/s10334-018-0677-9
15. Hahn A, Bode J, Schuhegger S, Krüwel T, Sturm VJF, Zhang K, et al. Brain Tumor Classification of Virtual NMR Voxels Based on Realistic Blood Vessel-Induced Spin Dephasing Using Support Vector Machines. NMR Biomedi (2020) 35(4):e4307–7. doi: 10.1002/nbm.4307
16. Giron A, Cox C, MacKay B. Techniques for Imaging Vascular Supply of Peripheral Nerves. J Brachial Plex Peripher Nerve Inj (2021) 16:e24–30. doi: 10.1055/s-0041-1731280
17. Bäumer P, Reimann M, Decker C, Radbruch A, Bendszus M, Heiland S, et al. Peripheral Nerve Perfusion by Dynamic Contrast-Enhanced Magnetic Resonance Imaging: Demonstration of Feasibility. Invest Radiol (2014) 49:518–23. doi: 10.1097/RLI.0000000000000046
18. Sourbron SP, Buckley DL. On the Scope and Interpretation of the Tofts Models for DCE-MRI. Magn Reson Med (2011) 66:735–45. doi: 10.1002/mrm.22861
19. Xu Z, Zeng W, Sun J, Chen W, Zhang R, Yang Z, et al. The Quantification of Blood-Brain Barrier Disruption Using Dynamic Contrast-Enhanced Magnetic Resonance Imaging in Aging Rhesus Monkeys With Spontaneous Type 2 Diabetes Mellitus. NeuroImage (2017) 158:480–7. doi: 10.1016/j.neuroimage.2016.07.017
20. Vaeggemose M, Haakma W, Pham M, Ringgaard S, Tankisi H, Ejskjaer N, et al. Diffusion Tensor Imaging MR Neurography Detects Polyneuropathy in Type 2 Diabetes. J Diabetes its Complicat (2020) 34:107439. doi: 10.1016/j.jdiacomp.2019.107439
21. Young MJ, Boulton AJM, Macleod AF, Williams DRR, Onksen PHS. A Multicentre Study of the Prevalence of Diabetic Peripheral Neuropathy in the United Kingdom Hospital Clinic Population. Diabetologia (1993) 36:150–4. doi: 10.1007/BF00400697
22. Gibbons CH, Freeman R, Veves A. Diabetic Neuropathy. Diabetes Care (2010) 33:2629–34. doi: 10.2337/DC10-0763
23. Schindelin J, Arganda-Carreras I, Frise E, Kaynig V, Longair M, Pietzsch T, et al. Fiji: An Open-Source Platform for Biological-Image Analysis. Nat Methods (2012) 9:676–82. doi: 10.1038/nmeth.2019
24. Mattes D, Haynor DR, Vesselle H, Lewellen TK, Eubank W. PET-CT Image Registration in the Chest Using Free-Form Deformations. IEEE Trans Med Imaging (2003) 22:120–8. doi: 10.1109/TMI.2003.809072
25. Cheng H-LM, Wright GA. Rapid High-Resolution T(1) Mapping by Variable Flip Angles: Accurate and Precise Measurements in the Presence of Radiofrequency Field Inhomogeneity. Magn Reson Med (2006) 55:566–74. doi: 10.1002/mrm.20791
26. Chikui T, Obara M, Simonetti AW, Ohga M, Koga S, Kawano S, et al. The Principal of Dynamic Contrast Enhanced MRI, the Method of Pharmacokinetic Analysis, and Its Application in the Head and Neck Region. Int J Dentist (2012) 2012:1–10. doi: 10.1155/2012/480659
27. Shen Y, Goerner FL, Snyder C, Morelli JN, Hao D, Hu D, et al. T1 Relaxivities of Gadolinium-Based Magnetic Resonance Contrast Agents in Human Whole Blood at 1.5, 3, and 7 T. Invest Radiol (2015) 50:330–8. doi: 10.1097/RLI.0000000000000132
28. Starr JM. Increased Blood-Brain Barrier Permeability in Type II Diabetes Demonstrated by Gadolinium Magnetic Resonance Imaging. J Neurolog Neurosurg Psychiatry (2003) 74:70–6. doi: 10.1136/jnnp.74.1.70
29. Tofts PS, Brix G, Buckley DL, Evelhoch JL, Henderson E, Knopp MV, et al. Estimating Kinetic Parameters From Dynamic Contrast-Enhanced T(1)-Weighted MRI of a Diffusable Tracer: Standardized Quantities and Symbols. J Magn Reson Imaging (1999) 10:223–32. doi: 10.1002/(sici)1522-2586(199909)10:3<223::aid-jmri2>3.0.co;2-s
30. Lagarias JC, Reeds JA, Wright MH, Wright PE. Convergence Properties of the Nelder–Mead Simplex Method in Low Dimensions. SIAM J Optim. (1998) 9:112–47. doi: 10.1137/S1052623496303470
31. Padhani AR, Hayes C, Landau S, Leach MO. Reproducibility of Quantitative Dynamic MRI of Normal Human Tissues. NMR Biomed (2002) 15:143–53. doi: 10.1002/nbm.732
32. Faranesh AZ, Kraitchman DL, McVeigh ER. Measurement of Kinetic Parameters in Skeletal Muscle by Magnetic Resonance Imaging With an Intravascular Agent. Magn Reson Med (2006) 55:1114–23. doi: 10.1002/mrm.20884
33. Himeno T, Kamiya H, Nakamura J. Diabetic Polyneuropathy: Progress in Diagnostic Strategy and Novel Target Discovery, But Stagnation in Drug Development. J Diabetes Investig (2020) 11:25–7. doi: 10.1111/jdi.13188
34. Cameron NE, Eaton SE, Cotter MA, Tesfaye S. Vascular Factors and Metabolic Interactions in the Pathogenesis of Diabetic Neuropathy. Diabetologia (2001) 44:1973–88. doi: 10.1007/s001250100001
35. Østergaard L, Finnerup NB, Terkelsen AJ, Olesen RA, Drasbek KR, Knudsen L, et al. The Effects of Capillary Dysfunction on Oxygen and Glucose Extraction in Diabetic Neuropathy. Diabetologia (2015) 58:666–77. doi: 10.1007/s00125-014-3461-z
36. Jende JME, Kender Z, Morgenstern J, Renn P, Mooshage C, Juerchott A, et al. Fractional Anisotropy and Troponin T Parallel Structural Nerve Damage at the Upper Extremities in a Group of Patients With Prediabetes and Type 2 Diabetes – A Study Using 3t Magnetic Resonance Neurography. Front Neurosci (2022) 15:741494. doi: 10.3389/fnins.2021.741494
37. Chen S, Andary M, Buschbacher R, Del Toro D, Smith B, So Y, et al. Electrodiagnostic Reference Values for Upper and Lower Limb Nerve Conduction Studies in Adult Populations: AANEM Practice Topic. Muscle Nerve (2016) 54:371–7. doi: 10.1002/mus.25203
38. Aimo A, Januzzi JL, Vergaro G, Ripoli A, Latini R, Masson S, et al. High-Sensitivity Troponin T, NT-proBNP and Glomerular Filtration Rate: A Multimarker Strategy for Risk Stratification in Chronic Heart Failure. Int J Cardiol (2019) 277:166–72. doi: 10.1016/j.ijcard.2018.10.079
39. Jende JME, Groener JB, Rother C, Kender Z, Hahn A, Hilgenfeld T, et al. Association of Serum Cholesterol Levels With Peripheral Nerve Damage in Patients With Type 2 Diabetes. JAMA Network Open (2019) 2:e194798. doi: 10.1001/jamanetworkopen.2019.4798
40. Šimić S, Svaguša T, Prkačin I, Bulum T. Relationship Between Hemoglobin A1c and Serum Troponin in Patients With Diabetes and Cardiovascular Events. J Diabetes Metab Disord (2019) 18:693–704. doi: 10.1007/s40200-019-00460-9
41. Jende JME, Kender Z, Rother C, Alvarez-Ramos L, Groener JB, Pham M, et al. Diabetic Polyneuropathy Is Associated With Pathomorphological Changes in Human Dorsal Root Ganglia: A Study Using 3t MR Neurography. Front Neurosci (2020) 14:570744. doi: 10.3389/fnins.2020.570744
42. Seneviratne KN. Permeability of Blood Nerve Barriers in the Diabetic Rat1. J Neurol Neurosurg Psychiatry (1972) 35:156–62. doi: 10.1136/jnnp.35.2.156
Keywords: diabetic neuropathy, magnetic resonance neurography, dynamic contrast enhancement, perfusion, troponin T
Citation: Jende JME, Mooshage C, Kender Z, Schimpfle L, Juerchott A, Nawroth P, Heiland S, Bendszus M, Kopf S and Kurz FT (2022) Troponin T Is Negatively Associated With 3 Tesla Magnetic Resonance Peripheral Nerve Perfusion in Type 2 Diabetes. Front. Endocrinol. 13:839774. doi: 10.3389/fendo.2022.839774
Received: 20 December 2021; Accepted: 29 March 2022;
Published: 10 May 2022.
Edited by:
Charumathi Sabanayagam, Singapore Eye Research Institute (SERI), SingaporeReviewed by:
Hiroyuki Nodera, Tenri Hospital, JapanAixia Sun, Michigan State University, United States
Copyright © 2022 Jende, Mooshage, Kender, Schimpfle, Juerchott, Nawroth, Heiland, Bendszus, Kopf and Kurz. This is an open-access article distributed under the terms of the Creative Commons Attribution License (CC BY). The use, distribution or reproduction in other forums is permitted, provided the original author(s) and the copyright owner(s) are credited and that the original publication in this journal is cited, in accordance with accepted academic practice. No use, distribution or reproduction is permitted which does not comply with these terms.
*Correspondence: Felix T. Kurz, ZmVsaXgua3VyekBtZWQudW5pLWhlaWRlbGJlcmcuZGU=