 Xiaotong Li
 Bo Li
Bo Li- Department of Epidemiology and Biostatistics, School of Public Health, Jilin University, Changchun, China
Objective: The purpose of this study was to evaluate the association between triglyceride glucose (TyG) index and new-onset diabetes under different glycemic states and to compare the predictive value of TyG−related parameters, obesity indices, and lipid ratios for new-onset diabetes.
Methods: Data were collected from the China Health and Retirement Longitudinal Study (CHARLS), consisting of 6,258 participants aged ≥45 years. Participants were grouped according to their glycemic states. Cox proportional hazards models and restricted cubic spline regression were used to explore the association between TyG index and diabetes. Cox proportional hazard models were applied to confirm the predictive value of the optimal marker. Receiver operating characteristic (ROC) curves were used to compare the predictive value.
Results: TyG index was positively correlated with the risk of diabetes (hazard ratio (HR), 1.75; 95% confidence interval (CI), 1.56–1.97), and the linear association existed (p < 0.001). The highest correlation with diabetes was visceral adiposity index (VAI) (HR, 2.04; 95% CI, 1.44–2.90) in normal fasting glucose (NFG) group and TyG-body mass index (TyG-BMI) (HR, 2.53; 95% CI, 1.97–3.26) in impaired fasting glucose (IFG) group. The largest area under curve (AUC) was observed in TyG-waist-to-height ratio (TyG-WHtR) in the NFG group (AUC, 0.613; 95% CI, 0.527–0.700), and TyG-BMI had the highest AUC in the IFG group (AUC, 0.643; 95% CI, 0.601–0.685).
Conclusion: The association between TyG index and new-onset diabetes was positive and linear. TyG-WHtR was a clinically effective marker for identifying the risks of diabetes in the NFG group and TyG-BMI was an effective marker to predict diabetes in the IFG group.
Introduction
The increasing prevalence of diabetes has become a major public health problem worldwide, especially in developing countries (1). According to the latest diabetes map released by the International Diabetes Federation (IDF) in 2021, the number of people with diabetes worldwide will grow to 783 million by 2045, and China’s diabetes population has reached 140 million in 2021, ranking first in the world (2). Effective screening strategy is essential for identifying high-risk groups and reducing the incidence rate of diabetes.
The occurrence of diabetes can be predicted by relevant indicators (3–5). Insulin resistance (IR) plays an important role in the pathogenesis of diabetes and other metabolic-related diseases, which has already appeared before diabetes diagnosis (6, 7). Visceral obesity and ectopic fat deposition associated with IR lead to dyslipidemia and inflammation (8), which accelerated the development of diabetes. IR could be diagnosed by hyperinsulinemic-euglycemic clamp test (9) and homeostasis model assessment of IR (HOMA-IR) (10). However, it was inefficient for whole population screening due to the complex and expensive test process. Therefore, new markers or risk factors were needed to identify people at high risk of diabetes in order to implement prevention measures in the population.
In recent years, several studies have proposed new indicators for predicting diabetes, such as visceral adiposity index (VAI), a model based on anthropometry and laboratory parameters, and lipid accumulation product (LAP), based on the combination of TG and WC, which can be used to predict metabolic syndrome (11, 12). Triglyceride glucose (TyG) index and its related parameters were shown to be related to diabetes (13). However, the association between TyG index at different levels and diabetes was still inconsistent. A cohort study pointed out that there was a nonlinear relationship between the TyG index and incident T2DM (4). Studies have also indicated that total cholesterol (TC)/high-density lipoprotein cholesterol (HDL-C) and triglyceride (TG)/HDL-C can detect IR more effectively than simple lipid method (14). Some studies evaluated and compared the predictive value of TyG index, VAI, and LAP for new-onset diabetes (15–17), as well as the accuracy of the predictive value of various physical measurement indicators (3), but the conclusions of these studies were different for the best predictor of new-onset diabetes. No previous study specifically and comprehensively compared the accuracy of TyG-related parameters and these indicators in predicting the onset of diabetes, which should be verified in different ethnic groups. A study in China found that the incidence of diabetes in subjects with impaired fasting glucose (IFG) was more than six times higher than subjects with normal fasting glucose (NFG) (18). Therefore, the baseline blood glucose status of the population might also affect the accuracy of these indicators in predicting new-onset diabetes.
The aim of this study was to evaluate the correlation between TyG index and the risk of diabetes and to compare the predictive ability of TyG, TyG-body mass index (TyG-BMI), TyG-waist circumference (TyG-WC), TyG-waist-to-height ratio (TyG-WHtR), VAI, LAP, TG/HDL-C, and TC/HDL-C for the risk of new-onset diabetes under different glycemic states at follow-up in middle-aged and elderly Chinese population.
Materials and Methods
Study Population
The data used in this study were obtained from the China Health and Retirement Longitudinal Study (CHARLS), which was a longitudinal data of middle-aged and elderly people in China. The baseline wave of the study was conducted between June 2011 and March 2012, covered 28 provinces, 17,708 participants, with a response rate of 80.5%. Information on demographic, socioeconomic status, and health status of participants was collected using computer-assisted personal interview (CAPI) techniques. Follow-up surveys were conducted every 2 to 3 years, and so far, a second (2013), third (2015), and fourth (2018) wave have been conducted, of which blood samples were only collected from the baseline and third wave. The population that we included was no diabetes at baseline and followed up at least once. A total of 6,258 participants were included after removing the subjects with missing information on TG, TC, fasting blood glucose (FBG), hemoglobin A1c (HbA1c), HDL-C, and LDL-C at baseline or missing basic demographic characteristics and age <45 years (Figure 1).
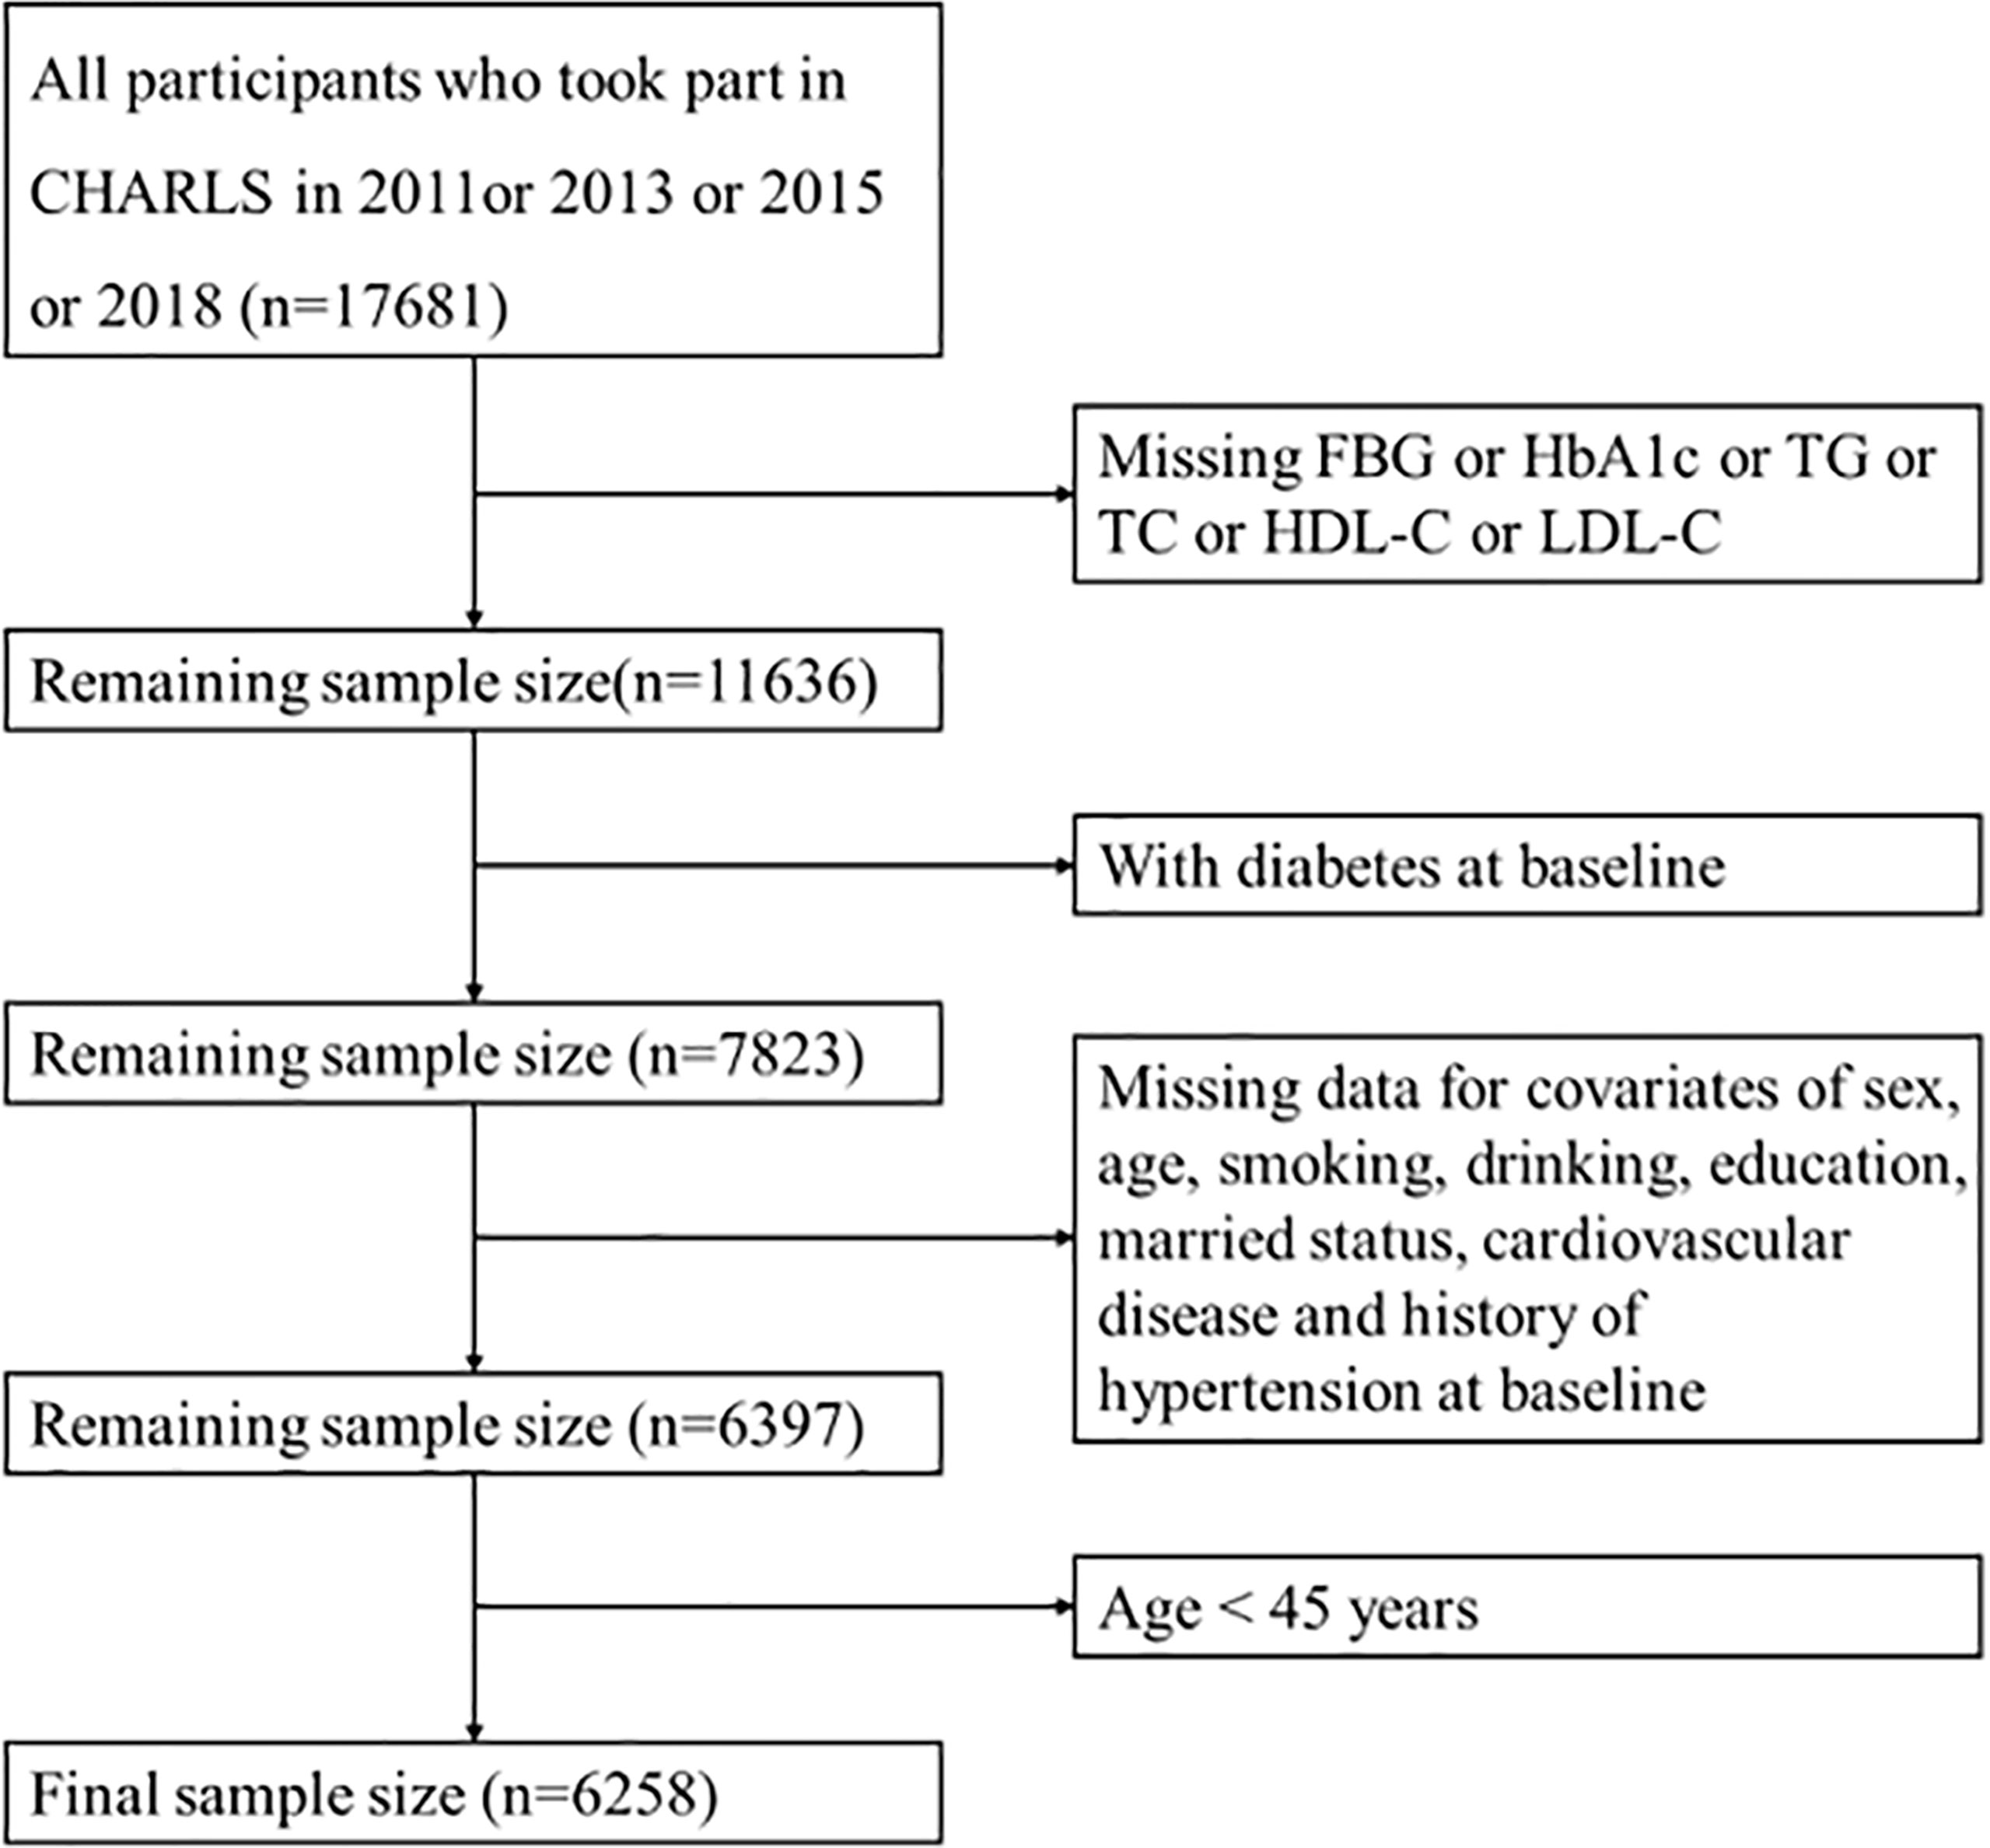
Figure 1 Flow chart of study participants.
All respondents were required to sign informed consent, and the ethical approval for data collection in CHARLS was approved by The Biomedical Ethics Review Committee of Peking University (IRB00001052-11015). The use of CHARLS data obtained ethical approval from the Human Research Ethics Committee of the University of Newcastle (H-2015-0290).
Definition of Diabetes
Diabetes was defined as having FBG >125 mg/dl, HbA1c >6.5%, previous diagnosis of new-onset diabetes, or use of antidiabetic medications. IFG was defined as FBG of 100–125 mg/dl or HbA1c of 5.7%–6.4%. NFG was defined as without diabetes or prediabetes.
Anthropometric Measurements and Serum Biochemical Parameters
Anthropometric measurements were performed by trained staff. Weight was quantified without shoes to the nearest 0.1 kg, vertical height meter was used to measure the height, and the measurement was accurate to 0.1 cm. Waist circumference was measured horizontally around the subject at the umbilical position and to the nearest 0.1 cm. Venous blood was collected on an empty stomach and transported by a cold-chain transport company to the Chinese Center for Disease Control and Prevention in Beijing. FBG, HbA1c, TG, TC, and HDL-C were measured by trained staff. The obesity- and TyG-related indices were calculated using the following formula:
(1) WHtR = WC/height.
With WC in centimeters, and height in centimeters (19).
(2) VAI (men) = [WC/39.68 + (1.88 × BMI)] × (TG/1.03) × (1.31/HDL-C).
VAI (women) = [WC/36.58 + (1.89 × BMI)] × (TG/0.81) × (1.52/HDL-C).
With WC in centimeters, BMI in kilograms per square meter, TG and HDL-C both in millimoles per liter (20).
(3) LAP (men) = [WC − 65] × TG.
LAP (women) = [WC − 58] × TG.
With WC in centimeters and TG in millimoles per liter (21).
(4) TyG = Ln [(TG × FBG)/2].
With TG and FBG both in milligrams per deciliter (22).
(5) TyG-BMI = TyG × BMI. TyG-WC = TyG × WC. TyG-WHtR = TyG × WHtR (23).
Other Covariates
Through face-to-face questionnaire, the participants’ sex, age, smoking, drinking, educational level, marital status, history of hypertension, cardiovascular disease, and other information were obtained.
Statistical Analysis
Data for quantitative variables were expressed as mean ± standard deviation (SD), and Student’s t-test was used for comparison between the two groups. Data for qualitative variables were expressed as numbers (percentage) and were compared using Pearson’s Chi-square test. Grouped by glycemic status at baseline, the cumulative incidence of each group was estimated by Kaplan–Meier method and compared by log-rank test. Participants were divided into four groups (Q1, Q2, Q3, Q4) based on the quartile of TyG, with quartile 1 as the reference group. Cox proportional hazards models were used to evaluate the association between the TyG index and new-onset diabetes. Model 2 was adjusted for age. Model 3 was adjusted for variables in model 2 plus drinking, education, hypertension, and cardiovascular disease. The dose–response association between the TyG index and the risk of diabetes was examined by restricted cubic spline model after adjustment for potential confounding factors. In order to compare the diagnostic value of different indicators for new-onset diabetes, four categories of TyG-BMI, TyG-WC, TyG-WHtR, VAI, LAP, TG/HDL-C, and TC/HDL-C were used as independent variables to calculate hazard ratio (HR) and 95% confidence interval (CI). The area under the receiver operating characteristic (ROC) curve (AUC) was used to test the predictive power of TyG, TyG-BMI, TyG-WC, TyG-WHtR, VAI, LAP, TG/HDL-C, and TC/HDL-C at baseline for the risk of emerging diabetes at follow-up. p < 0.05 was considered statistically significant. R Version 4.1.1 (R Foundation for Statistical Computing, Vienna, Austria) was used for all statistical analysis.
Results
Baseline Characteristics of Study Participants
A total of 6,258 participants were included in the study, of whom 858 developed diabetes at follow-up. Table 1 summarized the baseline characteristics of participants based on glycemic status and diabetes status at follow-up. The average age of the whole cohort was 58.51 years old and men accounted for 45.2%. In different glycemic status groups, compared with people without diabetes, participants with diabetes were older, had higher levels of TG, HDL-C, TyG, TyG-BMI, TyG-WC, TyG-WHtR, VAI, LAP, TG/HDL-C, and TC/HDL-C (p < 0.05), and were more likely to have hypertension (p < 0.001). In participants with normal blood glucose at baseline, no diabetes group had higher education level than the diabetes group (p = 0.022). In participants with impaired fasting glucose at baseline, the diabetes group was more likely to have cardiovascular disease (p = 0.003). During follow-up, the incidence of diabetes was 9.4% in the NFG and 17.6% in the IFG. As shown in Figure 2, Kaplan–Meier curves showed significant differences in the cumulative incidence of diabetes between baseline glucose states (log-rank test, p < 0.001), and those with higher glucose had a greater risk of diabetes over time.
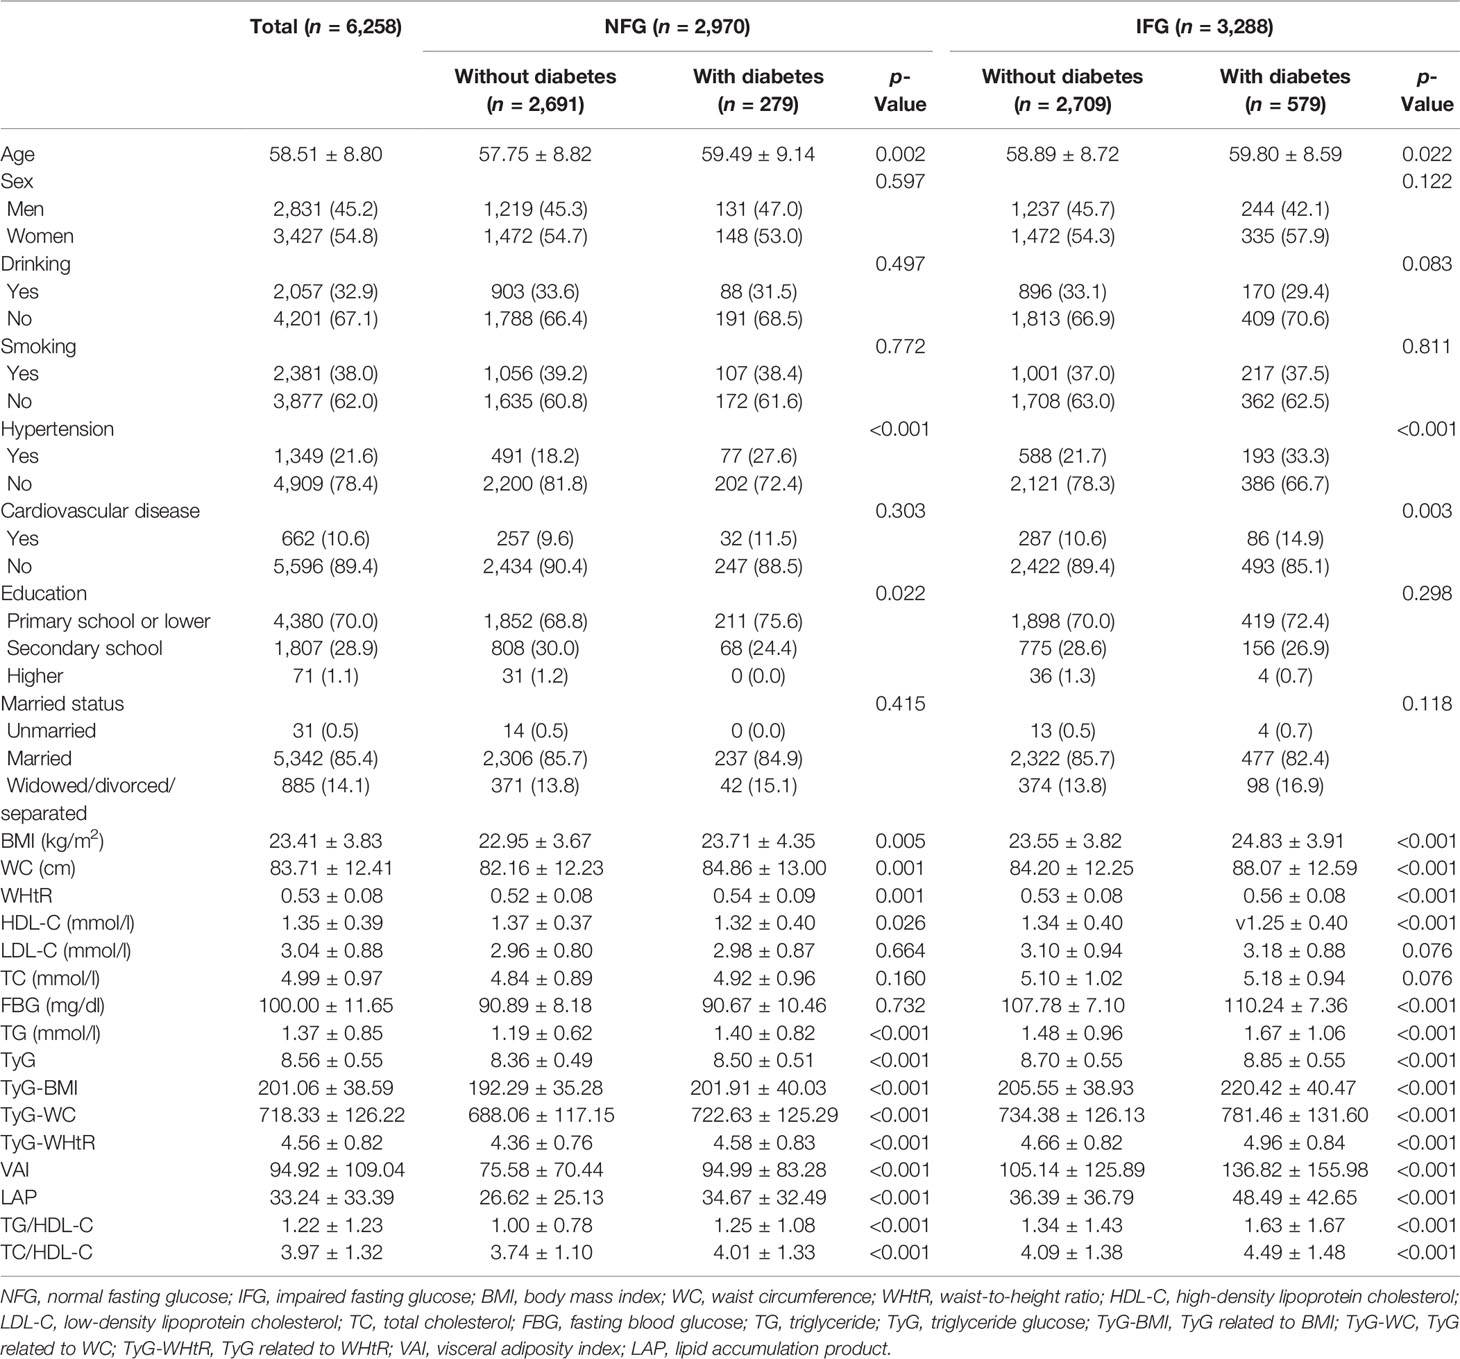
Table 1 Demographic and clinical characteristics of the participants by glycemic status and diabetes status at follow-up.
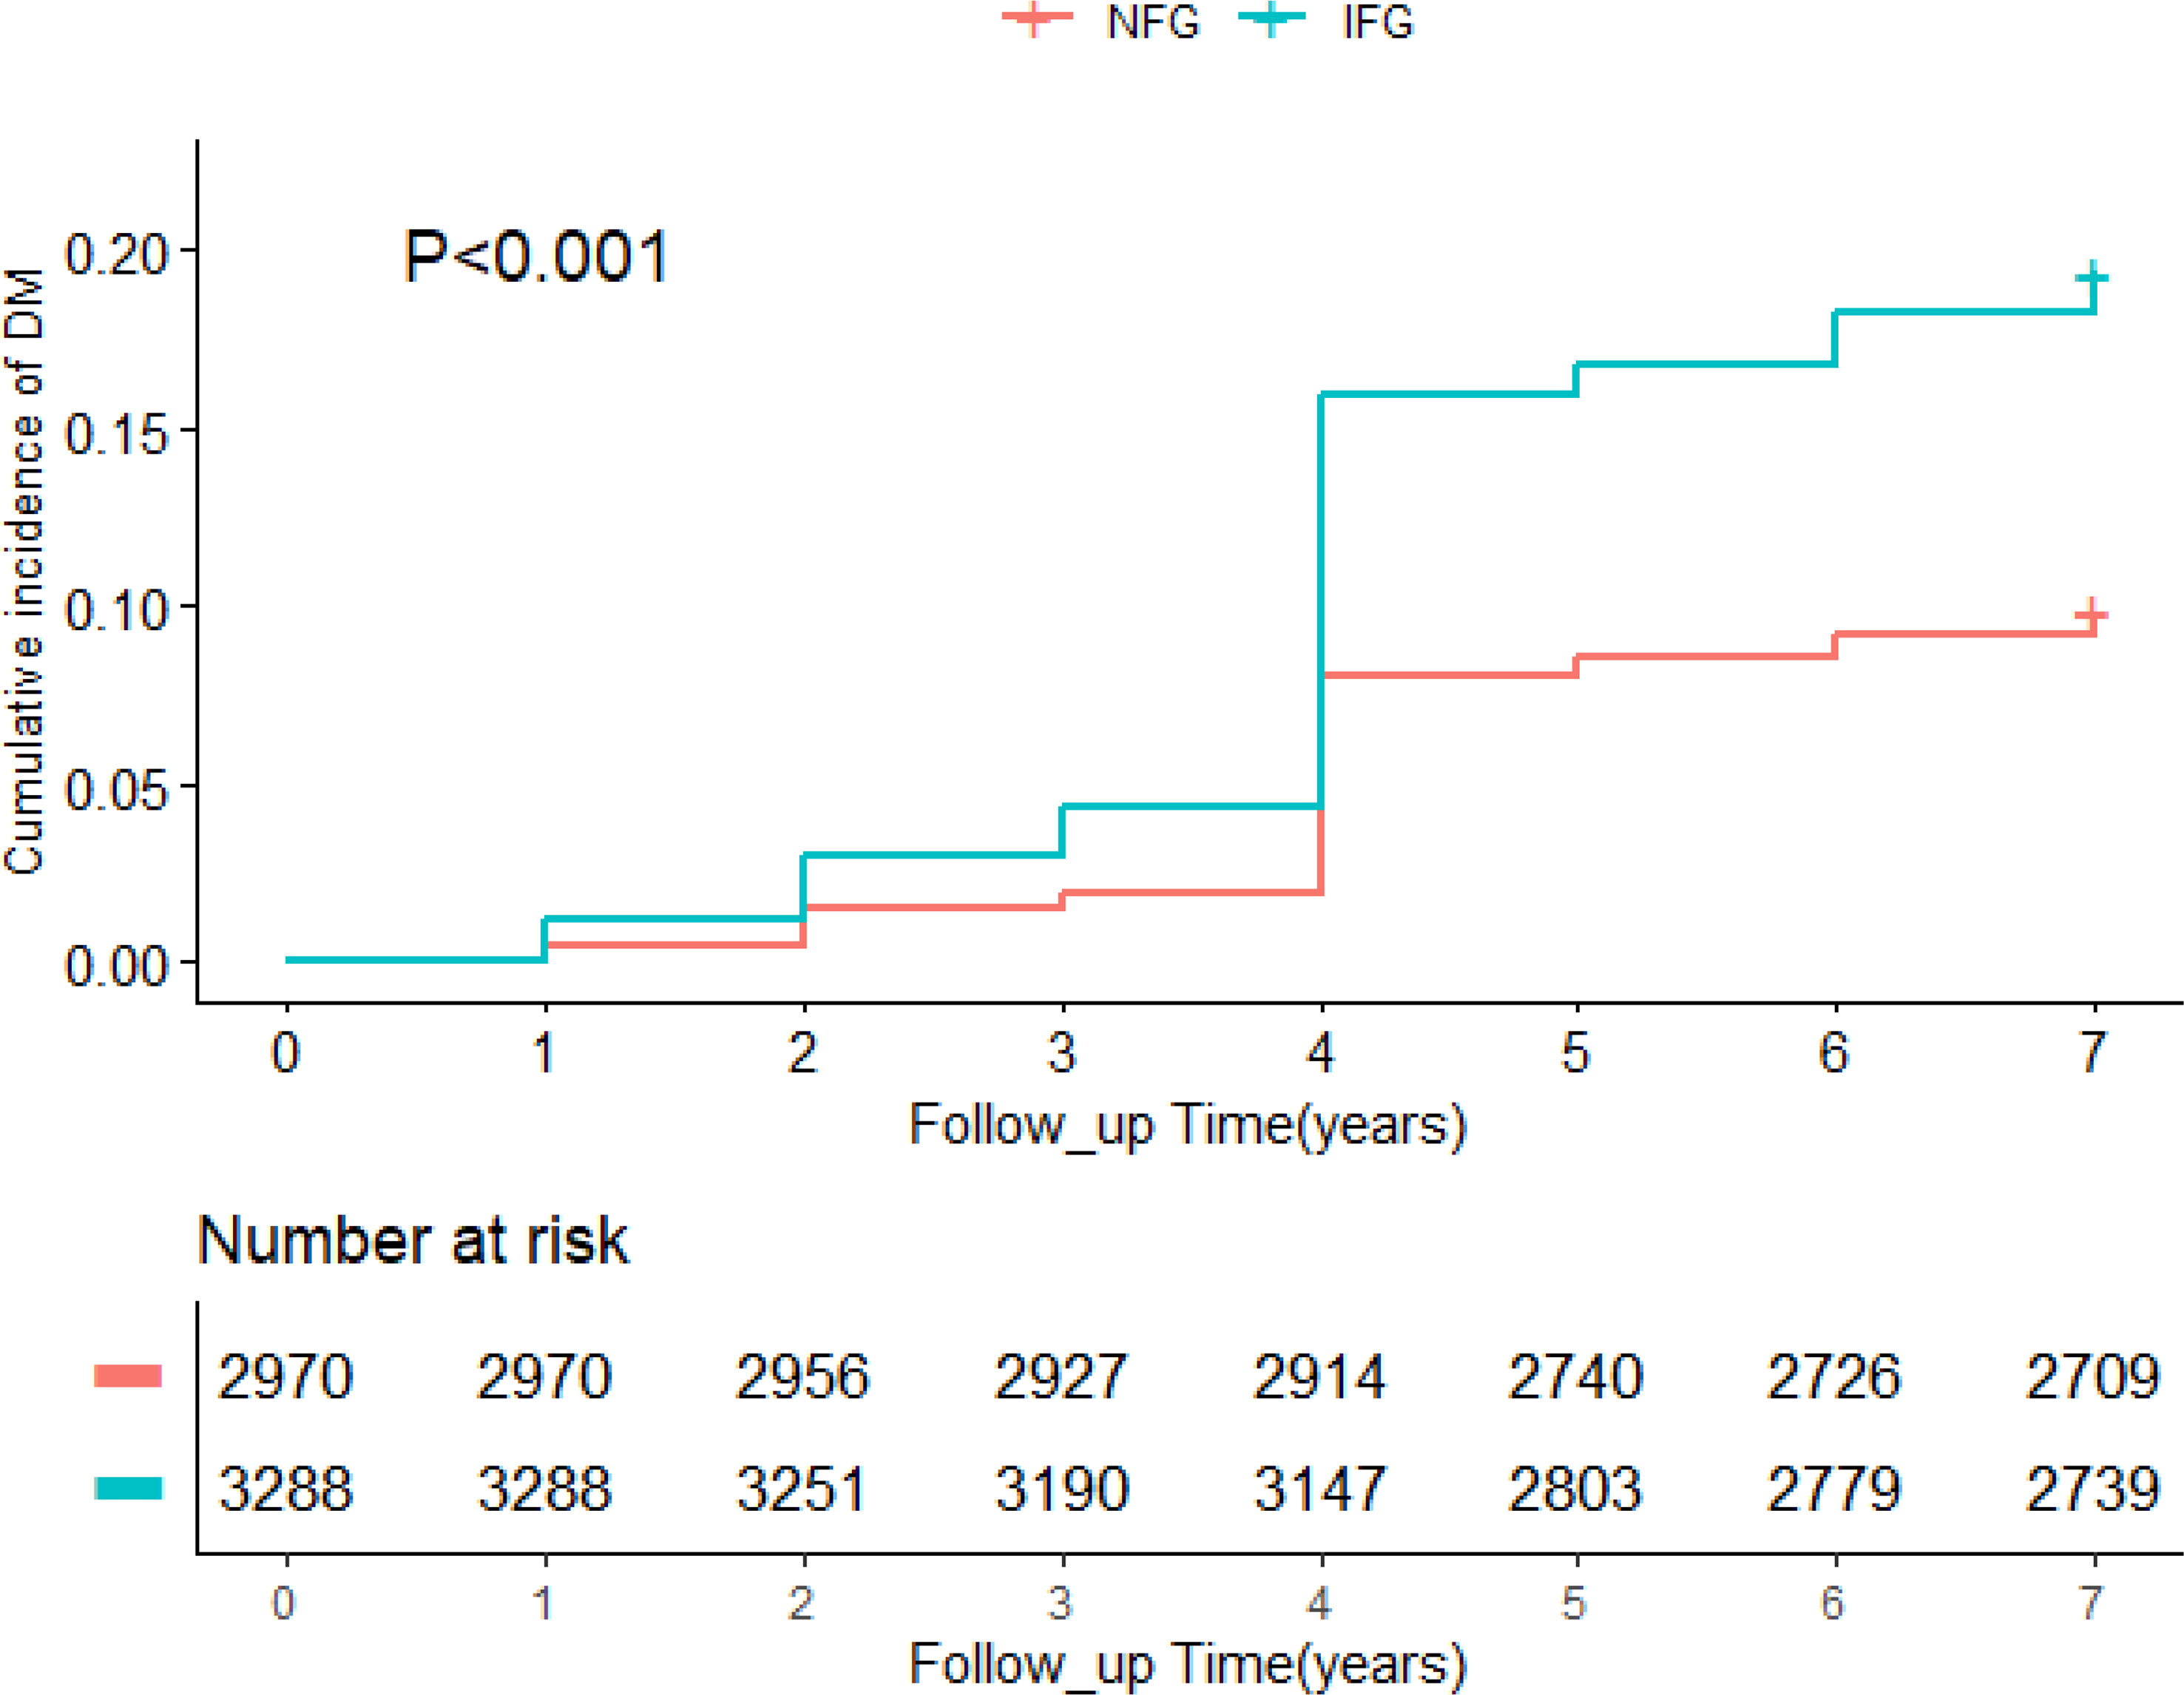
Figure 2 Kaplan–Meier analysis showing cumulative incidence of diabetes.
Relation Between TyG Index and Incident Diabetes
The univariate and multivariate analyses of TyG index with the incidence of diabetes are shown in Table 2. After adjusting for age, drinking, education, hypertension, and cardiovascular disease, TyG index was positively correlated with the risk of diabetes (HR, 1.75; 95% CI, 1.56–1.97) in the whole population, which was the same as the NFG and IFG groups. In order to verify the influence of different TyG levels on diabetes, we classified TyG index into quartiles. Compared with the lowest quartile, Q3 (HR, 1.93; 95% CI, 1.57–2.37) and Q4 (HR, 2.31; 95% CI, 1.89–2.82) had a significantly higher risk of developing diabetes. After adjusting for the potential confounding factors, the correlation still existed. The risk of diabetes in the highest quartile in the different glycemic status groups was 1.78 (95% CI: 1.28–2.49) and 2.00 (95% CI: 1.62–2.62). After adjusting for covariates, the statistical significance remained. In the restricted cubic spline regression model, the association between TyG index and the risk of diabetes was linear (nonlinear p-value >0.05) (Table 2 and Figure 3).
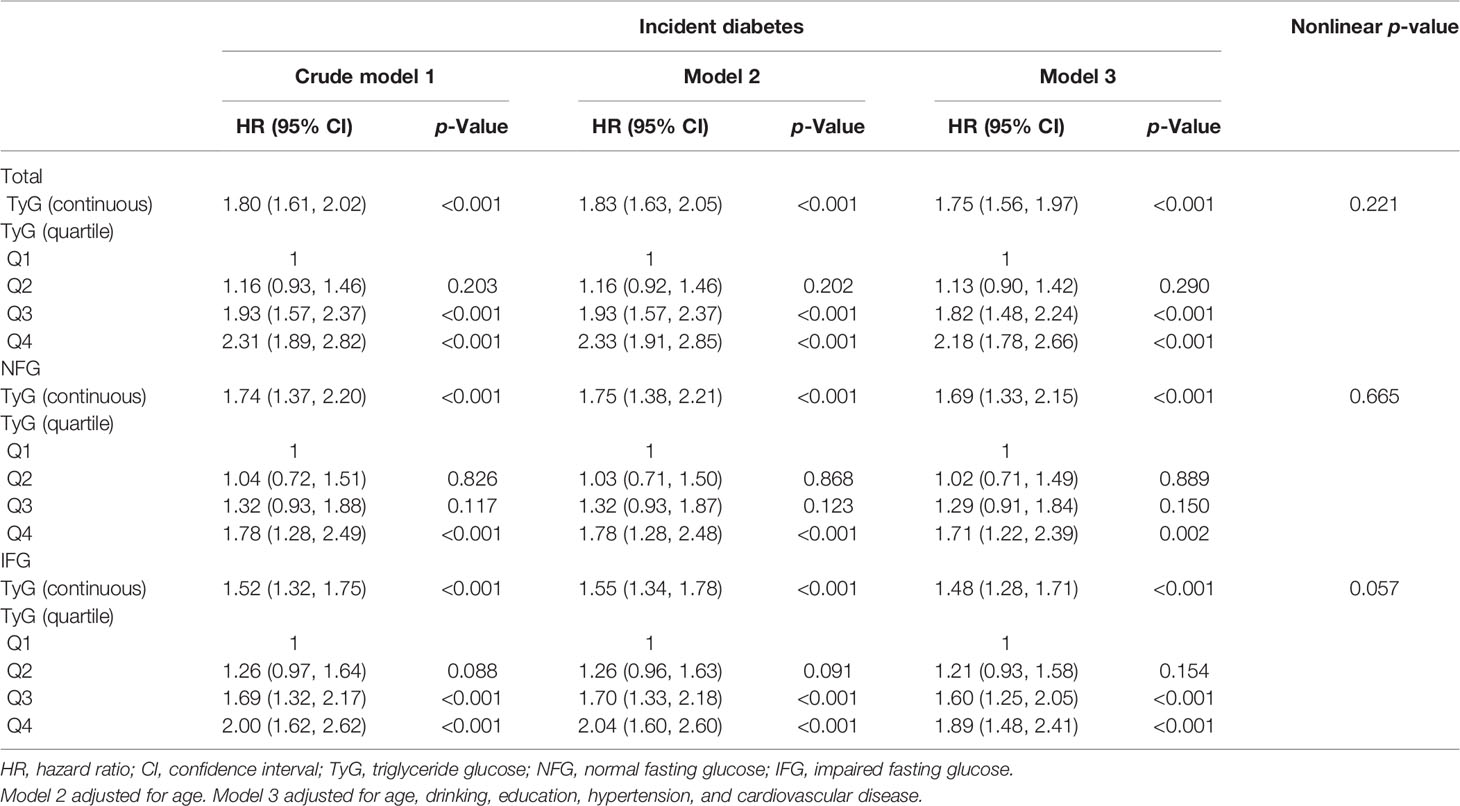
Table 2 Cox proportional hazard models for the association between TyG index and incident diabetes.

Figure 3 Adjusted cubic spline model of the association between triglyceride glucose index and risk of new-onset diabetes. NFG, normal fasting glucose; IFG, impaired fasting glucose; TyG, triglyceride glucose.
Associations of Indicators With Incident Diabetes
After stratification by glycemic status and adjusting for the influence of potential confounding factors, the results are shown in Tables 3, 4. In the NFG group, compared with the lowest four percentiles, the Q4 of TyG-BMI, TyG-WC, TyG-WHtR, VAI, LAP, TG/HDL-C, and TC/HDL-C was correlated with the incidence of diabetes (p < 0.05), and VAI (HR, 2.04; 95% CI, 1.44–2.90) had the highest influence on the risk of diabetes. In the IFG group, compared with the lowest four percentiles, the Q3 and Q4 of TyG-BMI, TyG-WC, TyG-WHtR, VAI, LAP, TG/HDL-C, and TC/HDL-C were correlated with the incidence of diabetes(p < 0.05), and TyG-BMI (HR, 2.53; 95% CI, 1.97–3.26) had the highest influence on the risk of diabetes.
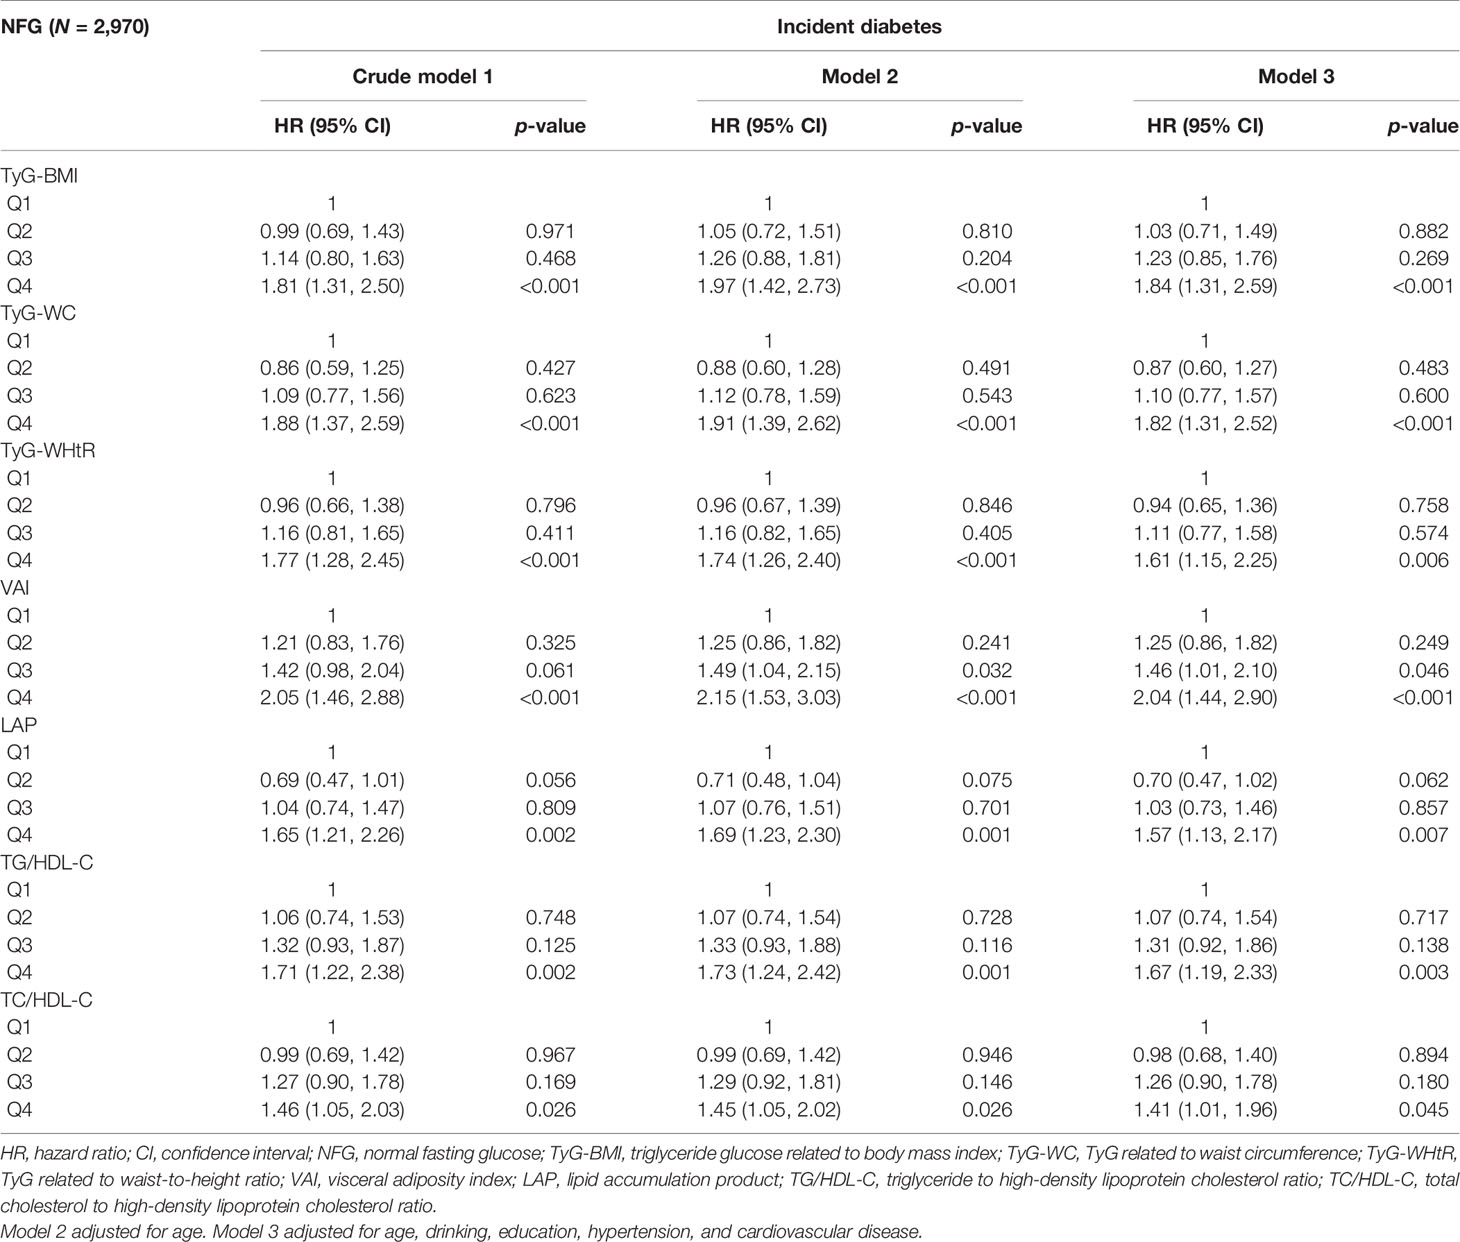
Table 3 Adjusted HR and 95% CI in quartiles of each index in the NFG group.
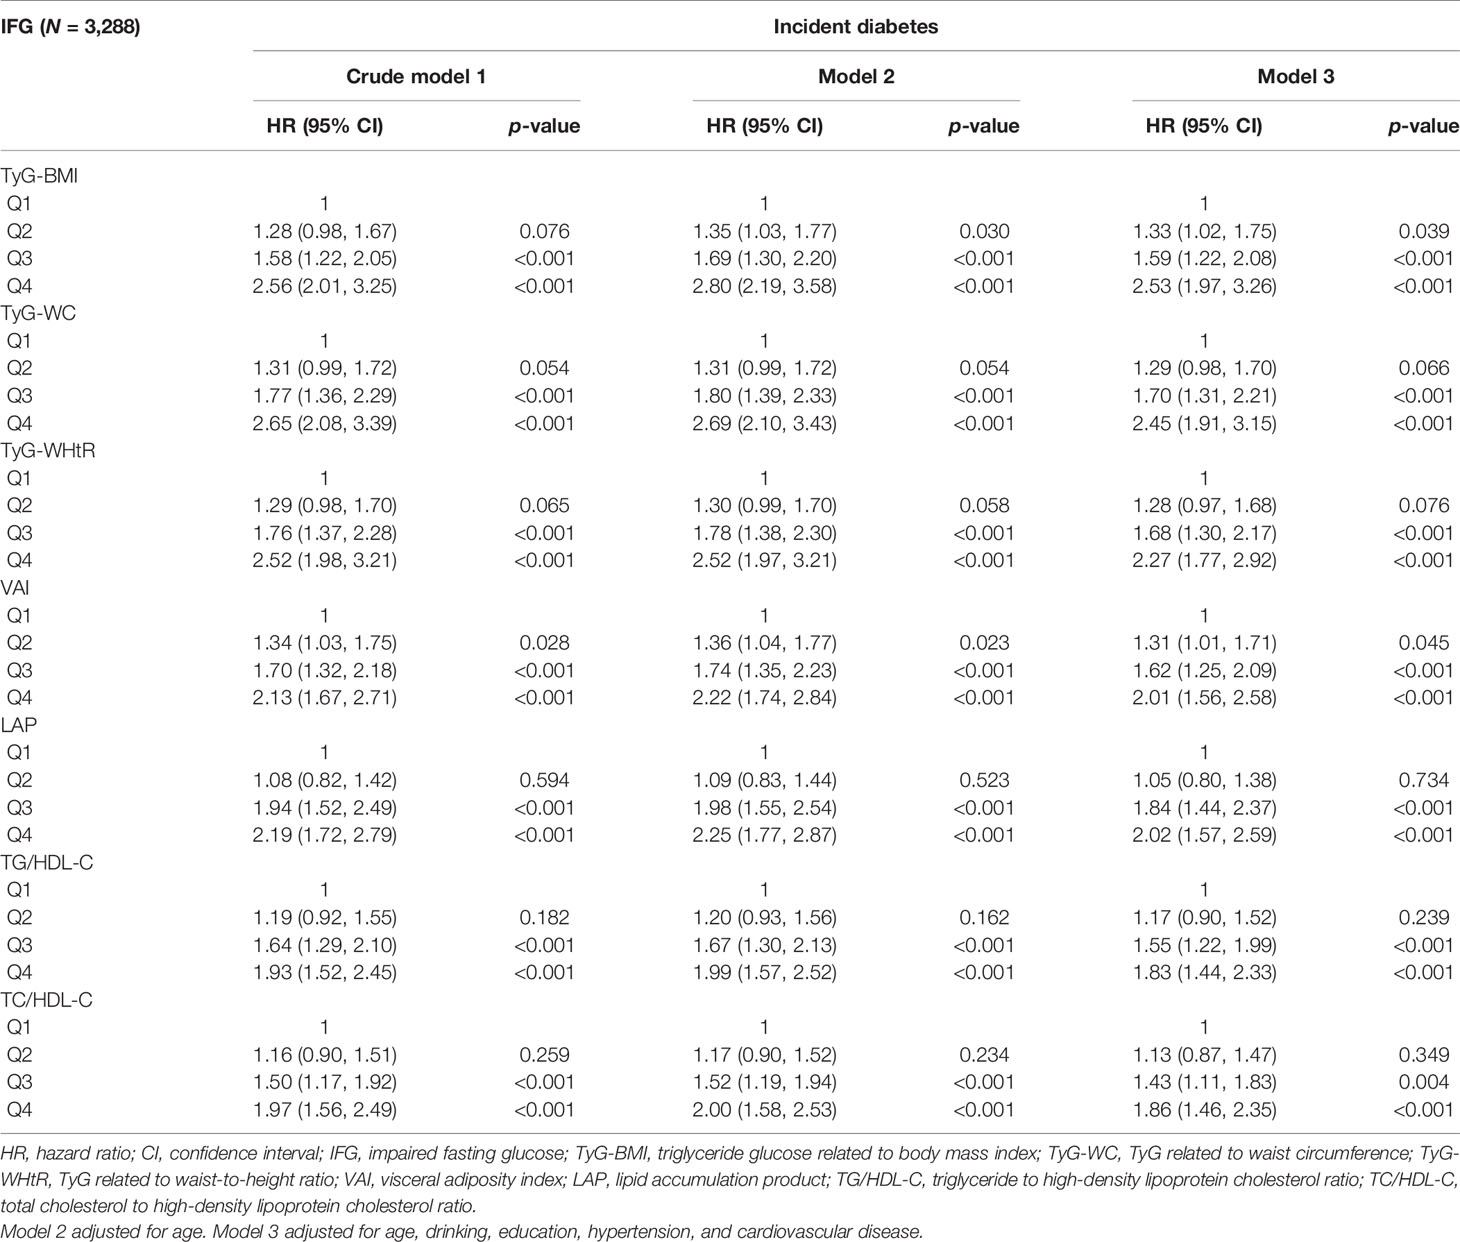
Table 4 Adjusted HR and 95% CI in quartiles of each index in the IFG group.
The Predictive Value of Each Index for Diabetes
ROC curves for different indices are presented in Figure 4. The cutoff value and AUC with sensitivity, specificity, and Youden index are presented in Table 5. In the whole study population, TyG-WHtR had the highest AUC (AUC, 0.658; 95% CI, 0.619–0.696), followed by TyG-BMI (AUC, 0.644; 95% CI, 0.605–0.682) and TyG-WC (AUC, 0.642; 95% CI, 0.603–0.682). The optimal cutoff of TyG-WHtR, TyG-BMI, and TyG-WC were 4.99, 209.89, and 764.61. After stratifying based on the level of blood glucose, TyG-WHtR (AUC, 0.613; 95% CI, 0.527–0.700) had the highest diagnostic value in the NFG group, followed by LAP (AUC, 0.601; 95% CI, 0.528–0.684) and TyG-WC (AUC, 0.585; 95% CI, 0.499–0.671). However, in the IFG group, TyG-BMI (AUC, 0.643; 95% CI, 0.601–0.685) had the highest diagnostic value for diabetes, followed by TyG-WHtR (AUC, 0.639; 95% CI, 0.596–0.682) and TyG-WC (AUC, 0.630; 95% CI, 0.586–0.674).
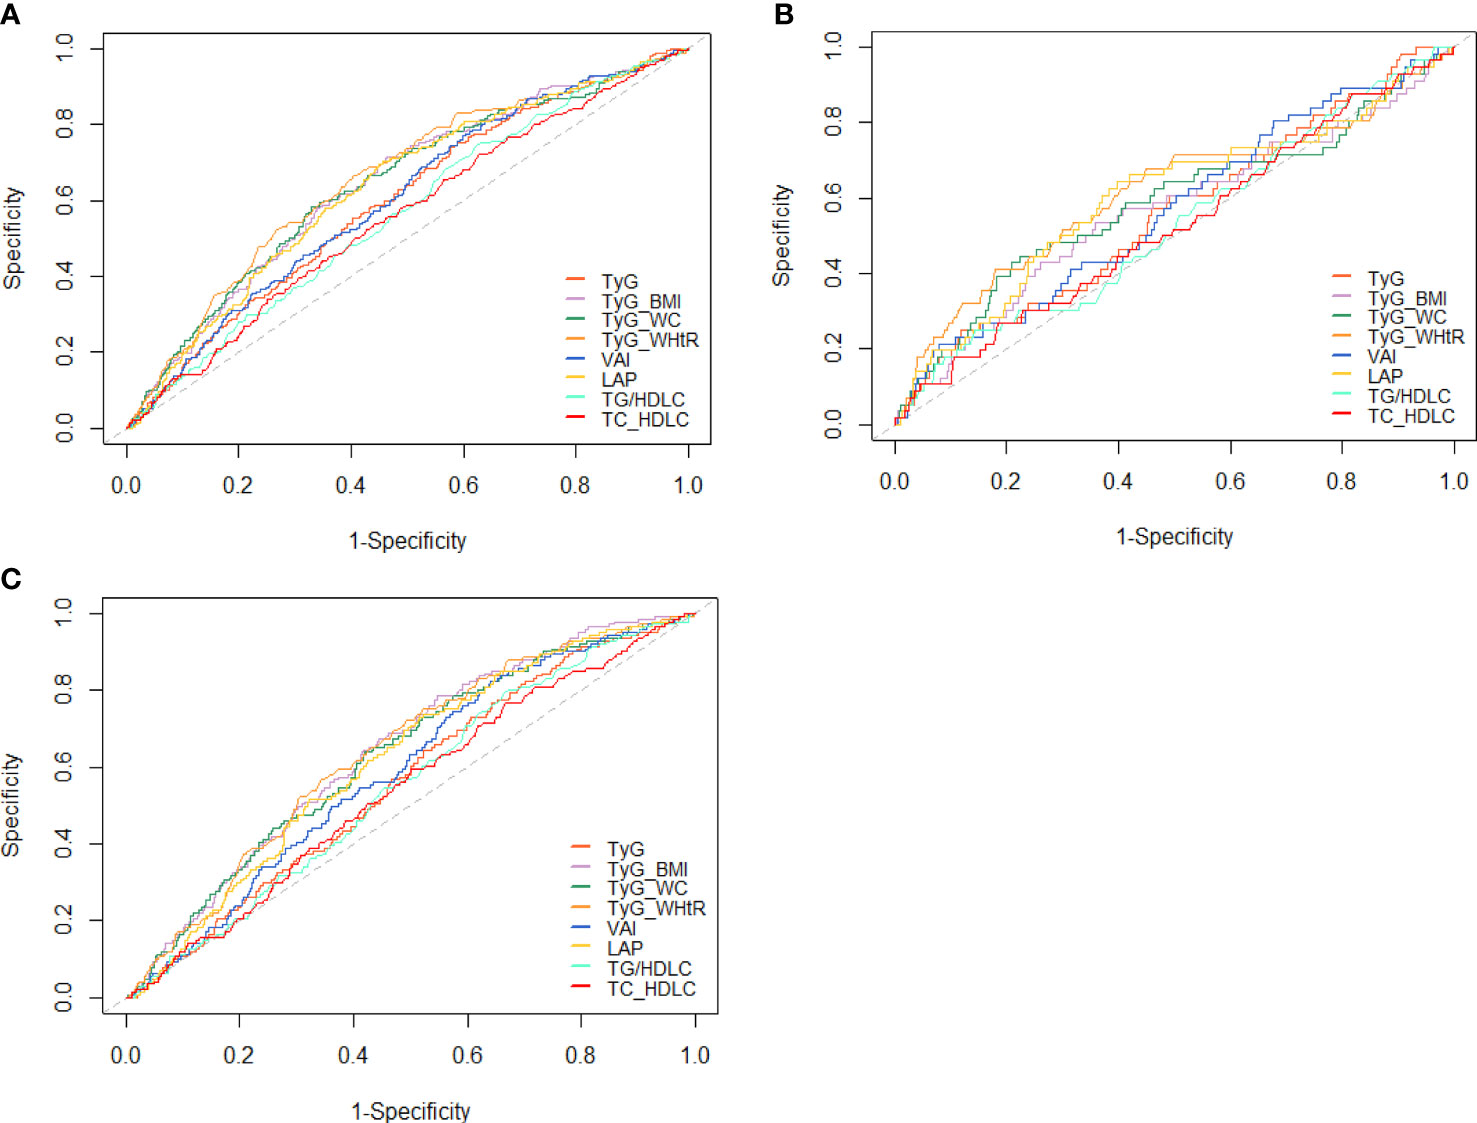
Figure 4 ROC curves for each index as predictors of diabetes. (A) Whole cohort, (B) NFG, and (C) IFG. ROC, receiver-operating characteristic; TyG, triglyceride glucose; TyG-BMI, TyG related to body mass index; TyG-WC, TyG related to waist circumference; TyG-WHtR, TyG related to waist-to-height ratio; VAI, visceral adiposity index; LAP, lipid accumulation product; TG/HDL-C, triglyceride to high-density lipoprotein cholesterol ratio; TC/HDL-C, total cholesterol to high-density lipoprotein cholesterol ratio.
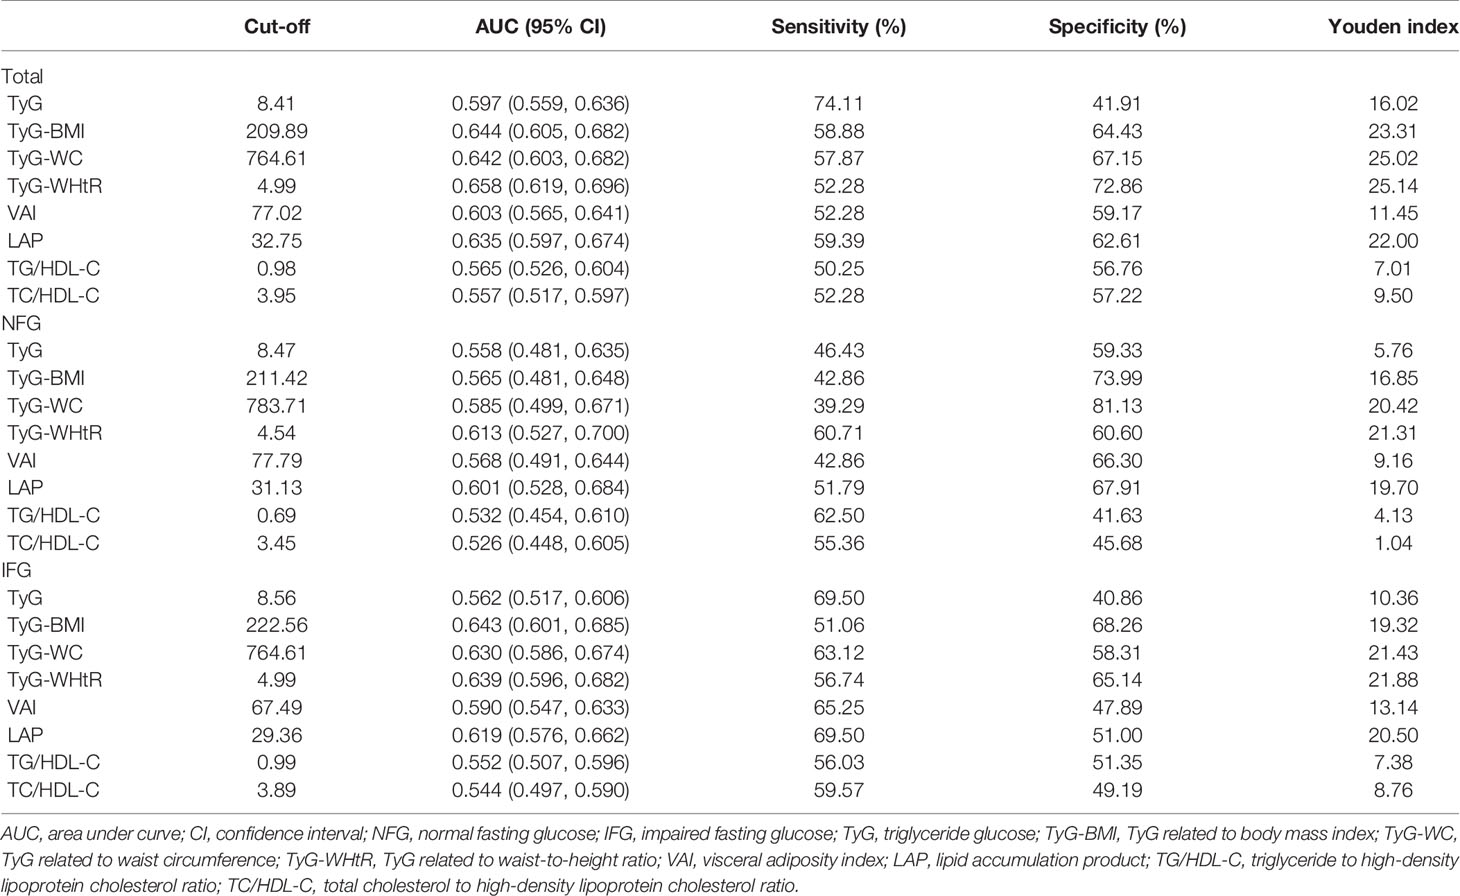
Table 5 Sensitivity, specificity, Youden index, cutoff points, and AUC (95% CI) for each index in predicting diabetes risk among adults in China.
Subgroup Analyses
Table 6 shows the results stratified by age. The predictive value of TyG-WHtR for new-onset diabetes was highest among participants aged <65 years. The predictive value of all indicators for new-onset diabetes was generally low in the NFG participants aged ≥65 years. TyG-BMI had the highest predictive value for new-onset diabetes among participants aged ≥65 years in the IFG group.
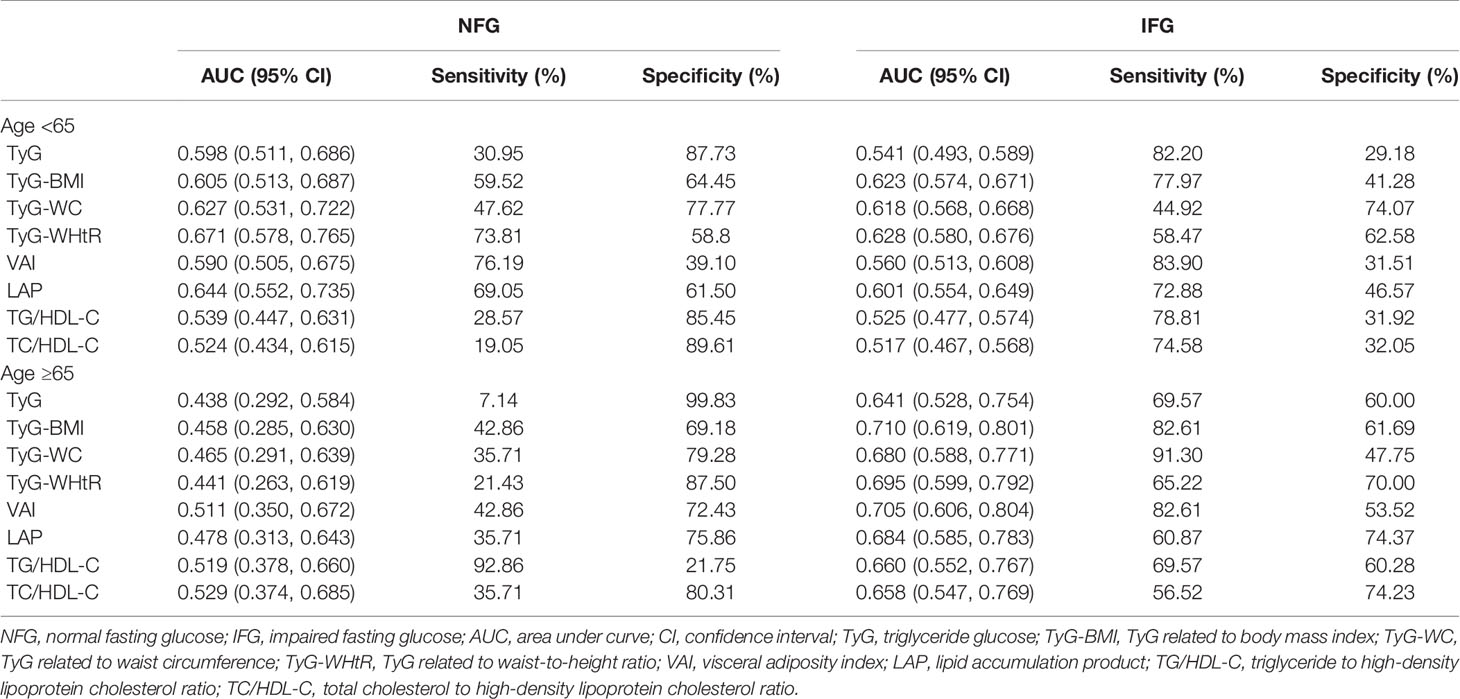
Table 6 Sensitivity, specificity, and AUC (95%CI) for each index in predicting diabetes risk by age.
Discussion
In this cohort study, we explored the association between TyG index and new-onset diabetes in different glycemic status and directly compared the predictive value of TyG, TyG-BMI, TyG-WC, TyG-WHtR, VAI, LAP, TG/HDL-C, and TC/HDL-C indicators in new-onset diabetes. Overall, we found that a positive correlation between TyG index and the risk of diabetes existed, and the relationship was linear. In addition, all indices exhibited the capability to identify individuals with diabetes (AUC >0.5 for all), and TyG-WHtR was superior to other indicators for predicting diabetes in the whole subjects and NFG subgroup. However, in the IFG subgroup, TyG-BMI had higher predictive ability for diabetes than other indicators.
The increase of glucose concentration can elevate the level of reactive oxygen species, and then produce toxic effects on β cells (24). The increase of TG level in blood was negatively correlated with insulin secretion (25) and would lead to ectopic fat deposition in the body and the increase of triglyceride level in muscle cells, resulting in IR (26). Also, excessive TG in pancreatic islet cells can disrupt β-cell function (27). TyG index incorporated the compound effect of both, which was a simple index to detect IR. Previous studies indicated that the risk of diabetes was elevated with the increase of TyG level (divided into four quantiles) (13). However, some studies showed that there was a nonlinear association between them (4, 28). The association between TyG index and the risk of diabetes in our study was positively and linear. The reason was that the subjects of our study were middle aged and elderly, whose TyG index was generally high. This was also consistent with previous studies suggesting that high TyG index was relevant to future risk of diabetes in different races (29, 30). The results of the IFG group were similar to the whole subjects. However, in the NFG group, the correlation between TyG index and diabetes only existed when the TyG index was high. Compared with group NFG, impaired fasting glucose was more likely to be related with IR, which explained the higher correlation between TyG index and new-onset diabetes in IFG group (31). In this context, the TyG index could be considered a potential and reliable prognosticator for the incidence of diabetes for broad clinical usage.
However, some studies showed that obesity and lipid indicators were also good predictors of new-onset diabetes (3, 5, 17). The association between obesity and diabetes was mentioned in several studies (32, 33). Compared with general obesity and subcutaneous fat, visceral fat accumulation had a significant negative effect on blood glucose control by reducing peripheral insulin sensitivity and enhancing gluconeogenesis, which was closely related to IR (34). Visceral fat accumulation might also induce the secretion of adipocytokines. Oversecretion of proinflammatory adipocytokines and hyposecretion of defensive adipocytokines might be the main mechanism of IR and T2DM (35). Some simple anthropometric parameters were used as surrogate indicators of visceral fat, such as WC and WHtR, but these classic indicators could not take metabolic measures into account.
Our study indicated that the predictive value of TyG-related parameters combined with anthropometric parameters was superior to TyG index in new-onset diabetes. TyG-related parameters were useful clinical substitutes for predicting new-onset diabetes. Because they combined TG, FBG, and obesity indicators, the role of which in identifying IR was validated in previous studies (5). The utility of TyG index in evaluating IR was pointed out in a number of studies (36, 37). However, there were still controversy about the predictive value of TyG index and TyG-related parameters. A study in Chinese elderly population found that TyG index had higher predictive ability than TyG-related parameters (23). However, TyG-BMI and TyG-WC were significantly better than TyG index in predicting the risk of T2DM in Korean population (5), which was consistent with our conclusion.
Another important result of our study was that TyG-WHtR was superior to other TyG-related parameters in identifying the risk of early diabetes in the NFG group. A cohort study in Iran showed that WHtR was a better predictor than BMI and WC (38). A systematic review and meta-analysis (39) also showed a stronger association between WHtR and T2DM than BMI. This maybe because WHtR reflected the effect of visceral fat better than WC. Because metabolic risk was different in people with the same WC but different heights, and height was usually inversely associated with cardiometabolic morbidity and mortality (40). IFG refers to liver IR and early insulin secretion defects, along with impaired β-cell function (41, 42). Early identification of high-risk groups of diabetes is crucial in the occurrence of IFG. Our data showed that in the IFG group, TyG-BMI had the highest predictive value for new-onset diabetes. In our study, TyG-BMI predicted that new-onset diabetes was more effective than TyG-WC and TyG-WHtR in IFG group, probably because the population had high levels of systemic obesity. Abdominal fat includes subcutaneous fat and visceral fat, and visceral fat plays an important role in the pathogenesis of IR. However, WC cannot separate subcutaneous adipose tissue from visceral adipose tissue, so abdominal obesity cannot be accurately measured (5), leading to inaccurate measurement results of WHtR. In another study, the intraobserver and interobserver variability of waist circumference was higher than that of body mass index (43), and the accuracy of WC measurement was affected by its measurement location (44).
VAI and LAP were comprehensive measures that combined lipid variables with obesity status and were predictors of diabetes mellitus (45). Our study found that in the whole population and IFG group, the predictive value of VAI and LAP for diabetes was weaker than that of TyG-related parameters but higher than that of lipids. However, it was worth noting that the predictive value of LAP for diabetes was only next to TyG-WHtR in NFG group, and VAI had the most significant correlation with new-onset diabetes. The possible explanation was that the NFG population had better glycemic regulation than IFG population, so the effect of glycotoxicity on NFG people was slight. Therefore, VAI, which represented obesity status and lipid level, was closely associated with diabetes in NFG population. Furthermore, our study found that although there was a strong association between lipid ratio and new-onset diabetes, the predictive ability of both to new-onset diabetes was lower than other indicators. There was evidence showing that lipid ratios, such as TG/HDL-C and TC/HDL-C, were more effective than single lipid measurements in detecting IR (14). Also, a cohort study in China demonstrated that TyG, VAI, and LAP were mostly superior than TG/HDL-C in predicting T2DM (15).
The main strength of our research is that we are the first to analyze the predictive value of TyG-related parameters, visceral obesity index, and lipid ratio for new-onset diabetes under different glycemic states. The conclusion of this study has an important guiding role for clinicians to identify high-risk groups and predict the occurrence of diabetes in the future. Moreover, this is a prospective study with long-term follow-up in middle-aged and elderly Chinese population. Several limitations may exist in this study. First of all, the study population is only composed of middle-aged and elderly people. It is necessary to be cautious to extend the research results to other populations. Secondly, we did not use the 2-h oral glucose tolerance test to detect cases of diabetes, so the incidence might have been underestimated. Finally, we could not evaluate the HOMA-IR in our study.
Conclusion
The association between TyG index and new-onset diabetes was positive and linear. For predicting diabetes, TyG-WHtR was a valuable marker for predicting the risk of new-onset diabetes in the NFG group and the whole population. The predictive value of TyG-BMI was higher in the NFG group. We suggest that this index should be used in clinical practice or epidemiological investigation for early detection of diabetes.
Data Availability Statement
Publicly available datasets were analyzed in this study. These data can be found here: http://charls.pku.edu.cn/.
Ethics Statement
All respondents were required to sign informed consent, and the ethical approval for data collection in CHARLS was approved by The Biomedical Ethics Review Committee of Peking University (IRB00001052-11015). The use of CHARLS data obtained ethical approval from the Human Research Ethics Committee of the University of Newcastle (H-2015-0290).
Author Contributions
XL, BL and MS made the study design. MS, SY, and YW conducted the study. XL, RG, and NY analyzed the data and wrote the manuscript. LW, WH, and YY attended the manuscript revision. All authors agreed with the final manuscript.
Funding
This work was supported by the National Natural Science Foundation of China (No. 81973129).
Conflict of Interest
The authors declare that the research was conducted in the absence of any commercial or financial relationships that could be construed as a potential conflict of interest.
Publisher’s Note
All claims expressed in this article are solely those of the authors and do not necessarily represent those of their affiliated organizations, or those of the publisher, the editors and the reviewers. Any product that may be evaluated in this article, or claim that may be made by its manufacturer, is not guaranteed or endorsed by the publisher.
Acknowledgments
We thank the Institute of Social Science Survey of Peking University and the National School of Development of Peking University for providing the data.
References
1. Hossain P, Kawar B, Nahas ME. Obesity and Diabetes in the Developing World - A Growing Challenge. N Engl J Med (2007) 356(3):213–5. doi: 10.1056/NEJMp068177
2. Sun H, Saeedi P, Karuranga S, Pinkepank M, Ogurtsova K, Duncan BB, et al. IDF Diabetes Atlas: Global, Regional and Country-Level Diabetes Prevalence Estimates for 2021 and Projections for 2045. Diabetes Res Clin Pract (2021) 109119–9. doi: 10.1016/j.diabres.2021.109119
3. Zafari N, Lotfaliany M, Mansournia MA, Khalili D, Azizi F, Hadaegh F, et al. Optimal Cut-Points of Different Anthropometric Indices and Their Joint Effect in Prediction of Type 2 Diabetes: Results of a Cohort Study. BMC Public Health (2018) 18:691. doi: 10.1186/s12889-018-5611-6
4. Wang Z, Zhao L, He S. Triglyceride-Glucose Index as Predictor for Future Type 2 Diabetes Mellitus in a Chinese Population in Southwest China: A 15-Year Prospective Study. Endocrine (2021) 72(1):124–31. doi: 10.1007/s12020-020-02589-7
5. Er L-K, Wu S, Chou HH, Hsu LA, Teng MS, Sun YC, et al. Triglyceride Glucose-Body Mass Index Is a Simple and Clinically Useful Surrogate Marker for Insulin Resistance in Nondiabetic Individuals. PloS One (2016) 11(3):e0149731. doi: 10.1371/journal.pone.0149731
6. Fernández-Bergés D, Félix-Redondo FJ, Lozano L, Pérez-Castán JF, Sanz H, Cabrera De Léon A, et al. Prevalence of Metabolic Syndrome Estimated With the New World Health Organization Recommendations. The HERMEX Study. Gaceta Sanitaria (2011) 25(6):519–24. doi: 10.1016/j.gaceta.2011.05.009
7. Knowler WC, Barrett-Connor E, Fowler SE, Hamman RF, Lachin JM, Walker EA, et al. Reduction in the Incidence of Type 2 Diabetes With Lifestyle Intervention or Metformin. N Engl J Med (2002) 346(6):393–403. doi: 10.1056/NEJMoa012512
8. Dugani SB, Akinkuolie AO, Paynter N, Glynn RJ, Ridker PM, Mora S. Association of Lipoproteins, Insulin Resistance, and Rosuvastatin With Incident Type 2 Diabetes Mellitus Secondary Analysis of a Randomized Clinical Trial. JAMA Cardiol (2016) 1(2):136–45. doi: 10.1001/jamacardio.2016.0096
9. Guerrero-Romero F, Simental-Mendía LE, González-Ortiz M, Martínez-Abundis E, Ramos-Zavala MG, Hernández-González SO, et al. The Product of Triglycerides and Glucose, a Simple Measure of Insulin Sensitivity. Comparison With the Euglycemic-Hyperinsulinemic Clamp. J Clin Endocrinol Metab (2010) 95(7):3347–51. doi: 10.1210/jc.2010-0288
10. Junqueira Vasques AC, Novaes FS, de Oliveira Mda S, Souza JR, Yamanaka A, Pareja JC, et al. TyG Index Performs Better Than HOMA in a Brazilian Population: A Hyperglycemic Clamp Validated Study. Diabetes Res Clin Pract (2011) 93(3):E98–E100. doi: 10.1016/j.diabres.2011.05.030
11. Ji B, Qu H, Wang H, Wei H, Deng H. Association Between the Visceral Adiposity Index and Homeostatic Model Assessment of Insulin Resistance in Participants With Normal Waist Circumference. Angiology (2017) 68(8):716–21. doi: 10.1177/0003319716682120
12. Oh J-Y, Sung Y-A, Lee HJ. The Visceral Adiposity Index as a Predictor of Insulin Resistance in Young Women With Polycystic Ovary Syndrome. Obesity (2013) 21(8):1690–4. doi: 10.1002/oby.20096
13. Chen C-L, Liu L, Lo K, Huang JY, Yu YL, Huang YQ, et al. Association Between Triglyceride Glucose Index and Risk of New-Onset Diabetes Among Chinese Adults: Findings From the China Health and Retirement Longitudinal Study. Front Cardiovasc Med (2020) 7. doi: 10.3389/fcvm.2020.610322
14. Kimm H, Lee SW, Lee HS, Shim KW, Cho CY, Yun JE, et al. Associations Between Lipid Measures and Metabolic Syndrome, Insulin Resistance and Adiponectin - Usefulness of Lipid Ratios in Korean Men and Women. Circ J (2010) 74(5):931–7. doi: 10.1253/circj.CJ-09-0571
15. Wang B, Zhang M, Liu Y, Sun X, Zhang L, Wang C, et al. Utility of Three Novel Insulin Resistance-Related Lipid Indices for Predicting Type 2 Diabetes Mellitus Among People With Normal Fasting Glucose in Rural China. J Diabetes (2018) 10(8):641–52. doi: 10.1111/1753-0407.12642
16. Nusrianto A, Baumeister SE, Amann U, Rathmann W, Peters A, Huth C, et al. Visceral Adiposity Index (VAI), Lipid Accumulation Product (LAP), and Product of. Sci Rep (2019) 9(1):9693. doi: 10.1038/s41598-019-46187-8
17. Du T, Yuan G, Zhang M, Zhou X, Sun X, Yu X. Clinical Usefulness of Lipid Ratios, Visceral Adiposity Indicators, and the Triglycerides and Glucose Index as Risk Markers of Insulin Resistance. Cardiovasc Diabetol (2014) 13:146. doi: 10.1186/s12933-014-0146-3
18. Navarro-Gonzalez D, Sánchez-Íñigo L, Pastrana-Delgado J, Fernández-Montero A, Martinez JA. Triglyceride-Glucose Index (TyG Index) in Comparison With Fasting Plasma Glucose Improved Diabetes Prediction in Patients With Normal Fasting Glucose: The Vascular-Metabolic CUN Cohort. Prev Med (2016) 86:99–105. doi: 10.1016/j.ypmed.2016.01.022
19. Hsieh SD, Yoshinaga H, Muto T. Waist-To-Height Ratio, a Simple and Practical Index for Assessing Central Fat Distribution and Metabolic Risk in Japanese Men and Women. Int J Obes (2003) 27(5):610–6. doi: 10.1038/sj.ijo.0802259
20. Amato MC, Giordano C, Galia M, Criscimanna A, Vitabile S, Midiri M, et al. Visceral Adiposity Index A Reliable Indicator of Visceral Fat Function Associated With Cardiometabolic Risk. Diabetes Care (2010) 33(4):920–2. doi: 10.2337/dc09-1825
21. Kahn HS. The "Lipid Accumulation Product" Performs Better Than the Body Mass Index for Recognizing Cardiovascular Risk: A Population-Based Comparison. BMC Cardiovasc Disord (2005) 5:26–6. doi: 10.1186/1471-2261-5-26
22. Simental-Mendia LE, Rodriguez-Moran M, Guerrero-Romero F. The Product of Fasting Glucose and Triglycerides as Surrogate for Identifying Insulin Resistance in Apparently Healthy Subjects. Metab Syndr Relat Disord (2008) 6(4):299–304. doi: 10.1089/met.2008.0034
23. Ke P, Wu X, Xu M, Feng J, Xu H, Gan Y, et al. Comparison of Obesity Indices and Triglyceride Glucose-Related Parameters to Predict Type 2 Diabetes Mellitus Among Normal-Weight Elderly in China. Eating Weight Disord-Studies Anorexia Bulimia Obes (2021). doi: 10.1007/s40519-021-01238-w
24. Robertson RP, Harmon J, Tran PO, Poitout V. Beta-Cell Glucose Toxicity, Lipotoxicity, and Chronic Oxidative Stress in Type 2 Diabetes. Diabetes (2004) 53:S119–24. doi: 10.2337/diabetes.53.2007.S119
25. Zhou M, Zhu L, Cui X, Feng L, Zhao X, He S, et al. The Triglyceride to High-Density Lipoprotein Cholesterol (TG/HDL-C) Ratio as a Predictor of Insulin Resistance But Not of β Cell Function in a Chinese Population with Different Glucose Tolerance Status. Lipids Health Dis (2016) 15:104. doi: 10.1186/s12944-016-0270-z
26. Søndergaard E, Nielsen S. VLDL Triglyceride Accumulation in Skeletal Muscle and Adipose Tissue in Type 2. Curr Opin Lipidol (2018) 29(1):42–7. doi: 10.1097/MOL.0000000000000471
27. Unger RH. Lipotoxicity in the Pathogenesis of Obesity-Dependent NIDDM. Genetic and Clinical Implications. Diabetes (1995) 44(8):863–70. doi: 10.2337/diabetes.44.8.863
28. Xuan X, Hamaguchi M, Cao Q, Okamura T, Hashimoto Y, Obora A, et al. U-Shaped Association Between the Triglyceride-Glucose Index and the Risk of Incident Diabetes in People With Normal Glycemic Level: A Population-Base Longitudinal Cohort Study. Clin Nutr (2021) 40(4):1555–61. doi: 10.1016/j.clnu.2021.02.037
29. Li X, Li G, Cheng T, Liu J, Song G, Ma H. Association Between Triglyceride-Glucose Index and Risk of Incident Diabetes: A Secondary Analysis Based on a Chinese Cohort Study. Lipids Health Dis (2020) 19(1):236. doi: 10.1186/s12944-020-01403-7
30. Lee S-H, Kwon HS, Park YM, Ha HS, Jeong SH, Yang HK, et al. Predicting the Development of Diabetes Using the Product of Triglycerides and Glucose: The Chungju Metabolic Disease Cohort (CMC) Study. PloS One (2014) 9(2):e90430. doi: 10.1371/journal.pone.0090430
31. Faerch K, Borch-Johnsen K, Holst JJ, Vaag A. Pathophysiology and Aetiology of Impaired Fasting Glycaemia and Impaired Glucose Tolerance: Does It Matter for Prevention and Treatment of Type 2 Diabetes? Diabetologia (2009) 52(9):1714–23. doi: 10.1007/s00125-009-1443-3
32. Ishola AF, Gerstein HC, Engert JC, Mohan V, Diaz R, Anand SS, et al. Longitudinal Relationships Between Glycemic Status and Body Mass Index in a Multiethnic Study: Evidence From Observational and Genetic Epidemiology. Sci Rep (2016) 6:30744. doi: 10.1038/srep30744
33. Raghavan S, Pachucki MC, Chang Y, Porneala B, Fox CS, Dupuis J, et al. Incident Type 2 Diabetes Risk Is Influenced by Obesity and Diabetes in Social Contacts: A Social Network Analysis. J Gen Intern Med (2016) 31(10):1127–33. doi: 10.1007/s11606-016-3723-1
34. Han J, Kim SH, Suh YJ, Lim HA, Shin H, Cho SG, et al. Serum Chemerin Levels Are Associated With Abdominal Visceral Fat in Type 2 Diabetes. J Korean Med Sci (2016) 31(6):924–31. doi: 10.3346/jkms.2016.31.6.924
35. Matzuzawa Y. The Metabolic Syndrome and Adipocytokines. FEBS J (2006) 273:20–0. doi: 10.1016/j.febslet.2006.04.028
36. Gao W, Wang J, Chen Y, Qiao H, Qian X, Xin Z, et al. Discordance Between the Triglyceride Glucose Index and HOMA-IR in Incident Albuminuria: A Cohort Study From China. Lipids Health Dis (2021) 20(1):176. doi: 10.1186/s12944-021-01602-w
37. Selvi NMK, Nandhini S, Sakthivadivel V, Lokesh S, Srinivasan AR, Sumathi S. Association of Triglyceride-Glucose Index (TyG Index) With HbA1c and Insulin Resistance in Type 2 Diabetes Mellitus. Maedica (2021) 16(3):375–81. doi: 10.26574/maedica.2021.16.3.375
38. Janghorbani M, Almasi SZ, Amini M. The Product of Triglycerides and Glucose in Comparison With Fasting Plasma Glucose. Acta Diabetol (2015) 52(4):781–8. doi: 10.1007/s00592-014-0709-5
39. Ashwell M, Gunn P, Gibson S. Waist-To-Height Ratio Is a Better Screening Tool Than Waist Circumference and BMI for Adult Cardiometabolic Risk Factors: Systematic Review and Meta-Analysis. Obes Rev (2012) 13(3):275–86. doi: 10.1111/j.1467-789X.2011.00952.x
40. Langenberg C, Shipley MJ, Batty GD, Marmot MG. Adult Socioeconomic Position and the Association Between Height and Coronary Heart Disease Mortality: Findings From 33 Years of Follow-Up in the Whitehall Study. Am J Public Health (2005) 95(4):628–32. doi: 10.2105/2004.046219
41. Abdul-Ghani M, DeFronzo RA, Jayyousi A. Prediabetes and Risk of Diabetes and Associated Complications: Impaired Fasting Glucose Versus Impaired Glucose Tolerance: Does It Matter? Curr Opin Clin Nutr Metab Care (2016) 19(5):394–9. doi: 10.1097/MCO.0000000000000307
42. Kanat M, Mari A, Norton L, Winnier D, DeFronzo RA, Jenkinson C, et al. Distinct Beta-Cell Defects in Impaired Fasting Glucose and Impaired Glucose Tolerance. Diabetes (2012) 61(2):447–53. doi: 10.2337/db11-0995
43. Nadas J, Putz Z, Kolev G, Nagy S, Jermendy G. Intraobserver and Interobserver Variability of Measuring Waist Circumference. Med Sci Monitor (2008) 14(1):CR15–8.
44. Wang J, Thornton JC, Bari S, Williamson B, Gallagher D, Heymsfield SB, et al. Comparisons of Waist Circumferences Measured at 4 Sites. Am J Clin Nutr (2003) 77(2):379–84. doi: 10.1093/ajcn/77.2.379
Keywords: diabetes mellitus, triglyceride glucose index, obesity, lipid ratios, CHARLS
Citation: Li X, Sun M, Yang Y, Yao N, Yan S, Wang L, Hu W, Guo R, Wang Y and Li B (2022) Predictive Effect of Triglyceride Glucose−Related Parameters, Obesity Indices, and Lipid Ratios for Diabetes in a Chinese Population: A Prospective Cohort Study. Front. Endocrinol. 13:862919. doi: 10.3389/fendo.2022.862919
Received: 26 January 2022; Accepted: 25 February 2022;
Published: 30 March 2022.
Edited by:
Hui Shao, University of Florida, United StatesReviewed by:
Piaopiao Li, University of Florida, United StatesHuilin Tang, University of Florida, United States
Copyright © 2022 Li, Sun, Yang, Yao, Yan, Wang, Hu, Guo, Wang and Li. This is an open-access article distributed under the terms of the Creative Commons Attribution License (CC BY). The use, distribution or reproduction in other forums is permitted, provided the original author(s) and the copyright owner(s) are credited and that the original publication in this journal is cited, in accordance with accepted academic practice. No use, distribution or reproduction is permitted which does not comply with these terms.
*Correspondence: Bo Li, bGlfYm9Aamx1LmVkdS5jbg==