 Jing Yuan1
 Jian-Bo Zhou
- 1Department of Endocrinology, Beijing Tongren Hospital, Capital Medical University, Beijing, China
- 2Department of Orthopedics, Beijing Friendship Hospital, Capital Medical University, Beijing, China
Background: Accumulating evidence has shown that diabetes has an impact on bone metabolism with conflicting results. Furthermore, little is known about the relationship of prediabetes with bone mineral density (BMD). Therefore, we explored the association between BMD and glucometabolic status in adults in the US.
Methods: In this cross-sectional study, we extracted and analyzed data from the National Health and Nutrition Examination Survey (NHANES) from 2005 to 2018. A total of 14610 subjects aged 40 ≥ years diagnosed with diabetes, prediabetes, or normal glucose regulation (NGR) and had available data on BMD were eligible.
Results: The prevalence of prediabetes and diabetes in US adults aged 40 ≥ years were 39.2% and 26.4%, respectively. After multivariable adjustment, we found an increasing trend of BMD at the total hip, femoral neck, and lumbar spine with glucometabolic conditions from NGR and prediabetes to diabetes in adults aged ≥ 40 years in the US. This trend was more prominent in women than that in men. Fasting plasma glucose (FPG) and HbA1c levels were also positively correlated with BMD.
Conclusions: Glucometabolic conditions were significantly associated with BMD values in US adults.
Introduction
Diabetes mellitus (DM) is a chronic metabolic disorder characterized by insufficient insulin production, endogenous insulin resistance, or both (1, 2), resulting in hyperglycemia. This results in an increased risk of microvascular and macrovascular complications, which significantly impact an individual’s life expectancy and quality of life (3, 4). According to the International Diabetes Federation, approximately 537 million adults worldwide have diabetes, which is expected to rise to 783 million by 2045 (5). The high prevalence of diabetes and its associated complications impose an overwhelming medical and economic burden and is emerging as a severe public health issue.
Substantial evidence has linked diabetes with disorders of bone metabolism and skeletal fragility, which have been suggested to be novel complications of long-term exposure to an uncontrolled blood glucose environment (6, 7). The mechanisms underlying the deterioration of bone quality in diabetes are complex and poorly documented. Several factors, including oxidative stress, accumulation of advanced glycation end products, inflammatory cytokines, muscle-derived hormones, incretins, hydrogen sulfide production, and cortisol secretion, negatively affect bone strength (7, 8).
Prediabetes, defined as the presence of impaired fasting glucose (IFG), impaired glucose tolerance (IGT), and/or mildly elevated hemoglobin A1c (HbA1c), precedes the onset of diabetes. Emerging insights into macrovascular disorders such as cardiovascular disease, stroke, and peripheral vascular disease are relevant to prediabetes (9–12). Current evidence suggests an association between prediabetes and the prevalence of microvascular complications (13). However, few studies with adequate sample sizes have investigated the influence of prediabetes on skeletal health, and there is controversy in the results with increased (14), decreased (15), or similar (16) values of bone mass density (BMD) when compared with normoglycemic individuals. Furthermore, little is known about the trend that exists between BMD and blood glucose status.
In this study, we investigated BMD trends in US adults aged ≥ 40 years with diabetes, prediabetes, and normal glucose regulation (NGR) using nationally representative sample data from the National Health and Nutrition Examination Survey (NHANES) from 2005 to 2018.
Methods
Data Source
The data for this cross-sectional study were obtained from the NHANES, a survey conducted by the National Center for Health Statistics (NCHS) of the Centers for Disease Control and Prevention (CDC) to assess the health and nutritional status of a nationally representative sample of the US civilian population using a multistage, stratified, clustered probability design. Questionnaire interviews, laboratory tests, and physical examinations were included in the survey. The continuous datasets of the NHANES 2005–2006, 2007–2008, 2009–2010, 2013–2014 and 2017–2018 were combined in this study. NHANES 2011–2012, 2015–2016 were excluded because of the lack of data on the lumbar spine and femur BMD during these periods. The NHANES study protocol was approved by the NCHS Ethics Review Board, and written informed consent was obtained from all participants (17, 18).
Study Participants
Dual-energy X-ray absorptiometry (DXA) scans were only administered to eligible survey participants aged ≥ 40 years in the 2013–2014 cycle. This study population was limited to subjects aged ≥40 years who were diagnosed with diabetes, prediabetes, or NGR with available data on BMD. Among the total 50463 participants for the 5-cycle survey, after the exclusion of 17445 subjects without glucose status (n=33018) and 10250 without valid BMD data (n=22768), 14610 subjects aged ≥40 years were enrolled in our study for final analysis.
Definition of Glucose Status
Diabetes status was confirmed when subjects had a positive response to the question, “Have you ever been told by a doctor that you have diabetes?”. Furthermore, the diagnosis of diabetes was also based on American Diabetes Association (ADA) criteria (19), which is fasting plasma glucose (FPG) ≥ 7.0 mmol/l or 2-h plasma glucose (2h-PG) after oral glucose tolerance test (OGTT) ≥ 11.0 mmol/l or HbA1c ≥ 6.5%. Participants were diagnosed with prediabetes who answered “yes” to the question “Have you ever been told by a doctor that you have prediabetes?” or had FPG ≥ 6.1, < 7.0 mmol/L, or 2h-PG ≥ 7.8, < 11.0 mmol/L or HbA1c ≥ 5.7%, < 6.5%.
BMD Measurements
BMD of the total femur and lumbar spine was assessed using DXA scans with Hologic QDR-4500A fan-beam densitometers (Hologic, Inc., Bedford, Massachusetts, USA) in the NHANES mobile examination center (MEC). The detailed examination protocol for DXA is described on the NHANES website. BMD values of the total hip, femoral neck, trochanter, intertrochanter, Ward’s triangle, and vertebrae L1–L4 were obtained from the DXA profiles. Based on the osteoporosis diagnostic criteria of the World Health Organization (WHO) (20), BMD values of the hip, femoral neck and vertebrae L1-4 were included in the current study.
Study Variables
Demographic information, including age, gender (male or female), race/ethnicity (non-Hispanic white, non-Hispanic black, Mexican American, other races), educational level (below high school, high school or equivalent, above high school), marital status (married/living with a partner, widowed/divorced/separated, and never married), ratio of family income to poverty (PIR: ≤1, 1 < to ≤ 3, > 3), smoking at least 100 cigarettes in life (yes/no), and vigorous recreational activities (yes/no) were collected from the NHANES database. Body mass index (BMI) was calculated as the weight (kg) divided by the squared height (m2). The systolic blood pressure (SBP) and diastolic blood pressure (DBP) were measured. Data on serum creatinine (sCr), uric acid (UA), total cholesterol (TC), triglyceride (TG), alkaline phosphatase (ALP), serum calcium, and serum phosphorus were also extracted from the database. The detailed process of the data collection was obtained from the NHANES website.
Statistical Analysis
Based on the NHANES analytical guidelines, sampling weights were used for all analyses to interpret the complicated NHANES survey design. Ten-year weights were calculated for the 2005–2010, 2013–2014 and 2017–2018 estimates by multiplying the 2-year weights by one-fifth. Continuous variables are expressed as mean ± standard deviation, and comparisons between the three groups were made using one-way ANOVA. Categorical measures were expressed as percentages, and a Chi-square test was used for analysis. Multivariable linear regression analysis was used to evaluate the association between glucose status and BMD in the three models. The regression coefficient (β) and 95% confidence interval (95% CI) were estimated. Model 1 was unadjusted. Model 2 was adjusted for age, sex, and race. Model 3 was adjusted for model 2 adjustments plus BMI, education level, marital status, ratio of family income to poverty, smoking at least 100 cigarettes in life, vigorous recreational activities, ALP, total calcium, uric acid, creatinine, and cholesterol. SPSS software (version 17.0; SPSS Inc., Chicago, IL, US), STATA 15.0 software (StataCorp LLC, College Station, TX, USA) were used for statistical analyses. A two-sided P value < 0.05 is considered statistically significant.
Results
General Characteristics of All Participants
Of the 14610 participants, 5730 (39.2%) had prediabetes and 3864 (26.4%) had diabetes, accounting for 65.6% of the entire cohort. Participants with diabetes and prediabetes differed from those with NGR in several demographic and biochemical indices (Table 1). There were significantly more elderly and fewer non-Hispanic Whites in the prediabetes and diabetes groups than in the NGR group. Compared with NGR, subjects with diabetes and prediabetes appeared to have older age, lower education level, lower PIR, more smoking habits, less vigorous recreational activities, and higher BMI and SBP. In addition, sCr, UA, TG, TC, ALP, and serum phosphorus levels were significantly different between the three groups. Interestingly, the BMD of the total hip, femoral neck, and lumbar spine tended to be significantly higher in patients with diabetes than in prediabetes and NGR subjects.
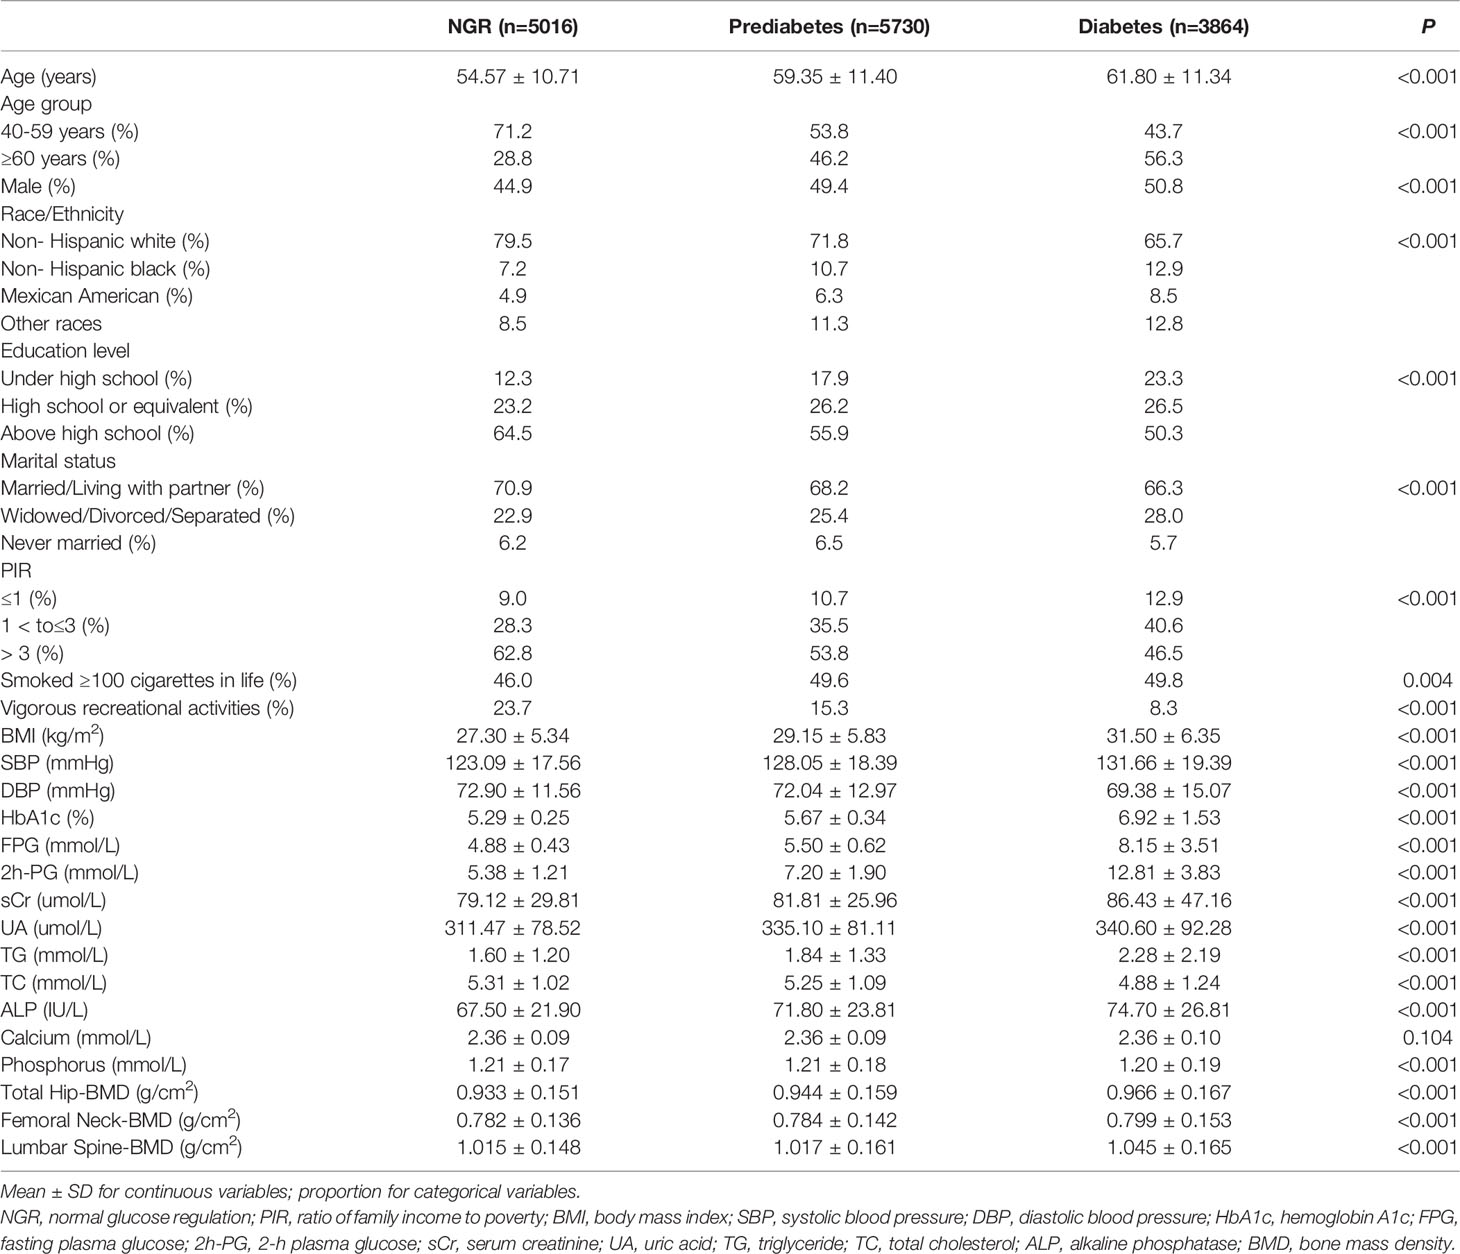
Table 1 Weighted characteristics of US adults ≥ 40 years old with NGR, prediabetes and diabetes, 2005-2018.
Association of Glucose Status and BMD
We found a positive trend for glucose status and BMD in the total hip, femoral neck, and lumbar spine (all P-trend <0.05) after the adjustment of three models (model 3: β=0.011, 95% CI: 0.004–0.018 for prediabetes; β=0.022, 95% CI: 0.012–0.031 for diabetes in the total hip; β=0.007, 95% CI: 0.001–0.015 for prediabetes; β=0.015, 95% CI: 0.006–0.025 for diabetes in the femoral neck; β=0.002, 95% CI: –0.008–0.012 for prediabetes; β=0.020, 95% CI: 0.007–0.033 for diabetes in the lumbar spine). After stratification by sex, an interesting phenomenon was that men aged ≥ 40 years had no significant association between lumbar BMD and glucose status after multivariate adjustment (P=0.149), whereas the trend remained stable in all skeletal sites in the corresponding women (Table 2).
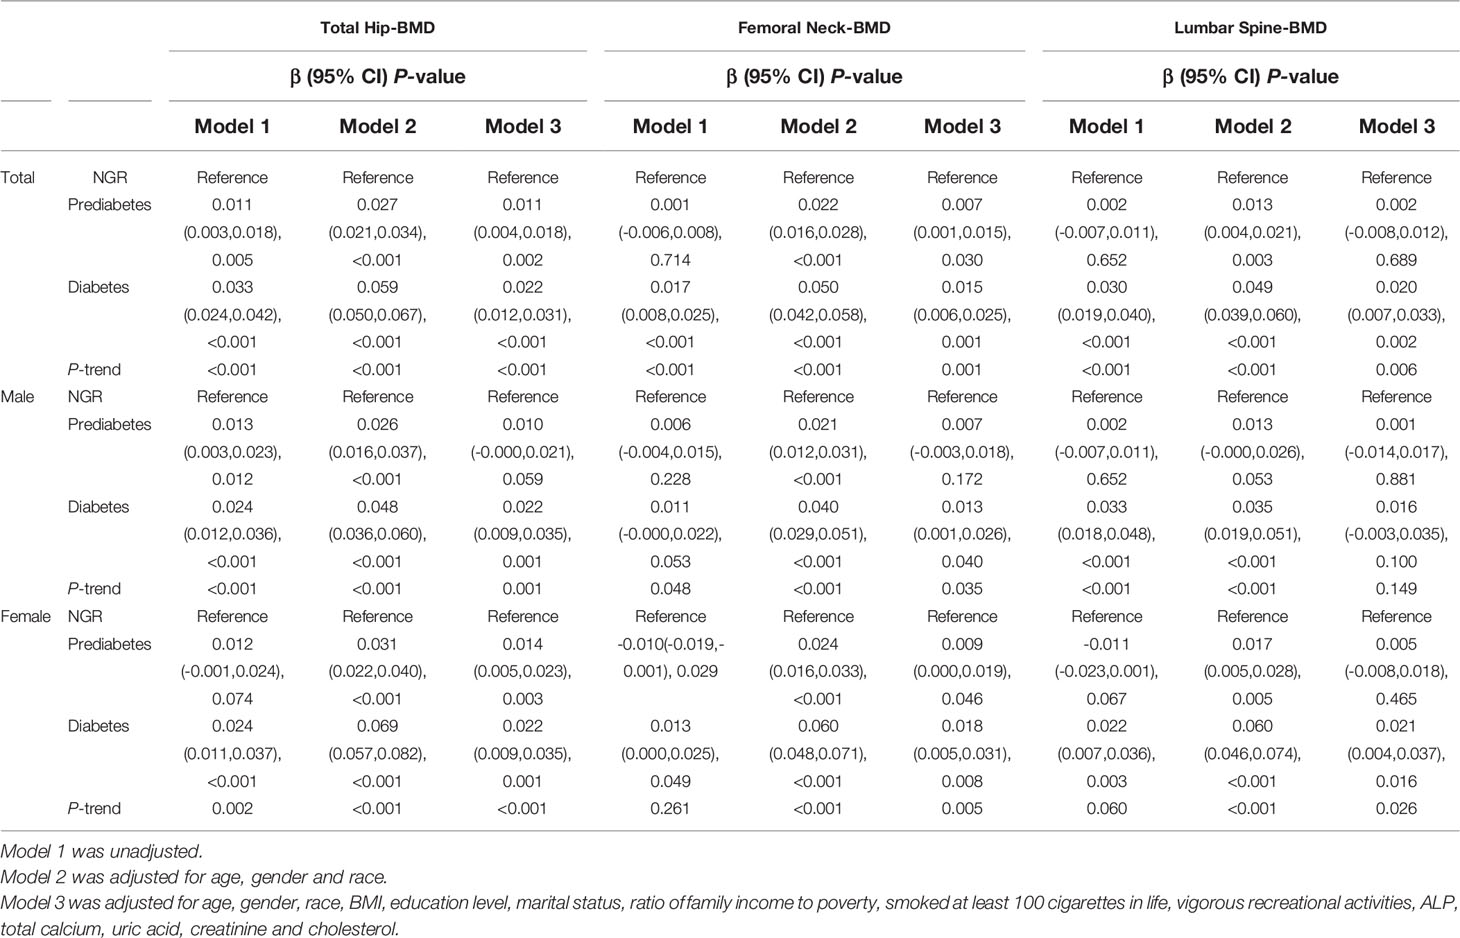
Table 2 Associations between glucometabolic status and BMD values .
Association of FPG and BMD
As shown in Table 3, after adjusting for potential confounding factors, FPG was found to have a significant association with BMD of the total hip, femoral neck, and lumbar spine in all participants (β=0.003, 95% CI: 0.002–0.005 in the total hip; β=0.003, 95% CI: 0.001–0.004 in the femoral hip; β=0.004, 95% CI: 0.002–0.006 in the lumbar spine). The same conclusion was confirmed in the subgroup of women in the unadjusted, mildly adjusted, and fully adjusted models. After adjustment for age, sex, and race, a positive relationship was found between FPG and femoral neck BMD in the male subgroup (P <0.001), while further adjustment for BMI, other socio-demographics, and biochemical indices attenuated its significance (P=0.110).
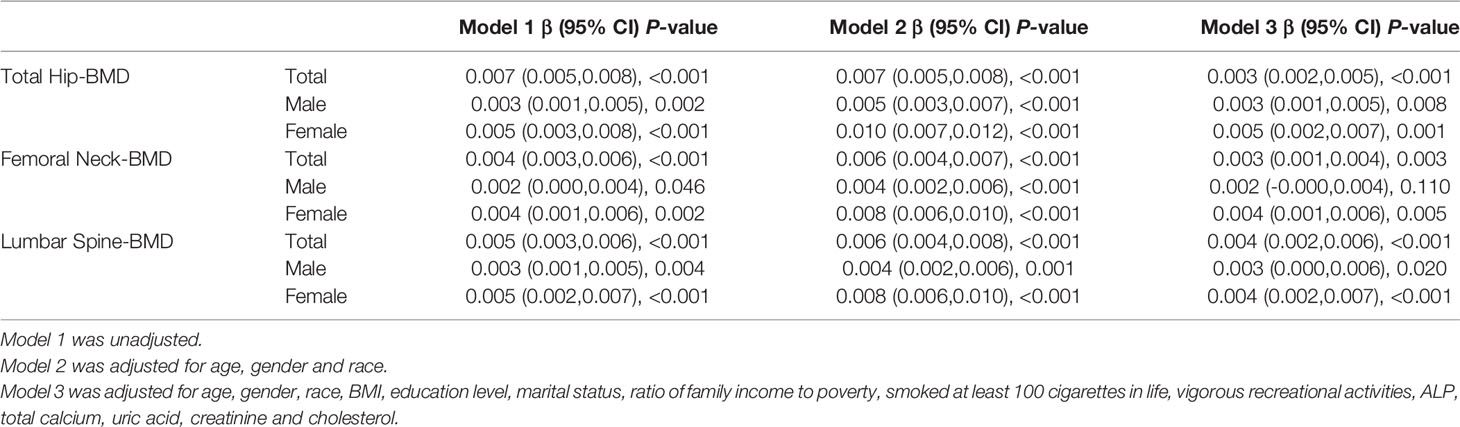
Table 3 Associations between fasting plasma glucose and BMD values.
Association of HbA1c and BMD
After adjustment for multivariate factors, there was enough statistical evidence to show a positive association between HbA1c and BMD in all skeletal sites for the whole cohort (β=0.010, 95% CI: 0.007–0.014 in total hip; β=0.008, 95% CI: 0.005–0.012 in femoral hip; β=0.011, 95% CI: 0.006–0.015 in the lumbar spine) and both sexes (Table 4).
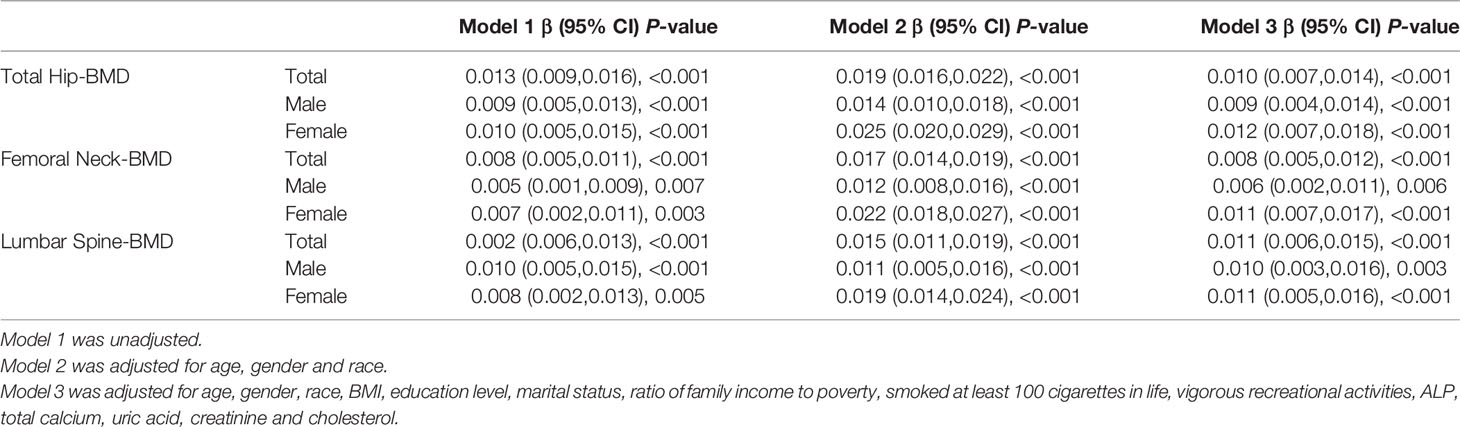
Table 4 Associations between glycohemoglobin and BMD values.
Discussion
In the current study, after adjusting for multiple potential confounders, we reported an increasing trend of BMD at the total hip, femoral neck, and lumbar spine with glucometabolic conditions from NGR and prediabetes to diabetes in US adults ≥40 years. This trend was more prominent in women than that in men. Fasting blood glucose and HbA1c levels were also positively related to BMD. To the best of our knowledge, this is the first study to evaluate BMD values in US adults with normal, mild, and overt elevated plasma glucose levels with nationally representative data.
There is a paucity of research on the link between diabetes and BMD values. Some studies have reported that patients with diabetes have decreased BMDs compared to NGR subjects (21, 22), while the majority suggested an average or even higher BMD value (23, 24). Furthermore, few studies have investigated the association between prediabetes and BMD with inconsistent results. A Polish study enrolled 142 subjects (84 men with prediabetes and 58 control men) and found that men with prediabetes had decreased BMD values at the lumbar spine and total body but had a similar BMD at the femoral neck (15). A Chinese study including 173 postmenopausal women with NGR and 73 with IGT reported that the BMD values of IGT were not significantly different from those of NGR (16). In contrast, a study evaluated the BMD dataset from the Korea National Health and Nutrition Examination Survey (KNHANES) and further demonstrated that men with prediabetes and diabetes had increased BMD at all measured sites compared with the control group (14). However, there were comparable BMD values between prediabetes and diabetes in the Korean study, which was different from the findings of our study. In our study, patients with prediabetes and diabetes were observed to have increased BMD, even after adjusting for sex, age, race, BMI, other socio-demographics, and biochemical confounders. Some reasons may explain the diverse results: study design, sample size, examination technology and sites of BMD, and racial differences in BMD and osteoporosis.
The relationship between HbA1c, hyperglycemia, and BMD had conflicting results. A study from Japan (25) indicated that patients with type 2 diabetes (T2D) had a negative correlation between BMD and mean HbA1c at the distal radius in both sexes and at the femoral neck in women. In contrast, a retrospective cross-sectional study (24) found that the prevalence of osteoporosis significantly decreased with increasing blood glucose and HbA1c levels. Our study also demonstrated that FPG and HbA1c levels positively correlate with BMD. However, FPG and HbA1c levels were single measurements at the time of examination and could not reflect the mean blood glucose levels. Averaged HbA1c levels over the entire course of the disease are recommended in future studies.
Our study focused on middle-aged and elderly US individuals and found an increasing trend in BMD in patients with prediabetes and diabetes. However, these results were not in line with the findings in youth with diabetes and prediabetes. An NHANES study of 2005–2006 (26) enrolled youth aged 12-20 years with prediabetes and NGR and demonstrated that children with prediabetes have higher BMD, while adolescents and young adults with prediabetes tended to have lower BMD, suggesting a different biological effect of diabetes progression on bone health during the growing period. A Korean study (27) found that obese children and adolescents with T2D had significantly lower BMD Z-scores at the femoral neck compared with age-, sex-, and BMI-matched controls. A meta-analysis (28) also indicated that children and adolescents with type 1 diabetes (T1D) had lower BMD than controls. Hence, peak bone mass in youth with prediabetes and diabetes might be influenced by the deterioration of bone mineral accruals.
Accumulating evidence from cohort studies and meta-analyses has shown that diabetes is associated with an elevated risk of fragility fractures (29, 30), despite normal or higher BMD values (31). Although DXA is the gold standard for examining bone quality in clinical practice, it may underestimate the risk of fractures in patients with diabetes. A prospective study with a mean follow-up of 12.6 Â years indicated that for a similar hip fracture risk, patients with diabetes had a higher T-score than those without diabetes, and the difference in T-score was 0.59 (95% CI: 0.31–0.87) for women and 0.38 (95% CI, 0.09–0.66) for men (32). In elderly patients with diabetes, a substantially increased risk of falls due to poor balance, peripheral neuropathy, history of coronary heart disease, and arthritis may contribute to a higher risk of fracture (33). Oral anti-diabetic agents and insulin also exert their effects on bone strength (8). Other psychosocial factors, including cognitive impairment, should be considered in fracture risk assessments (34). The results of our study indicate that the mean age of the diabetes group was higher than that of the NGR and prediabetes groups, with paradoxically higher BMD. BMI is considered a protective factor against osteoporosis (35). Therefore, several confounders were adjusted in our study to investigate the independent effect of glucometabolic conditions on BMD. However, a cohort study suggested that the impact of diabetes on fractures was increased in the BMD-added prediction model (36). Hence, more comprehensive studies are needed to evaluate whether BMD is an independent predictor of fragility fractures in individuals with diabetes.
In the current study, we analyzed data from the NHANES, which is unique in collecting demographic, health, and nutritional information. The NHANES sample represents the national US civilian population. In addition, the interview and examination processes were under high-quality control to ensure the reliability of the data. This is the key strength of this study. Furthermore, diabetes and prediabetes diagnosis were based on self-reported diagnosis and on the results of OGTT and HbA1c, increasing the diagnostic accuracy of glucose metabolism. However, this study had several unavoidable limitations. First, because of the cross-sectional nature of the NHANES, it is difficult to conclude on the cause-effect relationship. Second, anti-diabetic medicine was not included in the diabetes group, which may negatively or positively influence BMD. Third, although we examined the changes in socio-demographics, BMI, and biochemical indexes, other potential residual confounders, such as vitamin D and calcium supplementation, use of glucocorticoids may still need to be considered. Therefore, more prospective studies are required to investigate bone metabolism at different glucose levels.
In conclusion, based on nationally representative data extracted from the NHANENS database from 2005 to 2018, we found a positive association between glucometabolic conditions and BMD values in US adults. To better understand the mechanisms underlying bone metabolism in individuals with prediabetes and diabetes, more longitudinal research is needed to explain BMD changes from normoglycemia to prediabetes and diabetes.
Data Availability Statement
The original contributions presented in the study are included in the article/supplementary material. Further inquiries can be directed to the corresponding authors.
Ethics Statement
The studies involving human participants were reviewed and approved by NHANES. The patients/participants provided their written informed consent to participate in this study.
Author Contributions
JY extracted data from NHANES database, analyzed the data, wrote the manuscript. PJ and J-BZ conceived the idea for the study and edited the manuscript. All authors read and approved the final manuscript. All authors contributed to the article and approved the submitted version.
Funding
This work was supported by the National Natural Science Foundation of China (grant numbers 82070851, 81870556), the Beijing Municipal Administration of Hospitals’ Youth Program (grant number QML20170204), and Excellent Talents in the Dongcheng District of Beijing.
Conflict of Interest
The authors declare that the research was conducted in the absence of any commercial or financial relationships that could be construed as a potential conflict of interest.
Publisher’s Note
All claims expressed in this article are solely those of the authors and do not necessarily represent those of their affiliated organizations, or those of the publisher, the editors and the reviewers. Any product that may be evaluated in this article, or claim that may be made by its manufacturer, is not guaranteed or endorsed by the publisher.
References
1. American Diabetes Association. Diagnosis and Classification of Diabetes Mellitus. Diabetes Care (2013) 361:S67–74. doi: 10.2337/dc13-S067
2. Menke A, Casagrande S, Geiss L, Cowie CC. Prevalence of and Trends in Diabetes Among Adults in the United States, 1988-2012. JAMA (2015) 314(10):1021–9. doi: 10.1001/jama.2015.10029
3. Dall TM, Yang W, Halder P, Pang B, Massoudi M, Wintfeld N, et al. The Economic Burden of Elevated Blood Glucose Levels in 2012: Diagnosed and Undiagnosed Diabetes, Gestational Diabetes Mellitus, and Prediabetes. Diabetes Care (2014) 37(12):3172–9. doi: 10.2337/dc14-1036
4. Dalsgaard EM, Skriver MV, Sandbaek A, Vestergaard M. Socioeconomic Position, Type 2 Diabetes and Long-Term Risk of Death. PloS One (2015) 10(5):e0124829. doi: 10.1371/journal.pone.0124829
5. Sun H, Saeedi P, Karuranga S, Pinkepank M, Ogurtsova K, Duncan BB, et al. Idf Diabetes Atlas: Global, Regional and Country-Level Diabetes Prevalence Estimates for 2021 and Projections for 2045. Diabetes Res Clin Pract (2022) 183:109119. doi: 10.1016/j.diabres.2021.109119
6. Janghorbani M, Feskanich D, Willett WC, Hu F. Prospective Study of Diabetes and Risk of Hip Fracture: The Nurses’ Health Study. Diabetes Care (2006) 29(7):1573–8. doi: 10.2337/dc06-0440
7. Shanbhogue VV, Mitchell DM, Rosen CJ, Bouxsein ML. Type 2 Diabetes and the Skeleton: New Insights Into Sweet Bones. Lancet Diabetes Endocrinol (2016) 4(2):159–73. doi: 10.1016/S2213-8587(15)00283-1
8. Eller-Vainicher C, Cairoli E, Grassi G, Grassi F, Catalano A, Merlotti D, et al. Pathophysiology and Management of Type 2 Diabetes Mellitus Bone Fragility. J Diabetes Res (2020) 2020:7608964. doi: 10.1155/2020/7608964
9. Tai ES, Goh SY, Lee JJ, Wong MS, Heng D, Hughes K, et al. Lowering the Criterion for Impaired Fasting Glucose: Impact on Disease Prevalence and Associated Risk of Diabetes and Ischemic Heart Disease. Diabetes Care (2004) 27(7):1728–34. doi: 10.2337/diacare.27.7.1728
10. Rijkelijkhuizen JM, Nijpels G, Heine RJ, Bouter LM, Stehouwer CD, Dekker JM. High Risk of Cardiovascular Mortality in Individuals With Impaired Fasting Glucose is Explained by Conversion to Diabetes: The Hoorn Study. Diabetes Care (2007) 30(2):332–6. doi: 10.2337/dc06-1238
11. Holman RR, Coleman RL, Chan J, Chiasson JL, Feng H, Ge J, et al. Effects of Acarbose on Cardiovascular and Diabetes Outcomes in Patients With Coronary Heart Disease and Impaired Glucose Tolerance (ACE): A Randomised, Double-Blind, Placebo-Controlled Trial. Lancet Diabetes Endocrinol (2017) 5(11):877–86. doi: 10.1016/S2213-8587(17)30309-1
12. Roquer J, Rodriguez-Campello A, Cuadrado-Godia E, Giralt-Steinhauer E, Jimenez-Conde J, Degano IR, et al. Ischemic Stroke in Prediabetic Patients. J Neurol (2014) 261(10):1866–70. doi: 10.1007/s00415-014-7431-7
13. Jin J, Lu P. Association Between Prediabetes and Retinopathy: A Meta-Analysis. Horm Metab Res (2021) 53(12):801–9. doi: 10.1055/a-1678-7092
14. Jang M, Kim H, Lea S, Oh S, Kim JS, Oh B. Effect of Duration of Diabetes on Bone Mineral Density: A Population Study on East Asian Males. BMC Endocr Disord (2018) 18(1):61. doi: 10.1186/s12902-018-0290-y
15. Rabijewski M, Papierska L, Piatkiewicz P. An Association Between Bone Mineral Density and Anabolic Hormones in Middle-Agedand Elderly Men With Prediabetes. Aging Male (2017) 20(3):205–13. doi: 10.1080/13685538.2017.1338254
16. Lui D, Lee CH, Chau V, Fong C, Yeung K, Lam J, et al. Potential Role of Fibroblast Growth Factor 21 in the Deterioration of Bone Quality in Impaired Glucose Tolerance. J Endocrinol Invest (2021) 44(3):523–30. doi: 10.1007/s40618-020-01337-y
17. Plan and Operation of the Third National Health and Nutrition Examination Survey, 1988-94. Series 1: Programs and Collection Procedures. Vital Health Stat (1994) 1(32):1–407.
18. Zipf G, Chiappa M, Porter KS, Ostchega Y, Lewis BG, Dostal J. National Health and Nutrition Examination Survey: Plan and Operations, 1999-2010. Vital Health Stat (2013) 1(56):1–37.
19. American Diabetes Association. 2. Classification and Diagnosis of Diabetes: Standards of Medical Care in Diabetes- 2020. Diabetes Care (2020) 43(Suppl 1):S14–31. doi: 10.2337/dc20-S002
20. Kanis JA, McCloskey EV, Johansson H, Oden A, Melton LR, Khaltaev N. A Reference Standard for the Description of Osteoporosis. Bone (2008) 42(3):467–75. doi: 10.1016/j.bone.2007.11.001
21. Mathen PG, Thabah MM, Zachariah B, Das AK. Decreased Bone Mineral Density at the Femoral Neck and Lumbar Spine in South Indian Patients With Type 2 Diabetes. J Clin Diagn Res (2015) 9(9):OC08–12. doi: 10.7860/JCDR/2015/14390.6450
22. Yaturu S, Humphrey S, Landry C, Jain SK. Decreased Bone Mineral Density in Men With Metabolic Syndrome Alone and With Type 2 Diabetes. Med Sci Monit (2009) 15(1):CR5–9.
23. Ma L, Oei L, Jiang L, Estrada K, Chen H, Wang Z, et al. Association Between Bone Mineral Density and Type 2 Diabetes Mellitus: A Meta-Analysis of Observational Studies. Eur J Epidemiol (2012) 27(5):319–32. doi: 10.1007/s10654-012-9674-x
24. Li KH, Liu YT, Yang YW, Lin YL, Hung ML, Lin IC. A Positive Correlation Between Blood Glucose Level and Bone Mineral Density in Taiwan. Arch Osteoporos (2018) 13(1):78. doi: 10.1007/s11657-018-0494-9
25. Majima T, Komatsu Y, Yamada T, Koike Y, Shigemoto M, Takagi C, et al. Decreased Bone Mineral Density at the Distal Radius, But Not at the Lumbar Spineor the Femoral Neck, in Japanese Type 2 Diabetic Patients. Osteoporos Int (2005) 16(8):907–13. doi: 10.1007/s00198-004-1786-z
26. Kindler J, Zhan D, Sattler E, Ishikawa Y, Chen X, Gallo S. Bone Density in Youth With Prediabetes: Results From the National Health and Nutrition Examination Survey, 2005-2006. Osteoporos Int (2022) 33(2):467–74. doi: 10.1007/s00198-021-06148-2
27. Lee HS, Yoon JS, Park KJ, Lim JS, Hwang JS. The Relationship Between Bone Mineral Density and Type 2 Diabetes in Obese Children and Adolescents at the Time of Initial Diagnosis. Horm Metab Res (2019) 51(1):42–6. doi: 10.1055/a-0755-2799
28. Loxton P, Narayan K, Munns CF, Craig ME. Bone Mineral Density and Type 1 Diabetes in Children and Adolescents: A Meta-Analysis. Diabetes Care (2021) 44(8):1898–905. doi: 10.2337/dc20-3128
29. Leslie WD, Rubin MR, Schwartz AV, Kanis JA. Type 2 Diabetes and Bone. J Bone Miner Res (2012) 27(11):2231–7. doi: 10.1002/jbmr.1759
30. Vestergaard P. Discrepancies in Bone Mineral Density and Fracture Risk in Patients With Type 1 and Type 2 Diabetes–a Meta-Analysis. Osteoporos Int (2007) 18(4):427–44. doi: 10.1007/s00198-006-0253-4
31. Oei L, Zillikens MC, Dehghan A, Buitendijk GH, Castano-Betancourt MC, Estrada K, et al. High Bone Mineral Density and Fracture Risk in Type 2 Diabetes as Skeletal Complications of Inadequate Glucose Control: The Rotterdam Study. Diabetes Care (2013) 36(6):1619–28. doi: 10.2337/dc12-1188
32. Schwartz AV, Vittinghoff E, Bauer DC, Hillier TA, Strotmeyer ES, Ensrud KE, et al. Association of BMD and FRAX Score With Risk of Fracture in Older Adults With Type 2 Diabetes. JAMA (2011) 305(21):2184–92. doi: 10.1001/jama.2011.715
33. Schwartz AV, Hillier TA, Sellmeyer DE, Resnick HE, Gregg E, Ensrud KE, et al. Older Women With Diabetes Have a Higher Risk of Falls: A Prospective Study. Diabetes Care (2002) 25(10):1749–54. doi: 10.2337/diacare.25.10.1749
34. Kawada T. The Risk of Hip Fractures in Patients With Type 2 Diabetes Mellitus and Prediabetes. Bone (2022) 154:116226. doi: 10.1016/j.bone.2021.116226
35. Walsh JS, Vilaca T. Obesity, Type 2 Diabetes and Bone in Adults. Calcif Tissue Int (2017) 100(5):528–35. doi: 10.1007/s00223-016-0229-0
Keywords: diabetes, prediabetes, bone mineral density, dual-energy x-ray absorptiometry, National Health and Nutrition Examination Survey
Citation: Yuan J, Jia P and Zhou J-B (2022) Comparison of Bone Mineral Density in US Adults With Diabetes, Prediabetes and Normoglycemia From 2005 to 2018. Front. Endocrinol. 13:890053. doi: 10.3389/fendo.2022.890053
Received: 05 March 2022; Accepted: 26 April 2022;
Published: 30 May 2022.
Edited by:
Jeff M. P. Holly, University of Bristol, United KingdomReviewed by:
Wenxi Huang, University of Florida, United StatesShu Niu, University of Florida, United States
Copyright © 2022 Yuan, Jia and Zhou. This is an open-access article distributed under the terms of the Creative Commons Attribution License (CC BY). The use, distribution or reproduction in other forums is permitted, provided the original author(s) and the copyright owner(s) are credited and that the original publication in this journal is cited, in accordance with accepted academic practice. No use, distribution or reproduction is permitted which does not comply with these terms.
*Correspondence: Pu Jia, amlhcHVAY2NtdS5lZHUuY24=; Jian-Bo Zhou, amJ6aG91QGNjbXUuZWR1LmNu