 Kunzhe Lin
 Jianping Zhang3†
 Yinghong Lin
- 1Department of Neurosurgery, Affiliated Fuzhou First Hospital of Fujian Medical University, Fuzhou, China
- 2Fuzong Clinical Medical College of Fujian Medical University, Fuzhou, China
- 3Department of Urology, 910th Hospital of Joint Logistics Support Force, Quanzhou, China
- 4College of Integrated Chinese and Western Medicine, Fujian University of Traditional Chinese Medicine, Fuzhou, China
- 5Department of Neurosurgery, 900th Hospital, Fuzhou, China
Objective: The aim of this study was to investigate the metabolic differences between invasive and non-invasive nonfunctioning pituitary adenomas (NFPAs), determine the expression of an M2 macrophage marker in NFPAs, and analyze the effects of metabolic changes in invasive NFPAs on M2 macrophage infiltrates.
Methods: Tissue samples of NFPAs from patients who underwent transsphenoidal or craniotomy surgery from January 2021 to August 2021 were collected. NFPA tissues were analyzed based on a gas chromatography-mass spectrometry non-targeted metabolomics platform, and immunohistochemical staining for M2 macrophage marker CD206 was performed.
Results: We evaluated 15 invasive and 21 non-invasive NFPAs. A total of 22 metabolites were identified through non-targeted metabolomics analysis. Among them, the expression of 1-octadecanol, inosine 5’-monophosphate, adenosine 5’-monophosphate, guanosine 5’-monophosphate, creatinine, desmosterol, taurine, hypotaurine, lactic acid, and succinic acid was upregulated in invasive NFPAs, while that of 1-oleoylglycerol, arachidonic acid, cis-11-eicosenoic acid, docosahexaenoic acid, glyceric acid, hypoxanthine, linoleic acid, lysine, oleic acid, uracil, valine, and xanthine was downregulated. Immunohistochemical analysis suggested that the number of CD206-positive cells was higher in invasive NFPAs than in non-invasive NFPAs.
Conclusion: Invasive and non-invasive NFPAs showed distinct metabolite profiles. The levels of succinic acid and lactic acid were higher in invasive NFPAs, and the high expression of the M2 macrophage marker was verified in invasive NFPAs.
Introduction
Pituitary adenoma is the second most common intracranial tumor, with an incidence of 15% (1). Although they are benign, nearly 35–40% of pituitary adenomas are invasive (2, 3). These adenomas are large; invade the cavernous sinus, sphenoid sinus, and clivus; are prone to recurrence after surgery; and are resistant to conventional treatments, resulting in a more difficult treatment regimen (2, 4). Moreover, the six-year post-surgical survival rate is significantly lower in patients with invasive adenomas than in those with non-invasive pituitary adenomas (5). Therefore, understanding the mechanisms involved in pituitary adenoma invasion could lead to the discovery of new therapeutic targets in the future.
Metabolomics is one of the newest “omics” sciences, evaluating small molecules with molecular masses <1500 Da in various biological fluids or tissues to find a potential correlation of levels of these molecules with the physiological or pathological state of an organism (6). For example, metabolic alterations are characteristic of tumors and promote tumor progression (7, 8). In solid tumors, the microenvironment is often immunosuppressive presenting with hypoxic zones, which induce the metabolic reprogramming in tumor cells from oxidative phosphorylation to anaerobic glycolysis. This glycolytic switch enables hypoxic tumor cells to survive and proliferate (9). Moreover, lysophosphatidylethanolamine metabolism varies among different grades of gliomas: the level of lysophosphatidylethanolamines is decreased, whereas that of short-chain acylcarnitines is increased in high-grade gliomas (10). The related important metabolic pathways associated with glioma progression may provide clues for further studies on the mechanism and treatment of gliomas. Similarly, metabolomic studies on pituitary diseases are still in the early stages (6). Feng et al. have reported metabolic alterations in different pituitary adenoma subtypes (11); however, the metabolic differences between invasive and non-invasive pituitary adenomas remain unclear.
Studies have shown that tumor metabolism produces aberrant metabolites or intermediates that may play important roles in regulating immune cell proliferation, differentiation, activation, and function (12). For example, the metabolites succinate and lactate can promote the polarization of macrophages to the M2 type and promote tumor cell invasion (5, 9, 13). Macrophages respond to various microenvironmental signals generated by tumor and stromal cells, resulting into the alteration of their functional phenotype. Thus, macrophages can be divided into two categories according to their function: classic M1 macrophages and alternative M2 macrophages. M1 macrophages are involved in inflammatory responses, pathogen clearance, and antitumor immunity. Conversely, M2 macrophages influence anti-inflammatory responses, wound healing, and pro-tumor properties (14). Lu et al. have determined the expression of CD68 (a pan-macrophage marker) in macrophages in pituitary adenoma tissue (15); however, the expression of CD68 was not studied in M2 macrophages. Moreover, Yeung et al. investigated the expression of M2 macrophage markers in most pituitary adenomas (16). However, whether the expression of M2 macrophage markers differs between invasive and non-invasive nonfunctioning pituitary adenomas (NFPAs) has not been reported.
The aim of this study was to analyze NFPA tissues based on a gas chromatography (GC)-mass spectrometry (MS) non-targeted metabolomics platform and evaluate the metabolic differences between invasive and non-invasive NFPAs. In addition, CD206 immunohistochemical staining was performed on NFPAs to provide a new target for the treatment of invasive NFPAs.
Methods
Patients and Samples
Thirty-six NFPA tissue samples from patients who underwent transsphenoidal or craniotomy surgery at Fuzong Clinical Medical College of Fujian Medical University from January 2021 to August 2021 were collected. During the operation, we used tumor forceps to randomly collect solid tumors. A portion of the fresh tumor sample was frozen at -80°C for metabolomic assays, and a portion was fixed in 10% buffered formalin and embedded in paraffin for immunohistochemical staining. The inclusion criteria were as follows: patients 1) who underwent NFPA resection for the first time and 2) with pathologically confirmed pituitary adenoma. Exclusion criteria were as follows: 1) pituitary adenoma combined with other lesions in the sellar region, such as Rathke cleft cysts and 2) insufficient sample collection. Lesions of Knosp grades 0–2 were defined as non-invasive pituitary adenomas, while those of Knosp grades 3 or 4 were defined as invasive pituitary adenomas (17). Imaging assessment of NFPAs was performed by a neurosurgeon and a neuroradiologist. The mean age of the 36 patients was 49.8 ± 12.6 years. Additionally, 15 NFPAs were invasive, and 21 were non-invasive. The mean volume of the non-invasive NFPAs was 6.1 ± 4.4 cm3 and that of the invasive NFPAs was 21.7 ± 17.5 cm3(Table 1). The study was approved by the Ethics Committees of Fuzong Clinical Medical College of Fujian Medical University. All participants provided written informed consent.
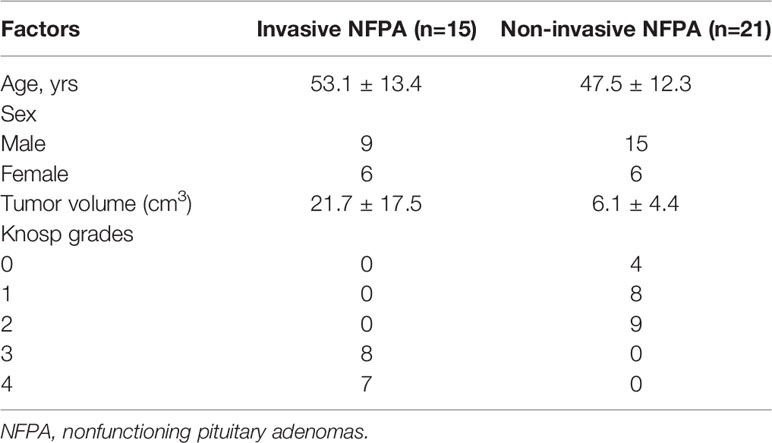
Table 1 Patient’s characteristics in invasive and non-invasive NFPA.
Metabolomics Analysis
Pituitary tumor tissue (50 mg) was added to an Eppendorf tube containing 1000 μL of chloroform/methanol/water solvent (v/v/v=2:5:2). The pituitary tumor tissue was homogenized in an ice bath using a TissueLyser (JX-24, Jingxin, Shanghai, China) with zirconia beads for 3 min at 30 Hz. A total of 800 μL of supernatant was transferred. The extraction was repeated by adding another 500 μL of ice-cold methanol to the residue. Then, 80 μL of the combined supernatants from the two extractions was mixed with 10 μL of internal standards (0.05 mg/mL of 13C3-15N-L-alanine, 13C5-15N-L-valine, 13C6-L-leucine, and 13C6-15N L-isoleucine) and evaporated to dryness under a gentle nitrogen stream. The dried residue was reconstituted in 30 μL of 20 mg/mL methoxyamine hydrochloride pyridine and incubated at 37°C for 90 min. Following the supplementation of another 30 μL of 1% trimethylchlorosilane, the sample was derivatized at 70°C for 60 min prior to GC-MS metabolomics analysis. Instrumental analysis was performed on an Agilent 7890A/5975C GC-MS system (Agilent Technologies Inc., Santa Clara, CA, USA). An HP 5 MS Accent fused silica capillary column (30 m × 0.25 mm × 0.25 μm; Agilent J&W Scientific, Folsom, CA, USA) was utilized to separate the derivatives.
For multivariate statistical analysis, the normalized data were preprocessed by UV scaling and mean centering before performing principal component analysis (PCA), partial least squares-discriminant analysis (PLS-DA), and orthogonal projections to latent structures-discriminant analysis (OPLS-DA). For univariate statistical analysis, the normalized data were calculated using Student’s t-test.
The factors with variable importance in the projection (VIP) values in the OPLS-DA model >1 and p-values from univariate statistical analysis <0.05 were identified as potential differential metabolites. Fold change (log2FC) was calculated as a binary logarithm of the average normalized peak intensity ratio between invasive and non-invasive NFPAs, where positive values indicated that the average mass response of invasive NFPAs was higher than that of non-invasive NFPAs. Metabolomics pathway analysis of the metabolic biomarkers was carried out using MetaboAnalyst (Version 5.0, https://www.metaboanalyst.ca).
Immunohistochemical Analysis
Immunohistochemical staining was performed on paraffin-embedded NFPA tissues. The tissues were sectioned with a thickness of 4 µm, and the sections were deparaffinized in xylene washing solution three times, followed by rehydration with ethanol. The sections were then immersed in citrate retrieval solution and heated in a microwave oven for antigen retrieval. Then, the sections were incubated in 3% H2O2 for 10 min to inhibit endogenous peroxidase activity and washed three times in phosphate-buffered saline (PBS). The sections were incubated with primary antibody rabbit anti-human CD206 monoclonal antibody (1:400, 91992S, CST) overnight at 4°C. The sections were washed thrice with PBS to remove antibody solution. They were then incubated with secondary antibody (1:50,000; KIT-5010; anti-rabbit/mouse IgG; Maixin Biotechnology Development Co., Ltd., Fuzhou, China) for 30 min at 37°C and washed with PBS. Next, the sections were stained with 3,3’-diaminobenzidine and a substrate-chromogen for 2 min at room temperature and redyed with hematoxylin. The stained tissue sections were observed using a CX41 microscope (Olympus, Tokyo, Japan) and assessed by two pathologists. Positively stained cells were counted in every field under high magnification (400×). The mean number from three random fields was used for analysis of each patient.
Statistical Analysis
The number of CD206-positive cells in the NFPA samples was expressed as the mean ± standard deviation. Comparisons between two groups were performed using a two-tailed unpaired Student’s t-test (for parametric analysis) or Mann–Whitney U test (for non-parametric analysis). Statistical analysis was performed using SPSS 19 (SPSS Inc., Chicago, IL, USA) and GraphPad Prism 5.0 (GraphPad Software, Inc., San Diego, CA, USA). P-values <0.05 were considered statistically significant.
Results
Differential Metabolite Screening
A plot of the PCA scores from the entire metabolite dataset did not show separations (Figure 1A). However, the plot of the PLS-DA scores demonstrated clear separations between invasive and non-invasive NFPAs (Figure 1B). Moreover, the OPLS-DA model could effectively distinguish the two groups of samples from invasive and non-invasive NFPAs (Figure 1C). The main quality parameters of the model were R2X=0.629, R2Y=0.984, and Q2 = 0.528.
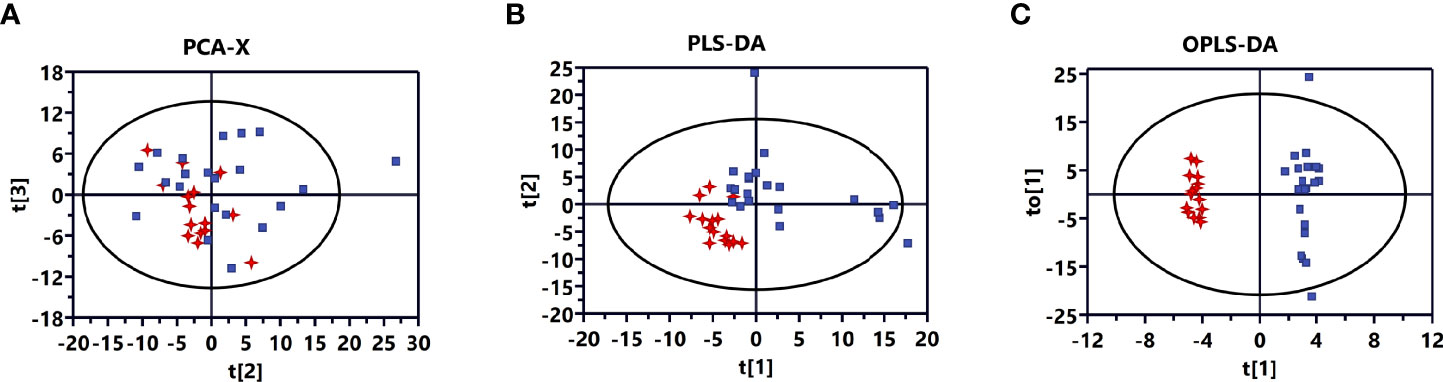
Figure 1 Multivariate statistical analysis for invasive nonfunctioning pituitary adenoma (NFPA) and non-invasive NFPA tissues. (A) Principal component analysis (PCA) score plot based on all differential metabolites for invasive (red dots) and non-invasive (blue dots) NFPA tissues. (B) Partial least squares-discriminant analysis (PLS-DA) score plot based on all differential metabolites for invasive (red dots) and non-invasive (blue dots) NFPA tissues. (C) Orthogonal projections to latent structures-discriminant analysis (OPLS-DA) score plot based on all differential metabolites for invasive (red dots) and non-invasive (blue dots) NFPA tissues.
Twenty-two metabolites with VIP >1 and P <0.05 were differentially expressed between invasive and non-invasive NFPAs. Among them, the expression of 12 metabolites downregulated, while that of 10 metabolites upregulated. The metabolites with upregulated expression in invasive NFPA were 1-octadecanol, inosine 5′-monophosphate (IMP), adenosine 5’-monophosphate (AMP), guanosine 5’-monophosphate (GMP), creatinine, desmosterol, taurine, hypotaurine, lactic acid, and succinic acid, while the metabolites with downregulated expression were 1-oleoylglycerol, arachidonic acid, cis-11-eicosenoic acid, docosahexaenoic acid (DHA), glyceric acid, hypoxanthine, linoleic acid, lysine, oleic acid, uracil, valine, and xanthine. The data of the differential metabolites are shown in Table 2.
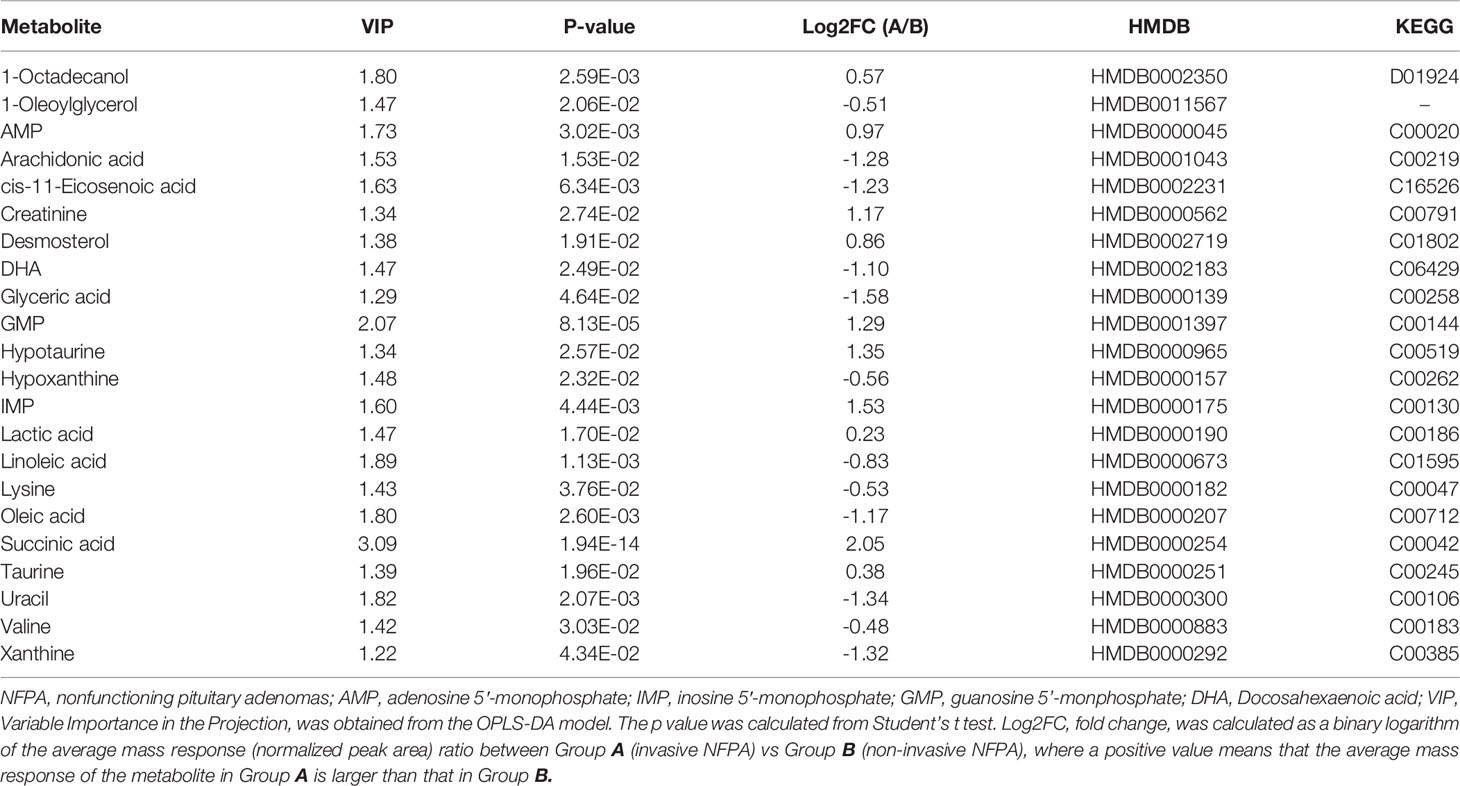
Table 2 The metabolic differences between invasive and non-invasive NFPA.
Pearson Correlation and Heatmap Analyses
To characterize the quantitative correlation between the different metabolites, we performed Pearson correlation analysis (R platform, version 3.4.3) on the quantitative data of these metabolites. Pearson correlation analysis demonstrated a positive correlation among IMP, AMP, and GMP. Arachidonic acid, DHA, oleic acid, and cis-11-eicosenoic acid were also positively correlated (Figure 2).
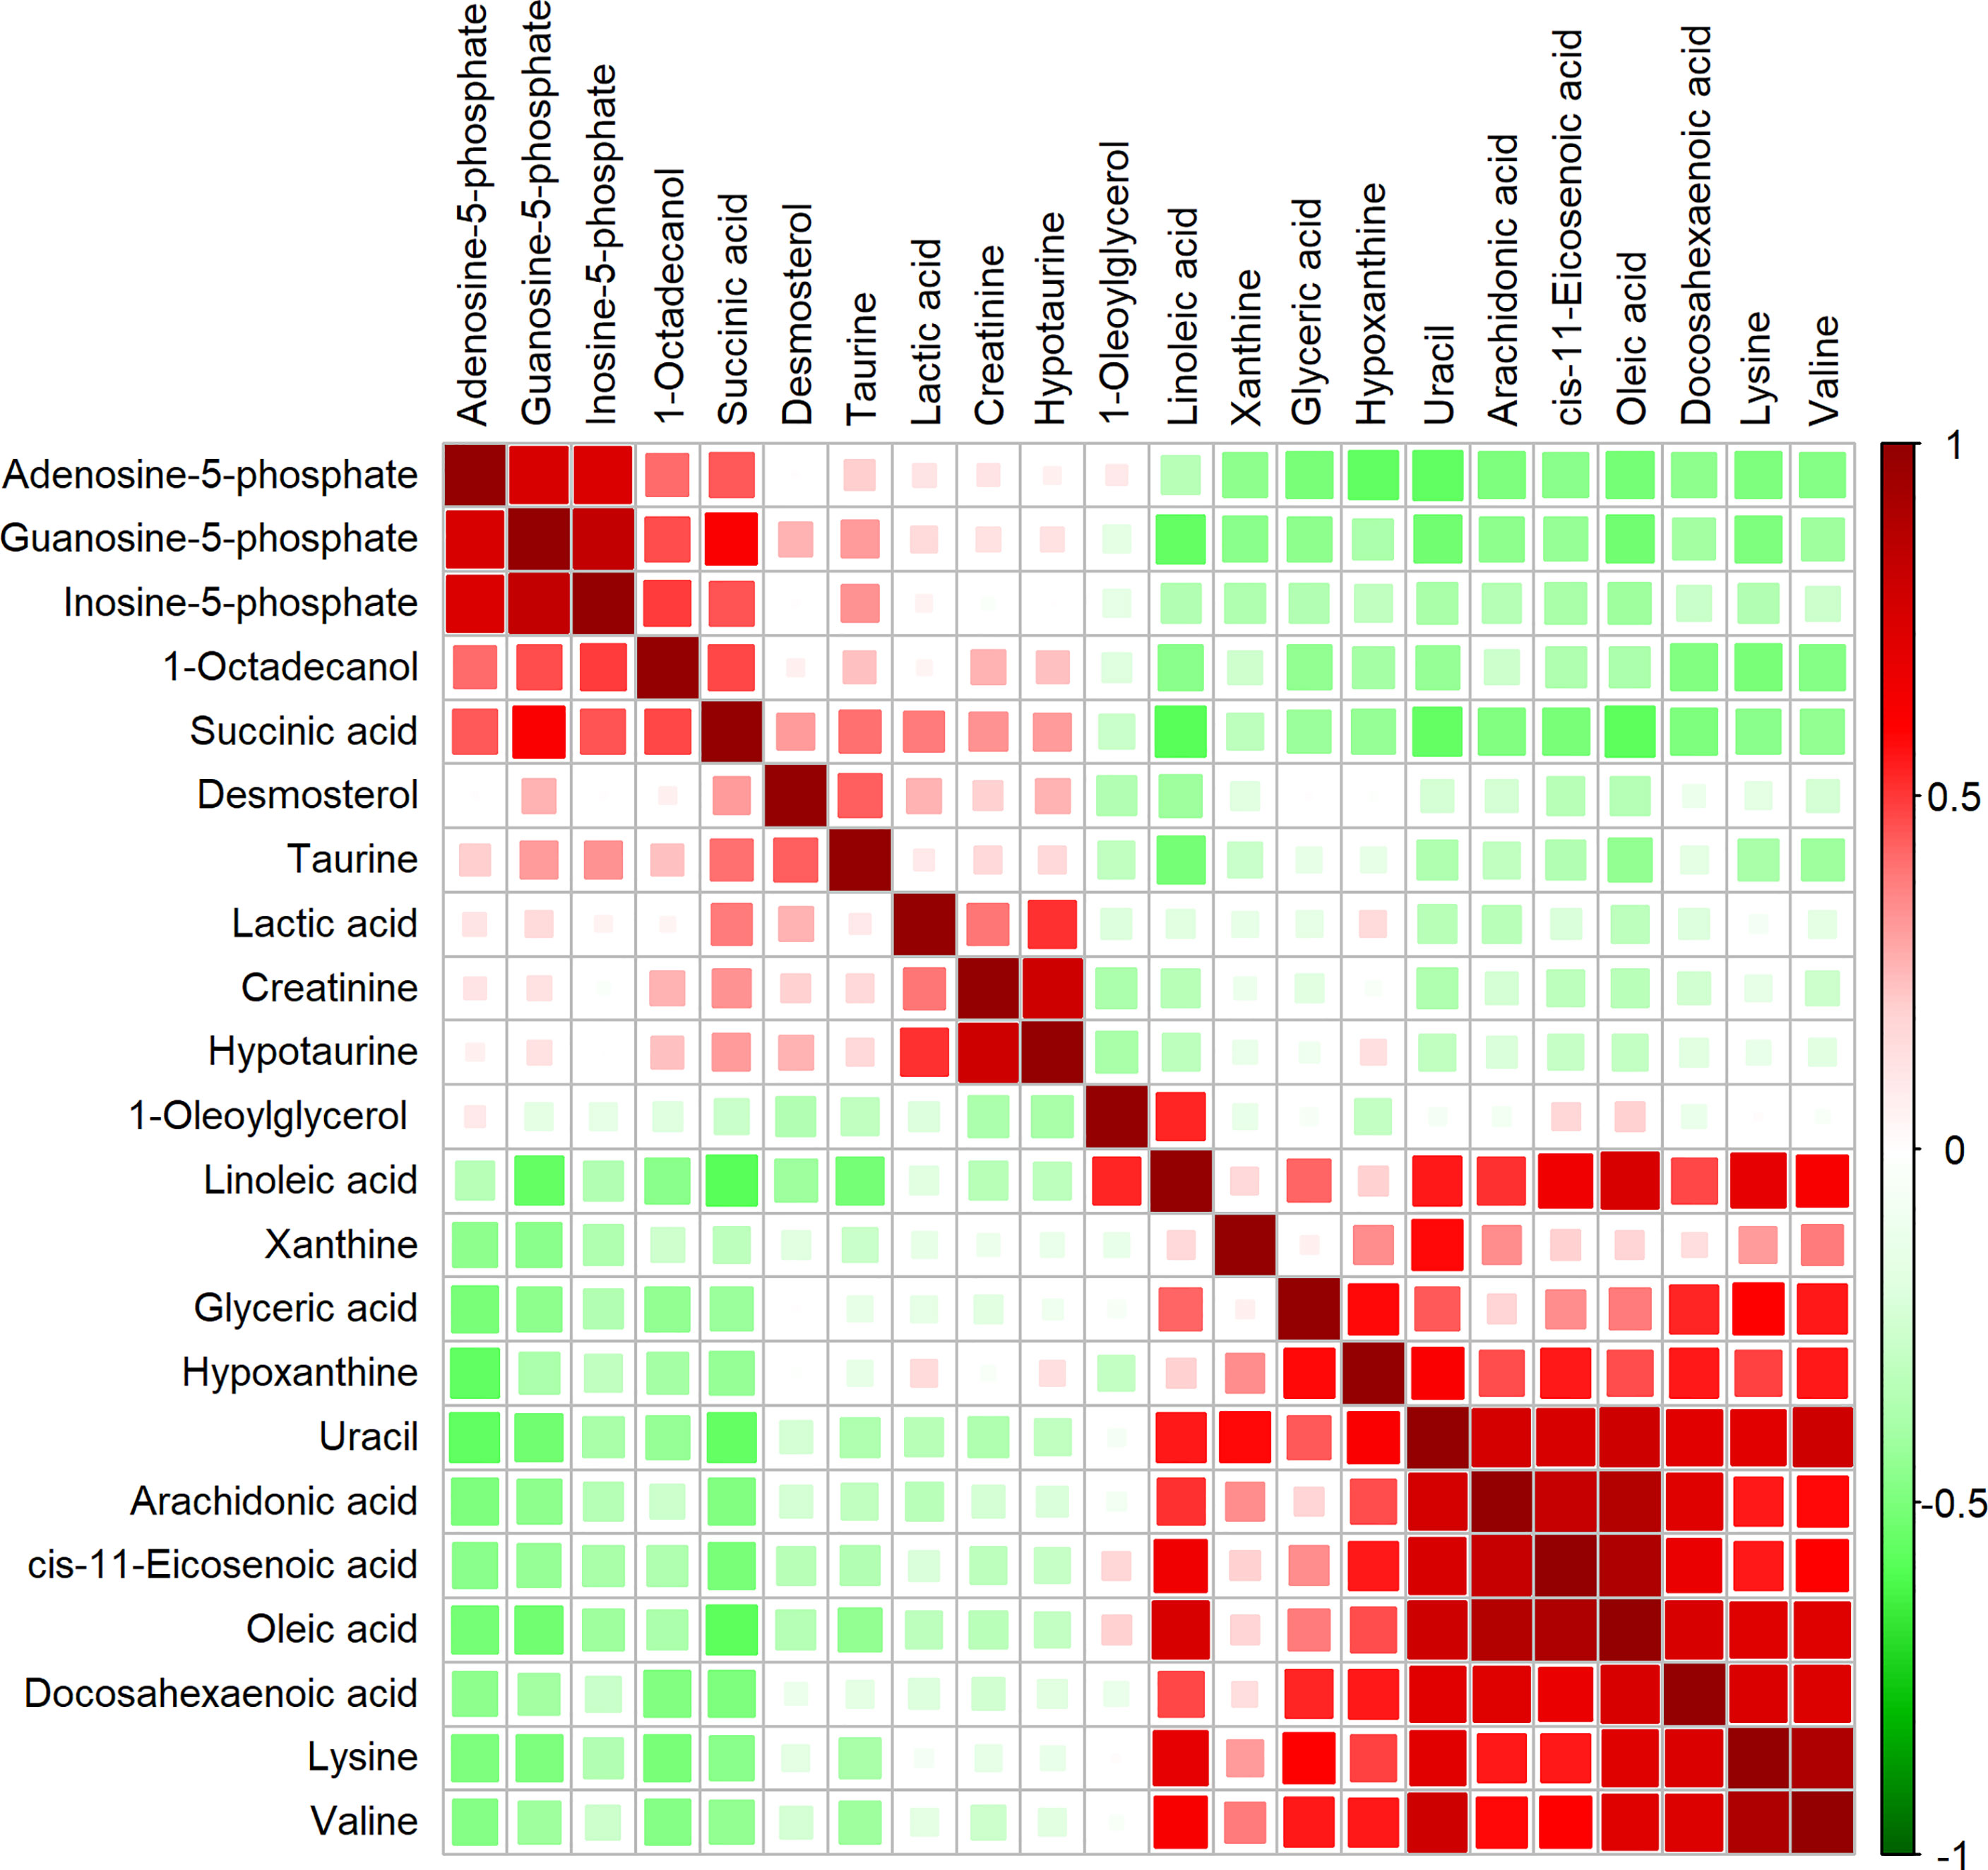
Figure 2 Correlation matrix obtained from significantly altered metabolites between invasive nonfunctioning pituitary adenoma (NFPA) and non-invasive NFPA tissues. Differential metabolites are represented in each row and column. The correlation coefficient values are shown on the right side of the figure. The size and color of the squares in the figure are related to the correlation between the differential metabolites. Red indicates a positive correlation between differential metabolites, and green indicates a negative correlation between differential metabolites.
We also performed heatmap analysis (R platform, version 3.4.3) on the quantitative information of these differential metabolites (Figure 3). The results showed metabolites with upregulated and downregulated expression in invasive NFPA, similar to those previously described.
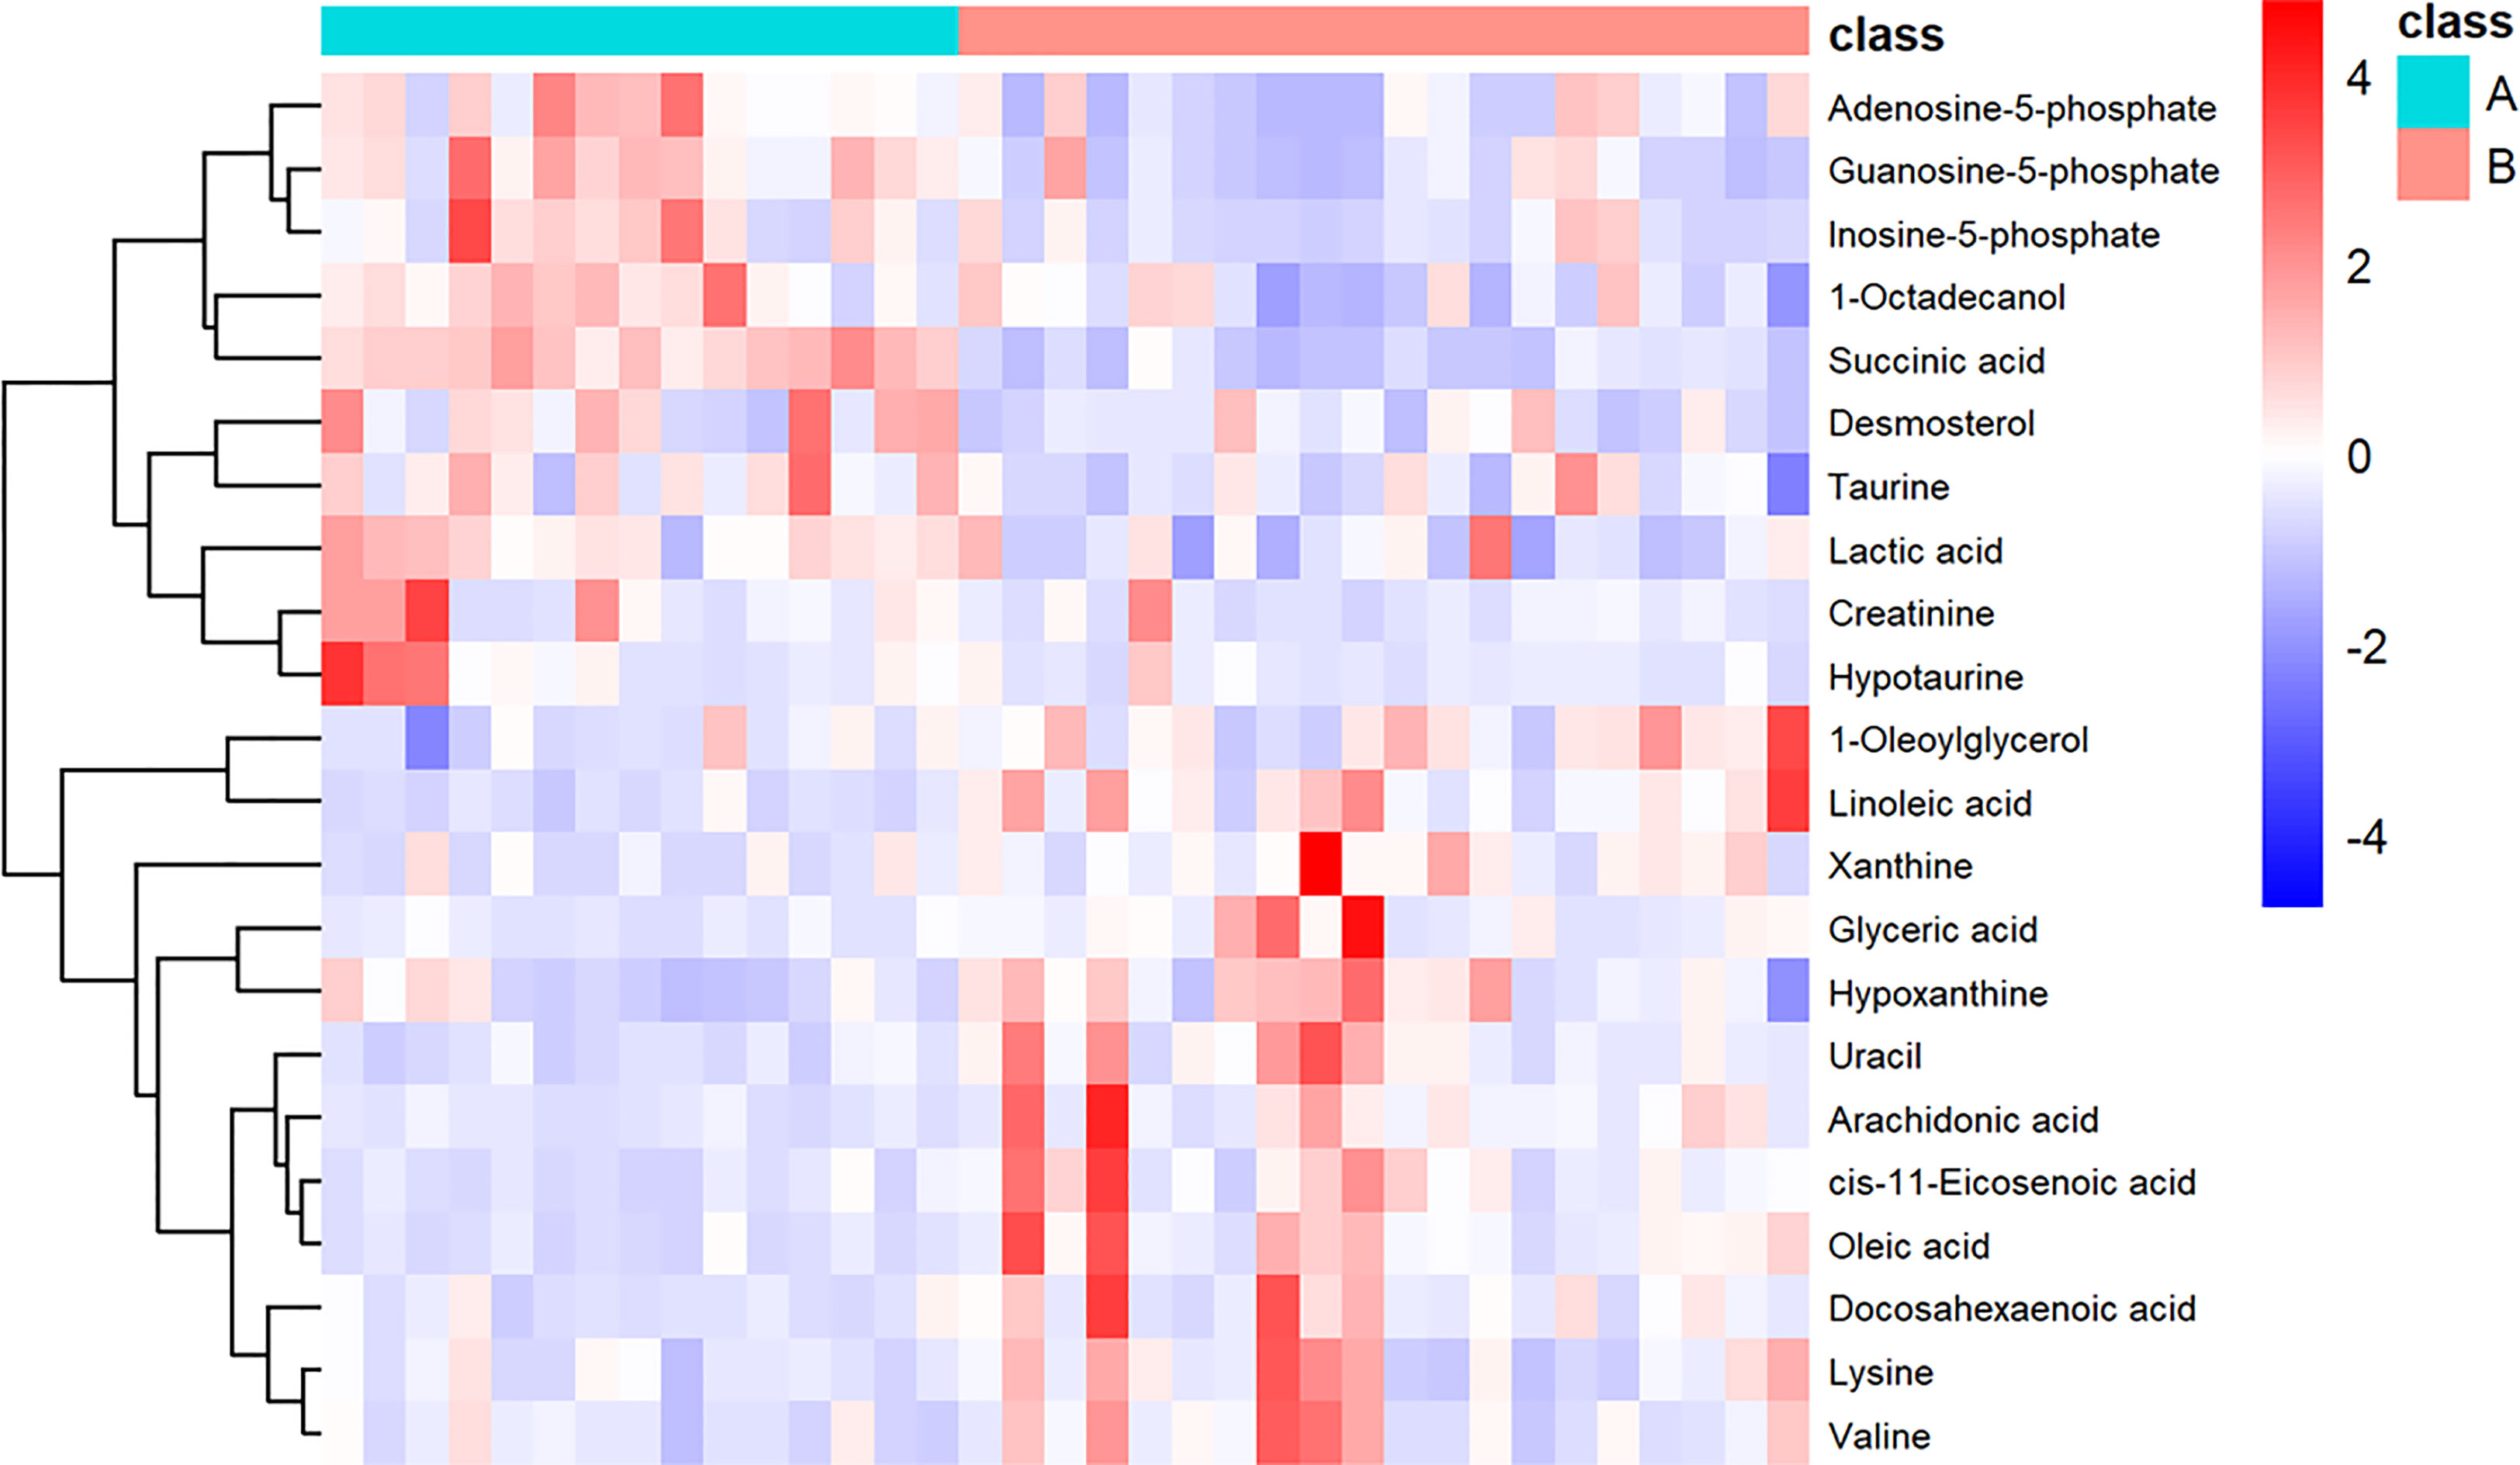
Figure 3 Heatmap showing the 22 important metabolites for invasive nonfunctioning pituitary adenoma (NFPA) and non-invasive NFPA tissues. Class A (invasive NFPA), Class B (non-invasive NFPA).
Pathway Analysis
Pathway analysis of differential metabolites was performed using MetaboAnalyst; the metabolome view is shown in Figure 4. Metabolic pathways associated with NFPA aggressiveness included the tricarboxylic acid cycle, as well as alanine, aspartate, glutamate, propanoate, and butanoate metabolism. The most important metabolic pathways were linoleic acid metabolism as well as taurine and hypotaurine metabolism.
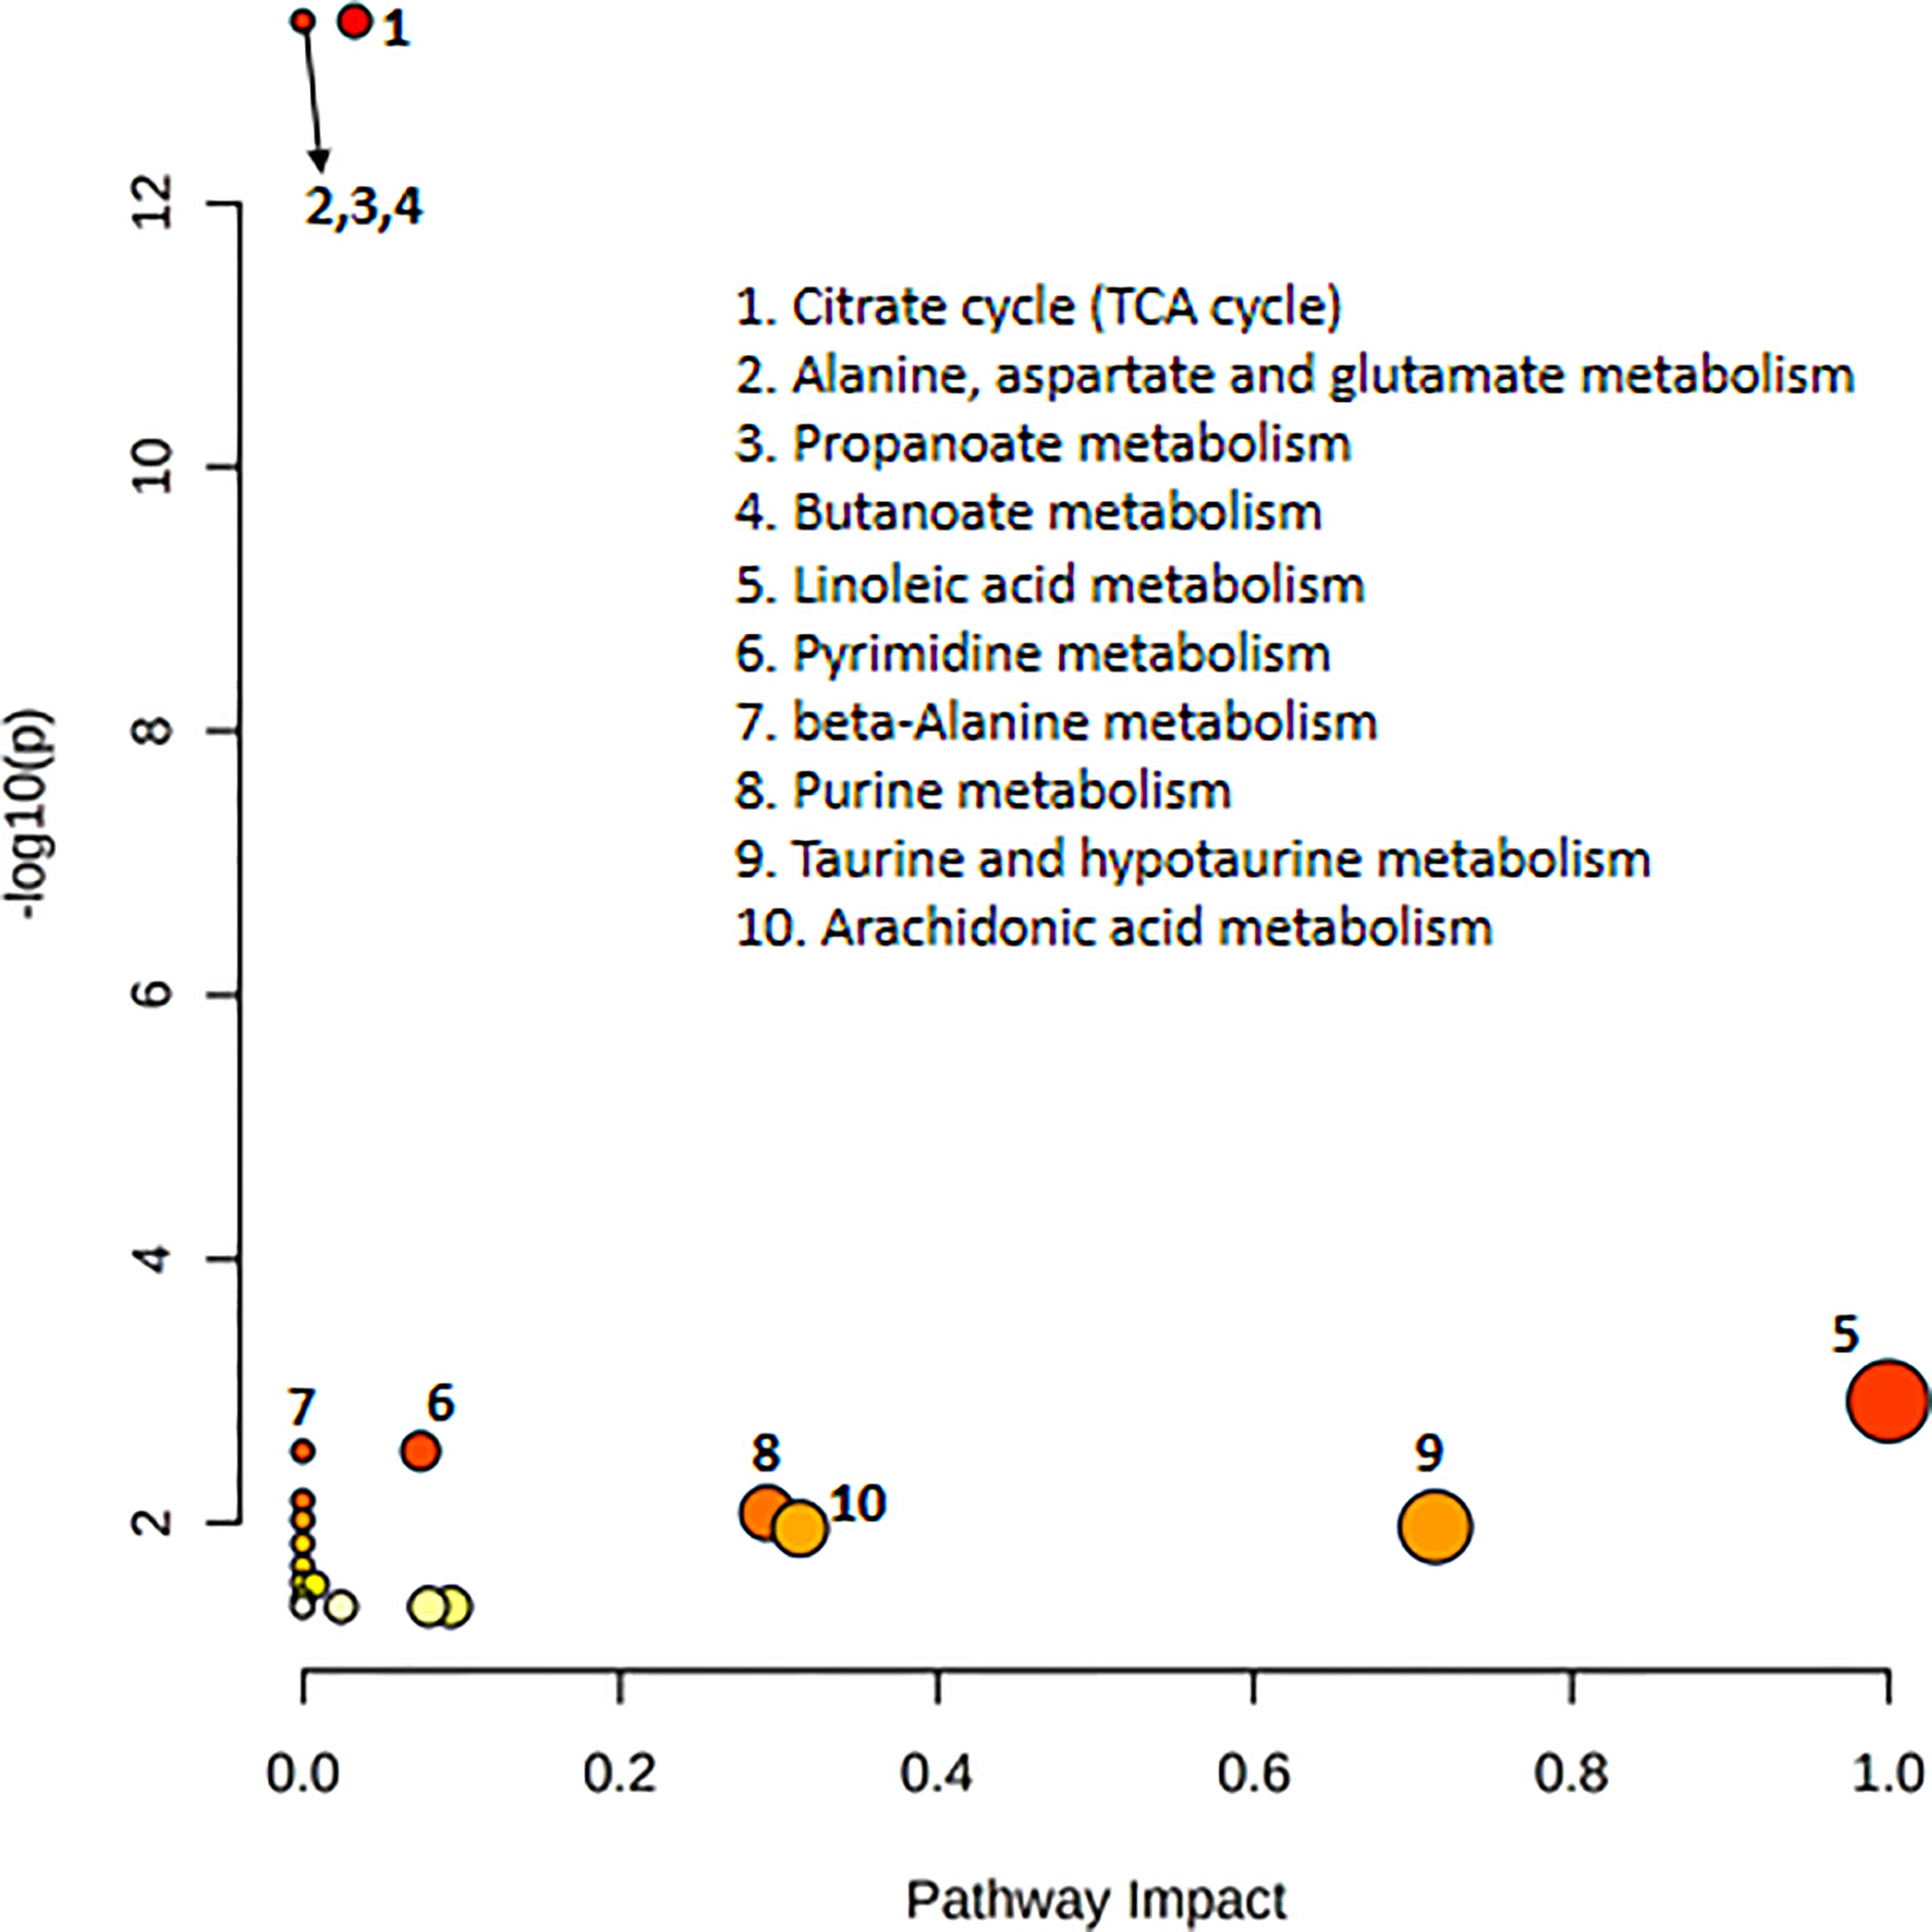
Figure 4 Pathway topology analysis depicting the dysregulated metabolic pathways associated with invasive nonfunctioning pituitary adenoma NFPA. The node color represents the p-values from pathway enrichment analysis, and the node radius indicates the pathway impact values.
Infiltration of CD206 Macrophages in NFPA
The expression of the M2 macrophage marker CD206 and presence of M2 macrophages in NFPA were evaluated using immunohistochemistry (Figure 5). The number of CD206-positive cells in invasive NFPA (12.66 ± 4.80 cells/field) was higher than that in non-invasive NFPA (4.00 ± 3.02 cells/field, p < 0.001) (Figure 6).
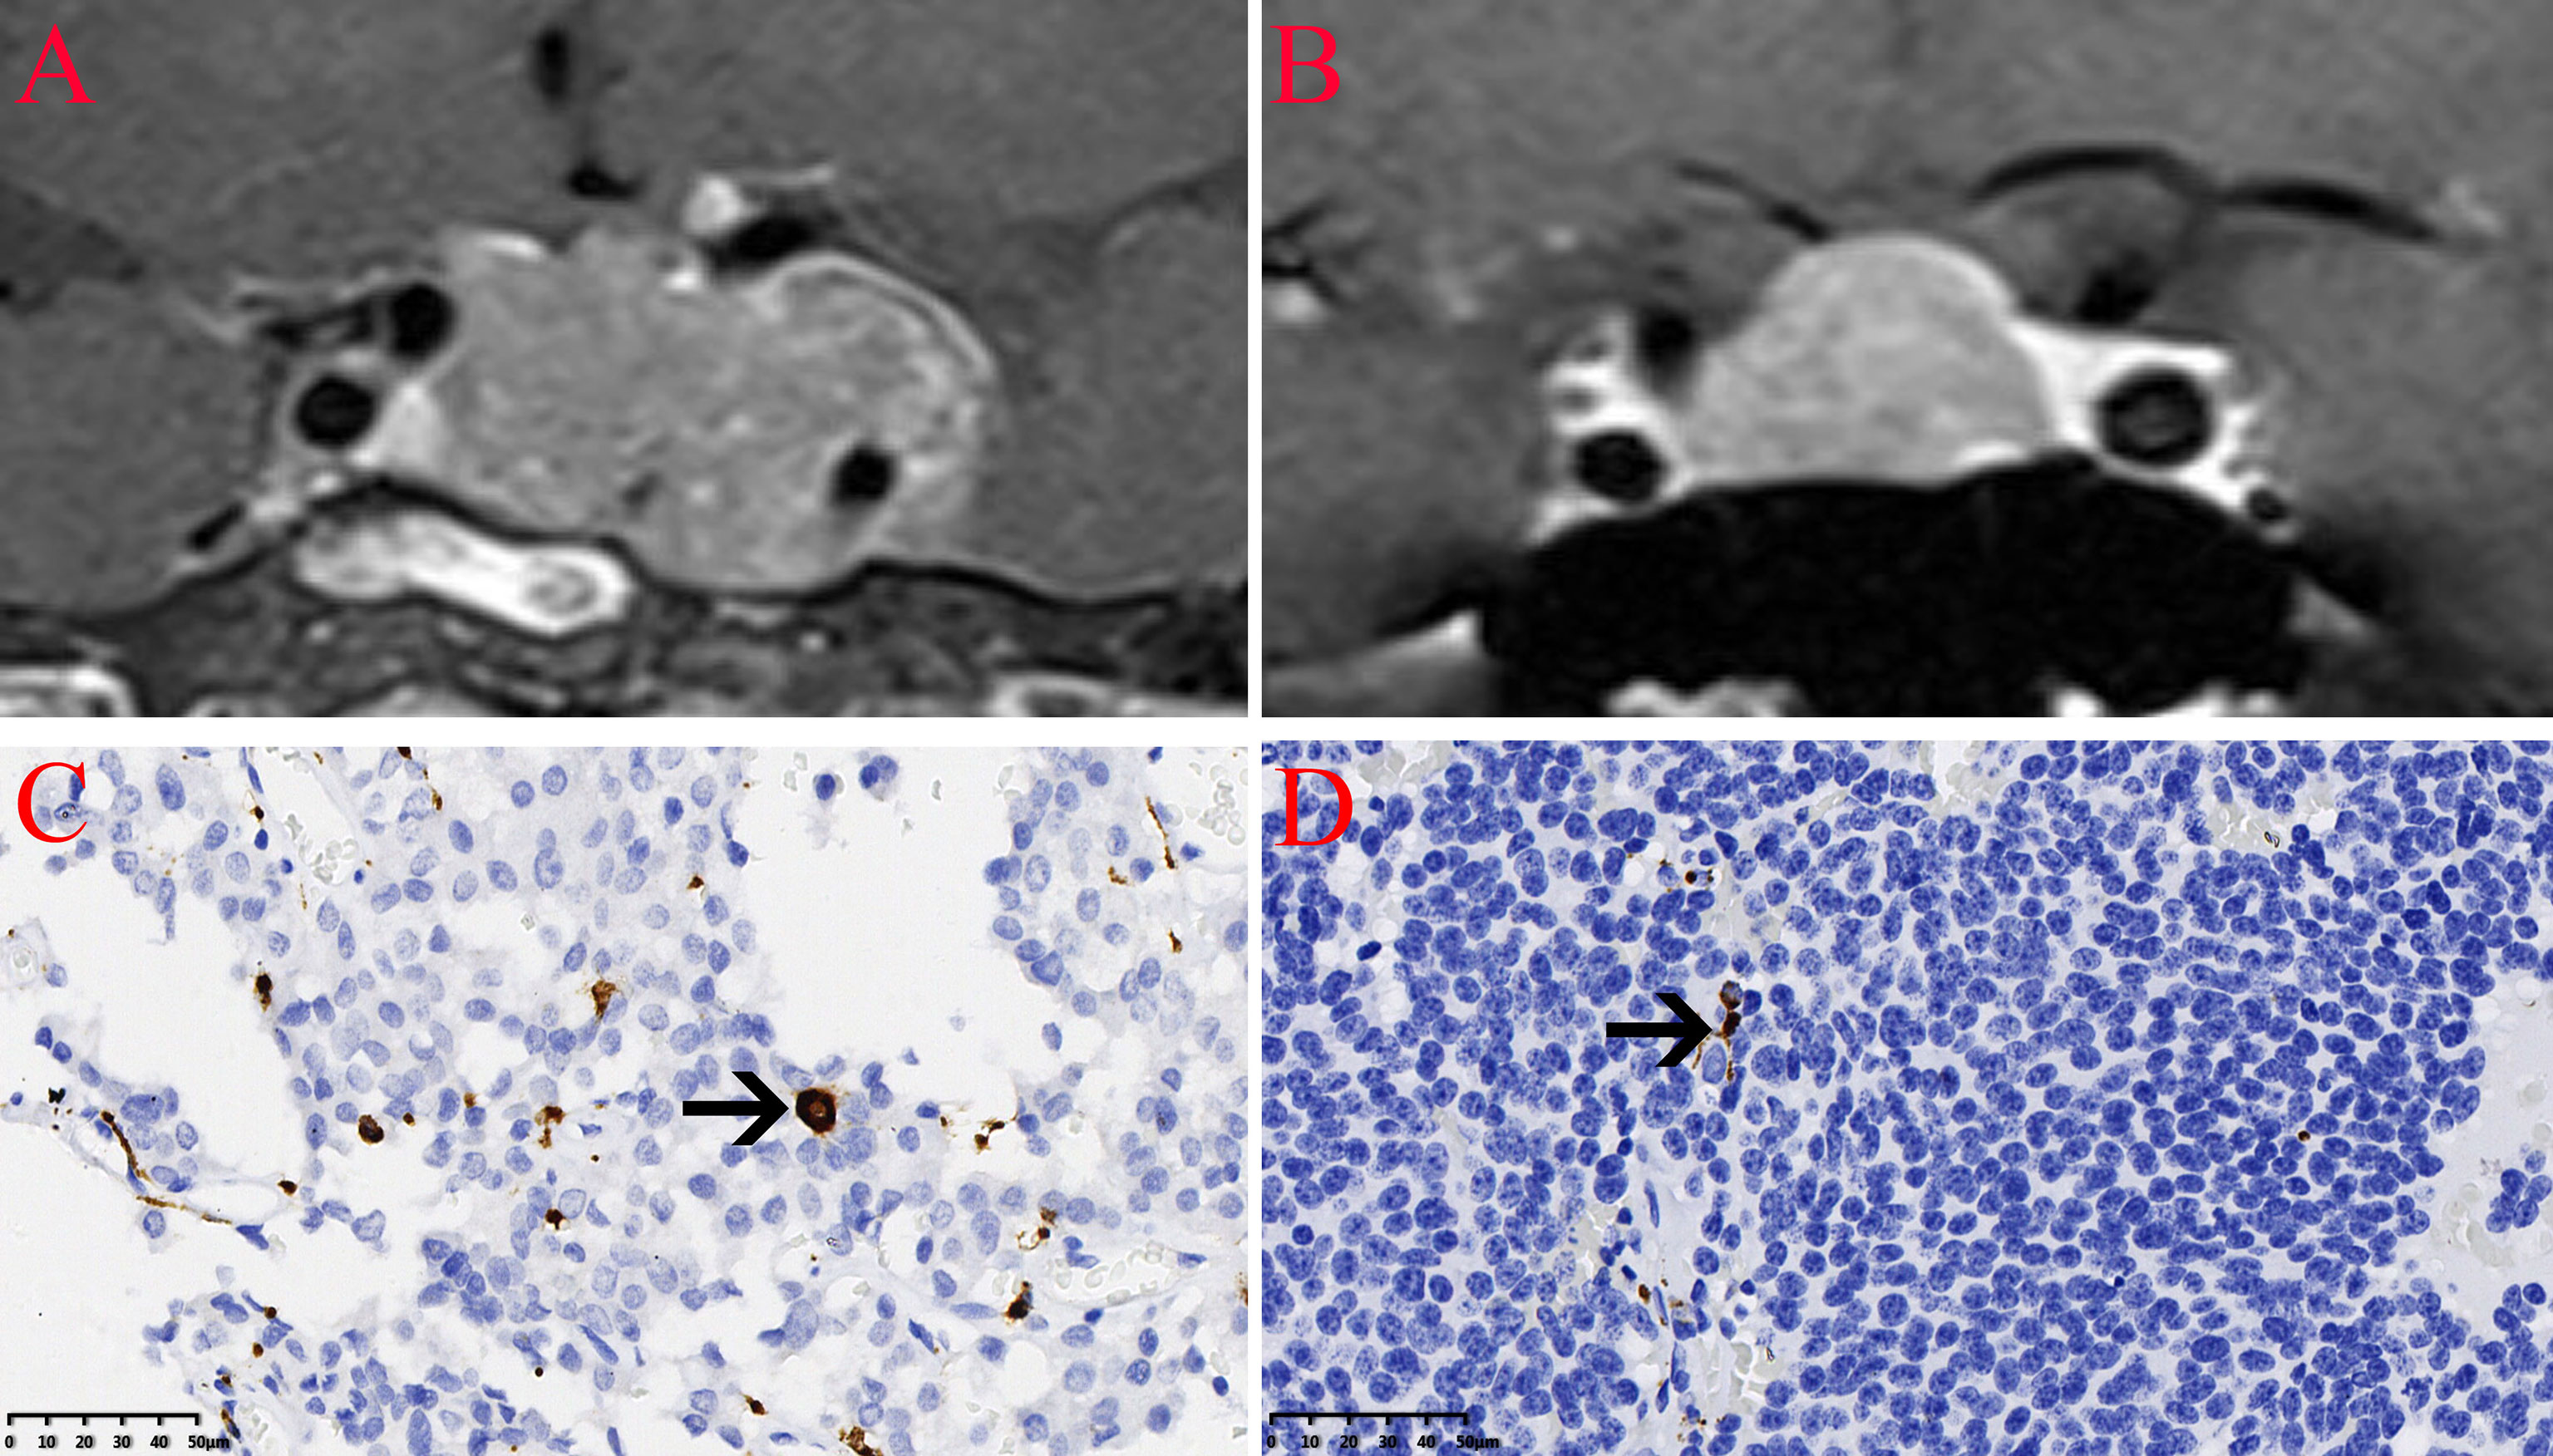
Figure 5 Infiltration of CD206 macrophages in nonfunctioning pituitary adenomas NFPAs. The CD206 macrophages are indicated by the arrow. (A) Coronal contrast-enhanced image showing invasive pituitary adenomas. (B) Coronal contrast-enhanced image showing non-invasive pituitary adenomas. (C) Infiltration of CD206 macrophages in invasive NFPAs. (D) Infiltration of CD206 macrophages in non-invasive NFPAs.
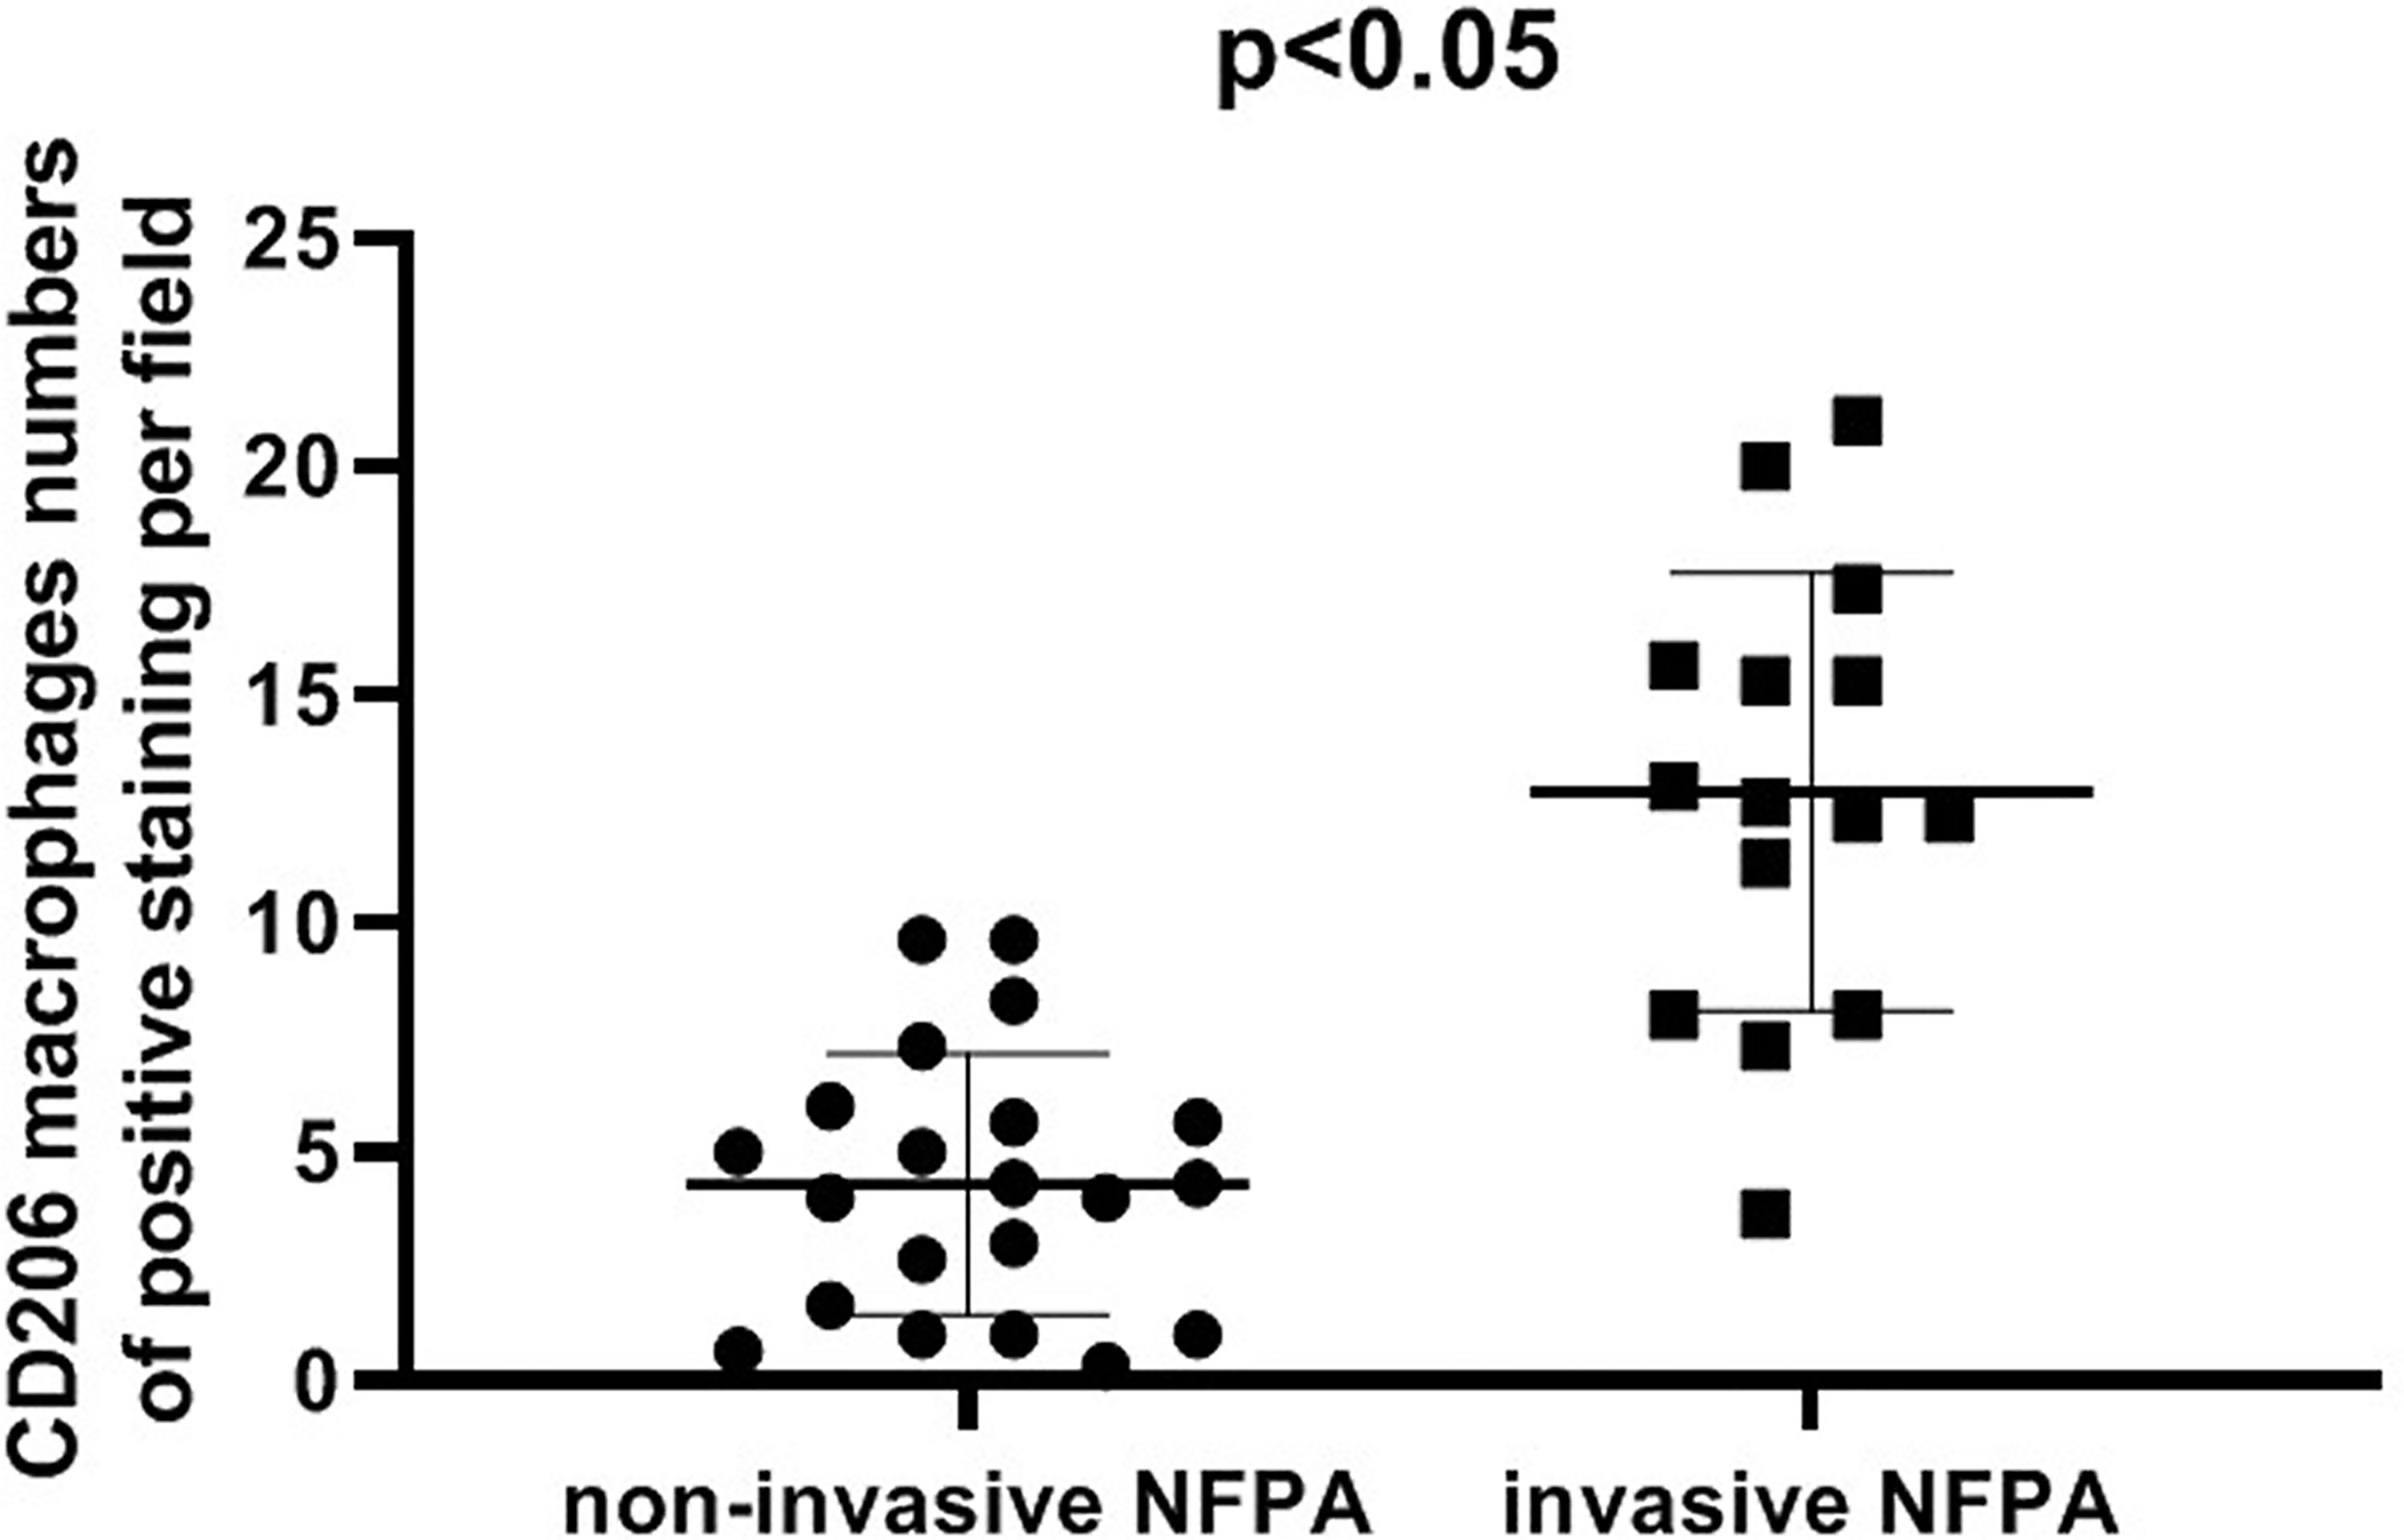
Figure 6 Comparison of CD206 macrophage expression between invasive nonfunctioning pituitary adenoma (NFPA) and non-invasive NFPA.
Discussion
Metabolic alterations in pituitary adenomas are poorly understood. In this study, we aimed to understand the metabolic differences between invasive and non-invasive NFPAs and provide a new perspective on the aggressiveness of pituitary adenomas.
This study is the first to identify the accumulation of succinate and lactate in invasive NFPA. Succinic acid is an intermediate metabolite in the tricarboxylic acid cycle, which is a metabolic pathway for the production of cellular energy and biosynthetic intermediates in aerobic organisms (18). The accumulation of succinic acid suggests blockage of the tricarboxylic acid cycle pathway. Moreover, lactic acid is the metabolic end product of glycolysis. In contrast to normal cells, tumor cells tend to undergo glycolysis in the cytoplasm even in the presence of oxygen, which is known as the “Warburg effect” (12). Thus, aerobic oxidative metabolism and glycolytic metabolism differ between invasive and non-invasive NFPAs. Hence, the role of succinic acid and lactic acid in promoting the invasion of pituitary adenomas is yet to be determined.
Studies have shown that high infiltration of macrophages in solid tumors is associated with poor clinical outcomes (19). Multiple components of the tumor microenvironment induce macrophage polarization to the M2 type, thus exerting a tumor-promoting effect. Moreover, cancer-derived succinate has been demonstrated to promote macrophage polarization and cancer metastasis by activating the PI3K-hypoxia-inducible factor 1a axis (13). In addition, Zhang et al. showed that lactate secreted by pituitary adenoma cells promotes macrophage polarization to the M2 type through the mTORC2 and ERK signaling pathways (5). However, the differential expression of M2 macrophage markers in invasive NFPA versus non-invasive NFPA is unknown. In addition to confirming the accumulation of succinate and lactate in invasive NFPA, we also found that the expression of M2 macrophage marker CD206 was significantly upregulated in invasive NFPA. Finally, M2 macrophages mainly promote tumor invasiveness by suppressing immunity, pituitary adenoma cell epithelial-mesenchymal transition and proliferation, vascularization, and extracellular matrix remodeling (20).
The metabolomics analysis in this study suggested that the unsaturated fatty acid biosynthesis and metabolic pathways differed between invasive and non-invasive NFPA, including that of arachidonic acid, DHA, oleic acid, and cis-11-eicosenoic acid. We observed that the levels of the above metabolites were lower in invasive NFPA than in non-invasive NFPA. Arachidonic acid and linoleic acid are omega-6 polyunsaturated fatty acids, which have tumor-promoting effects, while DHA is an omega-3 polyunsaturated fatty acid, which has a tumor-suppressing effect (21). Furthermore, DHA has anti-inflammatory, anti-proliferative, pro-apoptotic, anti-angiogenic, anti-invasive, and anti-metastatic properties (22). Wang et al. compared the differences in the levels of serum polyunsaturated fatty acids between patients with malignant tumors and healthy people. They found that the levels of arachidonic acid, total omega-6, DHA, and total omega-3 were significantly reduced in those with malignant tumors (23). Peroxidation of omega-3 and omega-6 polyunsaturated fatty acids exerts antitumor effects in acidic tumor environments (24). Our study initially revealed a difference in lipid metabolism between invasive and non-invasive NFPAs; however, the association of this difference with the aggressiveness of NFPA warrants further investigation.
Purines are an essential component of nucleotides in cell proliferation (25). Increased purine synthesis may be associated with tumorigenesis, and metabolites of the purine synthesis pathway, such as IMP, AMP, adenine, and GMP, have recently received extensive attention (26). Moreover, the levels of IMP, AMP, and GMP were increased in tumor stem cells (27). The present study revealed that the levels of metabolites in the purine synthesis pathway were higher in invasive NFPA than in non-invasive NFPA, suggesting that purine metabolism is involved in NFPA invasion. In addition, the levels of xanthine and hypoxanthine were decreased in invasive NFPA, which may be due to increased DNA synthesis in hyperproliferative tissues (28). These metabolites are intermediates of the purine degradation pathway.
We found taurine and hypotaurine to be important differential metabolites between invasive and non-invasive NFPAs. Elevated levels of taurine can be seen in breast cancer (29), thyroid cancer (30), colon cancer (31), and acute myeloid leukemia (32). In addition, taurine concentrations in gliomas and meningiomas were higher than those in extra-tumoral brain tissue (33). Increased taurine synthesis is a cellular response to hypoxia and reperfusion injury, as repeated hypoxia leads to higher levels of taurine (34). However, taurine is also thought to exert antitumor effects by inducing tumor cell apoptosis through various mechanisms (35). Nevertheless, the mechanism of action of taurine in invasive NFPAs requires further study. Meanwhile, studies have shown that hypotaurine, an intermediate in the biosynthesis of taurine is positively correlated with glioma grade and promotes cell proliferation and invasion by competitively inhibiting prolyl hydroxylase domain-2, leading to activation of the hypoxia signal (36).
Invasive and non-invasive NFPAs showed distinct metabolite profiles. Alterations in unsaturated fatty acid biosynthesis, as well as tricarboxylic acid, glycolytic, purine, taurine, and hypotaurine metabolism may be involved in the aggressiveness of NFPA.
Our study has several limitations. First, the sample size of this study was relatively small, and further studies with larger sample sizes are needed to confirm the metabolic differences between invasive and non-invasive NFPAs. Second, key differential metabolites determined by metabolomic analysis, such as succinic acid and lactic acid, require further verification by western blotting and quantitative reverse-transcription polymerase chain reaction. Finally, the changes in metabolites affecting macrophage phenotype in pituitary adenomas lack verification at the cellular level.
Conclusions
In this study, metabolomic analysis was performed on invasive and non-invasive NFPAs, and the differential metabolites and metabolic pathways were preliminarily identified. We verified the high expression of the M2 macrophage marker CD206 in invasive NFPAs by immunohistochemistry.
Data Availability Statement
The original contributions presented in the study are included in the article/supplementary material. Further inquiries can be directed to the corresponding author.
Ethics Statement
The studies involving human participants were reviewed and approved by Fuzong Clinical Medical College of Fujian Medical University. The patients/participants provided their written informed consent to participate in this study.
Author Contributions
KL, JZ, and SW contributed to conception and design of the study. KL and YL performed data collection. JZ and YL performed the statistical analysis. KL wrote the first draft of the manuscript. JZ, YL, ZP and SW wrote sections of the manuscript. All authors contributed to manuscript revision, read, and approved the submitted version.
Funding
This work was supported by the Natural Science Foundation of Fujian Province [2021J011306] and Department of Science and Technology of Fuzhou City [2021-S-180].
Conflict of Interest
The authors declare that the research was conducted in the absence of any commercial or financial relationships that could be construed as a potential conflict of interest.
Publisher’s Note
All claims expressed in this article are solely those of the authors and do not necessarily represent those of their affiliated organizations, or those of the publisher, the editors and the reviewers. Any product that may be evaluated in this article, or claim that may be made by its manufacturer, is not guaranteed or endorsed by the publisher.
References
1. Ostrom QT, Cioffi G, Waite K, Kruchko C, Barnholtz-Sloan JS. CBTRUS Statistical Report: Primary Brain and Other Central Nervous System Tumors Diagnosed in the United States in 2014-2018. Neuro Oncol (2021) 23:iii1–1iii105. doi: 10.1093/neuonc/noab200
2. Liu X, Wang R, Li M, Chen G. Pituitary Adenoma or Pituitary Neuroendocrine Tumor: A Narrative Review of Controversy and Perspective. Transl Cancer Res (2021) 10:1916–20. doi: 10.21037/tcr-20-3446
3. Han C, Lin S, Lu X, Xue L, Wu ZB. Tumor-Associated Macrophages: New Horizons for Pituitary Adenoma Researches. Front Endocrinol (Lausanne). (2021) 12:785050. doi: 10.3389/fendo.2021.785050
4. Ceccato F, Regazzo D, Barbot M, Denaro L, Emanuelli E, Borsetto D, et al. Early Recognition of Aggressive Pituitary Adenomas: A Single-Centre Experience. Acta Neurochir (Wien). (2018) 160:49–55. doi: 10.1007/s00701-017-3396-5
5. Zhang A, Xu Y, Xu H, Ren J, Meng T, Ni Y, et al. Lactate-Induced M2 Polarization of Tumor-Associated Macrophages Promotes the Invasion of Pituitary Adenoma by Secreting CCL17. Theranostics. (2021) 11:3839–52. doi: 10.7150/thno.53749
6. Pînzariu O, Georgescu B, Georgescu CE. Metabolomics-A Promising Approach to Pituitary Adenomas. Front Endocrinol (Lausanne). (2018) 9:814. doi: 10.3389/fendo.2018.00814
7. Pavlova NN, Thompson CB. The Emerging Hallmarks of Cancer Metabolism. Cell Metab (2016) 23:27–47. doi: 10.1016/j.cmet.2015.12.006
8. Ohshima K, Morii E. Metabolic Reprogramming of Cancer Cells During Tumor Progression and Metastasis. Metabolites. (2021) 11:28. doi: 10.3390/metabo11010028
9. Kes M, Van den Bossche J, Griffioen AW, Huijbers E. Oncometabolites Lactate and Succinate Drive Pro-Angiogenic Macrophage Response in Tumors. Biochim Biophys Acta Rev Cancer. (2020) 1874:188427. doi: 10.1016/j.bbcan.2020.188427
10. Yu D, Xuan Q, Zhang C, Hu C, Li Y, Zhao X, et al. Metabolic Alterations Related to Glioma Grading Based on Metabolomics and Lipidomics Analyses. Metabolites. (2020) 10:478. doi: 10.3390/metabo10120478
11. Feng J, Gao H, Zhang Q, Zhou Y, Li C, Zhao S, et al. Metabolic Profiling Reveals Distinct Metabolic Alterations in Different Subtypes of Pituitary Adenomas and Confers Therapeutic Targets. J Transl Med (2019) 17:291. doi: 10.1186/s12967-019-2042-9
12. Xia L, Oyang L, Lin J, Tan S, Han Y, Wu N, et al. The Cancer Metabolic Reprogramming and Immune Response. Mol Cancer. (2021) 20:28. doi: 10.1186/s12943-021-01316-8
13. Wu JY, Huang TW, Hsieh YT, Wang YF, Yen CC, Lee GL, et al. Cancer-Derived Succinate Promotes Macrophage Polarization and Cancer Metastasis via Succinate Receptor. Mol Cell (2020) 77:213–27.e5. doi: 10.1016/j.molcel.2019.10.023
14. Chanmee T, Ontong P, Konno K, Itano N. Tumor-Associated Macrophages as Major Players in the Tumor Microenvironment. Cancers (Basel). (2014) 6:1670–90. doi: 10.3390/cancers6031670
15. Lu JQ, Adam B, Jack AS, Lam A, Broad RW, Chik CL. Immune Cell Infiltrates in Pituitary Adenomas: More Macrophages in Larger Adenomas and More T Cells in Growth Hormone Adenomas. Endocr Pathol (2015) 26:263–72. doi: 10.1007/s12022-015-9383-6
16. Yeung JT, Vesely MD, Miyagishima DF. In Silico Analysis of the Immunological Landscape of Pituitary Adenomas. J Neurooncol. (2020) 147:595–8. doi: 10.1007/s11060-020-03476-x
17. Knosp E, Steiner E, Kitz K, Matula C. Pituitary Adenomas With Invasion of the Cavernous Sinus Space: A Magnetic Resonance Imaging Classification Compared With Surgical Findings. Neurosurgery. (1993) 33:610–7; discussion 617-8. doi: 10.1227/00006123-199310000-00008
18. Eniafe J, Jiang S. The Functional Roles of TCA Cycle Metabolites in Cancer. Oncogene. (2021) 40:3351–63. doi: 10.1038/s41388-020-01639-8
19. Cassetta L, Pollard JW. Tumor-Associated Macrophages. Curr Biol (2020) 30:R246–246R248. doi: 10.1016/j.cub.2020.01.031
20. Salmaninejad A, Valilou SF, Soltani A, Ahmadi S, Abarghan YJ, Rosengren RJ, et al. Tumor-Associated Macrophages: Role in Cancer Development and Therapeutic Implications. Cell Oncol (Dordr). (2019) 42:591–608. doi: 10.1007/s13402-019-00453-z
21. Xu Y, Qian SY. Anti-Cancer Activities of ω-6 Polyunsaturated Fatty Acids. BioMed J (2014) 37:112–9. doi: 10.4103/2319-4170.131378
22. Merendino N, Costantini L, Manzi L, Molinari R, D’Eliseo D, Velotti F. Dietary ω -3 Polyunsaturated Fatty Acid DHA: A Potential Adjuvant in the Treatment of Cancer. BioMed Res Int (2013) 2013:310186. doi: 10.1155/2013/310186
23. Wang S, Xie J, Li H, Yang K. Differences of Polyunsaturated Fatty Acid in Patients With Colorectal Cancer and Healthy People. J Cancer Res Ther (2015) 11:459–63. doi: 10.4103/0973-1482.147702
24. Dierge E, Debock E, Guilbaud C, Corbet C, Mignolet E, Mignard L, et al. Peroxidation of N-3 and N-6 Polyunsaturated Fatty Acids in the Acidic Tumor Environment Leads to Ferroptosis-Mediated Anticancer Effects. Cell Metab (2021) 33:1701–15.e5. doi: 10.1016/j.cmet.2021.05.016
25. Yin J, Ren W, Huang X, Deng J, Li T, Yin Y. Potential Mechanisms Connecting Purine Metabolism and Cancer Therapy. Front Immunol (2018) 9:1697. doi: 10.3389/fimmu.2018.01697
26. Feng S, Liu Y. Metabolomics of Glioma. Adv Exp Med Biol (2021) 1280:261–76. doi: 10.1007/978-3-030-51652-9_18
27. Wang X, Yang K, Xie Q, Wu Q, Mack SC, Shi Y, et al. Purine Synthesis Promotes Maintenance of Brain Tumor Initiating Cells in Glioma. Nat Neurosci (2017) 20:661–73. doi: 10.1038/nn.4537
28. Long Y, Sanchez-Espiridion B, Lin M, White L, Mishra L, Raju GS, et al. Global and Targeted Serum Metabolic Profiling of Colorectal Cancer Progression. Cancer. (2017) 123:4066–74. doi: 10.1002/cncr.30829
29. Wang X, Zhao X, Chou J, Yu J, Yang T, Liu L, et al. Taurine, Glutamic Acid and Ethylmalonic Acid as Important Metabolites for Detecting Human Breast Cancer Based on the Targeted Metabolomics. Cancer biomark (2018) 23:255–68. doi: 10.3233/CBM-181500
30. Xu Y, Zheng X, Qiu Y, Jia W, Wang J, Yin S. Distinct Metabolomic Profiles of Papillary Thyroid Carcinoma and Benign Thyroid Adenoma. J Proteome Res (2015) 14:3315–21. doi: 10.1021/acs.jproteome.5b00351
31. Tessem MB, Selnaes KM, Sjursen W, Tranø G, Giskeødegård GF, Bathen TF, et al. Discrimination of Patients With Microsatellite Instability Colon Cancer Using 1H HR MAS MR Spectroscopy and Chemometric Analysis. J Proteome Res (2010) 9:3664–70. doi: 10.1021/pr100176g
32. Zhou X, Zheng M, Wang Q, Aa J, Cao B, Li J. Metabolomics Analysis Identifies Lysine and Taurine as Candidate Prognostic Biomarkers for AML-M2 Patients. Int J Hematol (2020) 111:761–70. doi: 10.1007/s12185-020-02836-7
33. Cubillos S, Obregón F, Vargas MF, Salazar LA, Lima L. Taurine Concentration in Human Gliomas and Meningiomas: Tumoral, Peritumoral, and Extratumoral Tissue. Adv Exp Med Biol (2006) 583:419–22. doi: 10.1007/978-0-387-33504-9_47
34. Schurr A, Rigor BM. The Mechanism of Neuronal Resistance and Adaptation to Hypoxia. FEBS Lett (1987) 224:4–8. doi: 10.1016/0014-5793(87)80411-8
35. Neary PM, Hallihan P, Wang JH, Pfirrmann RW, Bouchier-Hayes DJ, Redmond HP. The Evolving Role of Taurolidine in Cancer Therapy. Ann Surg Oncol (2010) 17:1135–43. doi: 10.1245/s10434-009-0867-9
Keywords: nonfunctioning pituitary adenomas, metabolomics, macrophages, invasive, immunohistochemical
Citation: Lin K, Zhang J, Lin Y, Pei Z and Wang S (2022) Metabolic Characteristics and M2 Macrophage Infiltrates in Invasive Nonfunctioning Pituitary Adenomas. Front. Endocrinol. 13:901884. doi: 10.3389/fendo.2022.901884
Received: 22 March 2022; Accepted: 09 June 2022;
Published: 08 July 2022.
Edited by:
Govindan Dayanithi, Centre National de la Recherche Scientifique (CNRS), FranceReviewed by:
Mengzhi Wang, Yangzhou University, ChinaRan Zeng, Shanghai Donglei Brain Hospital, China
Copyright © 2022 Lin, Zhang, Lin, Pei and Wang. This is an open-access article distributed under the terms of the Creative Commons Attribution License (CC BY). The use, distribution or reproduction in other forums is permitted, provided the original author(s) and the copyright owner(s) are credited and that the original publication in this journal is cited, in accordance with accepted academic practice. No use, distribution or reproduction is permitted which does not comply with these terms.
*Correspondence: Shousen Wang, d3Noc2VuMTk2NUAxMjYuY29t
†These authors have contributed equally to this work