 Rohith N. Thota1,2†
 Pratishtha Chatterjee1,3†
 Steve Pedrini3†
 Eugene Hone3Jessica J. A. Ferguson2
 Manohar L. Garg2
 Ralph N. Martins1,3,4,5,6*
- 1Macquarie Medical School, Macquarie University, North Ryde, NSW, Australia
- 2School of Biomedical Sciences and Pharmacy, University of Newcastle, Callaghan, NSW, Australia
- 3School of Medical and Health Sciences, Edith Cowan University, Joondalup, WA, Australia
- 4Australian Alzheimer’s Research Foundation, Nedlands, WA, Australia
- 5School of Psychiatry and Clinical Neurosciences, University of Western Australia, Crawley, WA, Australia
- 6The KaRa Institute of Neurological Disease, Macquarie Park, NSW, Australia
Aims: This study aimed to determine the association of plasma neurofilament light (NfL), a marker of neurodegeneration, with diabetes status and glycaemic parameters in people with normal glycaemia (NG), pre-diabetes (PD) and type 2 diabetes (T2D).
Methods: Clinical and descriptive data for the diagnostic groups, NG (n=30), PD (n=48) and T2D (n=29), aged between 40 and 75 years were included in this cross-sectional analysis. Plasma NfL levels were analyzed using the ultra-sensitive single-molecule array (Simoa) platform.
Results: A positive correlation was evident between plasma NfL and fasting glucose (r = 0.2824; p = 0.0032). Plasma NfL levels were not correlated with fasting insulin and insulin resistance. Plasma Nfl levels were significantly different across the diabetes groups (T2D >PD >NG, p=0.0046). Post-hoc analysis indicated significantly higher plasma NfL levels in the T2D [12.4 (5.21) pg/mL] group than in the PD [10.2 (4.13) pg/mL] and NG [8.37 (5.65) pg/mL] groups. The relationship between diabetes status and NfL remained significant after adjusting for age, sex, BMI, HOMA-IR and physical activity (adjusted r2 = 0.271, p = 0.035).
Conclusions: These results show biomarker evidence of neurodegeneration in adults at risk or with T2D. Larger sample size and longitudinal analysis are required to better understand the application of NfL in people with risk and overt T2D.
Introduction
Diabetes mellitus (DM) is associated with complications involving the retina, kidneys, and peripheral nerve (1). Exceptional control of diabetes-related hyperglycaemia may slow the progression or prevent the development of diabetic complications altogether, however, the reversal of complications does not occur. Among these complications, DM selectively targets the peripheral nervous system in a widespread or diffused fashion leading to polyneuropathy or selectively causing focal neuropathies (diabetic neuropathy) (2). Existing evidence suggests that this neuropathy can develop in both pre-diabetes and an overt DM state (3). The prevailing view of the underlying pathophysiology is axonal degeneration and progressive loss of nerve fibres (4). Procedures including needle examination and skin punch biopsies are often required for the diagnosis of neuropathy when small fiber injury is the sole pathology (5) and can often be painful and inconvenient to the patient. It is essential for research and clinical practice to have a feasible test that can reliably detect and monitor such damage.
Neuro-axonal damage is a consequence of many neurological diseases such as multiple sclerosis, stroke, dementias, including Alzheimer’s disease (AD) and contributes to cognitive deficits and physical disability (5). Evidence from epidemiological, clinical and animal studies has established strong links between type 2 diabetes (T2D) and neurodegeneration (6–8). The key mechanisms that underpin these are evolving rapidly (9). Still, current evidence links to the involvement of insulin signalling dysfunction (10, 11), inflammatory and oxidative stress (12), pathways that occur early in the neurodegenerative process (13). Recently, neurofilament (Nf) protein, a neurodegeneration marker, has gained increasing attention in this space. Nf is a crucial axonal cytoskeletal component comprising neurofilament light chain (NfL), neurofilament medium chain (NfM), and neurofilament heavy chain (NfH) (14). The disruption of Nf in neuronal damage occurring within neurodegenerative conditions results in the release of Nf into the cerebrospinal fluid (CSF), consequently giving rise to elevated NfL concentrations in the CSF and blood, as seen in neurodegenerative diseases (15–17). Until recently, studies were limited to CSF NfL, because detection systems were not sensitive enough to quantitate the physiologically lower levels of NfL in the blood (18). This has changed with the introduction of the single-molecule array (Simoa) technology (19), which now provides the analytical basis for highly sensitive quantitation of the NfL subunit in the blood (20). Several studies have demonstrated high correlation between CSF and plasma NfL levels, and this has given reason to study NfL in a wide range of neurological disorders (21). Higher plasma NfL levels have been associated with compromised cognition and hippocampal atrophy in both cross-sectional and longitudinal human studies (22). Plasma NfL levels were also inversely associated with brain glucose metabolism, longitudinally in the highly characterized Alzheimer’s Disease Neuroimaging Initiative (ADNI cohort) (23). A previous report indicated a positive correlation between NfL mRNA levels and Douleur Neuropathique 4 questionnaire score in pre-diabetic patients, indicating an early detection marker of pre-diabetic peripheral neuropathy (24). Therefore, plasma levels of NfL may be an attractive indicator of neurodegeneration in people with different glycaemic status. The current study aimed to investigate the association of plasma NfL levels with glycaemic control and diabetes status in a cross-sectional study designed to provide initial evidence of plasma NfL levels as a possible marker for early detection of diabetic neuropathy.
Methodology
Participants
Participants with normal glycaemic control (NG), pre-diabetes (PD), and T2D were recruited from the Newcastle and Hunter region (New South Wales, Australia) by radio announcements, newspaper articles and advertisements placed around the local community. Our investigation was based on data and baseline blood samples obtained from the ‘curcumin and omega-3 fatty acids for the prevention of T2D’ (COP-D trial, ACTRN12615000559516) for individuals with pre-diabetes, ‘curcumin and omega-3 fatty acids for the management of dyslipidaemia in T2D’ (CALFOR-CVD trial, ACTRN12616001483448) for individuals with T2D, and ‘plant sterols and curcumin for the prevention of cardiovascular disease’ (PAC-CVD trial, ACTRN12615000956505) for individuals with normal plasma glucose levels. The detailed methodology of these studies have been previously published (25–27). The mean duration of diabetes was 6.0 ± 0.9 years in people with T2D, and there were no diabetic complications reported in these patients at the time of recruitment. Seventy four percent of the total participants in T2D group were taking oral anti-hyperglycaemic medications along with 67% on anti-hypertensive medications, 55% on cholesterol lowering medications and 11% on over-the-counter supplements. From all recruited subjects, participants aged between 40-75 and those recruited between 2016-2017 were included in the final analysis for the current study (n=107). The study protocols for all three clinical trials were approved by the Human Research Ethics Committee of the University of Newcastle, Callaghan, Australia, and written informed consent was obtained from all participants.
Blood Samples
Fasting blood samples (10 h) were collected into EDTA vacutainers via venipuncture by a trained phlebotomist and plasma fractions were obtained by centrifuging (Heraeus Biofuge Stratos) for 10 min at 3000 ×g at 4°C. Plasma samples were aliquoted and stored at −80°C until further analysis. Fasting plasma glucose was measured on a VP auto analyzer using Pathology North Services standardized reagents. Insulin was measured by chemiluminescent microparticle immunoassay (CMIA), Abbott Architect method, by Pathology North service.
Insulin Resistance and Body Weight Measurements
Insulin resistance was estimated using the homeostatic model assessment (HOMA-IR). This is based on the formula fasting glucose (mmol/l) X fasting insulin (µIU/L)/22.5. The height of the participants was measured using a wall-mounted stadiometer with a movable headpiece. Weight and BMI were calculated using bioelectrical impedance (BIA) (InBody230, Biospace Co.). Measurements were collected in the fasting state whilst standing. Participants refrained from vigorous physical activity and alcohol consumption 24 h before data collection. A physical activity questionnaire (International Physical Activity Questionnaire; IPAQ Long Form Last 7 Days Self-Administered Format, October 2002) was used to collect physical activity data.
NfL Measurements
All plasma samples were analyzed by ultra-sensitive single-molecule array (Simoa) assay at Edith Cowan University, Western Australia, Australia, following manufacturer’s instructions (28). Calibrators, internal controls and samples were run in duplicates. Internal controls and samples were diluted fourfold.
Statistical Analysis
Statistical analysis was performed using Stata/IC 14.2 (StataCorp LP, Texas, USA). Shapiro-Wilk test was employed to test the assumption for normality. Normally distributed variables are reported as mean ± SEM and non-normally distributed variables as median (Interquartile range, IQR). Pearson correlation for normally distributed data and Spearman correlation for non-normally distributed data were employed for correlation analyses. For comparison across groups, Analysis of variance (ANOVA) was used for normally distributed data and the Kruskal Wallis test for non-normally distributed data. For significant effects, Tukey’s HSD or Dunn’s test was used to perform post hoc comparisons to test the difference in the dependable variables between NG, PD, and T2D groups. Log transformation was applied to obtain the normality for NfL levels and other non-parametric variables. Multiple regression models were established to determine independent determinants of NfL levels. Unadjusted and adjusted (for age, sex, BMI, HOMA-IR and physical activity) regression analyses were carried out for NfL and diabetes status (NG, PD, and T2D). A two-sided p-value (p)< 0.05 was considered to be statistically significant.
Results
Clinical and descriptive data for the diagnostic groups, NG (n=30), PD (n=48) and T2D (n=29) are presented in Table 1. The plasma glucose levels were significantly higher in the PD [5.6(1) mmol/L] and T2D [7.8(2.5) mmol/L] group than in the NG group [5(0.6) mmol/L]. Similarly, fasting insulin levels were significantly higher in people with PD [10.1(7.6) mIU/L] compared to NG. However, there were no differences observed in the HOMA-IR levels between the PD and NG groups (Table 1). The T2D group [3.8(3.2)] had significantly higher insulin resistance than the PD and NG group. Participants in the NG group [52(14) years] were significantly younger than those in T2D group [67(14)], but there was no statistically significant difference between the age of participants in the NG and PD groups. Compared to NG, BMI was significantly higher in PD and T2D (Table 1). Physical activity levels were significantly lower in the PD and T2D groups than in the NG group (Table 1).
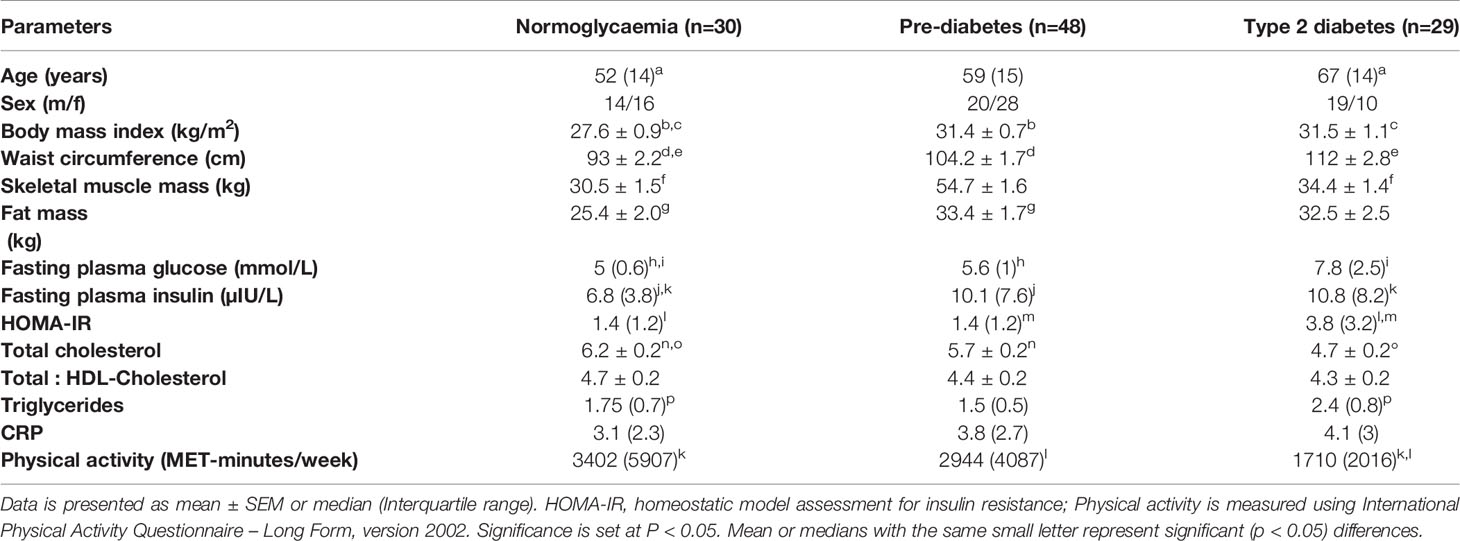
Table 1 Participant characteristics.
Plasma NfL Levels in NG, PD and T2D Groups
Plasma NfL levels were significantly different across the diabetes groups (T2D > PD > NG, P=0.0046). Post-hoc analysis indicated significantly higher plasma NfL levels in the T2D [12.4 (5.21) pg/mL] group than the PD [10.2 (4.13) pg/mL] and the NG [8.37 (5.65) pg/mL] groups (Figure 1). Similarly, compared to the NG group, plasma NfL levels were significantly elevated in the PD group (Figure 1).
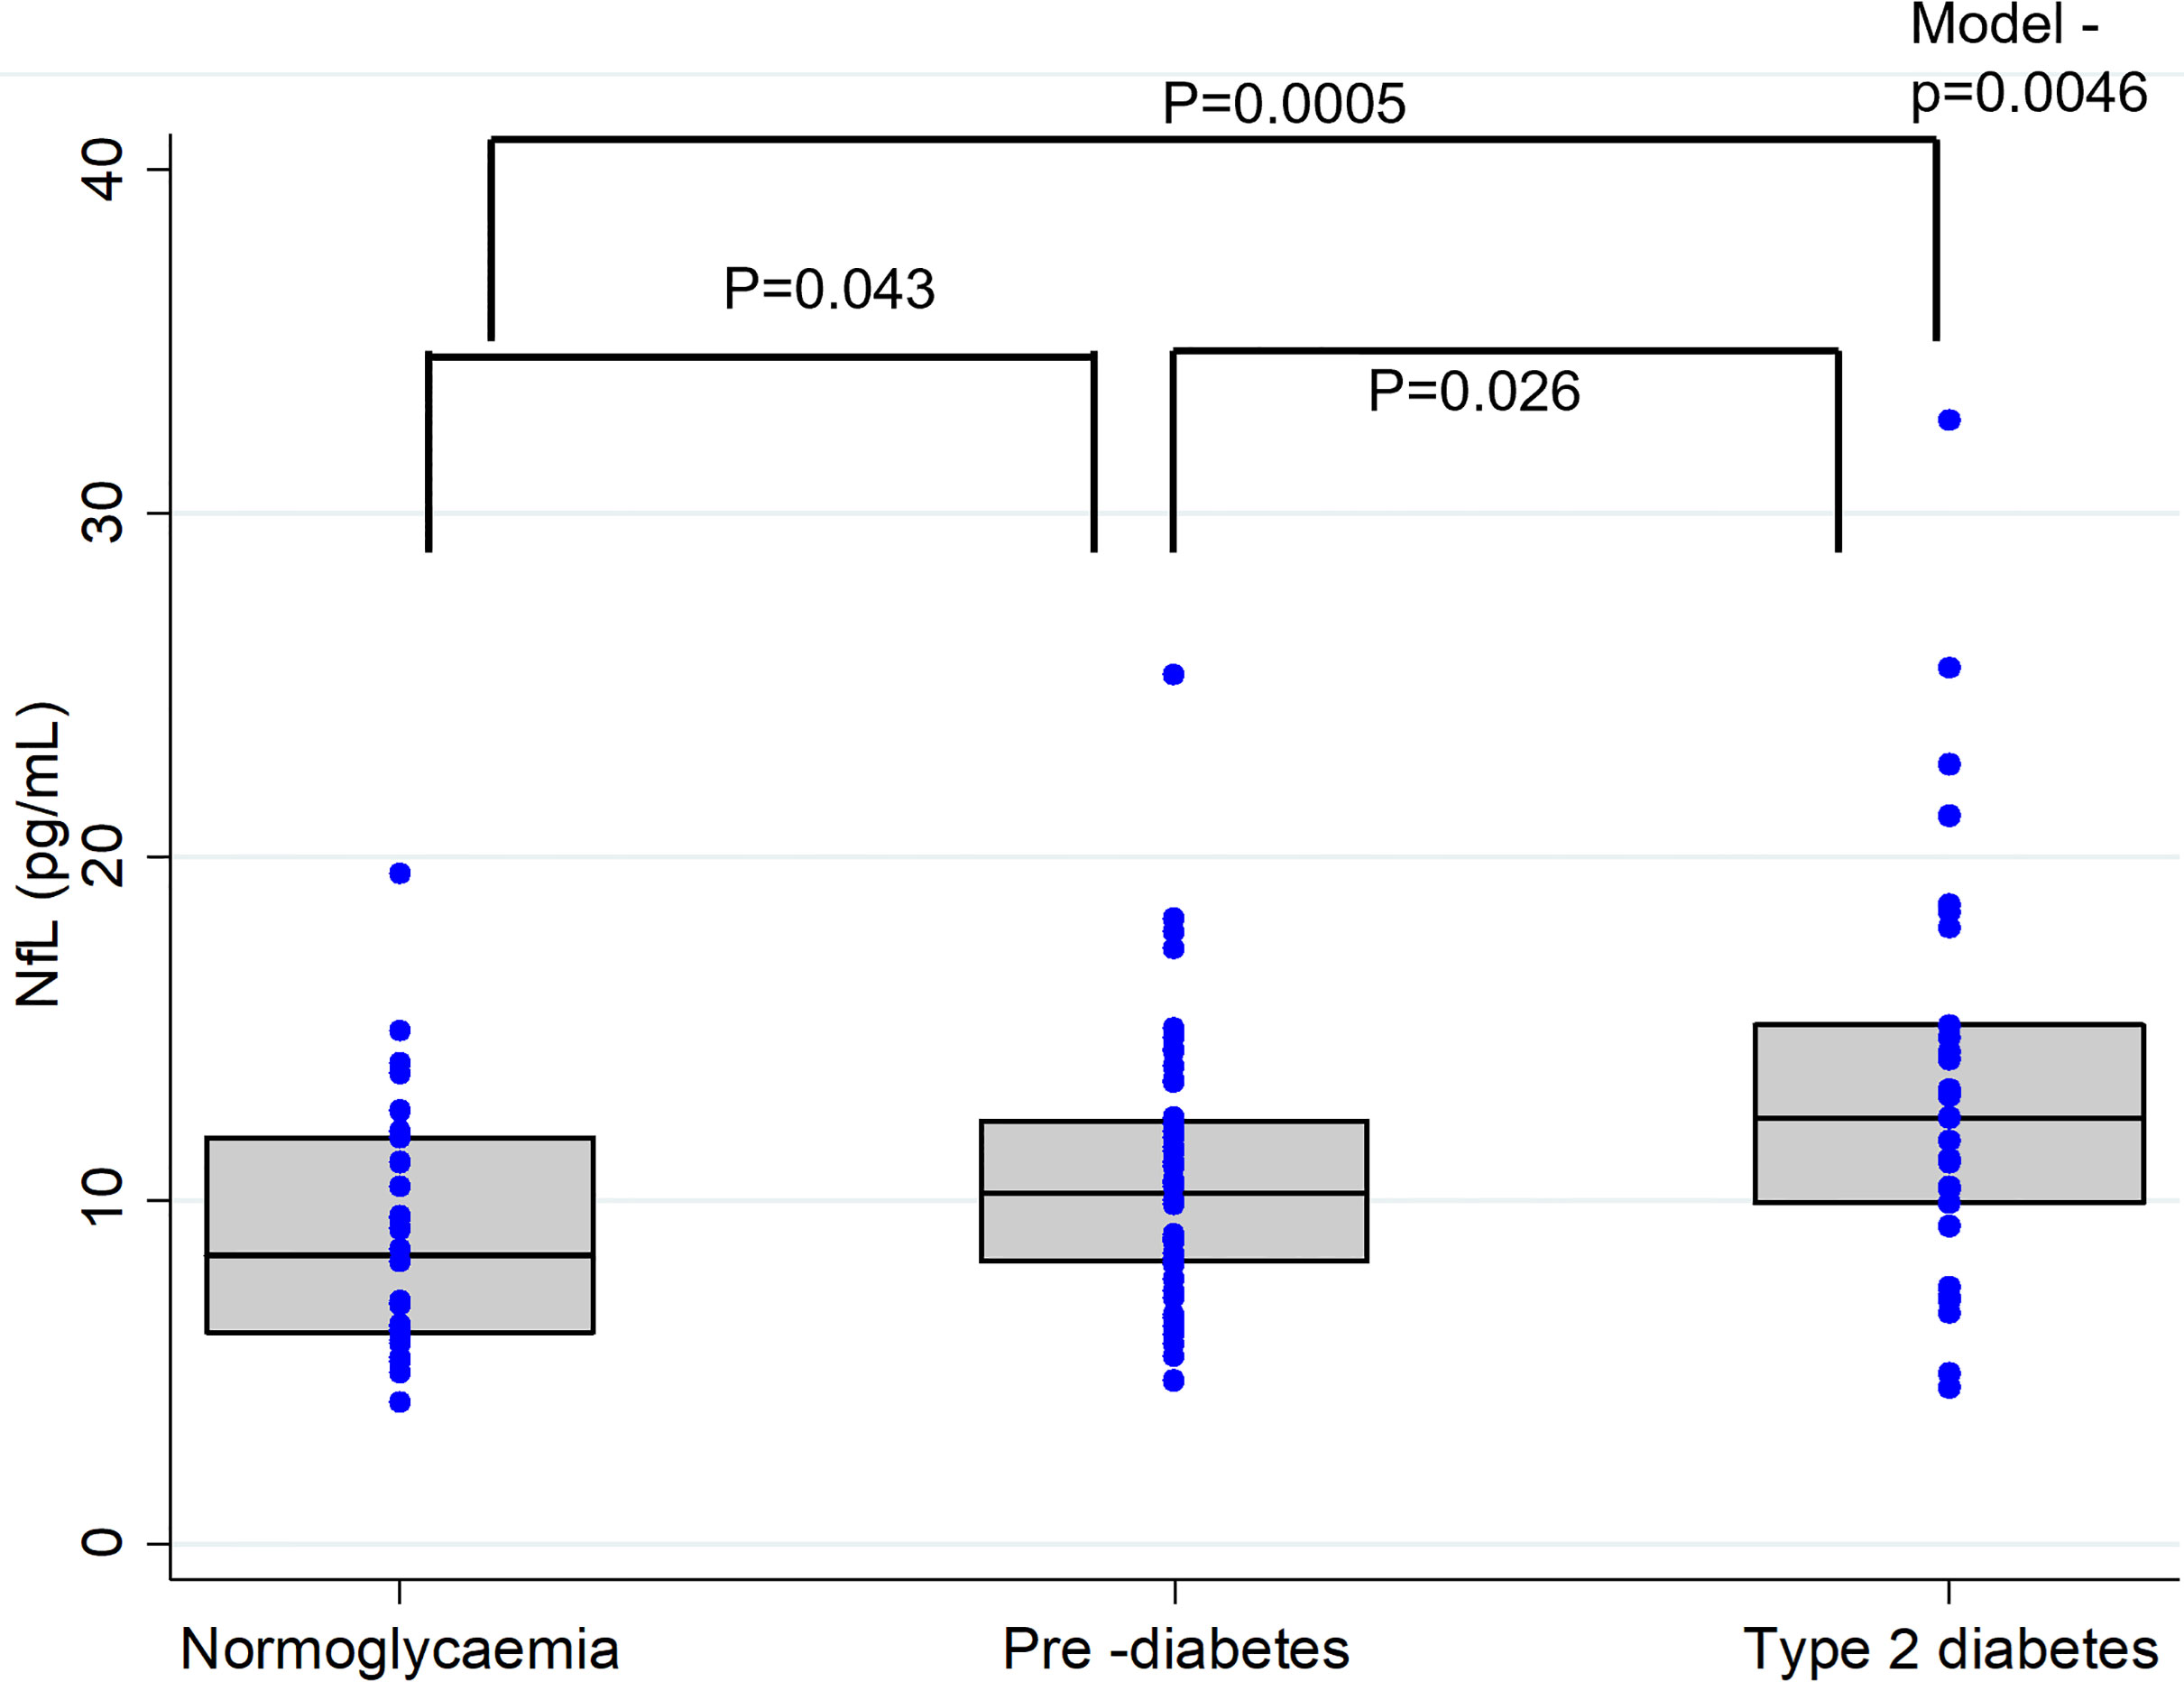
Figure 1 Plasma Neurofilament light (NFL) concentrations in individuals with normal glucose levels, pre-diabetes and type 2 diabetes. In the box-whisker plots central bar indicate the median NFL concentration and upper and lower boundaries. Blue dots represent the NFL data points. P-values representing differences in plasma NfL levels between the groups were obtained from Post-hoc analysis (Dunn's test).
Correlation of Plasma NfL Levels and Study Outcomes
A significant positive correlation (r = 0.5038; p < 0.0001) was detected between the participants’ age and their plasma NfL levels. Plasma NfL correlated (r = 0.2824; p = 0.0032) with plasma fasting glucose levels (Figure 2). However, no significant (p>0.05) associations were observed for fasting plasma insulin (r = -0.0356), HOMA-IR (r = 0.0665), BMI (r = -0.0504) and physical activity (r = 0.1511) with plasma NfL levels.
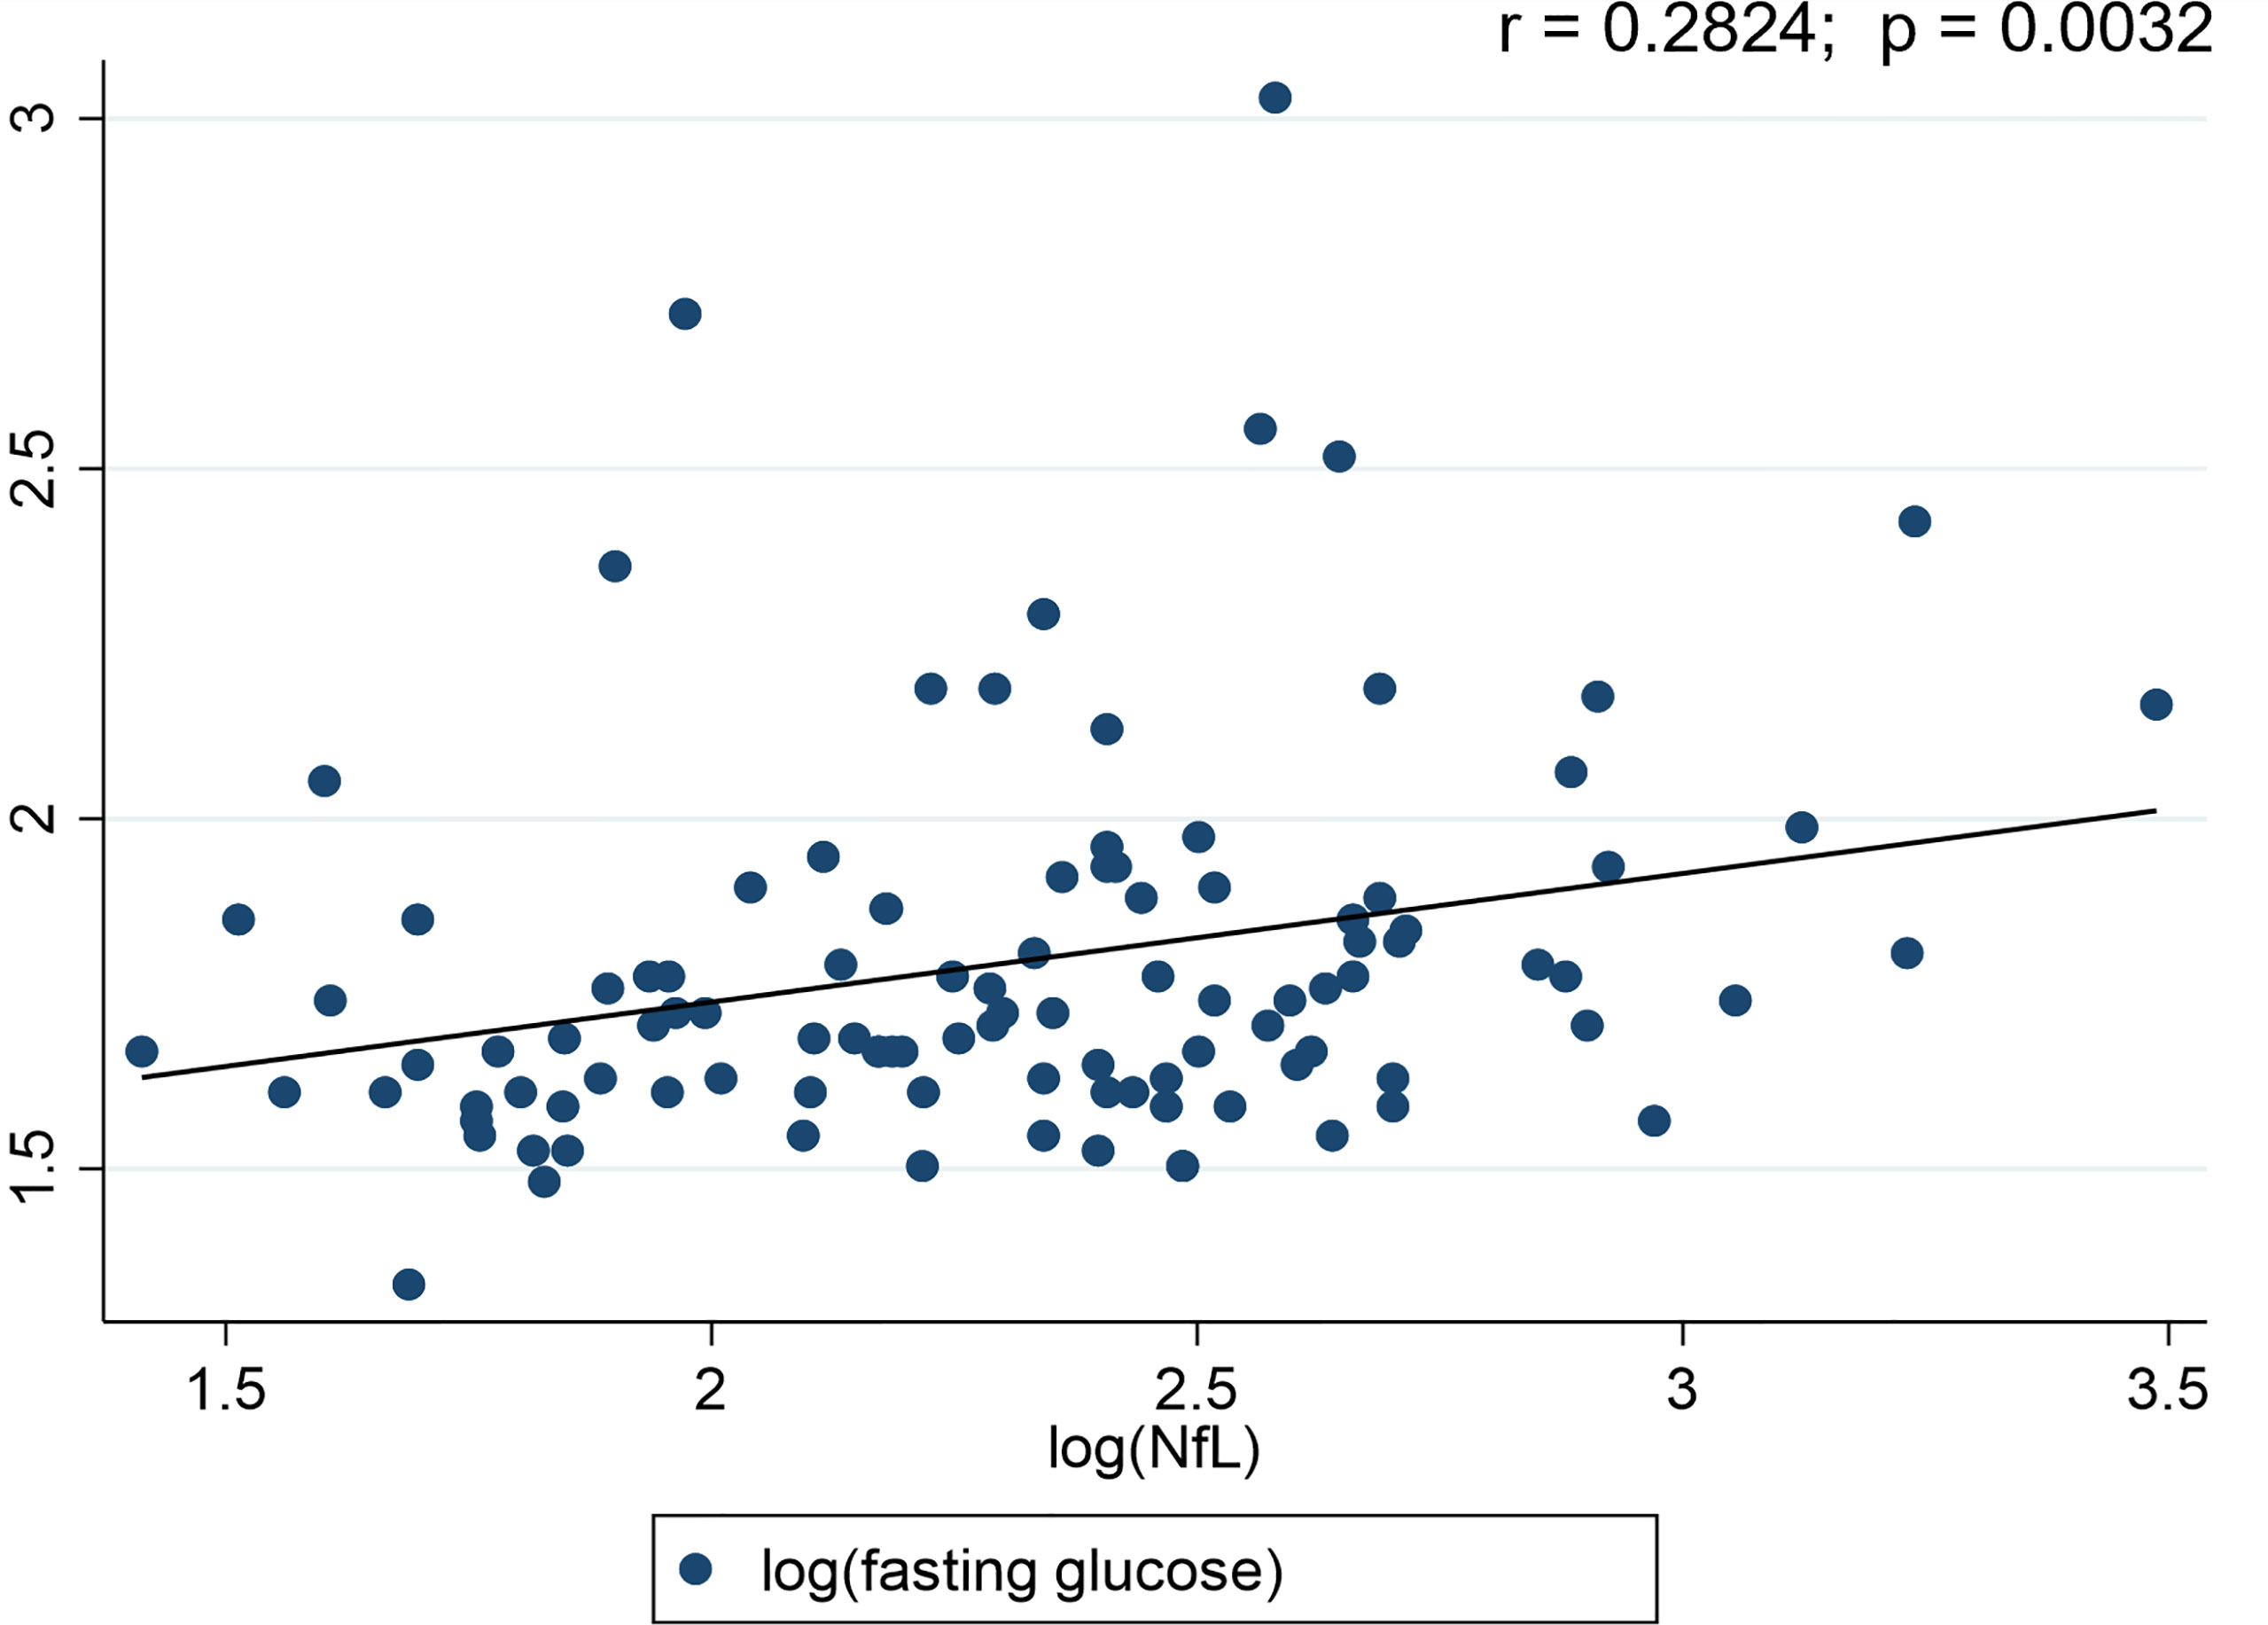
Figure 2 Scatter plots for Neurofilament light chain (NfL) and diabetes status. r-value represents the correlation between the blood glucose levels and NfL.
Linear Regression Models for Predictors of Plasma NfL
Unadjusted regression analysis indicated that participants’ diabetes status (i.e., NG, PD, T2D) was a significant predictor of plasma NfL levels (Table 2). However, categorical analysis showed that only T2D diagnosis (β-coefficient= 0.366, p= 0.001), over PD and NG, predicted plasma NfL levels. T2D diagnosis accounts for 36% increase in the outcome variable, plasma NfL levels. Participants’ age and plasma glucose levels also significantly predicted plasma NfL levels (Table 2). Significance of diabetes status (adjusted r2 = 0.271, p = 0.035) remained after adjusting for age, sex, BMI, HOMA-IR and physical activity levels (Table 2). When adjusted for CRP (as a marker of systemic inflammation), both pre-diabetes and diabetes mellitus accounted for an increase of 19% and 37% in plasma NfL levels (adjusted model 2, Table 2). Contrastingly, fasting insulin and HOMA-IR were not significant predictors of plasma NfL levels in this cohort.
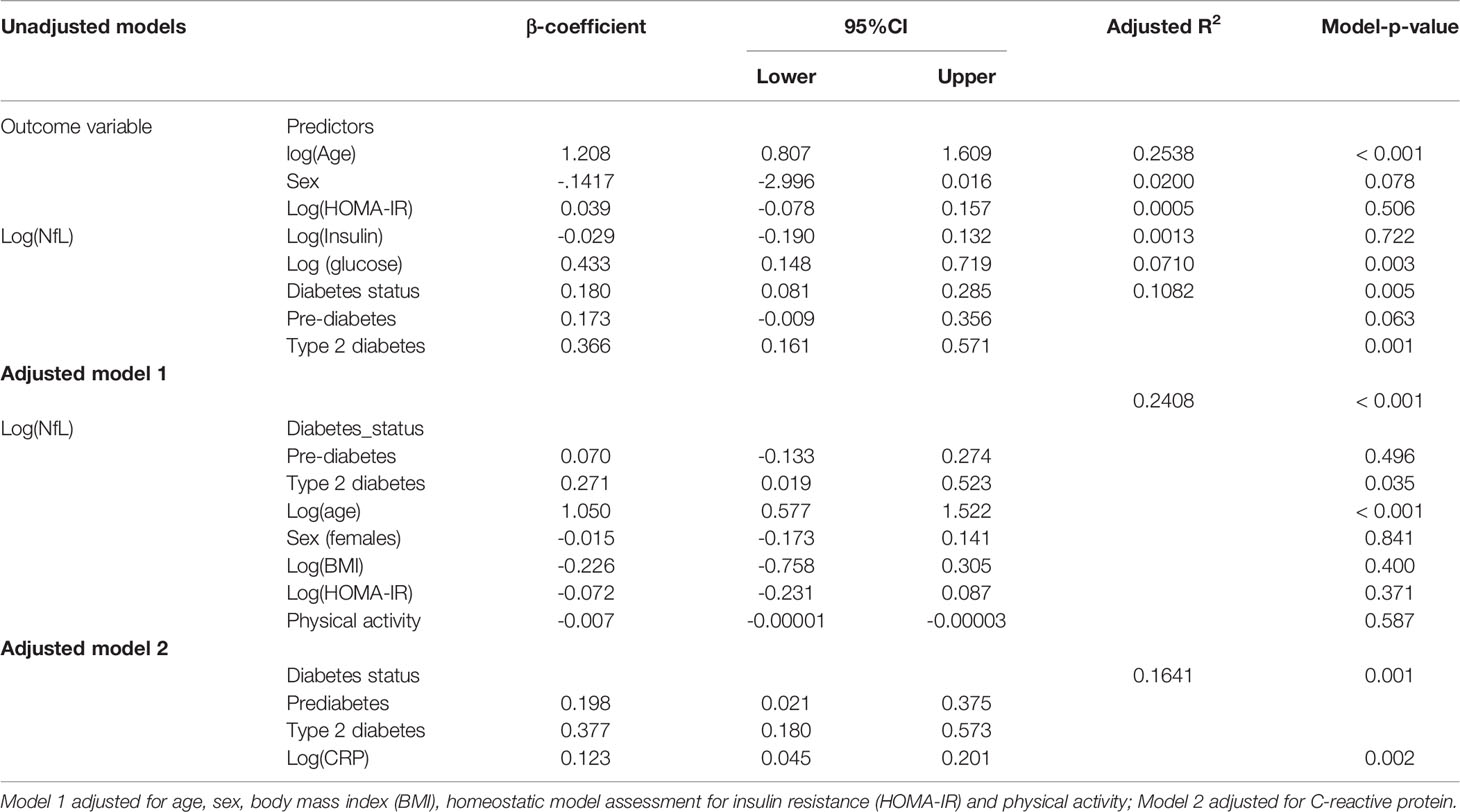
Table 2 Linear regression models for predictors of plasma neurofilament light (NfL) levels.
Discussion
This study reports for the first time that plasma NfL levels are associated with the clinical classification of diabetes status and glycemic control. The novel findings include (i) elevated levels of NfL in individuals with T2D and PD, (ii) diabetes diagnostic status as a significant determinant of plasma NfL levels even after adjusting for confounders such as age, sex, BMI, HOMA-IR, physical activity and CRP, (iii) plasma NfL levels positively correlated with fasting plasma glucose, (iv) no correlation between plasma NfL levels and fasting insulin and IR, suggesting that in people at risk of T2D and newly diagnosed T2D, glycaemic control may be the primary modifiable risk factor for neurodegeneration. Plasma NfL levels may be used to determine the risk of neurodegeneration in individuals with T2D and PD. Consistent with previously published reports, we found a significant positive association between age and plasma NfL levels (29–31). However, we did not find any association between plasma NfL levels with fasting plasma insulin or IR status in this cohort. Similarly, BMI and physical activity levels of the participants did not influence plasma NfL levels. In line with previous studies (28, 32), there was no association or accountability of sex on the plasma NfL levels between the diabetes diagnostic groups.
T2D has been associated with an increased risk of neurodegenerative diseases (33–35). Hyperglycaemia in T2D and PD is linked to neurodegeneration and structural brain abnormalities (lacunar infarcts, white matter hyperintensities, brain atrophy etc.) (7, 34, 36). Neurodegeneration is also evident in diabetic microvascular complications (37, 38). Several potential mechanisms between hyperglycaemia and neurodegeneration were previously published (9). These mechanisms include direct effects through advanced glycation end products, oxidative stress, IR and inflammation (9). Evidence suggests that peripheral nerve injury occurs during the early stages of the disease with mild glycaemic dysregulation (3). A prospective clinical study that included patients with pre-diabetes, and age- and sex-matched controls, indicated higher NfL mRNA levels in prediabetics than in controls (24). NfL mRNA levels were significantly higher in PD individuals with peripheral neuropathy than those without (24), suggesting that blood NfL mRNA levels could serve as a surrogate marker for early prediction of pre-diabetic peripheral neuropathy. Results from the current study substantiate the relationship between elevated plasma NfL levels with worsening glycaemic status (PD and T2D). Together, these observations indicate NfL levels could reflect the extent of neurodegeneration in those at risk and with overt T2D. Another cross-sectional analysis also showed elevated levels of plasma NfL in patients with inherited peripheral neuropathy compared to healthy controls (39). Plasma NfL levels were also linked to the severity of the disease (39). Although NfL may not be specific, it may be used to predict the severity of neurodegeneration across the spectrum of T2D disease progression.
Axonal damage is often evident in sub-clinical cerebrovascular diseases such as stroke (40), and this is identified by white matter lesions on magnetic resonance imaging (40). These observations have been shown to be predictive of clinical stroke (41). However, a blood test could be more economical and easier to detect these changes. A recent study found that serum NfL levels strongly predict incident stroke in study participants with diabetes who were stroke-free at baseline in a dose-dependent manner (42). The predictive capacity of NfL was substantially greater than established risk factors, with the highest quintile of NfL having an 11.4-fold higher hazard of stroke than the lowest quintile (unadjusted stroke hazards of other quartiles were 4.16, 4.91, and 6.49) (42). After adjusting for the Framingham stroke risk score and ethnicity, the highest quintile had a hazard ratio nearly 10 times greater than those in the lowest quintile (42). This study also reported that the addition of plasma NfL levels to the Framingham model significantly improved the discriminatory power of the Framingham risk score for stroke. Thus, indicating the importance of measuring serum NfL in T2D and those at risk of T2D for the prediction and possible early detection of diseases associated with neurodegeneration. In a cross-sectional analysis from the Swiss Atrial Fibrillation (Swiss-AF) cohort study (43), history of diabetes mellitus accounted for 26.8% increase in the serum NfL levels, similar to a magnitude of 10 years increase in age. While the mechanism remains unknown, a potential mechanism might involve diabetes induced neuronal damage.
Similar to other cross-sectional studies (44, 45), we have also replicated the observations of a positive association between age and plasma NfL levels. A strong association between age and NfL levels have also been demonstrated by a previous longitudinal study (32). Despite the positive correlation between NfL and age, glycaemic status remained a significant predictor of plasma NfL levels in the current study. However, individuals diagnosed with T2D indicated relatively higher plasma NfL levels than those with PD and normal glucose tolerance. The plasma NfL levels were reflective of the cut-offs presented in the younger population for neurodegenerative disorders. Diabetes is a progressive disease, and the risk increases with age, particularly in middle-aged adults (40-60 years, with an average onset of diagnosis at 45 years) (46, 47). Given the significant association of diabetes and neurodegeneration, age specific NfL levels will be required to determine the severity of neurodegeneration in people at risk and with T2D.
Insulin plays a crucial role in brain health, and IR can contribute to neurodegenerative disorders, such as AD and vascular cognitive impairment (48). Several studies have investigated the relationship between IR in the periphery and brain in AD and related disorders (49, 50). Moreover, in a non-diabetic population of AD subjects, HOMA-IR was associated with reduced cerebral glucose metabolism measured by [18F]FDG PET and with reduced grey matter volume (r2 = 0.37, p = 0.01) corrected for age and sex, suggesting IR has a significant impact on neurodegeneration (51). Another study evaluating CSF markers of AD, indicated no difference in CSF AD markers between individuals with IR and without IR, including CSF NfL levels (52). To date, there are no studies reported on the association between IR and plasma NfL levels. In the current study, we observed no association between plasma NfL levels and HOMA-IR. Further studies are required to validate these findings and determine the relationship between HOMA-IR and NfL.
Strengths of the current study include the first report on the association of plasma NfL levels with worsened glycaemic status, even after adjusting for age and other confounders. Furthermore, we also reported that plasma NfL levels is only associated with fasting plasma glucose levels, but not fasting plasma insulin levels. Including an arm with normal glycaemic control, PD and T2D, allowed us to study neurodegeneration (as measured by NfL) in individuals with varying glycaemic controls. This study also used a highly sensitive immunoassay for measuring plasma NfL levels. There are several limitations to the current study also such as the cross-sectional study design, with the inability to determine direct causality. Secondly, this study is a secondary analysis and thus lacks the exploration of other markers of neurodegeneration. Thirdly, the study cohort consists of trial subjects recruited as part of three different clinical trials carried out during the same period (2016-2017), and therefore the current findings may need validation in a single cohort with individuals of various glycaemic status. Fourthly, results from this study are preliminary and need further confirmation in larger and longitudinal cohorts to determine the utility of NfL in individuals with risk of T2D and overt T2D. Lastly, our study cohort also has an uneven number of individuals across the three groups. Recent findings indicate that blood NfL level might be partially affected by renal function (53). Renal function should be considered while assessing the relationship of NfL with other metabolic parameters. Therefore, future studies are warranted to examine the association between NfL and the risk or severity of neurodegeneration in T2D and its associated complications.
Conclusion
Plasma NfL level is associated with diabetes status and plasma glucose levels but not plasma insulin levels or HOMA-IR in a cohort of middle-aged adults with PD and T2D. The addition of plasma NfL levels to the panel of existing clinical tests might improve the determination of risk of neurodegeneration in both people with risk of T2D and overt T2D. While these study findings are preliminary, if validated in longitudinal cohorts with a larger sample size, we believe plasma NfL levels could become a marker of severity of neurodegeneration in relation to worsening glycaemic status in diabetes mellitus.
Data Availability Statement
The raw data supporting the conclusions of this article will be made available by the authors, without undue reservation.
Ethics Statement
The studies involving human participants were approved by the Human Research Ethics Committee of the University of Newcastle, Callaghan, Australia, and written informed consent was obtained from all participants. The patients/participants provided their written informed consent to participate in this study.
Author Contributions
RT, PC, and RM conceptualised the study. MG and RM provided resources and supervision of the project. SP measured plasma NfL. RT and JF recruited and collected data. RT and PC carried out the statistical analysis. RT interpreted the data and wrote the first draft. SP, PC, EH, JF, MG, and RM critically reviewed and edited the manuscript. All authors contributed to the article and approved the submitted version.
Conflict of Interest
The authors declare that the research was conducted in the absence of any commercial or financial relationships that could be construed as a potential conflict of interest.
Publisher’s Note
All claims expressed in this article are solely those of the authors and do not necessarily represent those of their affiliated organizations, or those of the publisher, the editors and the reviewers. Any product that may be evaluated in this article, or claim that may be made by its manufacturer, is not guaranteed or endorsed by the publisher.
Acknowledgments
We would like to thank the volunteers for their participation in our clinical trials. We are grateful to the Lions Alzheimer’s Foundation and Lions Club International for their generous donations that allowed the purchase of the Simoa-HD-X instrument used in this study.
References
1. Clark CM, Lee DA. Prevention and Treatment of the Complications of Diabetes Mellitus. N Engl J Med (1995) 332(18):1210–7. doi: 10.1056/NEJM199505043321807
2. Román-Pintos LM, Villegas-Rivera G, Rodríguez-Carrizalez AD, Miranda-Díaz AG, Cardona-Muñoz EG. Diabetic Polyneuropathy in Type 2 Diabetes Mellitus: Inflammation, Oxidative Stress, and Mitochondrial Function. J Diabetes Res (2016) 2016:3425617–. doi: 10.1155/2016/3425617
3. Papanas N, Vinik AI, Ziegler D. Neuropathy in Prediabetes: Does the Clock Start Ticking Early? Nat Rev Endocrinol (2011) 7(11):682–90. doi: 10.1038/nrendo.2011.113
4. Dyck PJ, Lais A, Karnes JL, O’Brien P, Rizza R. Fiber Loss is Primary and Multifocal in Sural Nerves in Diabetic Polyneuropathy. Ann Neurol (1986) 19(5):425–39. doi: 10.1002/ana.410190503
5. Salvadores N, Sanhueza M, Manque P, Court FA. Axonal Degeneration During Aging and Its Functional Role in Neurodegenerative Disorders. Front Neurosci (2017) 11:451. doi: 10.3389/fnins.2017.00451
6. Biessels GJ, Staekenborg S, Brunner E, Brayne C, Scheltens P. Risk of Dementia in Diabetes Mellitus: A Systematic Review. Lancet Neurol (2006) 5(1):64–74. doi: 10.1016/S1474-4422(05)70284-2
7. Moran C, Beare R, Phan TG, Bruce DG, Callisaya ML, Srikanth V, et al. Type 2 Diabetes Mellitus and Biomarkers of Neurodegeneration. Neurology (2015) 85(13):1123–30. doi: 10.1212/WNL.0000000000001982
8. Ristow M. Neurodegenerative Disorders Associated With Diabetes Mellitus. J Mol Med (2004) 82(8):510–29. doi: 10.1007/s00109-004-0552-1
9. Verdile G, Fuller SJ, Martins RN. The Role of Type 2 Diabetes in Neurodegeneration. Neurobiol Dis (2015) 84:22–38. doi: 10.1016/j.nbd.2015.04.008
10. Craft S, Stennis Watson G. Insulin and Neurodegenerative Disease: Shared and Specific Mechanisms. Lancet Neurol (2004) 3(3):169–78. doi: 10.1016/S1474-4422(04)00681-7
11. de la Monte SM, Longato L, Tong M, Wands JR. Insulin Resistance and Neurodegeneration: Roles of Obesity, Type 2 Diabetes Mellitus and non-Alcoholic Steatohepatitis. Curr Opin Investig Drugs (2009) 10(10):1049–60.
12. Muriach M, Flores-Bellver M, Romero FJ, Barcia JM. Diabetes and the Brain: Oxidative Stress, Inflammation, and Autophagy. Oxid Med Cell Longev (2014) 2014:102158–. doi: 10.1155/2014/102158
13. Zochodne DW. Diabetes Mellitus and the Peripheral Nervous System: Manifestations and Mechanisms. Muscle Nerve (2007) 36(2):144–66. doi: 10.1002/mus.20785
14. Yuan A, Rao MV, Veeranna, Nixon RA. Neurofilaments and Neurofilament Proteins in Health and Disease. Cold Spring Harb Perspect Biol (2017) 9(4):a018309. doi: 10.1101/cshperspect.a018309
15. Zetterberg H. Neurofilament Light: A Dynamic Cross-Disease Fluid Biomarker for Neurodegeneration. Neuron (2016) 91(1):1–3. doi: 10.1016/j.neuron.2016.06.030
16. Olsson B, Portelius E, Cullen NC, Sandelius Å, Zetterberg H, Andreasson U, et al. Association of Cerebrospinal Fluid Neurofilament Light Protein Levels With Cognition in Patients With Dementia, Motor Neuron Disease, and Movement Disorders. JAMA Neurol (2019) 76(3):318–25. doi: 10.1001/jamaneurol.2018.3746
17. Bäckström D, Linder J, Jakobson Mo S, Riklund K, Zetterberg H, Blennow K, et al. NfL as a Biomarker for Neurodegeneration and Survival in Parkinson Disease. Neurology (2020) 95(7):e827–38. doi: 10.1212/WNL.0000000000010084
18. Li D, Mielke MM. An Update on Blood-Based Markers of Alzheimer’s Disease Using the SiMoA Platform. Neurol Ther (2019) 8(Suppl 2):73–82. doi: 10.1007/s40120-019-00164-5
19. Rissin DM, Kan CW, Campbell TG, Howes SC, Fournier DR, Song L, et al. Single-Molecule Enzyme-Linked Immunosorbent Assay Detects Serum Proteins at Subfemtomolar Concentrations. Nat Biotechnol (2010) 28(6):595–9. doi: 10.1038/nbt.1641
20. Disanto G, Barro C, Benkert P, Naegelin Y, Schädelin S, Giardiello A, et al. Serum Neurofilament Light: A Biomarker of Neuronal Damage in Multiple Sclerosis. Ann Neurol (2017) 81(6):857–70. doi: 10.1002/ana.24954
21. Gaiottino J, Norgren N, Dobson R, Topping J, Nissim A, Malaspina A, et al. Increased Neurofilament Light Chain Blood Levels in Neurodegenerative Neurological Diseases. PloS One (2013) 8(9):e75091. doi: 10.1371/journal.pone.0075091
22. Osborn KE, Khan OA, Kresge HA, Bown CW, Liu D, Moore EE, et al. Cerebrospinal Fluid and Plasma Neurofilament Light Relate to Abnormal Cognition. Alzheimers Dement (Amst) (2019) 11:700–9. doi: 10.1016/j.dadm.2019.08.008
23. Benedet AL, Ashton NJ, Pascoal TA, Leuzy A, Mathotaarachchi S, Kang MS, et al. Plasma Neurofilament Light Associates With Alzheimer’s Disease Metabolic Decline in Amyloid-Positive Individuals. Alzheimers Dement (Amst) (2019) 11:679–89. doi: 10.1016/j.dadm.2019.08.002
24. Celikbilek A, Tanik N, Sabah S, Borekci E, Akyol L, Ak H, et al. Elevated Neurofilament Light Chain (NFL) mRNA Levels in Prediabetic Peripheral Neuropathy. Mol Biol Rep (2014) 41(6):4017–22. doi: 10.1007/s11033-014-3270-y
25. Thota RN, Newcastle Uo. Curcumin and Long-Chain Omega-3 Polyunsaturated Fatty Acids: Effects on Glycaemic Control and Blood Lipids. (2018). Available at: https://nova.newcastle.edu.au/vital/access/manager/Repository/uon:32908.
26. Thota RN, Acharya SH, Garg ML. Curcumin and/or Omega-3 Polyunsaturated Fatty Acids Supplementation Reduces Insulin Resistance and Blood Lipids in Individuals With High Risk of Type 2 Diabetes: A Randomised Controlled Trial. Lipids Health Dis (2019) 18(1):31. doi: 10.1186/s12944-019-0967-x
27. Ferguson JJA, Stojanovski E, MacDonald-Wicks L, Garg ML. Curcumin Potentiates Cholesterol-Lowering Effects of Phytosterols in Hypercholesterolaemic Individuals. A Randomised Controlled Trial Metabol: Clin Experiment (2018) 82:22–35. doi: 10.1016/j.metabol.2017.12.009
28. Chatterjee P, Goozee K, Sohrabi HR, Shen K, Shah T, Asih PR, et al. Association of Plasma Neurofilament Light Chain With Neocortical Amyloid-β Load and Cognitive Performance in Cognitively Normal Elderly Participants. J Alzheimer’s Dis: JAD (2018) 63(2):479–87. doi: 10.3233/JAD-180025
29. Quiroz YT, Zetterberg H, Reiman EM, Chen Y, Su Y, Fox-Fuller JT, et al. Plasma Neurofilament Light Chain in the Presenilin 1 E280A Autosomal Dominant Alzheimer’s Disease Kindred: A Cross-Sectional and Longitudinal Cohort Study. Lancet Neurol (2020) 19(6):513–21. doi: 10.1016/S1474-4422(20)30137-X
30. Yilmaz A, Blennow K, Hagberg L, Nilsson S, Price RW, Schouten J, et al. Neurofilament Light Chain Protein as a Marker of Neuronal Injury: Review of its Use in HIV-1 Infection and Reference Values for HIV-Negative Controls. Expert Rev Mol Diagn (2017) 17(8):761–70. doi: 10.1080/14737159.2017.1341313
31. Chatterjee P, Pedrini S, Ashton NJ, Tegg M, Goozee K, Singh AK, et al. Diagnostic and Prognostic Plasma Biomarkers for Preclinical Alzheimer’s Disease. Alzheimer’s Dement (2021) 18(6):1141–54. doi: 10.1002/alz.12447
32. Mattsson N, Cullen NC, Andreasson U, Zetterberg H, Blennow K. Association Between Longitudinal Plasma Neurofilament Light and Neurodegeneration in Patients With Alzheimer Disease. JAMA Neurol (2019) 76(7):791–9. doi: 10.1001/jamaneurol.2019.0765
33. Peila R, Rodriguez BL, Launer LJ. Type 2 Diabetes, APOE Gene, and the Risk for Dementia and Related Pathologies: The Honolulu-Asia Aging Study. Diabetes (2002) 51(4):1256–62. doi: 10.2337/diabetes.51.4.1256
34. den Heijer T, Vermeer SE, van Dijk EJ, Prins ND, Koudstaal PJ, Hofman A, et al. Type 2 Diabetes and Atrophy of Medial Temporal Lobe Structures on Brain MRI. Diabetologia (2003) 46(12):1604–10. doi: 10.1007/s00125-003-1235-0
35. Moran C, Beare R, Wang W, Callisaya M, Srikanth V. Type 2 Diabetes Mellitus, Brain Atrophy, and Cognitive Decline. Diabetologia (2019) 92(8):e823–30. doi: 10.1212/WNL.0000000000006955
36. van Agtmaal MJM, Houben AJHM, de Wit V, Henry RMA, Schaper NC, Dagnelie PC, et al. Prediabetes Is Associated With Structural Brain Abnormalities: The Maastricht Study. Diabetes Care (2018) 41(12):2535–43. doi: 10.2337/dc18-1132
37. Simó R, Stitt AW, Gardner TW. Neurodegeneration in Diabetic Retinopathy: Does it Really Matter? Diabetologia (2018) 61(9):1902–12. doi: 10.1007/s00125-018-4692-1
38. Hafner J, Zadrazil M, Grisold A, Ricken G, Krenn M, Kitzmantl D, et al. Retinal and Corneal Neurodegeneration and Their Association With Systemic Signs of Peripheral Neuropathy in Type 2 Diabetes. Am J Ophthalmol (2020) 209:197–205. doi: 10.1016/j.ajo.2019.09.010
39. Abbasi A, Peelen LM, Corpeleijn E, van der Schouw YT, Stolk RP, Spijkerman AMW, et al. Prediction Models for Risk of Developing Type 2 Diabetes: Systematic Literature Search and Independent External Validation Study. thebmj (2012) 345:. doi: 10.1136/bmj.e5900
40. Oh SH, Kim NK, Kim SH, Kim JK, Kim HS, Kim WC, et al. The Prevalence and Risk Factor Analysis of Silent Brain Infarction in Patients With First-Ever Ischemic Stroke. J Neurol Sci (2010) 293(1-2):97–101. doi: 10.1016/j.jns.2010.02.025
41. Gupta A, Giambrone AE, Gialdini G, Finn C, Delgado D, Gutierrez J, et al. Silent Brain Infarction and Risk of Future Stroke: A Systematic Review and Meta-Analysis. Stroke (2016) 47(3):719–25. doi: 10.1161/STROKEAHA.115.011889
42. Korley FK, Goldstick J, Mastali M, Eyk JEV, Barsan W, Meurer WJ, et al. Serum NfL (Neurofilament Light Chain) Levels and Incident Stroke in Adults With Diabetes Mellitus. Stroke (2019) 50(7):1669–75. doi: 10.1161/STROKEAHA.119.024941
43. Polymeris AA, Coslovksy M, Aeschbacher S, Sinnecker T, Benkert P, Kobza R, et al. Serum Neurofilament Light in Atrial Fibrillation: Clinical, Neuroimaging and Cognitive Correlates. Brain Commun (2020) 2(2):fcaa166–fcaa. doi: 10.1093/braincomms/fcaa166
44. Mattsson N, Andreasson U, Zetterberg H, Blennow K, Alzheimer’s Disease Neuroimaging I. Association of Plasma Neurofilament Light With Neurodegeneration in Patients With Alzheimer Disease. JAMA Neurol (2017) 74(5):557–66. doi: 10.1001/jamaneurol.2016.6117
45. Mielke MM, Syrjanen JA, Blennow K, Zetterberg H, Vemuri P, Skoog I, et al. Plasma and CSF Neurofilament Light: Relation to Longitudinal Neuroimaging and Cognitive Measures. Neurology (2019) 93(3):e252–e60. doi: 10.1212/WNL.0000000000007767
46. Kirkman MS, Briscoe VJ, Clark N, Florez H, Haas LB, Halter JB, et al. Diabetes in Older Adults. Diabetes Care (2012) 35(12):2650–64. doi: 10.2337/dc12-1801
47. Pani LN, Korenda L, Meigs JB, Driver C, Chamany S, Fox CS, et al. Effect of Aging on A1C Levels in Individuals Without Diabetes: Evidence From the Framingham Offspring Study and the National Health and Nutrition Examination Survey 2001-2004. Diabetes Care (2008) 31(10):1991–6. doi: 10.2337/dc08-0577
48. Kellar D, Craft S. Brain Insulin Resistance in Alzheimer’s Disease and Related Disorders: Mechanisms and Therapeutic Approaches. Lancet Neurol (2020) 19(9):758–66. doi: 10.1016/S1474-4422(20)30231-3
49. Laws SM, Gaskin S, Woodfield A, Srikanth V, Bruce D, Fraser PE, et al. Insulin Resistance is Associated With Reductions in Specific Cognitive Domains and Increases in CSF Tau in Cognitively Normal Adults. Sci Rep (2017) 7(1):9766–. doi: 10.1038/s41598-017-09577-4
50. Willette AA, Xu G, Johnson SC, Birdsill AC, Jonaitis EM, Sager MA, et al. Insulin Resistance, Brain Atrophy, and Cognitive Performance in Late Middle-Aged Adults. Diabetes Care (2013) 36(2):443–9. doi: 10.2337/dc12-0922
51. Femminella GD, Livingston NR, Raza S, van der Doef T, Frangou E, Love S, et al. Does Insulin Resistance Influence Neurodegeneration in non-Diabetic Alzheimer’s Subjects? Alzheimer’s Res Ther (2021) 13(1):47. doi: 10.1186/s13195-021-00784-w
52. Westwood S, Liu B, Baird AL, Anand S, Nevado-Holgado AJ, Newby D, et al. The Influence of Insulin Resistance on Cerebrospinal Fluid and Plasma Biomarkers of Alzheimer’s Pathology. Alzheimer’s Res Ther (2017) 9(1):31. doi: 10.1186/s13195-017-0258-6
Keywords: biomarkers, cross-sectional study, insulin resistance, neurodegeneration, neurofilament light chain, type 2 diabetes
Citation: Thota RN, Chatterjee P, Pedrini S, Hone E, Ferguson JJA, Garg ML and Martins RN (2022) Association of Plasma Neurofilament Light Chain With Glycaemic Control and Insulin Resistance in Middle-Aged Adults. Front. Endocrinol. 13:915449. doi: 10.3389/fendo.2022.915449
Received: 08 April 2022; Accepted: 16 May 2022;
Published: 20 June 2022.
Edited by:
Francesco Prattichizzo, MultiMedica Holding SpA (IRCCS), ItalyReviewed by:
Angelica Giuliani, Marche Polytechnic University, ItalyChristian Barro, Brigham and Women’s Hospital and Harvard Medical School, United States
Copyright © 2022 Thota, Chatterjee, Pedrini, Hone, Ferguson, Garg and Martins. This is an open-access article distributed under the terms of the Creative Commons Attribution License (CC BY). The use, distribution or reproduction in other forums is permitted, provided the original author(s) and the copyright owner(s) are credited and that the original publication in this journal is cited, in accordance with accepted academic practice. No use, distribution or reproduction is permitted which does not comply with these terms.
*Correspondence: Ralph N. Martins, cmFscGgubWFydGluc0BtcS5lZHUuYXU=
†These authors have contributed equally to this work