 Saeed Jerban1,2,3*
 Yajun Ma1,2
 Dina Moazamian1
 Jiyo Athertya1Sophia Dwek1
 Hyungseok Jang1,2
 Gina Woods4Christine B. Chung1,2
 Eric Y. Chang1,2Jiang Du1,2*
- 1Department of Radiology, University of California, San Diego, CA, United States
- 2Radiology Service, Department of Research, Veterans Affairs San Diego Healthcare System, San Diego, CA, United States
- 3Department of Orthopaedic Surgery, University of California, San Diego, CA, United States
- 4Department of Medicine, University of California, San Diego, CA, United States
Introduction: Ultrashort echo time (UTE) MRI enables quantitative assessment of cortical bone. The signal ratio in dual-echo UTE imaging, known as porosity index (PI), as well as the signal ratio between UTE and inversion recovery UTE (IR-UTE) imaging, known as the suppression ratio (SR), are two rapid UTE-based bone evaluation techniques developed to reduce the time demand and cost in future clinical studies. The goal of this study was to investigate the performance of PI and SR in detecting bone quality differences between subjects with osteoporosis (OPo), osteopenia (OPe), and normal bone (Normal).
Methods: Tibial midshaft of fourteen OPe (72 ± 6 years old), thirty-one OPo (72 ± 6 years old), and thirty-seven Normal (36 ± 19 years old) subjects were scanned using dual-echo UTE and IR-UTE sequences on a clinical 3T scanner. Measured PI, SR, and bone thickness were compared between OPo, OPe, and normal bone (Normal) subjects using the Kruskal–Wallis test by ranks. Spearman’s rank correlation coefficients were calculated between dual-energy x-ray absorptiometry (DEXA) T-score and UTE-MRI results.
Results: PI was significantly higher in the OPo group compared with the Normal (24.1%) and OPe (16.3%) groups. SR was significantly higher in the OPo group compared with the Normal (41.5%) and OPe (21.8%) groups. SR differences between the OPe and Normal groups were also statistically significant (16.2%). Cortical bone was significantly thinner in the OPo group compared with the Normal (22.0%) and OPe (13.0%) groups. DEXA T-scores in subjects were significantly correlated with PI (R=-0.32), SR (R=-0.50), and bone thickness (R=0.51).
Discussion: PI and SR, as rapid UTE-MRI-based techniques, may be useful tools to detect and monitor bone quality changes, in addition to bone morphology, in individuals affected by osteoporosis.
1 Introduction
According to the World Health Organization, bone mineral density (BMD) assessment using dual-energy x-ray absorptiometry (DEXA) is the standard method for osteoporosis (OPo) diagnosis (1–4). Notably, a major portion of bone volume (>55% in cortical bone and >90% in trabecular bone) (5) is comprised of the organic matrix, water, and fat, which cannot be accurately evaluated via DEXA measurement or other x-ray-based techniques (6).
An increasing number of musculoskeletal research groups are investigating the potential benefits of utilizing magnetic resonance imaging (MRI) for bone evaluation, particularly for quantifying the water components, organic matrix, and fat content in cortical bone (7–10). MRI-based bone evaluation avoids the potential harmful exposures to ionizing radiation associated with x-ray-based techniques (11–14) and provides the opportunity for simultaneous assessment of the surrounding soft tissues (15, 16).
Although conventional clinical MRI sequences can be used for morphological imaging, they are not capable of quantitative evaluation of bone due to the lack of detectable signals (7–9). Specifically, the detected MR signal intensity of bone depends on several factors, including its apparent transverse relaxation time (T2*), which is very short (11, 12) and cannot be captured by conventional clinical sequences. Notably, T2* of bone is on the order of hundreds of microseconds, while the echo times (TEs) in conventional clinical MRI sequences are typically several milliseconds or longer (11, 17). On the other hand, ultrashort echo time (UTE) MRI sequences have TEs on the order of several to tens of microseconds, which are short enough to detect signal from cortical bone directly and consequently enable quantitative assessment of cortical bone (7–9, 11, 12, 18, 19).
UTE-MRI-based evaluation of bone is partly underutilized due to the high cost and time demands of MRI in general. Several research studies have focused on developing rapid and efficient UTE-MRI-based bone evaluation methods to facilitate clinical translational imaging of bone. The signal ratio calculation in dual-echo UTE imaging (20) and the signal ratio between UTE and inversion recovery UTE (IR-UTE) (21) are two remarkable examples of rapid UTE-based bone evaluation techniques, each of which takes less than 5 minutes. Notably, the required time for such measurements depends on the UTE acquisition techniques, which can be two-dimensional (2D) (using cartesian or radial trajectories) (22, 23) or three-dimensional (3D) (using cartesian, radial, spiral, or cones trajectories) (10). Generally, a 2D UTE sequence is faster than a 3D UTE sequence, and a spiral acquisition is faster than a radial or cartesian acquisition. It should be noted that the signal-to-noise (SNR) is one of the major challenges with UTE bone imaging, particularly in the hip and spine with thin cortex. 3D UTE sequences have the advantage of providing significantly higher SNR efficiency than 2D UTE sequences.
Rajapakse et al. (20) have proposed a dual-echo UTE imaging technique to calculate porosity index (PI), which is the signal ratio between two MRI images, one with UTE (TE < 0.05 ms) and one with TE = 2.2 ms (where bound water signal has decayed to near zero, and pore water and fat signals are in-phase at 3T). The first echo image represents the total detectable signal from bone, including bound water (BW), pore water (PW), and fat. The second echo represents mostly PW and fat signals (no BW signal). Therefore, the signal ratio between the two images is hypothesized to correlate with the pores’ volume (assuming that pores are filled with PW and/or fat) to the total volume. Although this technique does not estimate the absolute PW content or fat content, it can provide an estimation of bone porosity. In original validation studies, PI in a limited number of human cadaveric tibiae has shown significant correlations with porosity measured with micro-computed tomography (µCT) (n=16), donor age (n=16), mechanical compression stiffness performed on whole-cross-section tibial specimens (n=18), and collagen estimation from near-infrared spectroscopy (n=18) (20, 24). Recently, the significant correlations of PI with microstructural and mechanical properties were confirmed using 135 cortical bone strips (25). The feasibility of PI calculation in vivo and its reproducibility level was also investigated, with a coefficient of variation of 2.2% and an intraclass correlation coefficient of 0.97 reported (20). In another in vivo study, PI has shown a significant direct correlation with the chronic kidney disease stage (n=95) (26). However, the PI performance in distinguishing subjects with OPo has not been investigated yet.
In another attempt to develop rapid UTE-MRI-based techniques for bone assessment, Li et al. have proposed “suppression ratio” (SR) index, defined as the ratio between the bone UTE signal and the UTE signal after long-T2 suppression performed via dual-band saturation-prepared UTE (DB-UTE) or IR-UTE (21). It is assumed that the UTE image represents the total detectable signal from bone (BW, PW, and fat), while the IR-UTE image represents only the BW signal. Therefore, higher PW and fat signals may result in higher SR magnitudes, indicating a higher cortical porosity. In previous ex vivo validation studies of a limited number of specimens (n=13), SR demonstrated significant correlations with μCT-based bone porosity and donor age (21). Recently, the significant correlations of PI with microstructural and mechanical properties were confirmed in an investigation with a larger sample size (n=135) (25). The feasibility of SR calculation and its reproducibility level were investigated in previous studies (intraclass correlation coefficient of 0.98) (21) SR from in vivo studies (n=72) demonstrated significant correlations with volumetric bone mineral density (vBMD) (R=0.64) and age (R=0.67) in healthy subjects (21). However, the SR performance in distinguishing subjects with OPo is yet to be investigated.
This study aimed to investigate the performance of PI and SR in detecting bone quality differences between female osteopenia (OPe), osteoporosis (OPo), and normal (Normal) subjects.
2 Materials and methods
2.1 Subject inclusion
A total of 82 female subjects were recruited for MRI scans: 37 with normal bone (Normal group, 36 ± 19 years old), 14 OPe (72 ± 6 years old), and 31 OPo (72 ± 6 years old). The inclusion criteria for each group were as follows: (1) Normal group: pre-menopausal females under 40 years old or post-menopausal females with recent (<one month) DEXA T-scores above -1; (2) OPe group: post-menopausal females with DEXA T-scores between -2.5 and -1; and (3) OPo group: post-menopausal females with DEXA T-scores below -2.5. Subjcets with a history of bone fracture have been excluded from the study. The institutional review board (IRB) of the University of California, San Diego, approved this study, which was conducted in accordance with applicable good clinical practice requirements and the relevant guidelines and regulations. Written informed consent was obtained from each subject.
2.2 UTE-MR imaging and data analysis
All subjects were scanned on a 3T MRI (MR750, GE Healthcare Technologies, WI, USA) scanner using an eight-channel knee coil for both RF transmission and signal reception. The imaging slab was centered in the middle of the tibia and localized based on the operator’s experience. The UTE-MRI scans involved: a) dual-echo 3D UTE Cones sequence (repetition time (TR)=100 ms, TE=0.032 and 2.2 ms, flip angle (FA)=10°) for porosity index (PI) measurement (PI= 2nd TE signal divided by UTE signal) (7, 9, 20) and b) 3D adiabatic IR-UTE Cones sequence (TR=100 ms, TI=45 ms, and TE=0.032 ms, FA=20°) to calculate the suppression ratio (SR=UTE signal divided by IR-UTE signal) (7, 9, 21). The field-of-view (FOV), voxel size, in-plane matrix dimension, number of slices, and slice thickness were 140×140×120 mm3, 160×160, 0.87×0.87×5 mm3, 24, and 5 mm, respectively. The total scan time was approximately 10 mins.
Average PI and SR were calculated within regions of interest (ROIs) covering the entire bone cross-section selected by two experienced MRI readers for measuring PI and SR using a home-developed MATLAB (Mathworks, MA, USA) code. MRI measurements were performed on single slice consistently selected in the middle of the acquired stack of images. Local bone thickness was calculated for each pixel as equal to the diameter of the largest fitted circle within the selected ROI. Bone thickness for each subject was calculated by averaging the local thickness of all bone pixels. Intraclass correlation coefficient (ICC) was calculated for PI and SR between the two readers to investigate their reproducibility.
2.3 Statistical analysis
The one-sample Kolmogorov-Smirnov test was performed to determine whether the measured PI and SR were normally distributed for each group. The Kruskal–Wallis test by ranks was used to examine the data differences between the three subject groups (Normal, OPe, and OPo). Spearman’s rank correlation coefficients were calculated between DEXA T-score (51 subjects had DEXA scans) and the UTE-MRI-based bone measures (PI and SR). P-values below 0.05 were considered significant. Statistical analyses were performed using MATLAB codes developed by the authors.
3 Results
Table 1 presents the average and standard deviation (SD) values of PI and SR performed on the tibial bone midshaft of the subjects in the three studied groups (Normal, OPe, and OPo groups). Independent measurements by the two readers were averaged. ICCs between these independent measurements are also presented in Table 1. For all MRI parameters, ICCs were higher than 0.95, indicating a high consistency between measurements performed by independent readers.
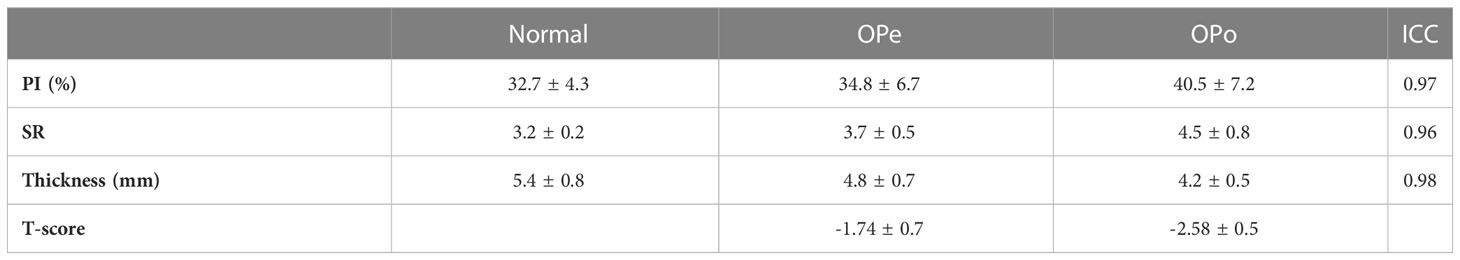
Table 1 Average PI, SR, bone thickness, and T-score values for different groups.
Figure 1 demonstrates the generated PI and SR pixel maps for three exemplary subjects from the Normal, OPe, and OPo groups. As expected from Table 1, PI and SR values were observed in the following ascending order: Normal<OPe<OPo. In contrast, the mean bone thickness was found in the following descending order: Normal>OPe>OPo.
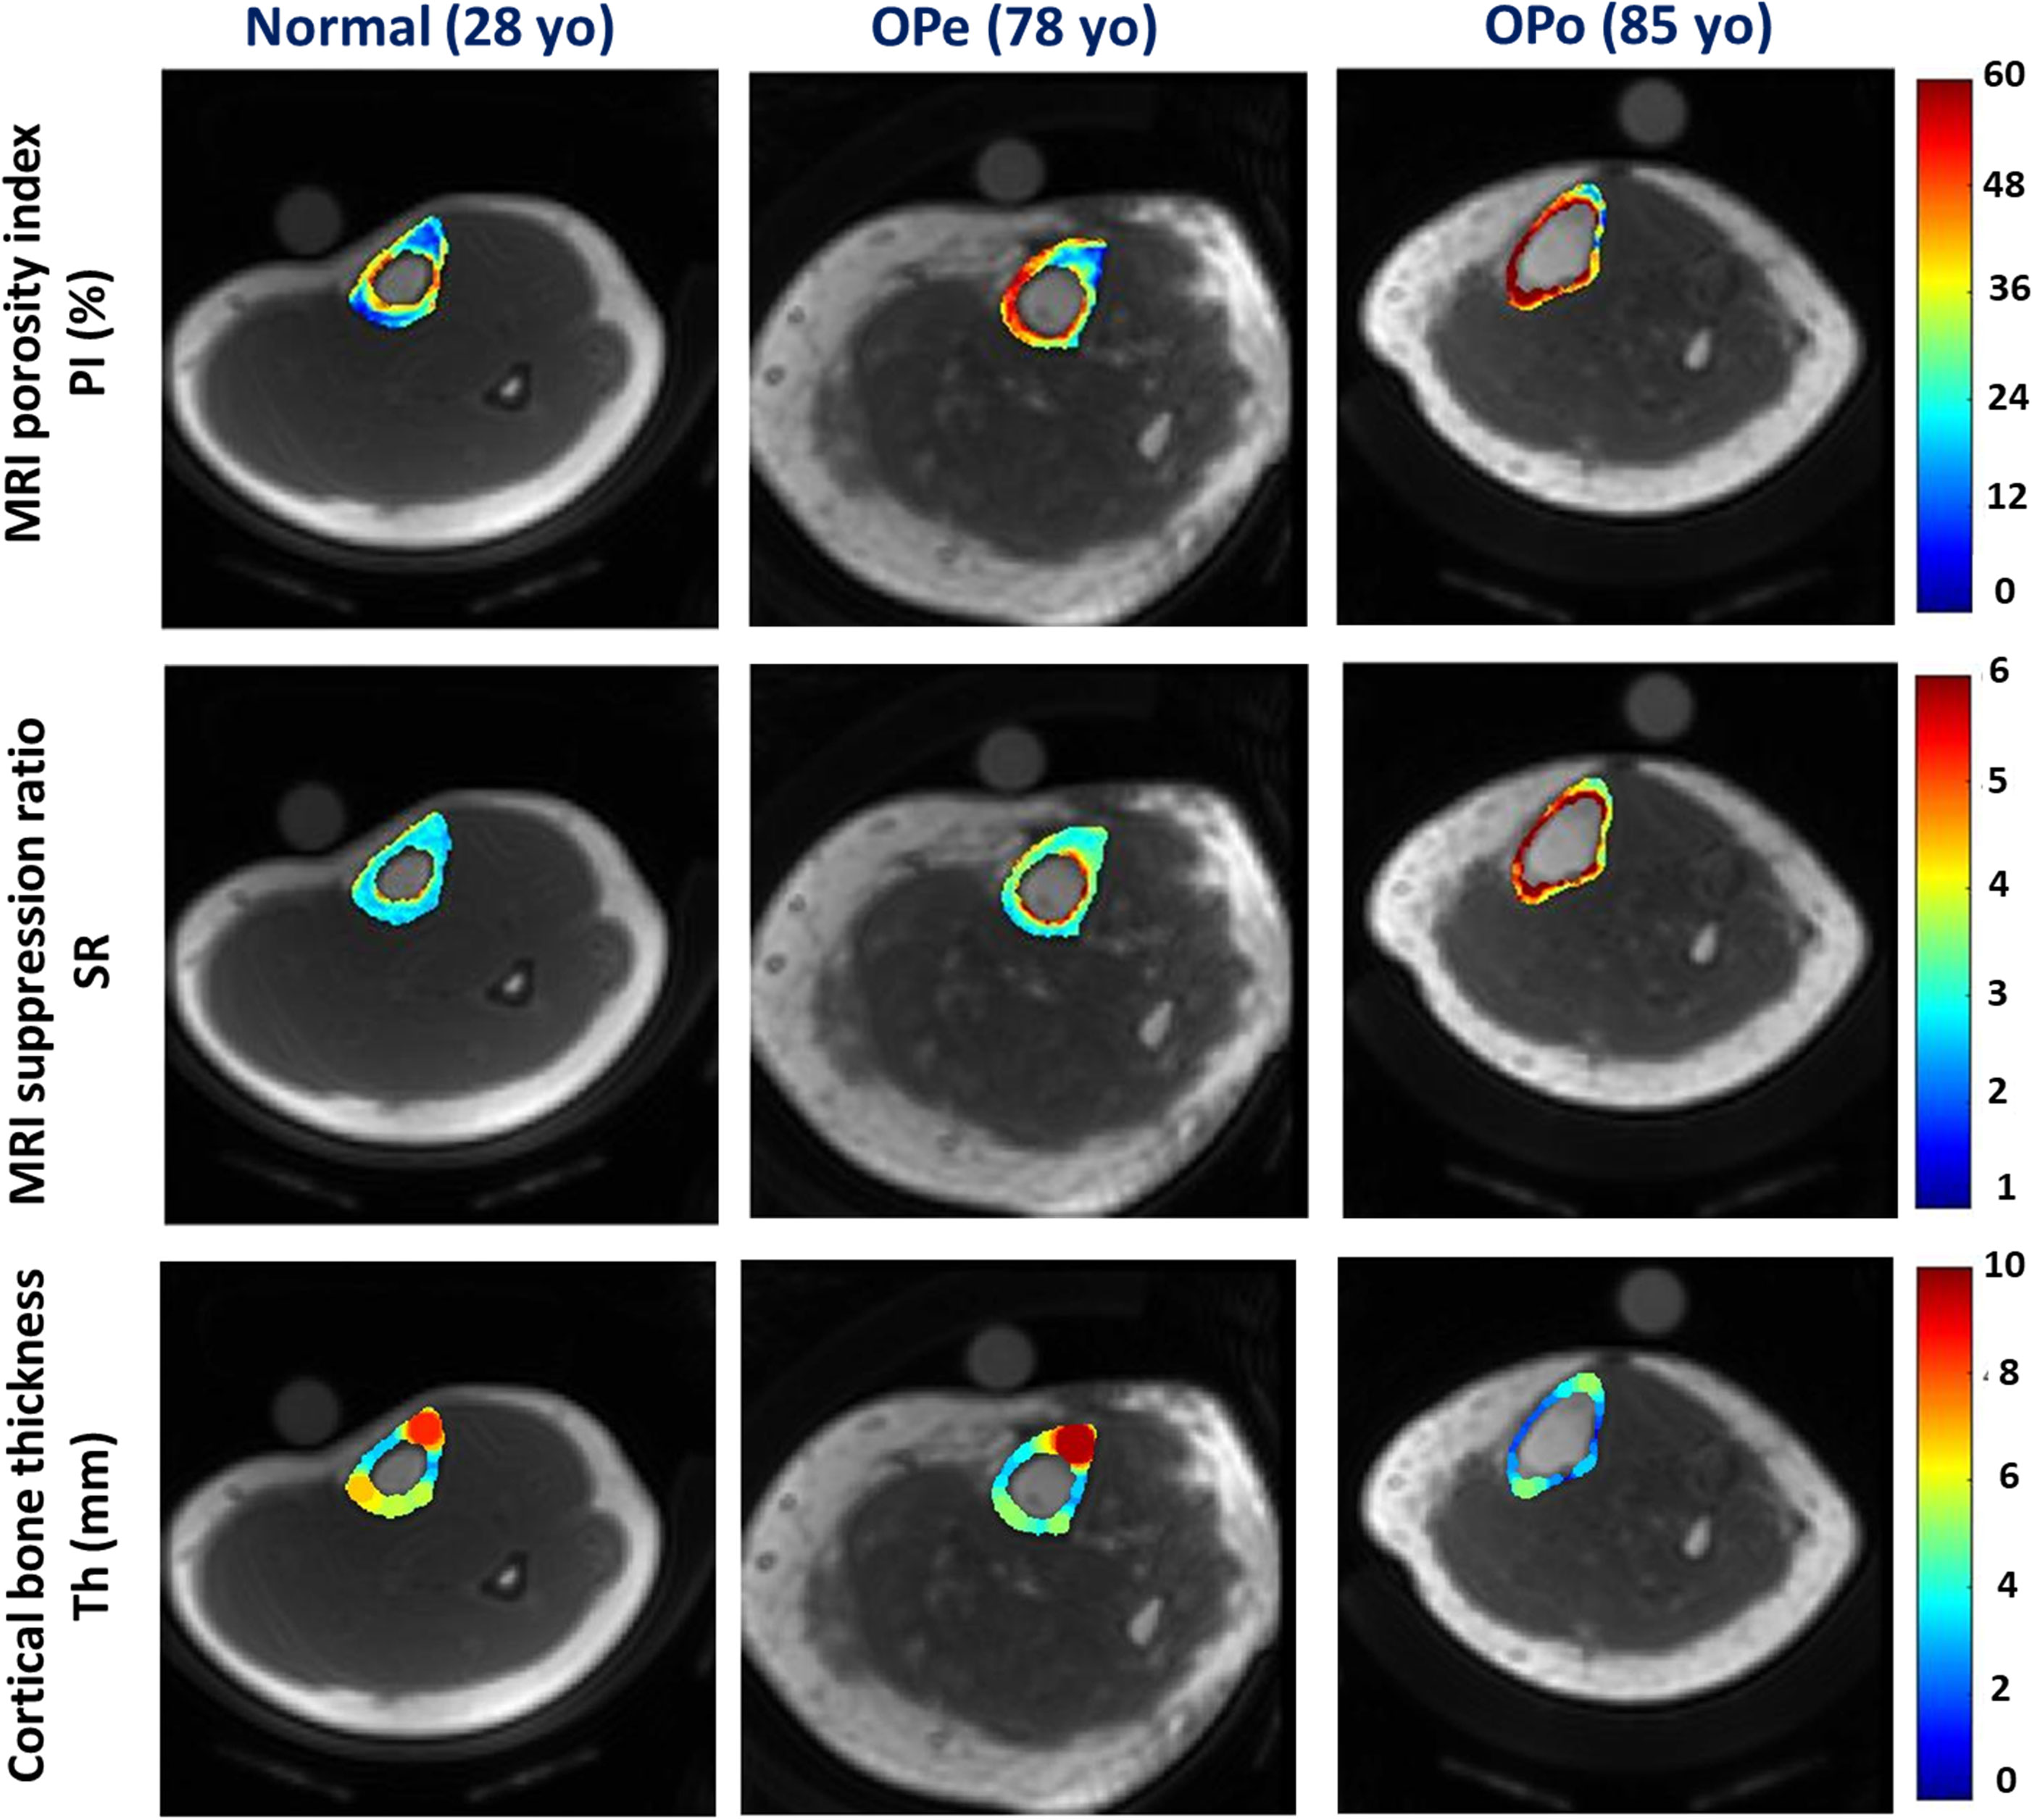
Figure 1 Generated PI, SR, and bone thickness maps for exemplary subjects from the Normal group (first column, 28-year-old female), the OPe group (second column, 78-year-old female), and the OPo group (third column, 85-year-old female). PI and SR were observed in the following ascending order: Normal<OPe<OPo. Regions with higher PI and SR values are likely regions with higher porosity, particularly near the endosteum. In contrast, the mean bone thickness was found in the following descending order: Normal>OPe>OPo.
Percentage differences in PI and SR between the investigated groups and their statistical significance are presented in Table 2. PI was significantly higher in the OPo group compared with the Normal (24.1%, p<0.01) and OPe (16.3%, p<0.01) groups. PI in the OPe group was higher than in the Normal group, but the difference was nonsignificant (6.6%, p=0.73). SR was significantly higher in the OPo group compared with the Normal (41.5%, p<0.01) and Ope (21.8%, p=0.02) groups. SR differences between the OPe and Normal groups were also statistically significant (16.2%, p<0.01). Cortical bone was significantly thinner in the OPo group compared with the Normal (22.0%, p<0.01) and OPe (13.0%, p=0.02) groups. Bone thickness in the OPe group was lower than in the Normal group, but the difference did not reach statistical significance (10.3%, p=0.19).
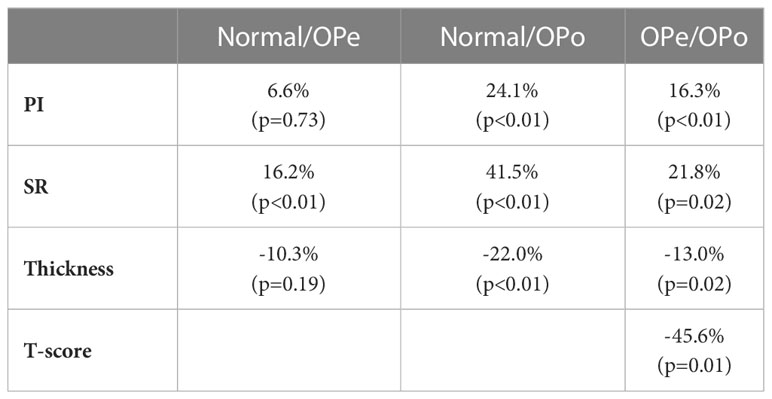
Table 2 Percentage difference in PI, SR, bone thickness, and T-score values between the studied groups.
Figure 2 depicts the average, median, SD, and first and third quartiles of PI, SR, and bone thickness values for each group of subjects using Whisker boxplots. Statistically, significant differences are indicated between groups by horizontal red lines marked with an asterisk.
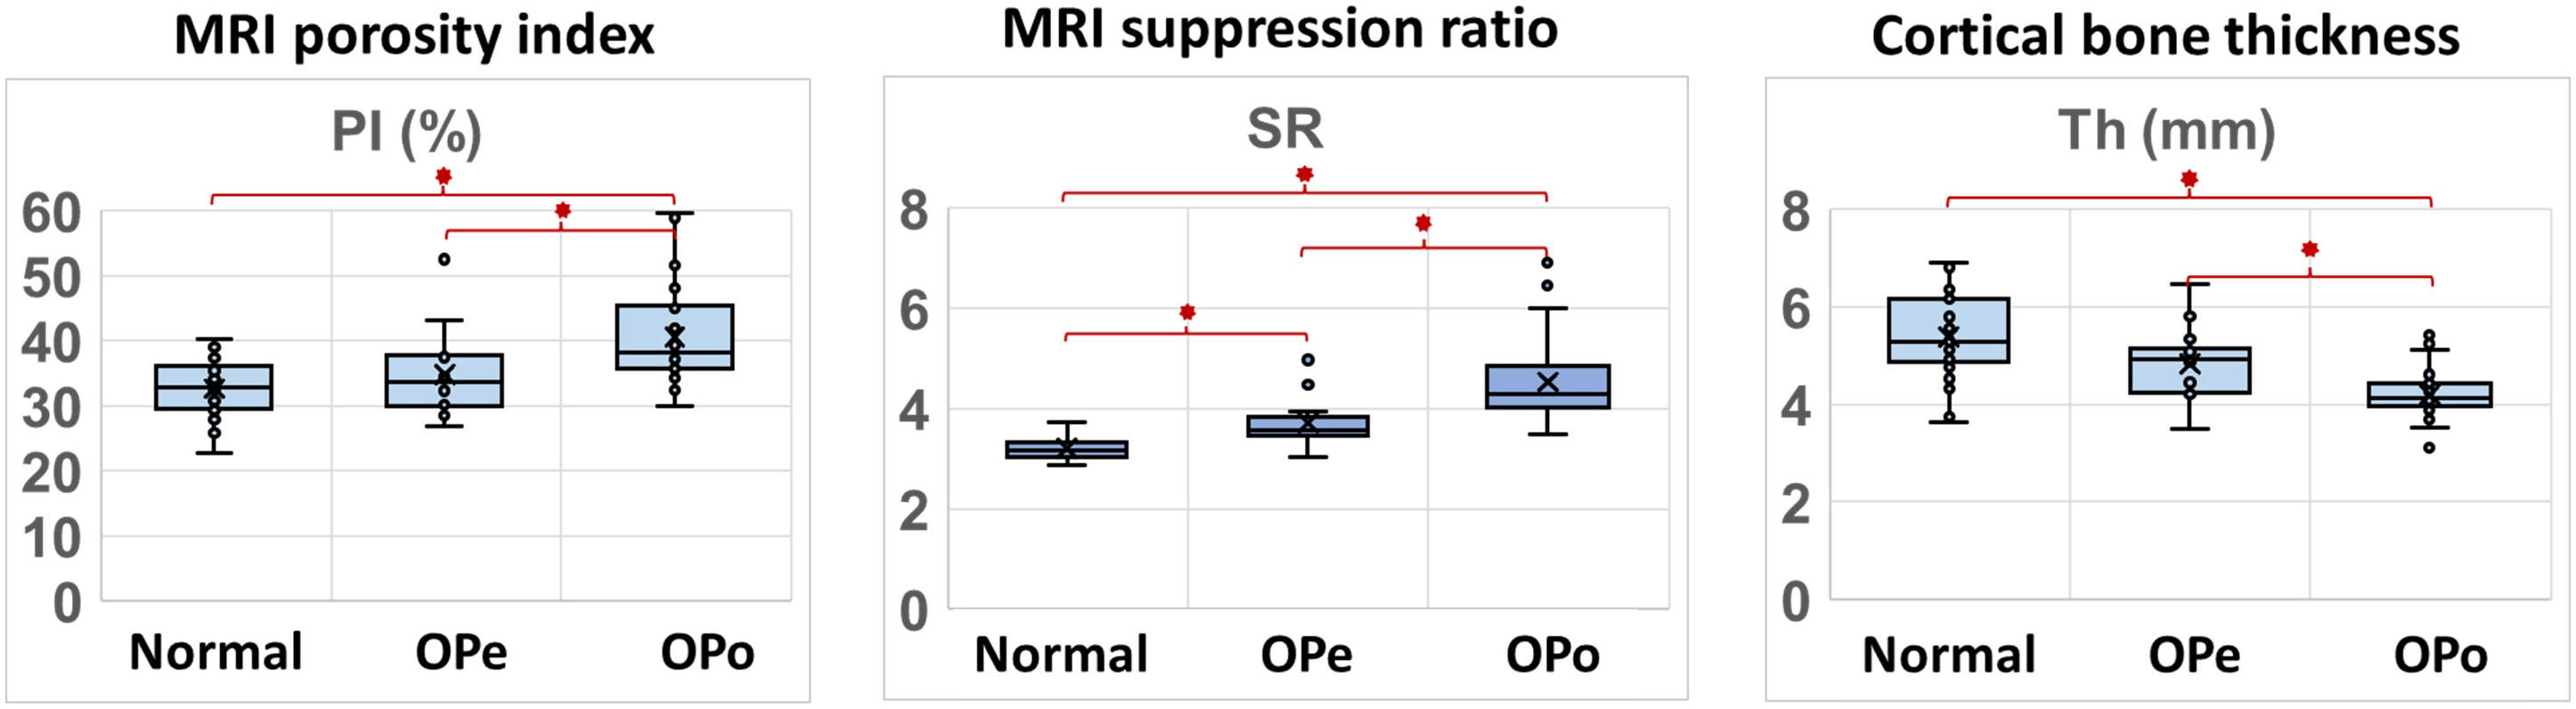
Figure 2 Boxplots of PI, SR, and bone thickness in the Normal, OPe, and OPo groups. Average, median, SD, and first and third quartile values are indicated in the boxplots.
Spearman’s correlation coefficients between DEXA T-score (performed at the hip) and UTE-MRI measures (performed at the tibial shaft) are presented in Table 3 (using 51 data points with DEXA scans; young control subjects did not have DEXA scans). SR correlation with T-score was significant (moderate, R=-0.50, p<0.01), while PI showed a significant but poor correlation with T-score (R=-0.32, p<0.01). Bone thickness also showed a significant correlation with T-score (moderate, R=0.51, p<0.01). Figure 3 demonstrates the scatter plots and the linear regressions of the DEXA T-score on PI, SR, and bone thickness. As expected, higher bone mineral densities are associated with thicker tibial cortex yet lower PI and SR in scanned subjects.
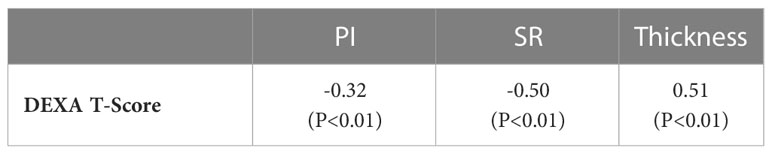
Table 3 Spearman’s correlation coefficients between DEXTA T-score and UTE-based measures (PI, SR, and bone thickness).
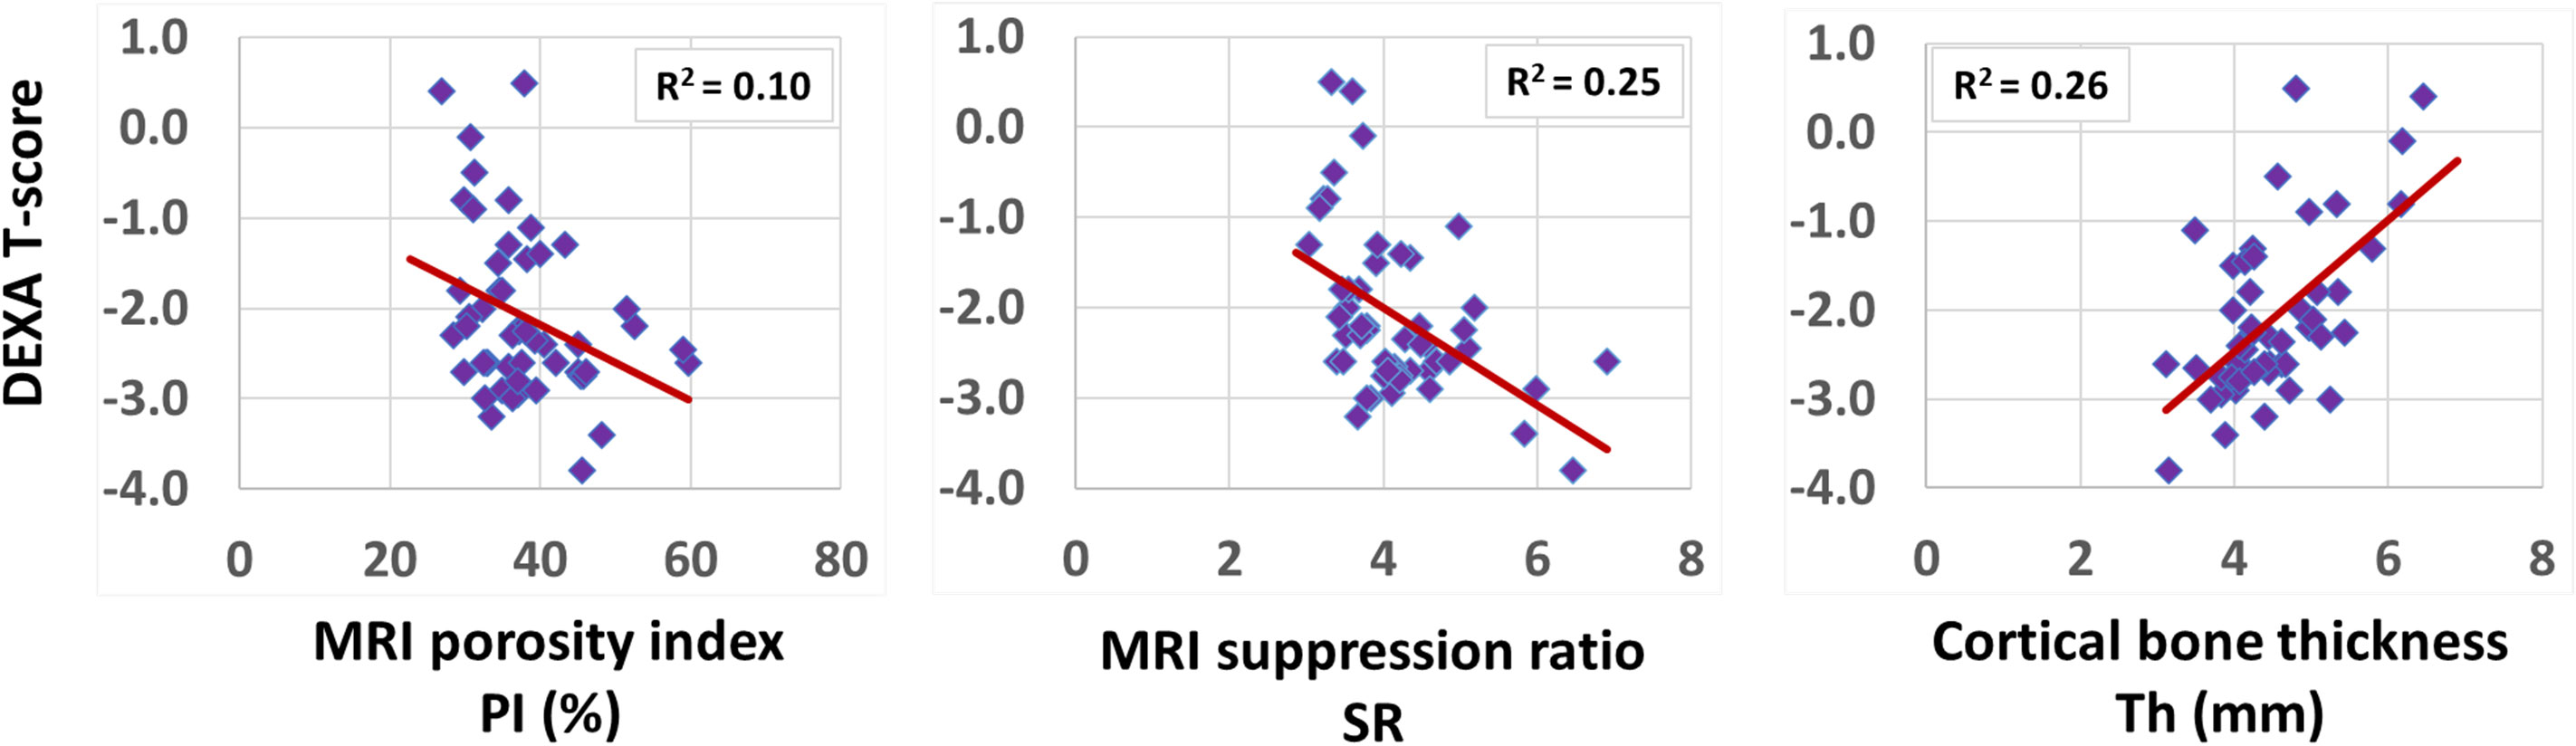
Figure 3 Scatterplots and linear trendlines of DEXA T-score on PI, SR, and bone thickness. R2 values were calculated from Spearman’s correlation coefficients.
4 Discussion
This study investigated the differences in PI and SR, two recently developed rapid UTE-MRI-based bone assessment indices, between OPo, OPe, and Normal subjects. These rapid UTE-MRI-based techniques for bone assessment can be considered in vivo-translatable techniques due to their simplicity, time efficiency, and, importantly, their non-invasive and ionizing-radiation-free nature.
PI and SR were significantly higher in the studied OPo group compared with the Normal and OPe groups. The SR difference between the OPe and Normal groups was also statistically significant. Higher SR and PI values in OPo subjects can be explained by the anticipated porosity increase in cortical bone during OPo disease development. This study added to the previous feasibility in vivo studies of PI and SR, where healthy elderly subjects demonstrated higher PI and SR than young subjects (20, 21). This highlights the potential capability of PI and SR as measures of bone porosity, positioning them as useful and rapid tools for monitoring OPe subjects before OPo advancement, as well as for OPo subjects undergoing medical interventions. It should be noted that the relationships between bone porosity and these UTE-based indices were validated in previous ex vivo studies (20, 21, 25).
A significant moderate correlation was observed between the SR measured at the tibial bone midshaft and the DEXA T-score measured at the hip. PI correlation with T-score was also significant but poor. The reported correlations of PI and SR with vBMD in prior investigations (21), both performed at the tibia, were higher compared to the presented correlation in this study. Although it can be assumed that the bone matrix deterioration occurs across the entire lower extremity at similar rates, higher correlation levels would be expected between PI/SR and DEXA T-score if the same bone sites were investigated in the study. Moreover, it is likely that PI and SR detect the PW signal in slightly different ranges of pores; therefore, they did not demonstrate a similar level of correlation with the DEXA T-Score.
It should be noted that the required scan time for all UTE MRI techniques can be improved by different acceleration techniques such as spokes stretching in Cones (27), compressed sensing (28, 29), and parallel imaging (30, 31). Since both PI and SR measurements require only two acquisitions, they may be faster than other techniques which require multiple acquisitions (19, 32–42), if similar acceleration techniques are utilized. This applies also to other techniques with single or dual acquisitions, such as the PW and BW direct imaging techniques, employed by Horch et al. (43) and Manhard et al. (44), as well as the MTR technique employed by Chang et al. (45).
PI and SR have the potential to monitor the subvoxel cortical bone quantity changes. Subvoxel bone quantifications (e.g., porosity) can play a critical role in determining the bone fracture risk if combined with the current fracture risk assessments. Notably, bone strength is highly determined by the bone structure and its subvoxel material properties. Along with increases in PI and SR in OPo subjecs, cortical bone was significantly thinner compared with the Normal and OPe groups. Similar bone thinning has been reported in previous MRI-based (46) and high-resolution peripheral quantitative CT (HR-pQCT) (47)studies. In light of this fact, comprehensive cortical bone fracture risk evaluation is suggested by complementing the current standard measures (e.g., BMD and FRACS) with bone morphology and MRI-based subvoxel quantity measures.
The limitations of this study can be summarized in five aspects. First, while the presented techniques were translated to in vivo applications, only a limited number of subjects were recruited for this study. These techniques must be examined on a larger cohort of OPe and OPo subjects to confirm their clinical applications for OPo disease monitoring. Second, SR magnitude is related to the selection of TR and TI, which was based on our experience with SNR improvement and efficient PW signal nulling. There might be an optimal TR/TI combination that could further improve the performance of SR detecting bone deteriorations in OPo subjects, even though, based on the current parameters, PI and SR demonstrated comparable performance. Third, we have investigated the correlations of PI and SR performed at the tibial midshaft with the DEXA T-scores at the hip. Future in vivo validation studies using HR-pQCT or DEXA performed on the tibial midshaft may be required to confirm the significant correlations between our rapid UTE-based indices and bone microstructural changes. Fourth, tibial bone is not the prominent fracture site in most OPo subjects; however, because of the relatively thick cortical bone in tibias, a robust investigation of the UTE-MRI feasibility has been possible. Future investigations should be focused on the hip or spine which present more fracture morbidity and mortality and similarly much more of a challenge for UTE-MRI imaging encountering a thinner bone with sophisticated morphology, located deeper inside the body. Such studies also provide the opportunity for comprehensive comparisons between UTE-MRI and DEXA data which usually are acquired at the hip or spine, such as bone area, BMD, bone mineral content, and bone texture in addition to the often-used T-score. Fifth, PI, SR, and bone thickness were calculated in a single slice in the middle of the tibial shaft. The potential variations of MRI measures across the length of the tibia likely influenced the presented results in this study. Employing an automatic approach for ROI selection in future studies would help to investigate the MRI measurement variations across the entire scanned volumes.
5 Conclusion
We investigated the differences in PI and SR, two recently developed rapid UTE-MRI-based bone assessment indices, between OPo, OPe, and Normal subjects. These rapid UTE-MRI-based techniques for bone assessment can be considered in vivo-translatable techniques due to their simplicity, time efficiency, and, importantly, their non-invasive and ionizing-radiation-free nature. PI and SR were significantly higher while bone was significantly thinner in the OPo group compared with the Normal and OPe groups. DEXA T-scores in subjects were significantly correlated with PI, SR, and bone thickness. This study highlighted PI and SR as potential rapid UTE-MRI techniques to assess and monitor the quality of cortical bone in patients affected by OPo.
Data availability statement
The raw data supporting the conclusions of this article will be made available by the authors, without undue reservation.
Ethics statement
The studies involving human participants were reviewed and approved by University of California, San Diego. The patients/participants provided their written informed consent to participate in this study.
Author contributions
All authors contributed to the article and approved the submitted version.
Funding
The authors acknowledge grant support from the National Institutes of Health (K01AR080257, R01AR068987, R01AR062581, R01AR075825, R01AR079484, R01AR078877, and 5P30AR073761), Veterans Affairs Clinical Science and Rehabilitation R&D (I01CX001388, I01RX002604, and I01CX000625), and GE Healthcare.
Conflict of interest
The authors declare that the research was conducted in the absence of any commercial or financial relationships that could be construed as a potential conflict of interest.
Publisher’s note
All claims expressed in this article are solely those of the authors and do not necessarily represent those of their affiliated organizations, or those of the publisher, the editors and the reviewers. Any product that may be evaluated in this article, or claim that may be made by its manufacturer, is not guaranteed or endorsed by the publisher.
Abbreviations
DEXA, dual-energy x-ray absorptiometry, MR, magnetic resonance; MRI, magnetic resonance imaging; 3D-UTE, three-dimensional ultrashort echo time imaging; RF, radiofrequency; FOV, field of view; ROI, region of interest; TE, echo time; TR, repetition time; CT, computed tomography; HR-pQCT; high-resolution peripheral quantitative computed tomography; FA, flip angle; BMD, bone mineral density.
References
1. Zanker J, Duque G. Osteoporosis in older persons: Old and new players. J Am Geriatr Soc (2019) 67:831–40. doi: 10.1111/jgs.15716
2. Guerri S, Mercatelli D, Gómez MPA, Napoli A, Battista G, Guglielmi G, et al. Quantitative imaging techniques for the assessment of osteoporosis and sarcopenia. Quant Imaging Med Surg (2018) 8:60–85. doi: 10.21037/qims.2018.01.05
3. Wright NC, Looker AC, Saag KG, Curtis JR, Delzell ES, Randall S, et al. The recent prevalence of osteoporosis and low bone mass in the United States based on bone mineral density at the femoral neck or lumbar spine. J Bone Miner Res (2014) 29(11):2520–6. doi: 10.1002/jbmr.2269
4. Dimai HP. Use of dual-energy X-ray absorptiometry (DXA) for diagnosis and fracture risk assessment; WHO-criteria, T- and z-score, and reference databases. Bone (2017) 104:39–43. doi: 10.1016/j.bone.2016.12.016
5. MacDonald HM, Nishiyama KK, Kang J, Hanley DA, Boyd SK. Age-related patterns of trabecular and cortical bone loss differ between sexes and skeletal sites: A population-based HR-pQCT study. J Bone Miner Res (2011) 26:50–62. doi: 10.1002/jbmr.171
6. Trajanoska K, Schoufour JD, de Jonge EAL, Kieboom BCT, Mulder M, Stricker BH, et al. Fracture incidence and secular trends between 1989 and 2013 in a population based cohort: The Rotterdam study. Bone (2018) 114:116–24. doi: 10.1016/j.bone.2018.06.004
7. Jerban S, Ma Y, Wei Z, Jang H, Chang EY, Du J. Quantitative magnetic resonance imaging of cortical and trabecular bone. Semin Musculoskelet Radiol (2020) 24:386–401. doi: 10.1055/s-0040-1710355
8. Jerban S, Chang DG, Ma Y, Jang H, Chang EY, Du J. An update in qualitative imaging of bone using ultrashort echo time magnetic resonance. Front Endocrinol (Lausanne) (2020) 11:555756. doi: 10.3389/fendo.2020.555756
9. Ma Y-J, Jerban S, Jang H, Chang D, Chang EY, Du J. Quantitative ultrashort echo time (UTE) magnetic resonance imaging of bone: An update. Front Endocrinol (Lausanne) (2020) 11:567417. doi: 10.3389/fendo.2020.567417
10. Masoud Afsahi A, Ma Y, Jang H, Jerban S, Chung CB, Chang EY, et al. Ultrashort echo time magnetic resonance imaging techniques: Met and unmet needs in musculoskeletal imaging. J Magn Reson Imaging (2022) 55(6):1597–1612. doi: 10.1002/jmri.28032
11. Du J, Bydder GM. Qualitative and quantitative ultrashort-TE MRI of cortical bone. NMR BioMed (2013) 26:489–506. doi: 10.1002/nbm.2906
12. Chang EY, Du J, Chung CB. UTE imaging in the musculoskeletal system. J Magnetic Resonance Imaging (2015) 41:870–83. doi: 10.1002/jmri.24713
13. Manhard MK, Nyman JS, Does MD. Advances in imaging approaches to fracture risk evaluation. Trans Res (2017) 181:1–14. doi: 10.1016/j.trsl.2016.09.006
14. Wehrli FW. Magnetic resonance of calcified tissues. J Magnetic Resonance (2013) 229:35–48. doi: 10.1016/j.jmr.2012.12.011
15. Jerban S, Ma Y, Namiranian B, Ashir A, Shirazian H, Zhao W, et al. Age-related decrease in collagen proton fraction in tibial tendons estimated by magnetization transfer modeling of ultrashort echo time magnetic resonance imaging (UTE-MRI). Sci Rep (2019) 9:17974. doi: 10.1038/s41598-019-54559-3
16. Jerban S, Ma Y, Afsahi AM, Lombardi A, Wei Z, Shen M, et al. Lower macromolecular content in tendons of female patients with osteoporosis versus patients with osteopenia detected by ultrashort echo time (UTE) MRI. Diagnostics (2022) 12:1061. doi: 10.3390/diagnostics12051061
17. Nyman JS, Roy A, Shen X, Acuna RL, Tyler JH, Wang X. The influence of water removal on the strength and toughness of cortical bone. J Biomech (2006) 39:931–8. doi: 10.1016/j.jbiomech.2005.01.012
18. Zhao X, Song HK, Seifert AC, Li C, Wehrli FW. Feasibility of assessing bone matrix and mineral properties in vivo by combined solidstate 1H and 31P MRI. PLoS One (2017) 12:1–16. doi: 10.1371/journal.pone.0173995
19. Lu X, Jerban S, Wan L, Ma Y, Jang H, Le N, et al. Three dimensional ultrashort echo time imaging with tri-component analysis for human cortical bone. Magn Reson Med (2019) 82:348–55. doi: 10.1002/mrm.27718
20. Rajapakse CS, Bashoor-Zadeh M, Li C, Sun W, Wright AC, Wehrli FW. Volumetric cortical bone porosity assessment with MR imaging: Validation and clinical feasibility. Radiology (2015) 276:526–35. doi: 10.1148/radiol.15141850
21. Li C, Seifert AC, Rad HS, Bhagat YA, Rajapakse CS, Sun W, et al. Cortical bone water concentration: Dependence of MR imaging measures on age and pore volume fraction. Radiology (2014) 272:796–806. doi: 10.1148/radiol.14132585
22. Manhard MK, Harkins KD, Gochberg DF, Nyman JS, Does MD. 30-second bound and pore water concentration mapping of cortical bone using 2D UTE with optimized half-pulses. Magn Reson Med (2017) 77:945–50. doi: 10.1002/mrm.26605
23. Harkins KD, Ketsiri T, Nyman JS, Does MD. Fast bound and pore water mapping of cortical bone with arbitrary slice oriented two-dimensional ultra-short echo time. Magn Reson Med (2023) 89:767–73. doi: 10.1002/mrm.29484
24. Hong AL, Ispiryan M, Padalkar MV, Jones BC, Batzdorf AS, Shetye SS, et al. MRI-Derived bone porosity index correlates to bone composition and mechanical stiffness. Bone Rep (2019) 11:100213. doi: 10.1016/j.bonr.2019.100213
25. Jerban S, Ma Y, Alenezi S, Moazamian D, Athertya J, Jang H, et al. Ultrashort echo time (UTE) MRI porosity index (PI) and suppression ratio (SR) correlate with the cortical bone microstructural and mechanical properties: Ex vivo study. Bone (2023) 169:116676. doi: 10.1016/j.bone.2023.116676
26. Xiong Y, He T, Wang Y, Liu WV, Hu S, Zhang Y, et al. CKD stages, bone metabolism markers, and cortical porosity index: Associations and mediation effects analysis. Front Endocrinol (Lausanne) (2021) 12:775066. doi: 10.3389/fendo.2021.775066
27. Wan L, Zhao W, Ma Y, Jerban S, Searleman AC, Carl M, et al. Fast quantitative 3D ultrashort echo time MRI of cortical bone using extended cones sampling. Magn Reson Med (2019) 82:225–36. doi: 10.1002/mrm.27715
28. Lustig M, Donoho D, Pauly JM. Sparse MRI: The application of compressed sensing for rapid MR imaging. Magn Reson Med (2007) 58:1182–95. doi: 10.1002/mrm.21391
29. Athertya JS, Ma Y, Masoud Afsahi A, Lombardi AF, Moazamian D, Jerban S, et al. Accelerated quantitative 3D UTE-cones imaging using compressed sensing. Sensors (2022) 22:7459. doi: 10.3390/s22197459
30. Otazo R, Kim D, Axel L, Sodickson DK. Combination of compressed sensing and parallel imaging for highly accelerated first-pass cardiac perfusion MRI. Magn Reson Med (2010) 64:767–76. doi: 10.1002/mrm.22463
31. Chang G, Deniz CM, Honig S, Rajapakse CS, Egol K, Regatte RR, et al. Feasibility of three-dimensional MRI of proximal femur microarchitecture at 3 tesla using 26 receive elements without and with parallel imaging. J Magnetic Resonance Imaging (2014) 40:229–38. doi: 10.1002/jmri.24345
32. Jerban S, Ma Y, Dorthe EW, Kakos L, Le N, Alenezi S, et al. Assessing cortical bone mechanical properties using collagen proton fraction from ultrashort echo time magnetization transfer (UTE-MT) MRI modeling. Bone Rep (2019) 8:1–8. doi: 10.1016/j.bonr.2019.100220
33. Jerban S, Lu X, Dorthe EW, Alenezi S, Ma Y, Kakos L, et al. Correlations of cortical bone microstructural and mechanical properties with water proton fractions obtained from ultrashort echo time (UTE) MRI tricomponent T2* model. NMR BioMed (2020) 33:e4233. doi: 10.1002/nbm.4233
34. Jerban S, Ma Y, Wan L, Searleman AC, Jang H, Sah RL, et al. Collagen proton fraction from ultrashort echo time magnetization transfer (UTE-MT) MRI modelling correlates significantly with cortical bone porosity measured with micro-computed tomography (μCT). NMR BioMed (2019) 32:e4045. doi: 10.1002/nbm.4045
35. Jerban S, Lu X, Jang H, Ma Y, Namiranian B, Le N, et al. Significant correlations between human cortical bone mineral density and quantitative susceptibility mapping (QSM) obtained with 3D cones ultrashort echo time magnetic resonance imaging (UTE-MRI). Magn Reson Imaging (2019) 62:104–10. doi: 10.1016/j.mri.2019.06.016
36. Jerban S, Ma Y, Wong JH, Nazaran A, Searleman A, Wan L, et al. Ultrashort echo time magnetic resonance imaging (UTE-MRI) of cortical bone correlates well with histomorphometric assessment of bone microstructure. Bone (2019) 123:8–17. doi: 10.1016/j.bone.2019.03.013
37. Jerban S, Ma Y, Li L, Jang H, Wan L, Guo T, et al. Volumetric mapping of bound and pore water as well as collagen protons in cortical bone using 3D ultrashort echo time cones MR imaging techniques. Bone (2019) 127:120–8. doi: 10.1016/j.bone.2019.05.038
38. Guo T, Ma Y, Jerban S, Jang H, Zhao W, Chang EY, et al. T1 measurement of bound water in cortical bone using 3D adiabatic inversion recovery ultrashort echo time (3D IR-UTE) cones imaging. Magn Reson Med (2020) 84:634–45. doi: 10.1002/mrm.28140
39. Li S, Chang EY, Bae WC, Chung CB, Gao S, Bao S, et al. Ultrashort echo time bi-component analysis of cortical bone - a field dependence study. Magn Reson Med (2014) 71:1075–81. doi: 10.1002/mrm.24769
40. Seifert AC, Wehrli SL, Wehrli FW. Bi-component T2* analysis of bound and pore bone water fractions fails at high field strengths. NMR BioMed (2015) 28(7):861–72. doi: 10.1002/nbm.3305
41. Biswas R, Bae WC, Diaz E, Masuda K, Chung CB, Bydder GM, et al. Ultrashort echo time (UTE) imaging with bi-component analysis: Bound and free water evaluation of bovine cortical bone subject to sequential drying. Bone (2012) 50:749–55. doi: 10.1016/j.bone.2011.11.029
42. Jerban S, Szeverenyi N, Ma Y, Guo T, Namiranian B, To S, et al. Ultrashort echo time MRI (UTE-MRI) quantifications of cortical bone varied significantly at body temperature compared with room temperature. Investig Magn Reson Imaging (2019) 23:202. doi: 10.13104/imri.2019.23.3.000
43. Horch RA, Gochberg DF, Nyman JS, Does MD. Clinically compatible MRI strategies for discriminating bound and pore water in cortical bone. Magn Reson Med (2012) 68:1774–84. doi: 10.1002/mrm.24186
44. Manhard MK, Uppuganti S, Granke M, Gochberg DF, Nyman JS, Does MD. MRI-Derived bound and pore water concentrations as predictors of fracture resistance. Bone (2016) 87:1–10. doi: 10.1016/j.bone.2016.03.007
45. Chang EY, Bae WC, Shao H, Biswas R, Li S, Chen J, et al. Ultrashort echo time magnetization transfer ( UTE-MT ) imaging of cortical bone. NMR BioMed (2015) 28:873–80. doi: 10.1002/nbm.3316
46. Jones BC, Lee H, Cheng C-C, al Mukaddam M, Song HK, Snyder PJ, et al. MRI Quantification of cortical bone porosity, mineralization, and morphologic structure in postmenopausal osteoporosis. Radiology (2023) 11: 100213. doi: 10.1148/radiol.221810
47. Kral R, Osima M, Borgen TT, Vestgaard R, Richardsen E, Bjørnerem Å. Increased cortical porosity and reduced cortical thickness of the proximal femur are associated with nonvertebral fracture independent of fracture risk assessment tool and garvan estimates in postmenopausal women. PLoS One (2017) 12:e0185363. doi: 10.1371/journal.pone.0185363
Keywords: osteoporosis, cortical bone, MRI, ultrashort echo time (UTE), bone quality
Citation: Jerban S, Ma Y, Moazamian D, Athertya J, Dwek S, Jang H, Woods G, Chung CB, Chang EY and Du J (2023) MRI-based porosity index (PI) and suppression ratio (SR) in the tibial cortex show significant differences between normal, osteopenic, and osteoporotic female subjects. Front. Endocrinol. 14:1148345. doi: 10.3389/fendo.2023.1148345
Received: 20 January 2023; Accepted: 09 March 2023;
Published: 21 March 2023.
Edited by:
Cristina Vassalle, Gabriele Monasterio Tuscany Foundation (CNR), ItalyReviewed by:
Robert Brommage, BoneGenomics, United StatesFeliks Kogan, Stanford University, United States
Copyright © 2023 Jerban, Ma, Moazamian, Athertya, Dwek, Jang, Woods, Chung, Chang and Du. This is an open-access article distributed under the terms of the Creative Commons Attribution License (CC BY). The use, distribution or reproduction in other forums is permitted, provided the original author(s) and the copyright owner(s) are credited and that the original publication in this journal is cited, in accordance with accepted academic practice. No use, distribution or reproduction is permitted which does not comply with these terms.
*Correspondence: Jiang Du, amlhbmdkdUBoZWFsdGgudWNzZC5lZHU=; Saeed Jerban, c2plcmJhbkBoZWFsdGgudWNzZC5lZHU=