 Ziang Ma1
 Wenjuan Sun2Lixin Wang2Yuansong Wang2
 Baochao Pan1Xiuhai Su2
 Hanzhou Li3Hui Zhang1
 Shuquan Lv2*
 Hongwu Wang4*
- 1Graduate School of Hebei University of Chinese Medicine, Shijiazhuang, China
- 2Cangzhou Hospital of Integrated Traditional Chinese Medicine and Western Medicine of Hebei Province Affiliated to Hebei University of Chinese Medicine, Cangzhou, China
- 3College of Integrated Chinese and Western Medicine, Tianjin University of Traditional Chinese Medicine, Tianjin, China
- 4College of Traditional Chinese Medicine, Tianjin University of Traditional Chinese Medicine, Tianjin, China
Introduction: Yu–Ye Tang (YYT) is a classical formula widely used in treatment of type 2 diabetes mellitus (T2DM). However, the specific mechanism of YYT in treating T2DM is not clear.
Methods: The aim of this study was to investigate the therapeutic effect of YYT on T2DM by establishing a rat model of T2DM. The mechanism of action of YYT was also explored through investigating gut microbiota and serum metabolites.
Results: The results indicated YYT had significant therapeutic effects on T2DM. Moreover, YYT could increase the abundance of Lactobacillus, Candidatus_Saccharimonas, UCG-005, Bacteroides and Blautia while decrease the abundance of and Allobaculum and Desulfovibrio in gut microbiota of T2DM rats. Nontargeted metabolomics analysis showed YYT treatment could regulate arachidonic acid metabolism, alanine, aspartate and glutamate metabolism, arginine and proline metabolism, glycerophospholipid metabolism, pentose and glucuronate interconversions, phenylalanine metabolism, steroid hormone biosynthesis, terpenoid backbone biosynthesis, tryptophan metabolism, and tyrosine metabolism in T2DM rats.
Discussion: In conclusion, our research showed that YYT has a wide range of therapeutic effects on T2DM rats, including antioxidative and anti-inflammatory effects. Furthermore, YYT corrected the altered gut microbiota and serum metabolites in T2DM rats. This study suggests that YYT may have a therapeutic impact on T2DM by regulating gut microbiota and modulating tryptophan and glycerophospholipid metabolism, which are potential key pathways in treating T2DM.
Introduction
Type 2 diabetes mellitus (T2DM) is a prevalent form of diabetes that affects more than 90% of individuals diagnosed with the diabetes (1). T2DM can occur at any age and has an insidious onset with no early manifestations. Therefore, it is necessary to have a well-planned and effective medication plan to achieve desirable glycemic regulation. If the blood glucose level is not controlled in a timely manner, the disease may affect several organs and cause complications, such as eye and foot problems, as the duration of the disease increases and reduce the patients’ quality of life (2). As a typical chronic disease, long-term medication is the most important means to control the blood glucose level. Despite the availability of a wide range of glucose-lowering drugs in clinical practice, only approximately 50% of patients with diabetes achieve their glycemic control goals. Therefore, effective prevention and treatment of T2DM has become the focus of social concern.
The gut microbiota creates a complex ecosystem in gastrointestinal tract that helps maintain the energy balance of the body and good health (3). An increasing number of studies have revealed significant role that gut microbiota plays in human health and its imbalances have relationships with various diseases, including diabetes, fatty liver, and obesity (4, 5). A previous study showed that fecal transplantation from patients with obesity into germ-free mice resulted in weight gain in mice (6). In addition, a study found the abundance of Akkermansia muciniphila was reduced in T2DM patients and was positively correlated with reduced insulin secretion (7). These results suggest that gut microbiota is important in T2DM progression by regulating metabolic processes. It is a novel idea for T2DM treatment through regulating gut microbiota.
Many natural compounds had been found to ameliorate diabetes through regulating the gut microbiota. Astragaloside IV, an active ingredient of Astragalus propinquus, increases the level of butyric acid in gut microbiota of T2DM mice and exerts therapeutic effects on T2DM by regulating AMPK/SIRT1 and PI3K/AKT signaling pathways (8). Pi–Dan–Jian–Qing decoction can ameliorate liver and kidney function and reduce inflammation and oxidative stress in T2DM rats, which may be associated with increasing abundance of probiotics at genus level (9). Gegen–Qinlian decoction showed to reduce blood glucose levels and protect islet function in rats with T2DM by altering the gut microbiota composition. Specifically, this effect is achieved by increasing the proportion of anti-inflammatory short-chain fatty acids producing bacteria and decreasing proportion of bacteria associated with a diabetic phenotype and potential pathogenic properties (10).
Yu–Ye Tang (YYT) is a classical decoction widely used to treat T2DM. It is consisted of Dioscorea oppositifolia L., Astragalus mongholicus Bunge, Anemarrhena asphodeloides Bunge, chicken’s gizzard membrane, Pueraria montana var. lobata, Schisandra chinensis, and Trichosanthes rosthornii. In vivo studies have shown that YYT could ameliorate liver and kidney injury in T2DM rats (11). Besides, accumulated studies have revealed potential mechanisms of active compounds in YYT. The main active component of Dioscorea oppositifolia L. includes allantoin, which has been demonstrated with protective effects on pancreas β-cells in metabolic dysfunction model (12). Allantoin can also improve nonalcoholic steatohepatitis disease by activating the SIRT1/Nrf2 pathway, increasing the activities of antioxidant enzymes, and reducing lipid peroxidation (13). Astragaloside is the main component of Astragalus mongholicus Bunge, and several studies have confirmed that astragaloside could reduce inflammation and oxidative stress in animal model of diabetes (14, 15). Timosaponin B-II is the main steroidal saponin component of Anemarrhena asphodeloides Bunge, which has shown with antioxidative and anti-inflammatory effects on hyperglycemia (16, 17). Puerarin, an isoflavone from Pueraria montana var. lobata, mainly acts on PI3K-Akt, tumor necrosis factor (TNF) and reactive oxygen species related pathways to exert anti-inflammatory and antioxidative effects (18–20). Schisandrin, isolated from Schisandra chinensis, has been shown to improve diabetes-related pathologies and has a wide range of effects in terms of antioxidant, anti-inflammation, and immune modulation (21, 22). However, specific mechanism of YYT in treating T2DM is not well understood. To better understand this, the present study established a T2DM rat model and used two approaches to study the effects of YYT on T2DM. First, we examined the therapeutic effects of YYT on T2DM. Second, we used 16s rRNA gene sequencing and nontargeted metabolomics to explore the mechanism by which YYT acts to treat T2DM.
Methods
YYT preparation
Mix 30 g of Dioscorea oppositifolia L., 15 g of Astragalus mongholicus Bunge, 18 g of Anemarrhena asphodeloides Bunge, 6 g of chicken’s gizzard membrane, 5 g of Pueraria montana var. lobata, 9 g of Schisandra chinensis, and 9g of Trichosanthes rosthornii. The ingredients were first pulverized and sieved, then mixed with water, soaked for 0.5 hours, and boiled for 2 hours. The mixture was then filtered, and the process was repeated with a second batch of water. The two decoctions were combined, and the solution was then concentrated to a concentration of 5 kg crude herb/L on a thermostatic water bath.
Reagents
Streptozotocin (STZ, S8050) was purchased from Solarbio Biotechnology (Beijing, China). Metformin (MET, S30880) was purchased from Yuanye Biotechnology (Shanghai, China). Biochemical test kits of total cholesterol (TC), triglyceride (TG), alanine aminotransferase (ALT), aspartate aminotransferase (AST), creatinine (Cr), blood urea nitrogen (BUN), superoxide dismutase (SOD), glutathione peroxidase (GSH-Px), and methane dicarboxylic aldehyde (MDA) were purchased from Nanjing Jiancheng Biological Engineering Institute (Nanjing, China). Enzyme-linked immunosorbent assay (ELISA) kits for insulin (mlE2721), interleukin (IL)-1β, IL-6, and TNF-α were purchased from Shanghai Enzyme-linked Biotechnology (Shanghai, China).
Animals
Sixty SPF-grade healthy male SD rats (180–220 g) were purchased from HFK Bio-Technology and housed in ventilated environment (20°C–26°C, 50%–60% relative humidity) with ad libitum. The experiment was approved by the Ethics Committee of Cangzhou Integrated Traditional Chinese and Western Medicine Hospital (No. CZX2021-KY-026).
Generation of T2DM rat model
A high-sugar, high-fat diet (HSHFD, 42.3% of carbohydrate, 17% of protein, 22.5% of fat, 3.2% of fiber, 5% of minerals, 10% of moisture) was administered for 8 weeks. Subsequently, 30 mg/kg of STZ was injected intraperitoneally after 12 h of fasting food. Meanwhile, rats in control group received normal diet (60% of carbohydrate, 16% of protein, 3% of fat, 4% of fiber, 5% of minerals, 12% of moisture) and vehicle. Seventy-two hours after the injection, randomly blood glucose was measured, and the level of blood glucose ≥16.7 mmol/L was considered as the T2DM model generation criteria.
Animal experiment
The rats were acclimatized for 1 week, and then divided into the control group, model group, metformin (MET) group, YYT low-dose (YYT-L) group, YYT medium-dose (YYT-M) group, and YYT high-dose (YYT-H) group randomly. After modeling, the MET group was intragastrically administered with MET 0.2 g/kg/d, and the YYT-L, YYT-M and YYT-H groups were intragastrically administered with YYT 4.1g/kg/d, 8.2g/kg/d, and 16.4g/kg/d. The control and model groups were intragastrically administered with 0.5 mL/d of vehicle. All groups were treated for 4 consecutive weeks, and fasting blood glucose (FBG) of each rat was measured weekly. All therapeutic doses were calculated using the pharmacological body surface area method. The doses of YYT-M and MET groups corresponded to the equivalent dose for 70 kg adult humans, while the doses of YYT-L and YYT-H groups represented 0.5-fold and 2-fold M-HDP group doses, respectively.
After a 4-week treatment period, an oral glucose tolerance test (OGTT) was carried out. The rats were then fasted for 12 hours and anesthetized. Blood was taken from the abdominal aorta, and the rats were then euthanized. Tissues from the liver, pancreas, and kidney were collected and preserved in 4% paraformaldehyde. Feces was also collected from the cecum (Figure 1).
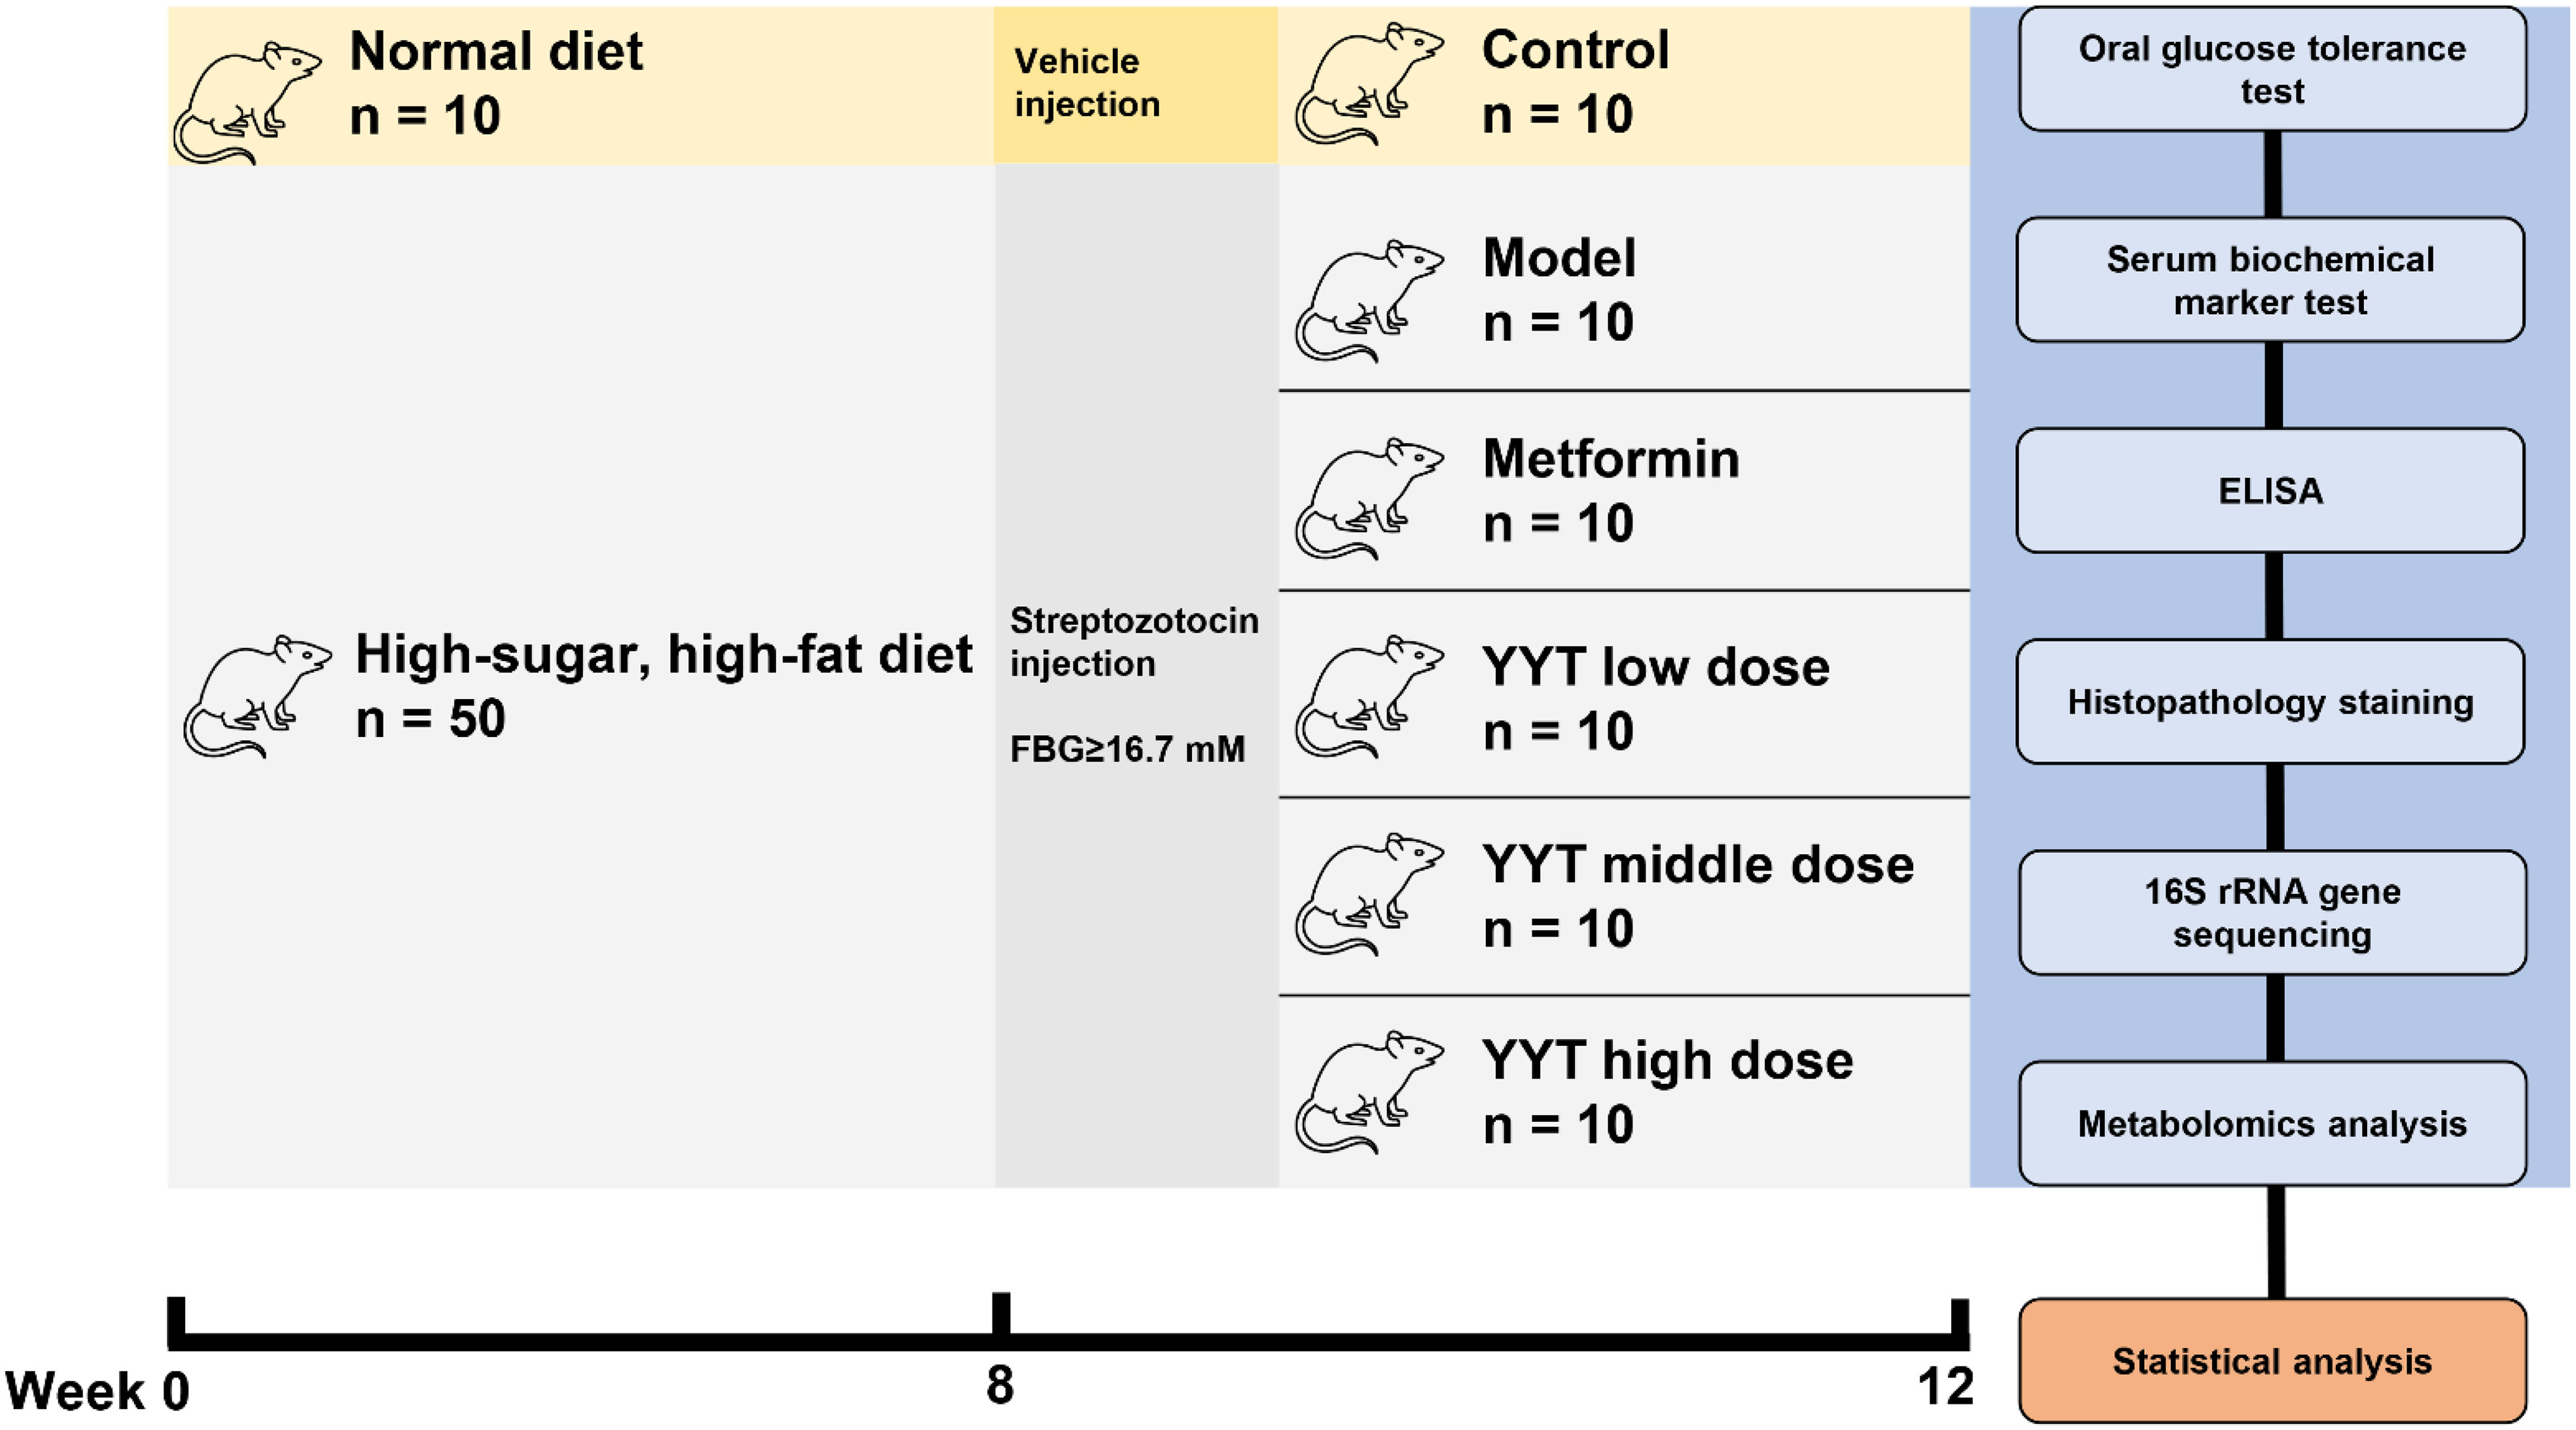
Figure 1 Schematic diagram.
OGTT
First, the rats were fasted without water for 12 hours. Blood glucose levels were measured using glucose testing strips. These levels were recorded as the 0-minute blood glucose values. Next, a 50% glucose solution (2 g/kg) was given intragastrically, and the blood glucose levels were measured at 15, 30, 60, and 120 minutes after administration. The results were recorded. The data collected from the OGTT was plotted on a blood glucose-time curve, and the area under the curve (AUC) was calculated.
Serum biochemical marker test
The blood collected from abdominal aorta was centrifuged (3,000 rpm, 10 min), and the serum was collected. Assay kits were used to detect the levels of TG, TC, ALT, AST, C, BUN, and MDA. Serum SOD, GSH-PX activities were also tested. All protocols were carried out according to the instructions provided by the manufacturer.
ELISA
Serum levels of fasting insulin (FINS), IL-6, IL-1β, and TNF-α were measured using ELISA, which was performed based on manufacturers’ instructions. The homeostatic model assessment for insulin resistance (HOMA-IR) was calculated with formula: HOMA-IR = (FBG × FINS)/22.5.
Histopathology staining
The liver, pancreas, and kidney that had been fixed were processed by being dehydrated and embedded in paraffin. Afterwards, 5 micrometer thick sections were cut from the paraffin blocks. After deparaffinization, routine hematoxylin and eosin (HE) staining was performed, and histopathological changes were observed under a light microscope. Histopathogical changes in liver, kidney, and pancreas were assessed and scored as previous described (23–25). For liver injury scoring, the degree was assessed as follows: 0 (normal); 1 (development of a sinusoidal congestion space); 2–3 (the presence and/or severity of sinusoidal congestion and cytoplasmic vacuolization); and 4 (necrosis of parenchymal cells and hemorrhage). For kidney injury scoring, the degree was assessed by the area of pathological change area as follows: 0 (none), 1 (≤ 10%), 2 (11-25%), 3 (26-45%), 4 (46-75%), and 5 (≥ 76%). For pancreas injury scoring, the area of pancreas occupied by the islets of Langerhans were evaluated.
16S rRNA gene sequencing
Two hundred mg of fecal samples were weighed and the genomic DNA of each sample was extracted using the cetyltrimethylammonium bromide method. The quality and concentration of the extracted genomic DNA was examined. The quality was assessed using 1% agarose gel electrophoresis and the concentration was measured. The DNA was then diluted to a final concentration of 1 ng/µL. The detailed protocols of polymerase chain reaction amplification, sequencing data processing and analysis were involved in Supplementary Material.
Metabolomics analysis
The serum sample was prepared as follows: 100 μL of serum was mixed with 400 μL of 80% methanol, vortexed, shaken, and chilled. The mixture was then centrifuged at 4°C (15,000 g, 20 min). The supernatant was diluted with ultrapure water to 53% methanol and centrifuged again at 4°C (15,000 g, 20 min). The resulting supernatant was collected and used as the sample for testing. Detailed protocols of quality control, liquid chromatography–mass spectrometry, and data processing and analysis were involved in Supplementary Material.
Statistical analysis
Statistical analysis was performed using SPSS software. The experimental data were expressed as mean ± standard deviation (SD), and one-way analysis of variance with Tukey’s honestly significant difference test was used. Spearman’s correlation analysis was used to evaluate the correlation of therapeutic indicators and changed gut microbiota. A difference with p < 0.05 was considered to be statistically significant. The graphs were developed by GraphPad Prism 9.
Results
Therapeutic effect of YYT on T2DM rats
The changes in FBG level of rats in each group were observed weekly from the beginning of drug administration. The FBG levels were elevated in model group compared with control group, and the level was reduced in the MET, YYT-L, YYT-M, and YYT-H groups after 2, 3, and 4 weeks of drug administration compared with the model group (Figure 2A) After the treatment, serum levels of TC, TG, AST, ALT, Cr, and BUN were increased in T2DM rats compared with those in control group. Compared with the model group, TC, TG, AST, ALT, Cr, and BUN levels were decreased in MET, YYT-L, YYT-M, and YYT-H groups, which suggesting that YYT has a positive effect on blood lipids, liver function, and kidney function in T2DM rats (Figures 2B–G).
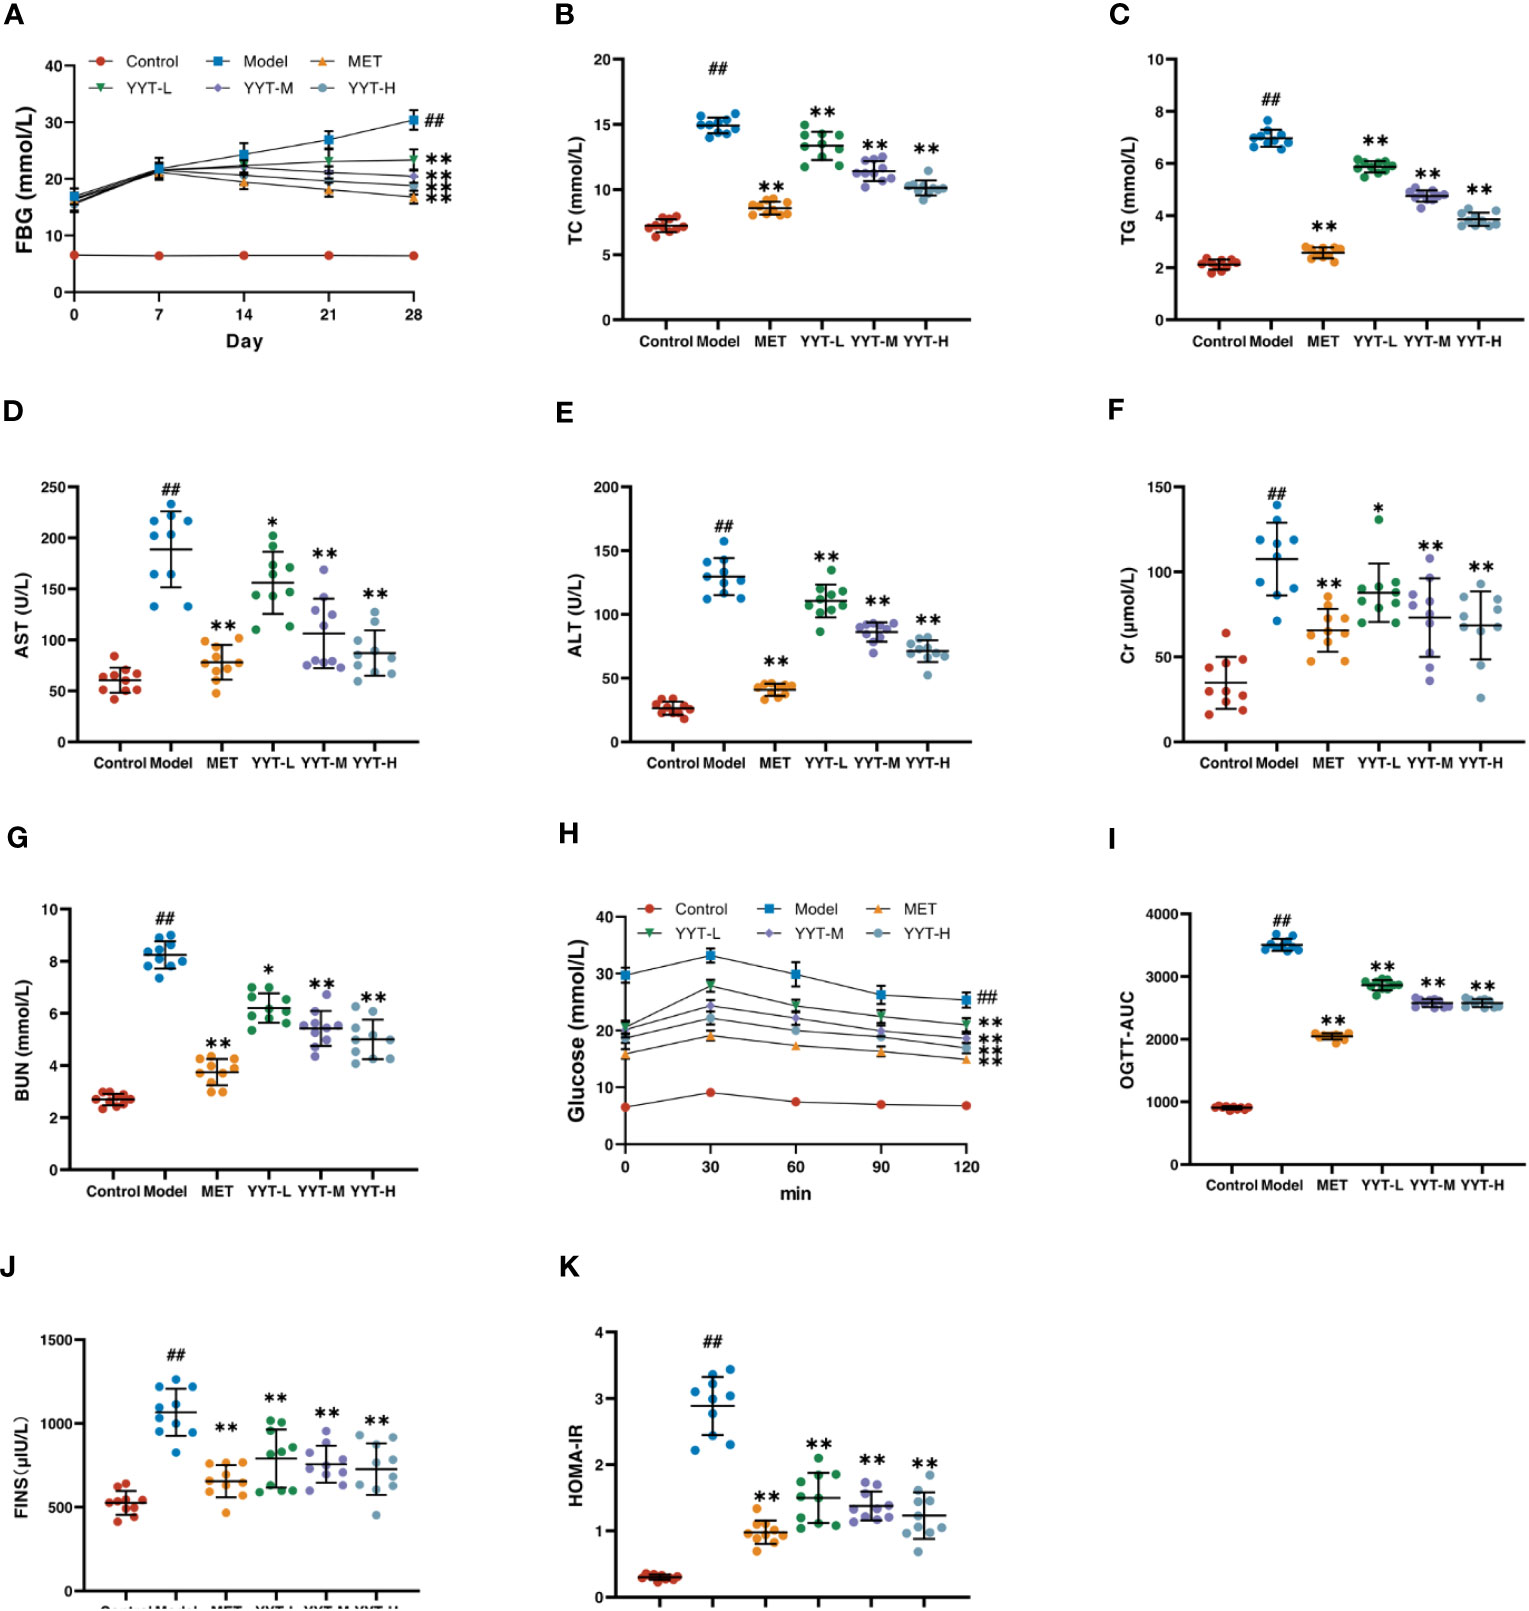
Figure 2 YYT had therapeutic effects on model rats. (A) FBG was controlled after YYT treatment. (B–G) The elevated physiological indices of blood lipid, liver and kidney functions were improved after YYT treatment. (H, I) OGTT showed the impaired glucose tolerance was ameliorated after YYT treatment. (J, K) FINS and HOMA-IR showed YYT could reduce the increased IR. Control, model, MET, YYT-L, YYT-M and YYT-H (n = 10 per group) groups. ##: p < 0.01 vs. control group. *: p < 0.05 and **: p < 0.01 vs. model group.
OGTT was performed for all rats after the treatment. The results showed that in all groups, blood glucose levels peaked at 30 minutes after oral glucose administration, before gradually declining. At 120 minutes after administration, the OGTT and OGTT-AUC were higher in model group compared to control group. However, OGTT and OGTT-AUC were reduced in the MET, YYT-L, YYT-M, and YYT-H groups when compared to model group (Figures 2H, I). Furthermore, the results showed a significant increase in FINS and HOMA-IR levels in model group compared to control group, indicating presence of insulin resistance (IR) in T2DM rats. Conversely, the MET, YYT-L, YYT-M, and YYT-H groups had significantly reduced FINS and HOMA-IR levels compared to model group (Figures 2J, K). These results suggest that YYT can reduce the level of IR in T2DM rats.
HE staining of liver showed that the hepatic cords in control group were neatly arranged, with no significant inflammatory cell infiltration and hepatocyte vacuolation and steatosis. On the contrary, the hepatic cords of rats in model group were disordered, with more inflammatory cell infiltration and a large number of hepatocytes vacuolation and steatosis. The hepatic cords of each treatment group were neatly arranged after treatment, with a small amount of inflammatory cell infiltration and scattered hepatocyte vacuolation and steatosis seen. HE staining results of kidney showed that glomerular structure was clear and intact in the control group, with no increase in the mesangial matrix and no inflammatory cell infiltration. The results showed that compared to control group, the glomeruli in model group were significantly hypertrophic, with increased mesangial matrix, vacuolated tubular epithelial cells, and interstitial infiltration with inflammatory cells. However, the kidney of rats in each intervention group exhibited varying degrees of improvement in the above pathology compared with model group. Mild glomerular mesangial hyperplasia was noted, the renal tubular structure was nearly normal, and not much inflammatory cell infiltration was seen in the interstitium. HE staining of pancreatic tissues showed that the islets of rats in the control group had regular structure, clear edges, abundant cells, uniform size, saturated morphology, and tight arrangement. Moreover, no vacuoles or significant pathological changes were found. In the model group, the islets of rats had irregular morphology, blurred borders, disorganized structure, and deformed cells. Compared with T2DM rats, number of cells in islets of rats in each treatment group increased significantly, with regular structure and no significant necrosis. The islets had clear borders and improved morphology and structure (Figure 3A). Likewise, quantitative analysis of pathological results indicated that YYT treatment lowered the pathological scores of liver, kidney and pancreas (Figures 3B–D).
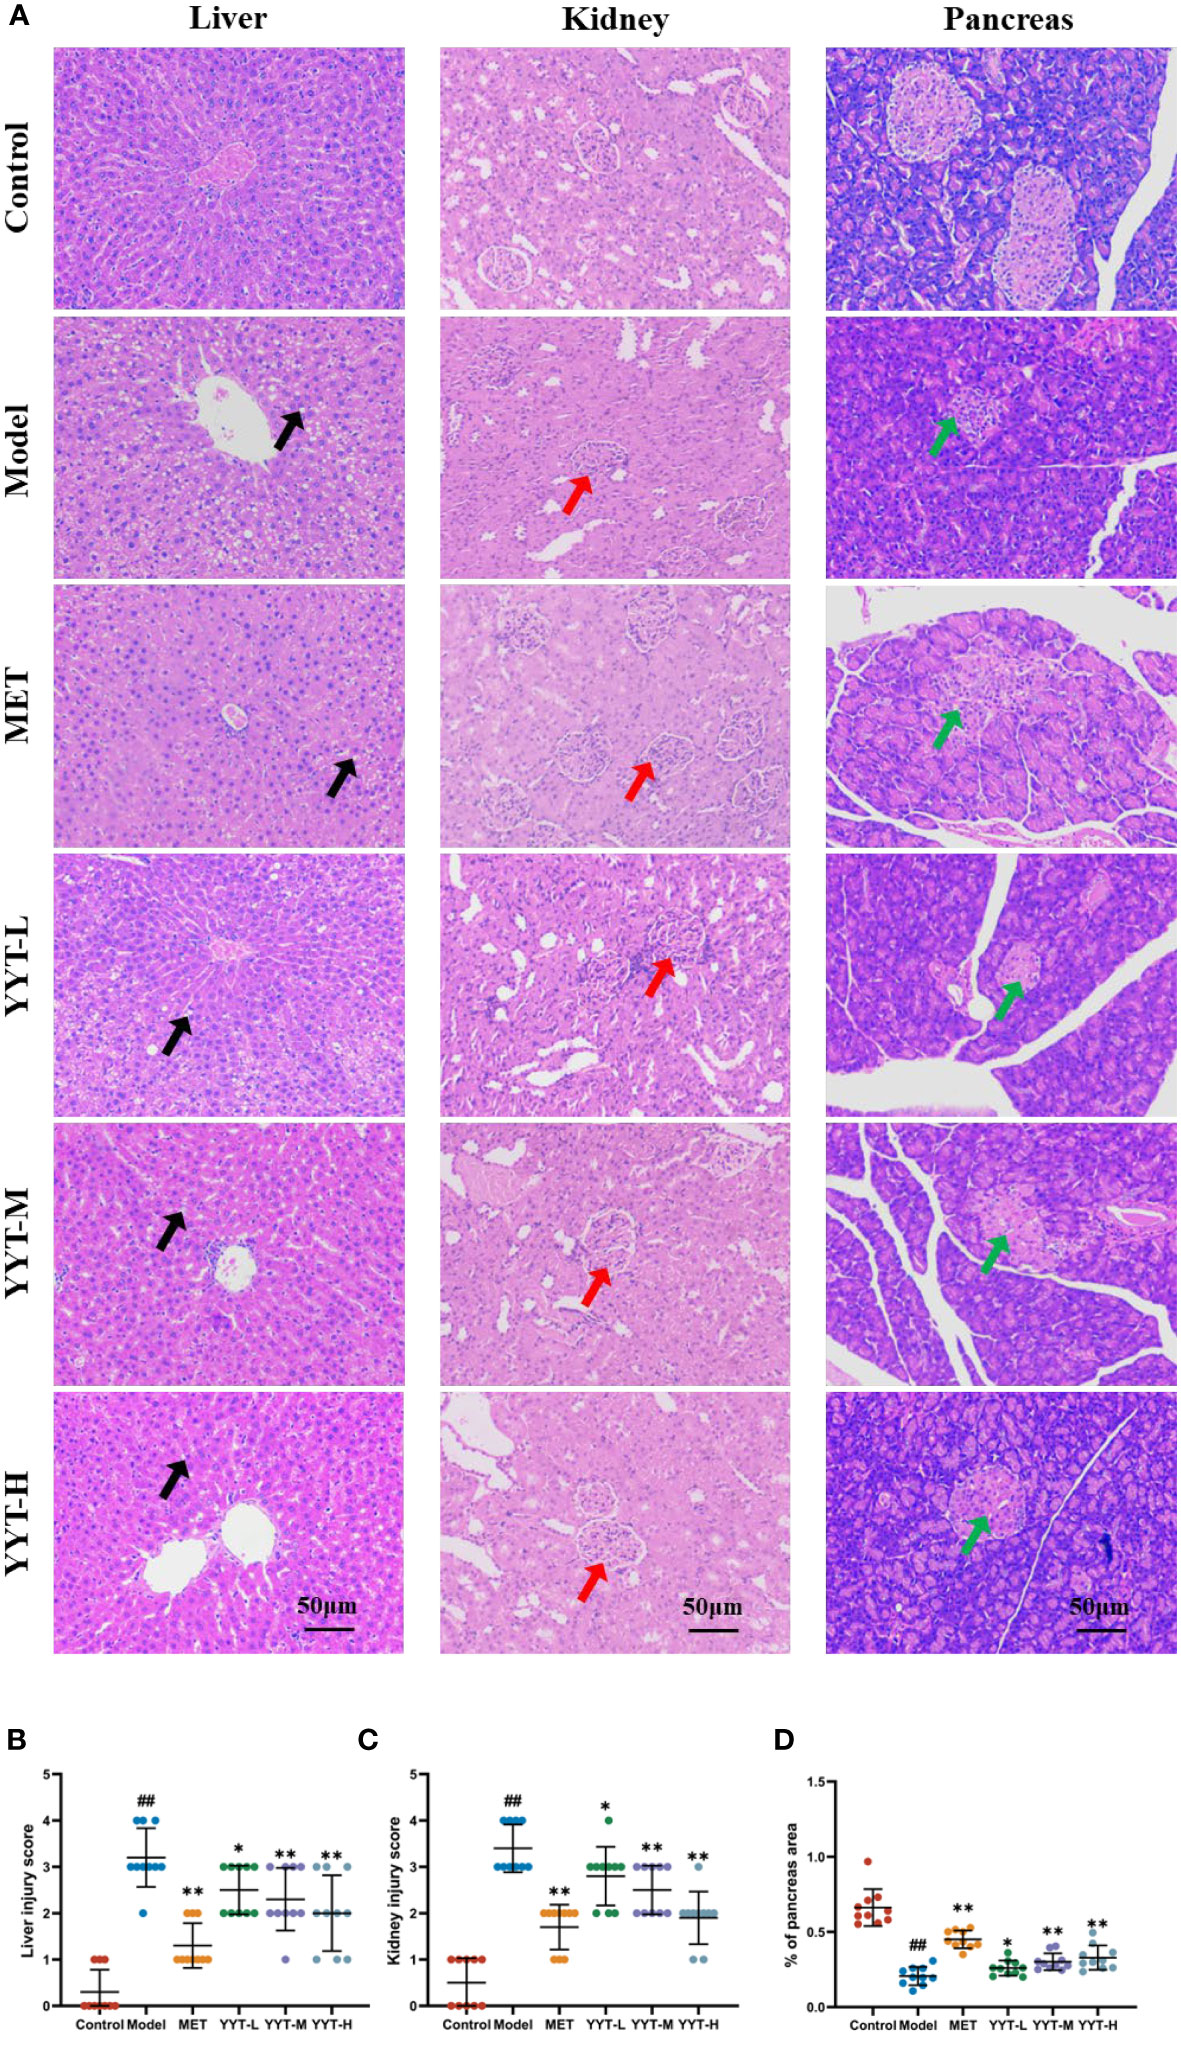
Figure 3 (A) HE staining showed that the pathological changes in the damaged liver, kidney, and pancreas of T2DM rats were improved after receiving YYT treatment. (B–D) The histopathogical quantification results also showed the treatment of YYT could ameliorate the injury in liver, kidney, and pancreas. The black arrow indicated hepatocyte vacuolation and steatosis. The red arrow indicated damaged glomerular. The green arrow indicated islets with irregular morphology, blurred borders, and disorganized structure. ##: p < 0.01 vs. control group. *: p < 0.05 and **: p < 0.01 vs. model group.
Antioxidative and anti-inflammatory effects of YYT on T2DM rats
The T2DM rats showed significant decreases in activities of SOD and GSH-PX and an increase in MDA concentration in serum compared to control group, indicating that T2DM caused oxidative stress damage to the rats. In contrast, the rats in the MET, YYT-L, YYT-M, and YYT-H groups showed increases in activities of SOD and GSH-PX and decreases in MDA concentration compared to T2DM model group (Figures 4A–C). This result shows that YYT treatment significantly reduces oxidative stress injury in T2DM rats.
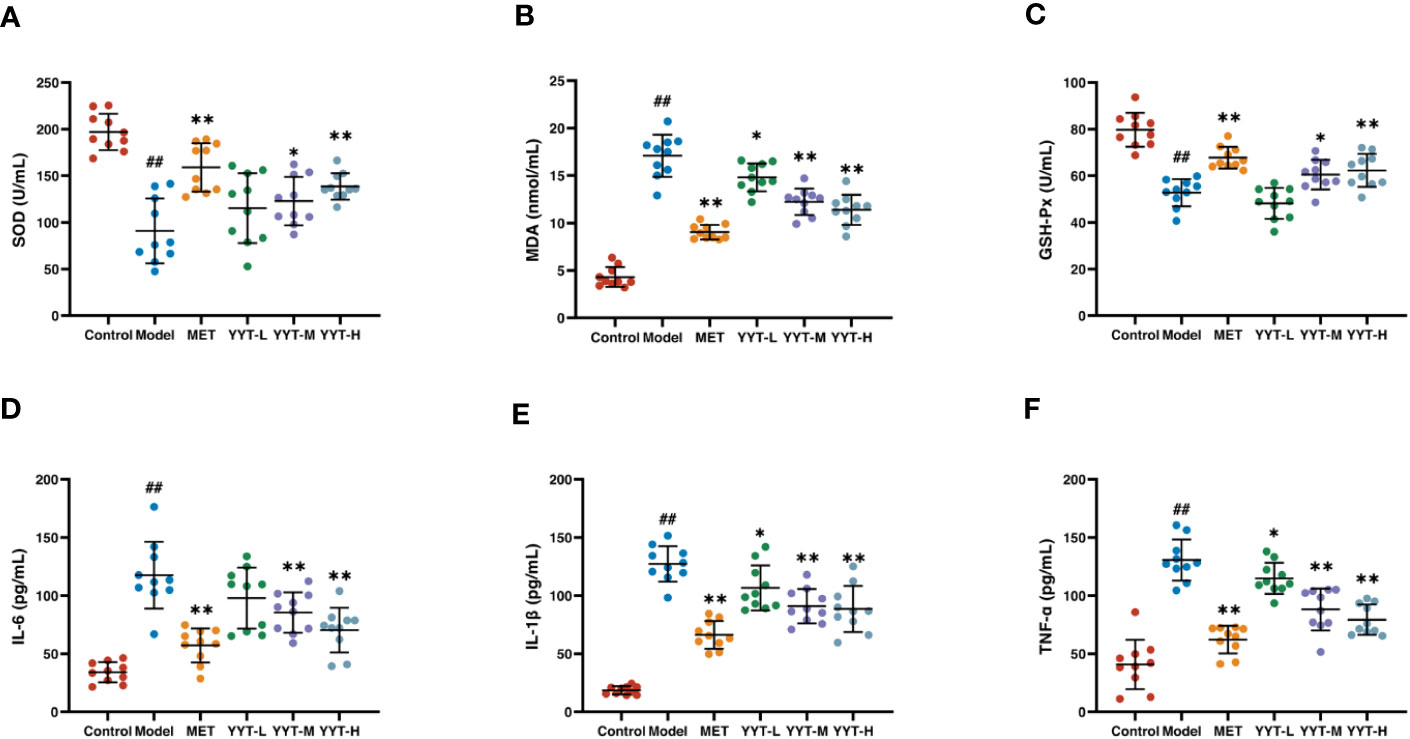
Figure 4 YYT treatment had antioxidative and anti-inflammatory effects on T2DM rats. (A–C) YYT could increase the lowered activities SOD and GSH-Px while decrease the level of MDA in serum of T2DM rats. (D–F) The elevated serum levels of pro-inflammatory cytokines (IL-6, IL-1β, TNF-α) in T2DM rats could be ameliorated by YYT. Control, model, MET, YYT-L, YYT-M and YYT-H (n = 10 per group) groups. ##: p < 0.01 vs. control group. *: p < 0.05 and **: p < 0.01 vs. model group.
ELISA results indicated that, in comparison to control group, levels of IL-6, IL-1β, and TNF-α were significantly elevated in model group, which suggests that T2DM leads to an increase in pro-inflammatory cytokines. However, when compared to model group, levels of all 3 cytokines were significantly decreased in the MET, YYT-L, YYT-M, and YYT-H groups, indicating that the administration of the herbal decoction was effective in reducing the levels of pro-inflammatory cytokines in T2DM rats (Figures 4D–F).
The above results revealed that YYT-H has significant therapeutic effects on T2DM rats. Therefore, 16S rRNA gene sequencing and metabolomic studies were performed in control, model, and YYT-H groups.
Effect of YYT on the gut microbiota of T2DM rats
The α diversity analysis was performed to evaluate the species diversity of the gut microbiota in each group. The analysis was based on the Shannon and Simpson indexes, which provide insight into the richness and evenness of species in a sample. Results showed that compared to control group, both indexes were reduced in model group, indicating a decrease in species diversity. However, when comparing model group to YYT-H group, both indexes increased, suggesting that YYT-H had the ability to enhance the richness and evenness of gut microbiota in rats (Figures 5A, B). The β-diversity analysis in this study was performed to compare the microbial community structure between different samples. The principal co-ordinates analysis (PCoA) method was used to assess the similarity or difference in community composition. Figure 5C shows that samples from different treatments are represented by different colors or dots. The closer the distance between two sample dots, the greater the similarity in their microbial composition. The gut microbiota in the control and model groups were separated, indicating significant changes in the gut microbiome of the T2DM rat model. After YYT-H intervention, the gut microbiota appeared to shift closer to the control group, suggesting that YYT-H had a regulatory effect on the community structure of the gut microbiome in rats.
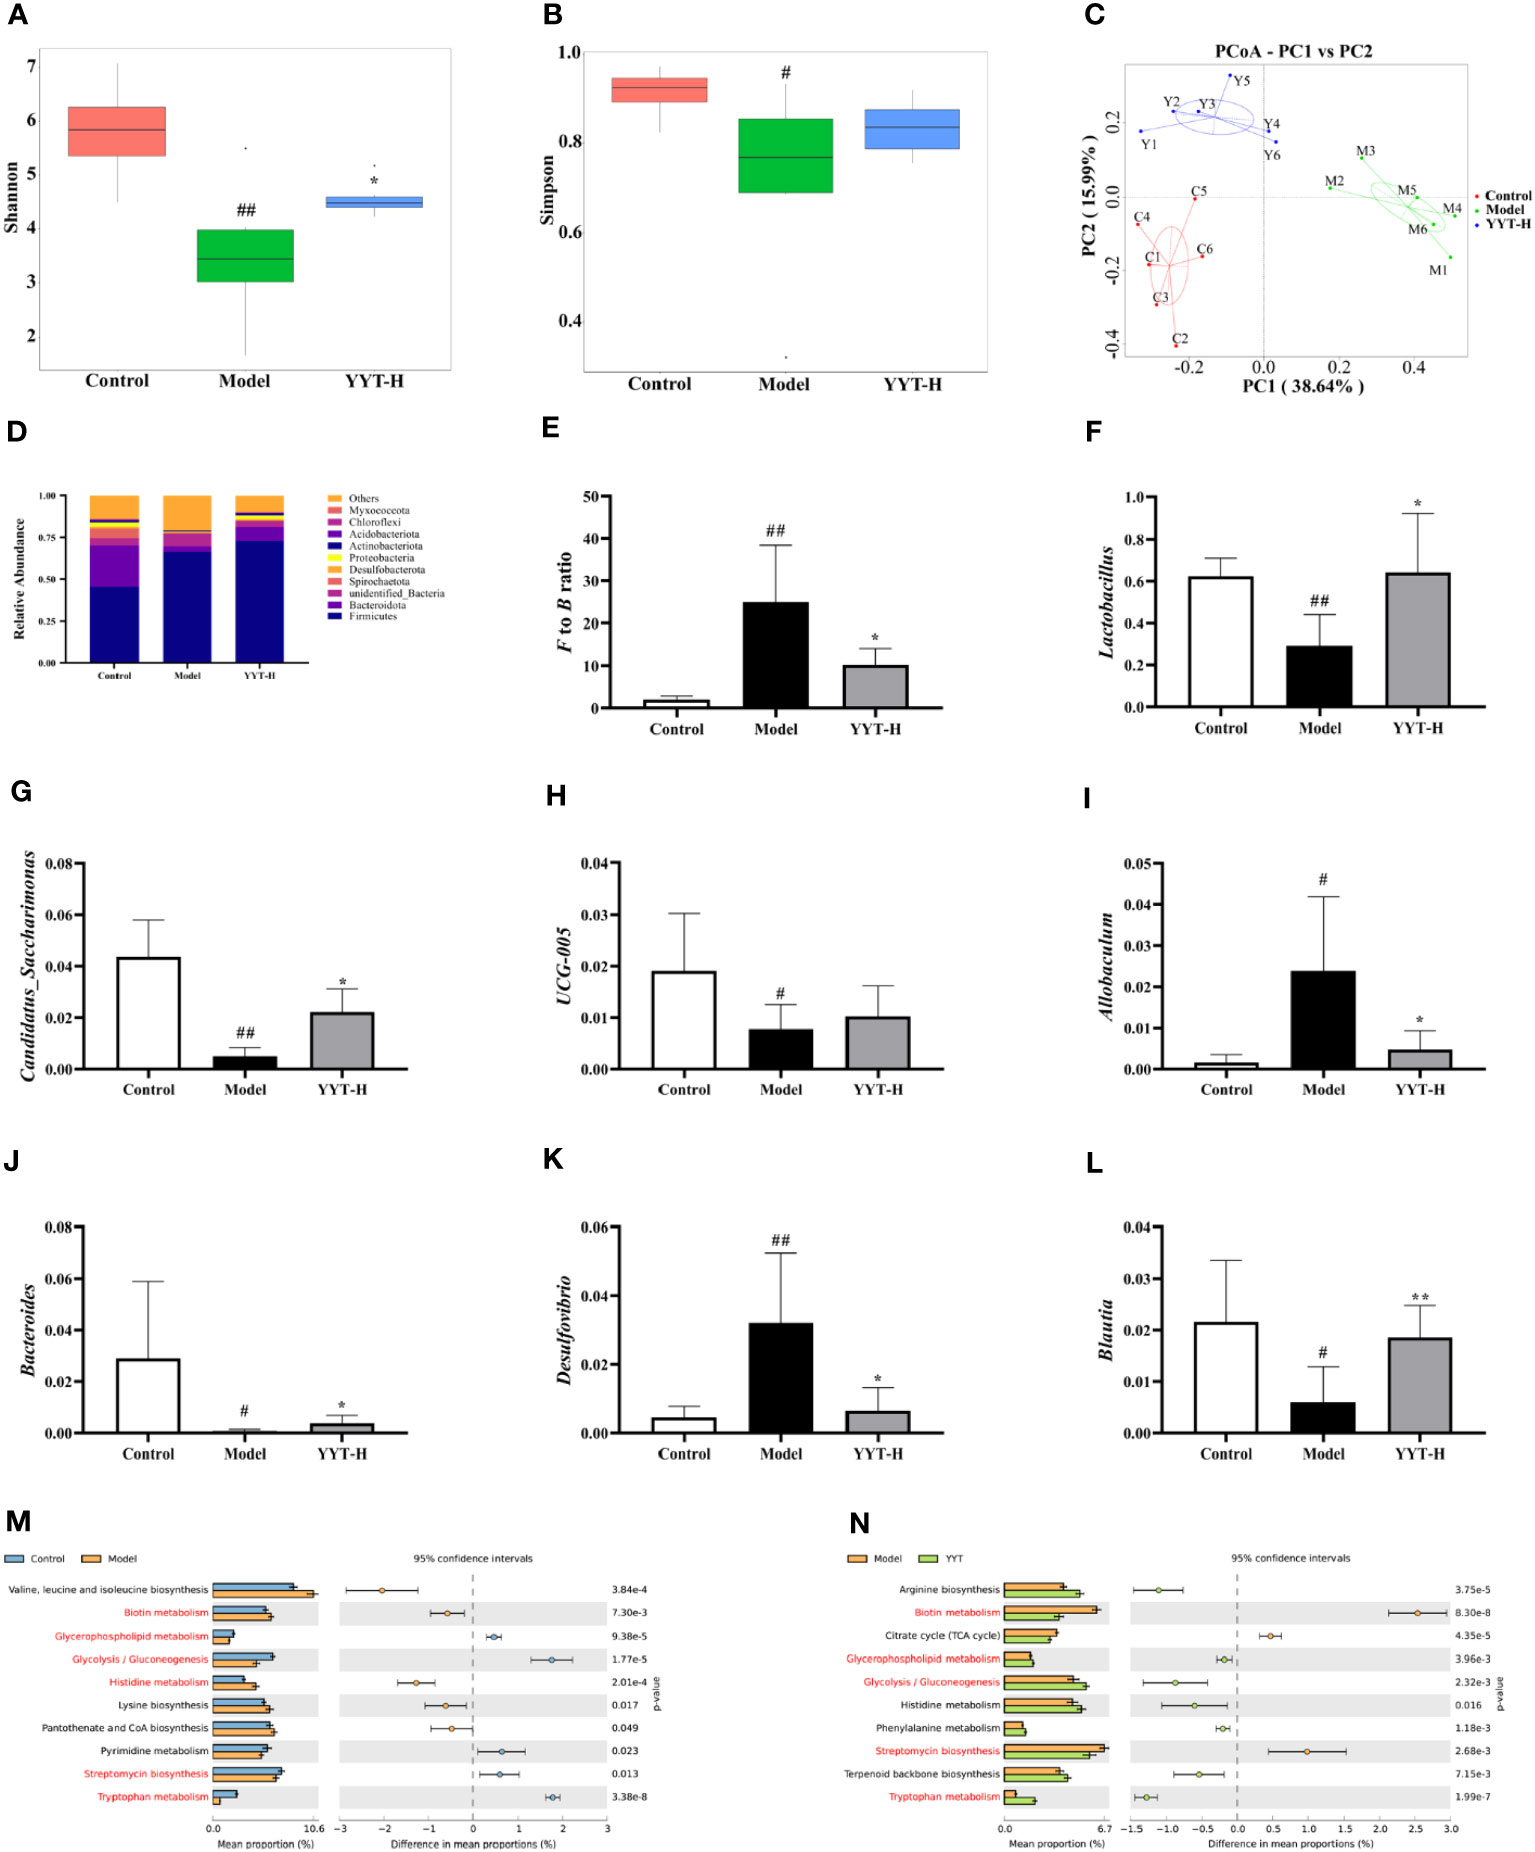
Figure 5 YYT modulates gut microbiota in rats altered by T2DM (A, B) YYT treatment decreased Shannon and Simpson indexes in T2DM rats. (C) Score plot of PCoA showed diversity of gut microbiota in each group. (D–F) Gut microbiota at phylum level was dominated by Firmicutes and Bacteroidota and the F/B ratio was decreased in T2DM rats after YYT treatment. (F–L) Relative abundances of Lactobacillus, Candidatus_Saccharimonas, UCG-005, Allobaculum, Bacteroides, Desulfovibrio and Blautia were mostly affected in T2DM rats or after YYT treatment. (M, N) PICRUSt analysis based on the results of genus levels of gut microbiota. Common pathways between two comparisons were marked in red. Control, model, and YYT-H (n = 6 per group) groups. #: p < 0.05 and ##: p < 0.01 vs. control group. *: p < 0.05 and **: p < 0.01, vs. model group.
The analysis of gut microbiota composition showed that rat gut microbiota at phylum level was dominated by Firmicutes and Bacteroidota (Figure 5D). The results showed that the Firmicutes/Bacteroidota (F/B) ratio was significantly higher in model group compared to control group. After treatment with YYT-H, the ratio decreased, suggesting a modulating effect of YYT-H on the gut microbiota composition (Figure 5E). Lactobacillus, Candidatus_Saccharimonas, UCG-005, Allobaculum, Bacteroides, Desulfovibrio, and Blautia were the dominant genera of rat gut microbiota in each group. Compared with control group, Allobaculum and Desulfovibrio were increased and Lactobacillus, Candidatus_Saccharimonas, Bacteroides, and Blautia were significantly decreased in model group. Compared with model group, Lactobacillus, Candidatus_Saccharimonas, UCG-005, Bacteroides and Blautia were increased and Allobaculum and Desulfovibrio were significantly decreased after YYT treatment (Figures 5F–L).
Analysis of gut microbiota function through PICRUSt using genus levels of gut microbiota showed differences among control, model, and YYT-H groups. The top 10 metabolic pathways showed differences between the groups are presented in Figures 5M, N. The results indicate that YYT-H intervention had an impact on the metabolic processes in T2DM rats.
Effect of YYT on serum metabolites in T2DM rats
The results of the principal components analysis (PCA) on the serum metabolites of control, model and YYT-H groups are shown in Figure 6A. The score plot indicates that the serum metabolic profile of T2DM rats was altered compared to control group, as evidenced by the clear separation in the two-dimensional space. Additionally, the score plot for the model group and YYT-H group shows that the serum metabolic profile of the YYT-H group was also altered, as demonstrated by a clear separation in the two-dimensional space. Additionally, YYT-H group was closer to control group than model group, indicating that YYT could ameliorate the altered serum metabolites caused by T2DM. A partial least squares-discriminant analysis (PLS-DA) model was developed to further evaluate the explanation and prediction capability of the serum samples. This model was designed to produce better separation and reduce any confounding factors (Figures 6B–E). The results showed that the serum metabolic profiles had good separation between control and model groups, as well as between model and YYT-H groups. The coefficient of determination (R2Y) was 0.99 and the goodness-of-fit (Q2Y) was 0.89 for the comparison between control and model groups, and R2Y was 0.99 and Q2Y was 0.92 for the comparison between model and YYT-H groups, indicating that the model had a high explanatory power. To ensure that the model wasn’t overfitting, a cross-validation experiment was performed, and the results showed that the goodness-of-fit was negative, suggesting that the model had a good predictive power.
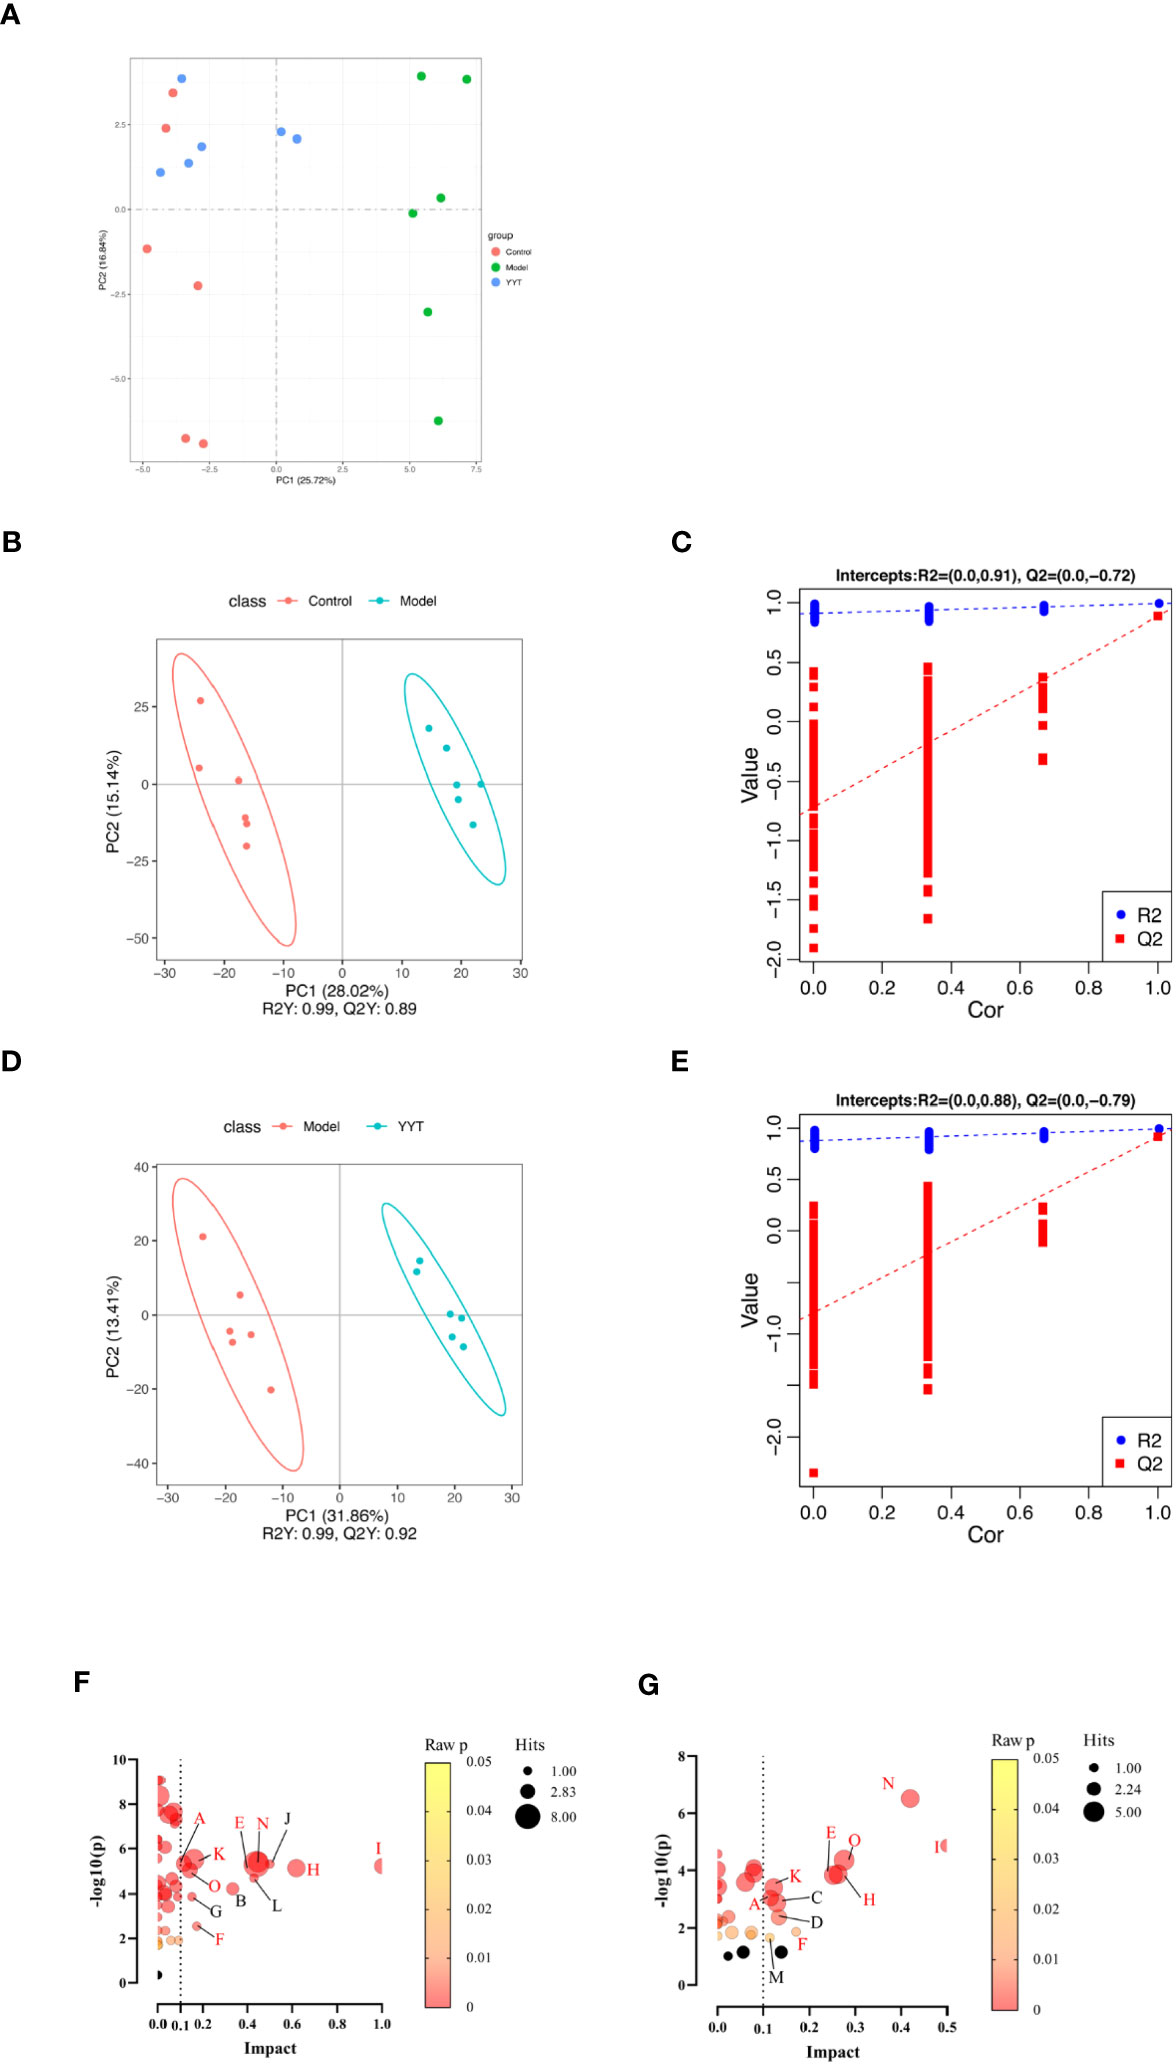
Figure 6 Changes in serum metabolites of T2DM rats after YYT treatment. (A) PCA score showed that there was a clear separation between control and model groups and between model and YYT groups. (B–E) Scores plots of PLS-DA and corresponding coefficient of loading plots. (F, G) Name of pathway. a: Alanine, aspartate and glutamate metabolism, b: alpha-Linolenic acid metabolism, c: Arachidonic acid metabolism, d: Arginine and proline metabolism, e: Glycerophospholipid metabolism, f: Pentose and glucuronate interconversions, g: Pentose phosphate pathway, h: Phenylalanine metabolism, i: Phenylalanine, tyrosine and tryptophan biosynthesis, j: Riboflavin metabolism, k: Steroid hormone biosynthesis, l: Taurine and hypotaurine metabolism, m: Terpenoid backbone biosynthesis, n: Tryptophan metabolism, o: Tyrosine metabolism. Black bubbles mean p ≥ 0.05. The common pathways between two comparisons were written in red. Control, model, and YYT-H (n = 6 per group) groups.
The following three criteria were used to screen for differential metabolites: fold change >1.2, p < 0.05 and variable importance in projection (VIP) > 1.0. The differential metabolites were then screened by KEGG pathway analysis and a total of 67 differential metabolites related with metabolic pathways were obtained from the screening (Table 1). Differential pathways were screened according to impact value > 0.1 and p < 0.05. The screened pathways between control and model groups included alanine, aspartate and glutamate metabolism, alpha-Linolenic acid metabolism, glycerophospholipid metabolism, pentose phosphate pathway, pentose and glucuronate interconversions, phenylalanine, tyrosine and tryptophan biosynthesis, phenylalanine metabolism, riboflavin metabolism, steroid hormone biosynthesis, taurine and hypotaurine metabolism, tryptophan metabolism, and tyrosine metabolism (Figure 6F). Between model and YYT groups, alanine, aspartate and glutamate metabolism, arginine and proline metabolism, arachidonic acid metabolism, glycerophospholipid metabolism, pentose and glucuronate interconversions, phenylalanine metabolism, steroid hormone biosynthesis, terpenoid backbone biosynthesis, tryptophan metabolism, and tyrosine metabolism were the differential pathways (Figure 6G). Among these, tryptophan metabolism and glycerophospholipid metabolism were the common pathways between the prediction of PICRUSt analysis and pathway analysis of nontargeted metabolomics.
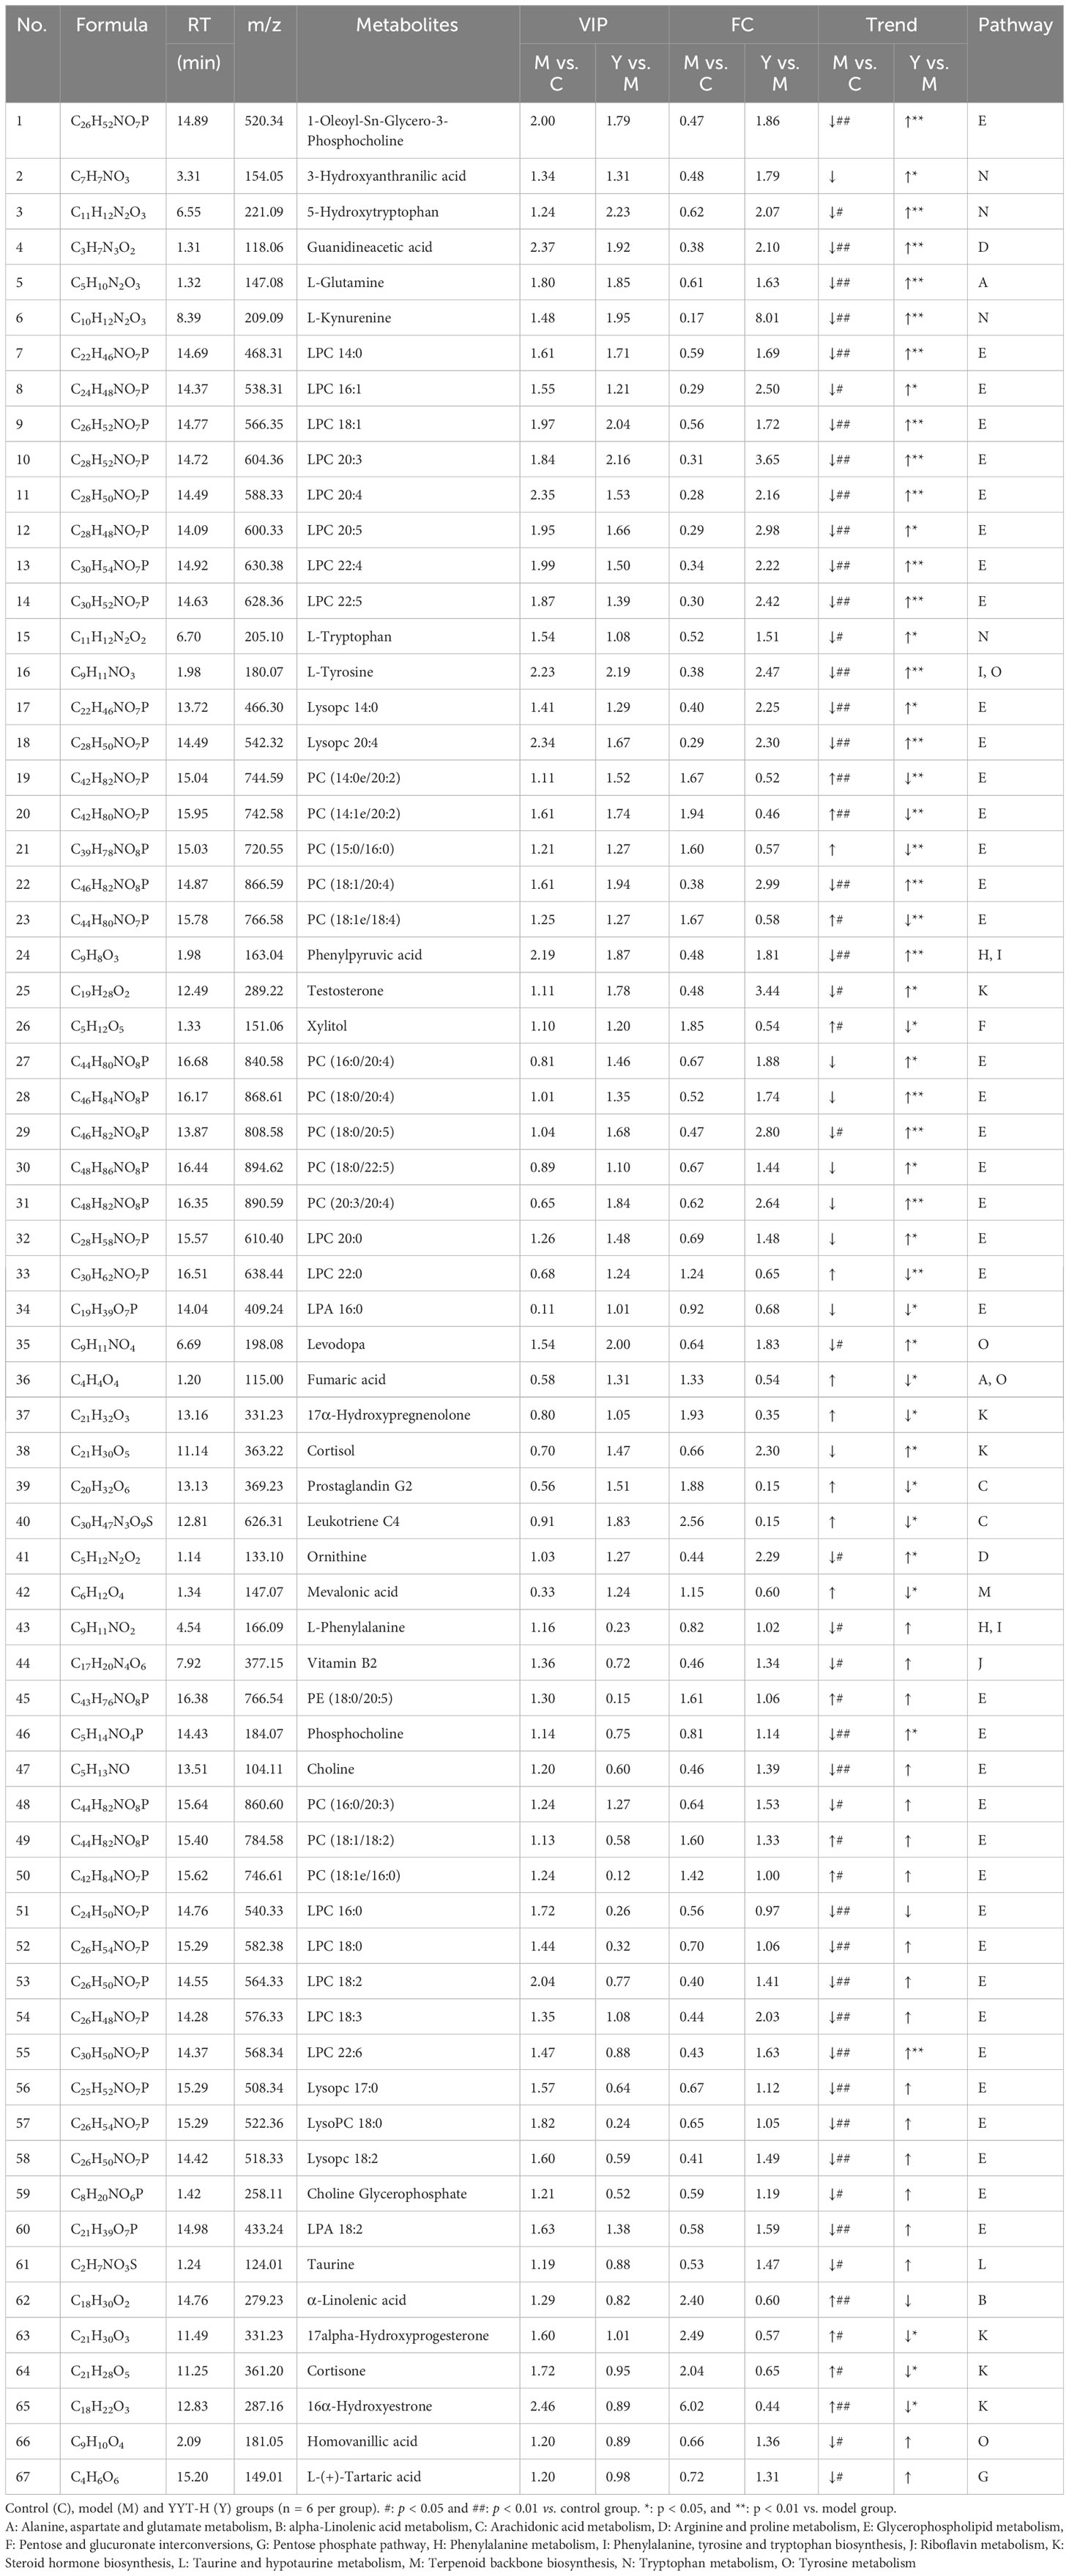
Table 1 The differential metabolites in serum related with pathways.
The correlation analysis showed that Lactobacillus, Candidatus_Saccharimonas, UCG-005, Bacteroides, and Blautia were negatively correlated with most therapeutic indicators while Allobaculum and Desulfovibrio showed positive correlation with most of the therapeutic indicators (Figure 7). Additionally, Candidatus_Saccharimonas and Blautia were positive with most differential metabolites while Allobaculum and Desulfovibrio were negative with most differential metabolites.
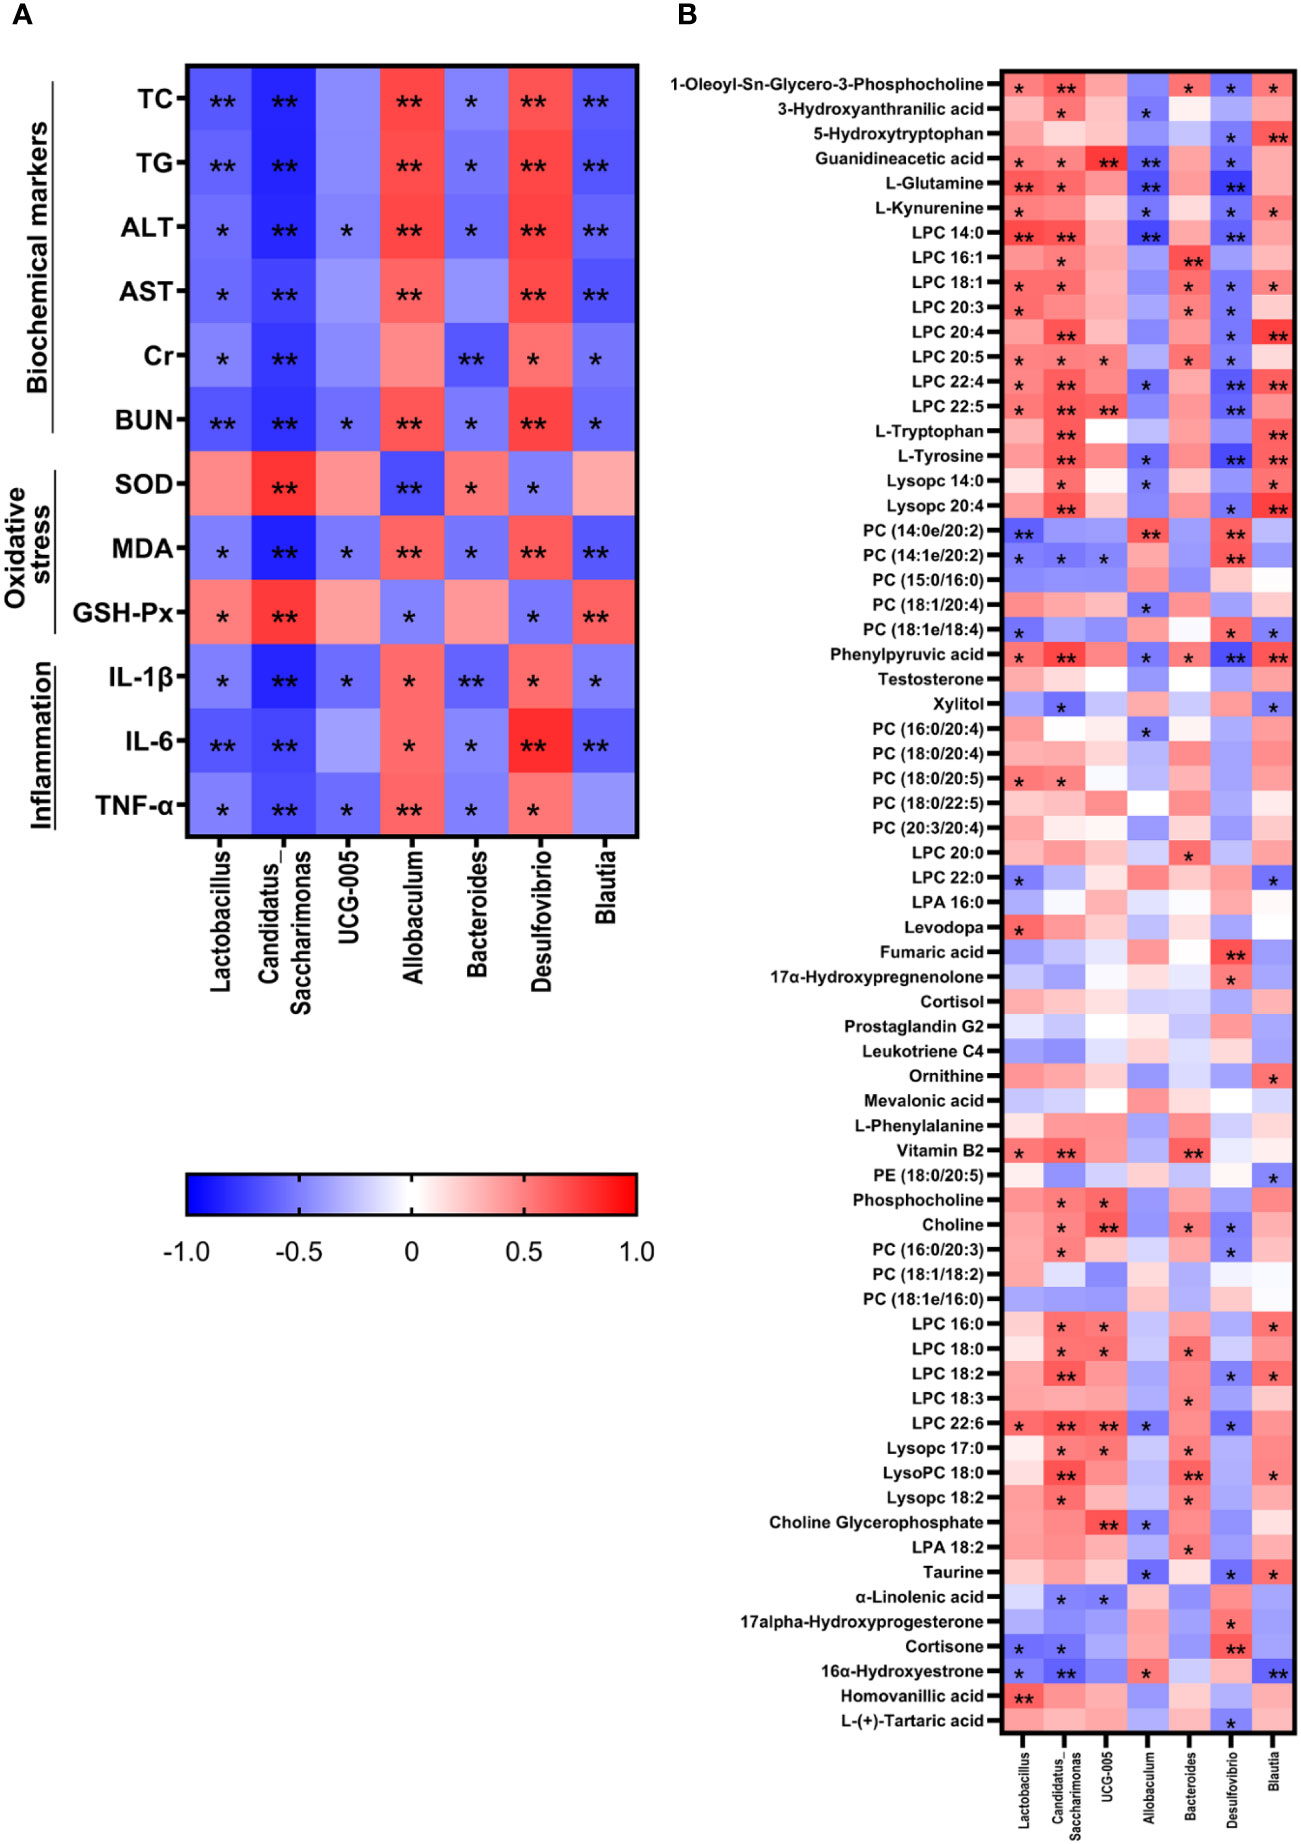
Figure 7 Correlation analysis between therapeutic indicators (A) and altered gut microbiota (B) was performed using Spearman's analysis and visualized as a heatmap. The color-coding scale in the heatmap represents the Pearson correlation coefficient, where deeper red or blue shades indicate higher absolute values of the coefficient. *: P < 0.05, **: P < 0.01.
Discussion
In this study, we used HSHFD combined with STZ injection to construct the T2DM rat model. This method is commonly used to induce T2DM in rats. HSHFD could cause IR and small dose (30mg/kg) of STZ injection (normally more than 100mg/kg of STZ was used to induce T1DM model) could damage part of the β‐cell of pancreas. These were similar as the pathological features of T2DM patients (26). In comparison to the control group, T2DM rats exhibited notable elevations in levels of blood glucose and lipid contents, along with irregularities in biochemical markers associated with liver and kidney functions. Moreover, OGTT-AUC and HOMA-IR values were also heightened, indicating the presence of IR. The pathological results revealed that the hepatic cords in liver of T2DM rats were disorganized, with more inflammatory cell infiltration, a large number of hepatocyte vacuoles, and fatty degeneration; the glomeruli in kidney were significantly hypertrophied, with increased mesangial matrix, vacuolar degeneration of renal tubular epithelial cells, and interstitial infiltration with inflammatory cells. The pancreatic islets in the pancreatic tissue had irregular morphology, blurred borders, disorganized structure, and deformed cells, which is consistent with the pathological manifestations of T2DM (27–29). The results of this study showed that YYT intervention reduced blood glucose and lipid levels, ameliorated levels of biochemical markers related to liver and kidney function, and alleviated histopathological changes in the liver, kidney, and pancreas of T2DM rats. The most significant effect was observed in YYT-H group, indicating that YYT has a therapeutic effect on T2DM. In addition, we selected metformin as the positive control drug (30, 31). Our results showed less differences in controlling blood glucose, reducing IR, and improving the biochemical markers between high-dose YYT and metformin treatment. However, more studies could be carried out to compare the effects of YYT and metformin on different stages of T2DM in clinic. Besides, clinical studies could also be carried out to evaluate the therapeutic effects of combination of YYT and metformin on T2DM clinically.
The prolonged state of hyperglycemia and hyperlipidemia leads to a decrease in efficacy of antioxidant enzymes, which generates oxidative stress, hinders cellular and tissue functionality, exacerbates the disruption of normal glucose metabolism, and exacerbates the onset and progression of diabetes (32, 33). Therefore, it is equally important to measure the antioxidant capacity of the drug in T2DM rats. Our results indicated that YYT treatment elevated levels of the antioxidant markers SOD and GSH-PX in serum of T2DM rats while decreasing MDA levels. SOD operates as an antioxidant by eliminating superoxide anions, while GSH-PX protects cells and tissues by breaking down harmful peroxides. MDA, a product of oxidative stress, serves as an indicator of the extent of oxidative harm inflicted on cells (34, 35). The results also indicate that YYT effectively reduced levels of serum pro-inflammatory cytokines, such as IL-1β, IL-6, and TNF-α, in T2DM rats. These cytokines play a central role in regulating the inflammatory and immune response and participate in a wide range of physiological and pathological processes. Excessive production of these cytokines has been linked to the development of IR in various tissues, including adipose tissue, muscle, and liver leading to increased local inflammation and contributing to systemic IR and β-cell damage (36) IL-1 family of cytokines are critical regulators of immune and inflammatory response (37). IL-1β is particularly harmful as it is a major mediator of inflammatory response (38, 39). Research has shown that IL-6, a crucial member of the cytokine family, is a key factor in the development of IR (40). TNF-α is also known to induce IR (41). Elevated levels of inflammatory mediators, particularly IL-1β and TNF-α, exacerbate local inflammation, which can contribute to systemic IR and β-cell injury (42–44).
The gut microbiota plays an important role in development and progression of T2DM (45). The diversity of gut microbiota facilitates the maintenance of essential amino acid production, glucose metabolism, and the regulation of immune function (46, 47). Some studies have shown that adopting a healthy dietary strategy in prediabetes can help probiotic growth and prevent development of T2DM (48). The composition of the gut microbiota in many diabetes patients is altered, resulting in dysbiosis or even the loss of certain species. This leads to changes in the composition of fecal metabolites, which can cause inflammation, oxidative stress, and IR (49, 50). Firmicutes (gram-positive bacteria) and Bacteroidota (gram-negative bacteria) make up more than 90% of the total bacterial population in humans, and the F/B ratio is positively correlated with serum glucose levels. Antibiotic therapy improves insulin activity and increases glucose tolerance after lowering the Firmicutes levels (51). Therefore, correcting and maintaining the gut microbiota diversity is important in improving T2DM. The results of the study indicate that YYT has an improvement effect on gut microbiota, which may be one of the mechanisms by which it aids in the treatment of T2DM.
Lactobacillus is a widely recognized probiotic, and several species of the genus have been shown to lower and control blood glucose levels, enhance antioxidant capacity, exert anti-inflammatory effect, and prevent organ damage (52–54). Candidatus_Saccharimonas is an acid-producing bacterium that has an important role in maintaining intestinal pH (55). Ruminococcaceae UCG-005 can enhance the production of short-chain fatty acids, which in turn regulates the expression of Bax and Bcl-2 in islets, thereby alleviating islet damage (56, 57). Allobaculum is positively correlated with the lipid metabolism regulator ANGPTL4, and significantly elevated relative abundance was detected in intestine and feces of HFD-induced obese mice, suggesting that it is intimately associated with lipid metabolism (58). Moreover, its relative abundance showed a positive correlation with blood glucose level in T2DM rats (59). The abundance of Bacteroides in patients with T2DM is often half of that in normal individuals, and Ganoderma lucidum polysaccharides can enhance the abundance of Bacteroides in patients with T2DM (60, 61). Desulfovibrio is a group of sulfate-reducing bacteria in which hydrogen sulfide is a specific metabolite that activates the AKT signaling pathway, thereby improving IR (62). However, studies have found that patients with T2DM tend to have a higher abundance of Desulfovibrio. Hence, it has also been suggested that an increase in sulfate-reducing bacteria is an intrinsic aspect of T2DM pathogenesis. These contradictions imply that more studies are required to determine the role of this bacterium in T2DM (63, 64). The genus Blautia includes various acetate and butyrate producers (65, 66). It was observed that Blautia abundance was decreased in patients with T2DM compared with healthy individuals (67). Oral Blautia administration significantly improved metabolic disorders, including obesity and diabetes mellitus (68).
Matching the differential metabolic pathways obtained from metabolomics with those predicted using 16s rRNA gene sequencing revealed that tryptophan and glycerophospholipid metabolism are the common metabolic pathways. These may be the potential mechanisms by which YYT exerts its effects on treating T2DM through the regulation of the gut microbiota.
Tryptophan metabolism and its related metabolites are closely related to sugar intake and insulin sensitivity (69, 70). In the present study, the levels of L-tryptophan, L-kynurenine, and 5-hydroxytryptophan (5-HT) were significantly decreased in T2DM model rats, whereas the above metabolites and 3-hydroxyanthranilic acid (3-HAA) were significantly increased after YYT treatment. In rats, L-tryptophan enhances glucose-related energy expenditure and, thus, suppresses blood glucose elevation (71). Most of tryptophan catabolism occurs via the kynurenine synthesis pathway. L-kynurenine is an important intermediate in the synthesis pathway of kynurenine. Previous animal studies have demonstrated that reduced levels of tryptophan and kynurenine occur in both pre-diabetes and post-diabetes and are potential biomarkers of prediabetes (72). This phenomenon may be related to chronic inflammation, which upregulates the activity of tryptophan 2,3-dioxygenase and indoleamine 2,3-dioxygenase, the rate-limiting enzymes in the conversion of tryptophan to kynurenine (73). 3-HAA, one of the downstream products of L-kynurenine, exhibits anti-inflammatory and lipid-regulating functions (74, 75). 5-HT is one of the intermediates of the serotonin metabolic pathway, and its conversion to 5-hydroxyindoleacetic acid is accelerated when serum tryptophan levels are reduced in patients with T2DM, which may contribute to the reduced levels of 5-HT (76).
Glycerophospholipid metabolism is considered a significant pathway in T2DM in the context of lipid metabolism, and this pathway has been shown to be a key pathway for some drugs used to treat T2DM (77, 78). The levels of phosphatidylcholine (PC), lysoPC, phosphatidate, choline, phosphocholine, and choline glycerophosphate were reduced in T2DM rats compared with those of control group. After YYT treatment, PC and lysoPC levels were elevated. is a type of glycerophospholipid that is an important component of cell membranes. Abnormalities in hepatic PC synthesis have been observed during the development of diabetes and are thought to be associated with mitochondrial dysfunction (79). In addition, one study found that a high intake of PC decreased the occurrence of T2DM in a male population (80). This suggests that glycerophospholipid metabolism, including PC synthesis, may play a role in the development of T2DM. However, relationship between PC metabolism and T2DM remains to be further investigated. LysoPC has been shown to have potential benefits in management of diabetes, including improvement of IR, increased uptake of glucose by adipocytes, and potential benefits in both T1DM and T2DM (81, 82). It has been found that lysoPC could alleviate fatty acid-induced muscle cell injury through activation of PPARδ (83). However, research has also found that lysoPC levels are elevated in diabetic mice, which may promote IR (84). The specific mechanism of action of lysoPCs remains an open question.
There are some limitations to this study. The detailed relationship between differential metabolites and gut microbiota still required to be studied. Fecal transplantation and targeted metabolomics may be useful in future to deeply illustrate the metabolic regulatory mechanism of YYT on T2DM based on regulating gut microbiota.
Conclusion
This study revealed that YYT has a wide range of therapeutic effects on T2DM rats, including antioxidative and anti-inflammatory effects. Furthermore, YYT corrected the altered gut microbiota and serum metabolites in T2DM rats. This study suggests that YYT may have a therapeutic impact on T2DM by regulating gut microbiota and modulating tryptophan and glycerophospholipid metabolism, which are potential key pathways in treating T2DM (Figure 8).
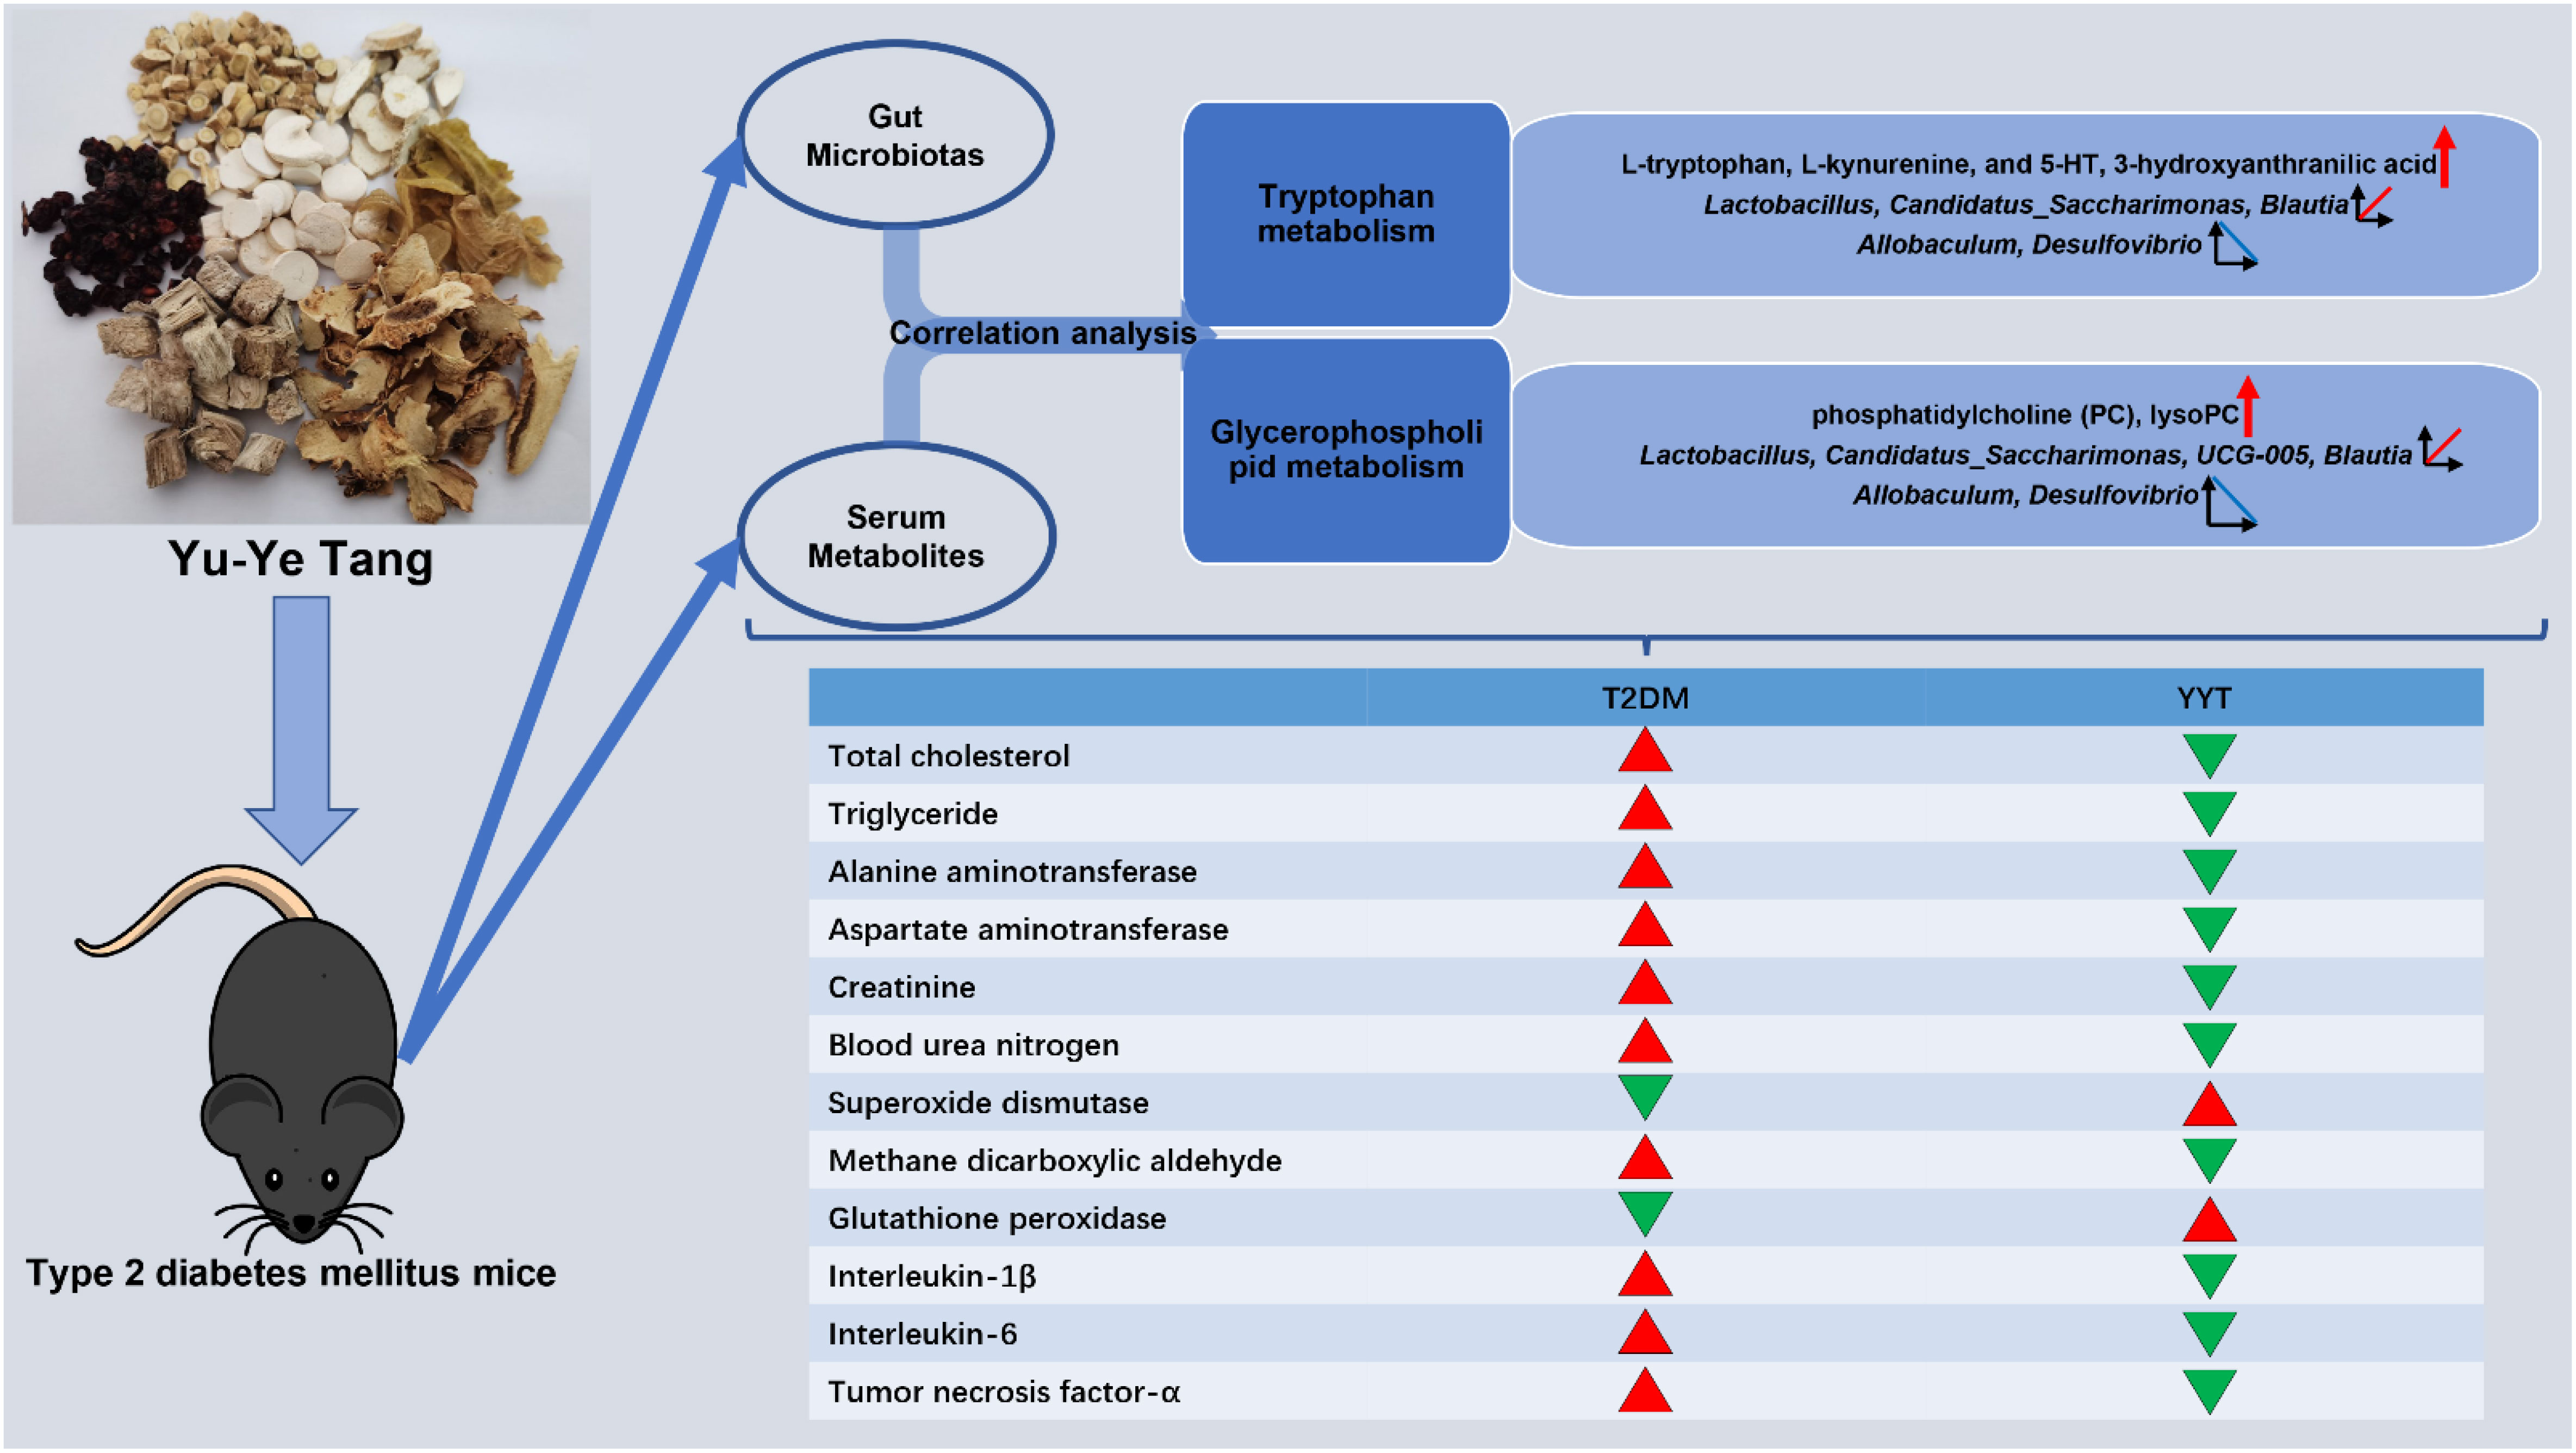
Figure 8 Graphical abstract.
Data availability statement
The sequencing data presented in the study are deposited in the Sequence Read Archive repository, accession number PRJNA931818.
Ethics statement
The animal study was approved by ethics committee of Cangzhou Integrated Traditional Chinese and Western Medicine Hospital. The study was conducted in accordance with the local legislation and institutional requirements.
Author contributions
ZM and WS carried out the experiments and manuscript writing. LW, YW, and BP provided experimental help. XS, HL, and HZ performed data analysis and result interpretation. SL provided ideas and technical guidance for the whole work. HW supervised the experiments. All authors have read and agreed to the published version of the manuscript.
Funding
This research was funded by Construction Project of Workshop of Prestigious Chinese Physician in Cangzhou Hospital of Integrated Traditional Chinese Medicine and Western Medicine, grant number 2022-75; Tianjin Municipal Education Commission (Natural Key) Scientific Research Programme Projects, grant number 2021ZD010.
Conflict of interest
The authors declare that the research was conducted in the absence of any commercial or financial relationships that could be construed as a potential conflict of interest.
Publisher’s note
All claims expressed in this article are solely those of the authors and do not necessarily represent those of their affiliated organizations, or those of the publisher, the editors and the reviewers. Any product that may be evaluated in this article, or claim that may be made by its manufacturer, is not guaranteed or endorsed by the publisher.
Supplementary material
The Supplementary Material for this article can be found online at: https://www.frontiersin.org/articles/10.3389/fendo.2023.1159707/full#supplementary-material
References
1. Artasensi A, Pedretti A, Vistoli G, Fumagalli L. Type 2 diabetes mellitus: A review of multi-target drugs. Molecules (2020) 25:1987. doi: 10.3390/molecules25081987
2. Magliano DJ, Sacre JW, Harding JL, Gregg EW, Zimmet PZ, Shaw JE. Young-onset type 2 diabetes mellitus — implications for morbidity and mortality. Nat Rev Endocrinol (2020) 16:321–31. doi: 10.1038/s41574-020-0334-z
3. Vrancken G, Gregory AC, Huys GRB, Faust K, Raes J. Synthetic ecology of the human gut microbiota. Nat Rev Microbiol (2019) 17:754–63. doi: 10.1038/s41579-019-0264-8
4. Charbonneau MR, Blanton LV, DiGiulio DB, Relman DA, Lebrilla CB, Mills DA, et al. A microbial perspective of human developmental biology. Nature (2016) 535:48–55. doi: 10.1038/nature18845
5. Vallianou NG, Stratigou T, Tsagarakis S. Microbiome and diabetes: Where are we now? Diabetes Res Clin Pract (2018) 146:111–8. doi: 10.1016/j.diabres.2018.10.008
6. Ridaura VK, Faith JJ, Rey FE, Cheng J, Duncan AE, Kau AL, et al. Gut microbiota from twins discordant for obesity modulate metabolism in mice. Science (2013) 341:1241214. doi: 10.1126/science.1241214
7. Karlsson FH, Tremaroli V, Nookaew I, Bergström G, Behre CJ, Fagerberg B, et al. Gut metagenome in European women with normal, impaired and diabetic glucose control. Nature (2013) 498:99–103. doi: 10.1038/nature12198
8. Gong P, Xiao X, Wang S, Shi F, Liu N, Chen X, et al. Hypoglycemic effect of astragaloside IV via modulating gut microbiota and regulating AMPK/SIRT1 and PI3K/AKT pathway. J Ethnopharmacol (2021) 281:114558. doi: 10.1016/j.jep.2021.114558
9. Xie X, Liao J, Ai Y, Gao J, Zhao J, Qu F, et al. Pi-dan-jian-qing decoction ameliorates type 2 diabetes mellitus through regulating the gut microbiota and serum metabolism. Front Cell Infection Microbiol (2021) 11:748872. doi: 10.3389/fcimb.2021.748872
10. Tian J, Bai B, Gao Z, Yang Y, Wu H, Wang X, et al. Alleviation effects of GQD, a traditional chinese medicine formula, on diabetes rats linked to modulation of the gut microbiome. Front Cell Infection Microbiol (2021) 11:740236. doi: 10.3389/fcimb.2021.740236
11. Liu A, Chen X, Wang Y, Jin L, Yang L, Dong X, et al. Protective effect of modified Yu-Ye decoction on type 2 diabetes mellitus rats. TMR Pharmacol Res (2021) 1:3. doi: 10.53388/tmrpr20210217001
12. Amitani M, Cheng K-C, Asakawa A, Amitani H, Kairupan TS, Sameshima N, et al. Allantoin ameliorates chemically-induced pancreaticβ-cell damage through activation of the imidazoline I3 receptors. PeerJ (2015) 3:e1105. doi: 10.7717/peerj.1105
13. Moslehi A, Hamidi-zad Z, Rastegarpanah M. Attenuating effects of allantoin on oxidative stress in a mouse model of nonalcoholic steatohepatitis: role of SIRT1/Nrf2 pathway. Res Pharm Sci (2021) 16:651. doi: 10.4103/1735-5362.327511
14. Zhang Y, Yuan Y, Zhang J, Zhao Y, Zhang Y, Fu J. Astragaloside IV supplementation attenuates cognitive impairment by inhibiting neuroinflammation and oxidative stress in type 2 diabetic mice. Front Aging Neurosci (2022) 14:1004557. doi: 10.3389/fnagi.2022.1004557
15. Su X, Guo H, Zhou Y, Cao A, Shen Q, Zhu B, et al. Astragaloside IV attenuates high glucose-induced NF-κB -mediated inflammation through activation of PI3K. Phytother Res (2023). doi: 10.1002/ptr.7875
16. Li F, Yuan Y-L, Guo C-R, Cui L-L, Ruan S-X, Zhang C-F, et al. Timosaponin B-II ameliorates diabetic nephropathy via TXNI P, mTOR, and NF-κB signaling pathways in alloxan-induced mice. Drug Design Dev Ther (2015), 6247. doi: 10.2147/dddt.s96435
17. Wang N, Xu P, Wu R, Wang X, Wang Y, Shou D, et al. Timosaponin BII improved osteoporosis caused by hyperglycemia through promoting autophagy of osteoblasts via suppressing the mTOR/NFκB signaling pathway. Free Radical Biol Med (2021) 171:112–23. doi: 10.1016/j.freeradbiomed.2021.05.014
18. Yuan G, Shi S, Jia Q, Shi J, Shi S, Zhang X, et al. Use of network pharmacology to explore the mechanism of gegen (Puerariae lobatae radix) in the treatment of type 2 diabetes mellitus associated with hyperlipidemia. Evidence-Based Complementary Altern Med (2021) 2021:1–14. doi: 10.1155/2021/6633402
19. Zhu Q, Yang S, Wei C, Lu G, Lee K, He JC, et al. Puerarin attenuates diabetic kidney injury through interaction with Guanidine nucleotide-binding protein Gi subunit alpha-1 (Gnai1) subunit. J Cell Mol Med (2022) 26:3816–27. doi: 10.1111/jcmm.17414
20. Bai Y, Han L, Qian J, Wang H. Molecular mechanism of puerarin against diabetes and its complications. Front Pharmacol (2022) 12:780419. doi: 10.3389/fphar.2021.780419
21. Wang X, Li Q, Sui B, Xu M, Pu Z, Qiu T. Schisandrin A from Schisandra chinensis Attenuates Ferroptosis and NLRP3 Inflammasome-Mediated Pyroptosis in Diabetic Nephropathy through Mitochondrial Damage by AdipoR1 Ubiquitination. Oxid Med Cell Longevity (2022) 2022:1–23. doi: 10.1155/2022/5411462
22. Kopustinskiene DM, Bernatoniene J. Antioxidant effects of schisandra chinensis fruits and their active constituents. Antioxidants (2021) 10:620. doi: 10.3390/antiox10040620
23. Chang G-R, Lin W-L, Lin T-C, Liao H-J, Lu Y-W. The ameliorative effects of saikosaponin in thioacetamide-induced liver injury and non-alcoholic fatty liver disease in mice. Int J Mol Sci (2021) 22:11383. doi: 10.3390/ijms222111383
24. Overi D, Carpino G, Moretti M, Franchitto A, Nevi L, Onori P, et al. Islet regeneration and pancreatic duct glands in human and experimental diabetes. Front Cell Dev Biol (2022) 10:814165. doi: 10.3389/fcell.2022.814165
25. AF A. Melatonin improves therapeutic potential of mesenchymal stem cells-derived exosomes against renal ischemia-reperfusion injury in rats. Am J Trans Res (2019) 11:2887.
26. Skovsø S. Modeling type 2 diabetes in rats using high fat diet and streptozotocin. J Diabetes Invest (2014) 5:349–58. doi: 10.1111/jdi.12235
27. Huang S, Peng W, Jiang X, Shao K, Xia L, Tang Y, et al. The effect of chromium picolinate supplementation on the pancreas and macroangiopathy in type II diabetes mellitus rats. J Diabetes Res (2014) 2014:1–8. doi: 10.1155/2014/717219
28. He Q, Li J-K, Li F, Li R-G, Zhan G-Q, Li G, et al. Mechanism of action of gypenosides on type 2 diabetes and non-alcoholic fatty liver disease in rats. World J Gastroenterol (2015) 21:2058–66. doi: 10.3748/wjg.v21.i7.2058
29. Lin C-F, Kuo Y-T, Chen T-Y, Chien C-T. Quercetin-rich guava (Psidium guajava) juice in combination with trehalose reduces autophagy, apoptosis and pyroptosis formation in the kidney and pancreas of type II diabetic rats. Molecules (2016) 21:334. doi: 10.3390/molecules21030334
30. Zhang Q, Hu N. Effects of metformin on the gut microbiota in obesity and type 2 diabetes mellitus. Diabetes Metab Syndrome Obesity: Targets Ther (2020) 13:5003–14. doi: 10.2147/dmso.s286430
31. Matsumoto T, Noguchi E, Ishida K, Kobayashi T, Yamada N, Kamata K. Metformin norMalizes endothelial function by suppressing vasoconstrictor prostanoids in mesenteric arteries from OLETF rats, a model of type 2 diabetes. Am J Physiology-Heart Circulatory Physiol (2008) 295:H1165–76. doi: 10.1152/ajpheart.00486.2008
32. Ighodaro OM. Molecular pathways associated with oxidative stress in diabetes mellitus. Biomed Pharmacother (2018) 108:656–62. doi: 10.1016/j.biopha.2018.09.058
33. Deng L, Du C, Song P, Chen T, Rui S, Armstrong DG, et al. The role of oxidative stress and antioxidants in diabetic wound healing. Oxid Med Cell Longevity (2021) 2021:1–11. doi: 10.1155/2021/8852759
34. Song J-X, An J-R, Chen Q, Yang X-Y, Jia C-L, Xu S, et al. Liraglutide attenuates hepatic iron levels and ferroptosis in db/db mice. Bioengineered (2022) 13:8334–48. doi: 10.1080/21655979.2022.2051858
35. Qi M, He Y, Cheng Y, Fang Q, Ma R, Zhou S, et al. Icariin ameliorates streptozocin-induced diabetic nephropathy through suppressing the TLR4/NF-κB signal pathway. Food Funct (2021) 12:1241–51. doi: 10.1039/d0fo02335c
36. Wu H, Ballantyne CM. Metabolic inflammation and insulin resistance in obesity. Circ Res (2020) 126:1549–64. doi: 10.1161/circresaha.119.315896
37. Dinarello CA. Overview of the IL-1 family in innate inflammation and acquired immunity. Immunol Rev (2017) 281:8–27. doi: 10.1111/imr.12621
38. Dror E, Dalmas E, Meier DT, Wueest S, Thévenet J, Thienel C, et al. Postprandial macrophage-derived IL-1β stimulates insulin, and both synergistically promote glucose disposal and inflammation. Nat Immunol (2017) 18:283–92. doi: 10.1038/ni.3659
39. Dinarello CA, van der Meer JWM. Treating inflammation by blocking interleukin-1 in humans. Semin Immunol (2013) 25:469–84. doi: 10.1016/j.smim.2013.10.008
40. Schmidt-Arras D, Rose-John S. IL-6 pathway in the liver: From physiopathology to therapy. J Hepatol (2016) 64:1403–15. doi: 10.1016/j.jhep.2016.02.004
41. Hotamisligil GS, Shargill NS, Spiegelman BM. Adipose expression of tumor necrosis factor-α: direct role in obesity-linked insulin resistance. Science (1993) 259:87–91. doi: 10.1126/science.7678183
42. Cnop M, Welsh N, Jonas J-C, Jörns A, Lenzen S, Eizirik DL. Mechanisms of pancreatic β-cell death in type 1 and type 2 diabetes. Diabetes (2005) 54:S97–S107. doi: 10.2337/diabetes.54.suppl_2.s97
43. Javeed N, Brown MR, Rakshit K, Her T, Sen SK, Matveyenko AV. Proinflammatory cytokine interleukin 1β Disrupts β-cell circadian clock function and regulation of insulin secretion. Endocrinology (2020) 162:bqaa084. doi: 10.1210/endocr/bqaa084
44. Ding F, Luo X, Tu Y, Duan X, Liu J, Jia L, et al. Alpk1 sensitizes pancreatic beta cells to cytokine-induced apoptosis via upregulating TNF-α Signaling pathway. Front Immunol (2021) 12:705751. doi: 10.3389/fimmu.2021.705751
45. Tanase DM, Gosav EM, Neculae E, Costea CF, Ciocoiu M, Hurjui LL, et al. Role of gut microbiota on onset and progression of microvascular complications of type 2 diabetes (T2DM). Nutrients (2020) 12:3719. doi: 10.3390/nu12123719
46. Clarke G, Sandhu KV, Griffin BT, Dinan TG, Cryan JF, Hyland NP. Gut reactions: breaking down xenobiotic–microbiome interactions. Pharmacol Rev (2019) 71:198–224. doi: 10.1124/pr.118.015768
47. Komaroff AL. The microbiome and risk for obesity and diabetes. JAMA (2017) 317:355. doi: 10.1001/jama.2016.20099
48. Díaz-Rizzolo DA, Kostov B, López-Siles M, Serra A, Colungo C, González-de-Paz L, et al. Healthy dietary pattern and their corresponding gut microbiota profile are linked to a lower risk of type 2 diabetes, independent of the presence of obesity. Clin Nutr (2020) 39:524–32. doi: 10.1016/j.clnu.2019.02.035
49. Peng W, Huang J, Yang J, Zhang Z, Yu R, Fayyaz S, et al. Integrated 16S rRNA sequencing, metagenomics, and metabolomics to characterize gut microbial composition, function, and fecal metabolic phenotype in non-obese type 2 diabetic goto-kakizaki rats. Front Microbiol (2020) 10:3141. doi: 10.3389/fmicb.2019.03141
50. Fujio-Vejar S, Vasquez Y, Morales P, Magne F, Vera-Wolf P, Ugalde JA, et al. The gut microbiota of healthy Chilean subjects reveals a high abundance of the phylum verrucomicrobia. Front Microbiol (2017) 8:1221. doi: 10.3389/fmicb.2017.01221
51. Dávila LA, Pirela VB, Díaz W, Villasmil NR, León SC, Contreras MCE, et al. The microbiome and the epigenetics of diabetes mellitus. Diabetes Food Plan (2018), 11–31. doi: 10.5772/intechopen.76201
52. Zhou X, Shang G, Tan Q, He Q, Tan X, Park K-Y, et al. Effect of Lactobacillus fermentum TKSN041 on improving streptozotocin-induced type 2 diabetes in rats. Food Funct (2021) 12:7938–53. doi: 10.1039/d1fo01571k
53. Dang F, Jiang Y, Pan R, Zhou Y, Wu S, Wang R, et al. Administration of Lactobacillus paracasei ameliorates type 2 diabetes in mice. Food Funct (2018) 9:3630–9. doi: 10.1039/c8fo00081f
54. Singh S, Sharma RK, Malhotra S, Pothuraju R, Shandilya UK. Lactobacillus rhamnosusNCDC17 ameliorates type-2 diabetes by improving gut function, oxidative stress and inflammation in high-fat-diet fed and streptozotocintreated rats. Beneficial Microbes (2017) 8:243–55. doi: 10.3920/bm2016.0090
55. Ke S, Zhang B, Yu Y, Wang S, Jin W, Wu J, et al. Structural characterization of sulfated galactofucan from Undaria pinnatifida and its effect on type 2 diabetic mice. J Oceanol Limnol (2022) 41(1):300–313. doi: 10.1007/s00343-021-1307-3
56. Li Q, Hu J, Nie Q, Chang X, Fang Q, Xie J, et al. Hypoglycemic mechanism of polysaccharide from Cyclocarya paliurus leaves in type 2 diabetic rats by gut microbiota and host metabolism alteration. Sci China Life Sci (2020) 64:117–32. doi: 10.1007/s11427-019-1647-6
57. Pircalabioru GG, Liaw J, Gundogdu O, Corcionivoschi N, Ilie I, Oprea L, et al. Effects of the lipid profile, type 2 diabetes and medication on the metabolic syndrome—Associated gut microbiome. Int J Mol Sci (2022) 23:7509. doi: 10.3390/ijms23147509
58. Zheng Z, Lyu W, Ren Y, Li X, Zhao S, Yang H, et al. Allobaculum involves in the modulation of intestinal ANGPTLT4 expression in mice treated by high-fat diet. Front Nutr (2021) 8:690138. doi: 10.3389/fnut.2021.690138
59. Zhao J-D, Li Y, Sun M, Yu C-J, Li J-Y, Wang S-H, et al. Effect of berberine on hyperglycaemia and gut microbiota composition in type 2 diabetic Goto-Kakizaki rats. World J Gastroenterol (2021) 27:708–24. doi: 10.3748/wjg.v27.i8.708
60. Zhang X, Shen D, Fang Z, Jie Z, Qiu X, Zhang C, et al. Human gut microbiota changes reveal the progression of glucose intolerance. PloS One (2013) 8:e71108. doi: 10.1371/journal.pone.0071108
61. Chen M, Xiao D, Liu W, Song Y, Zou B, Li L, et al. Intake of Ganoderma lucidum polysaccharides reverses the disturbed gut microbiota and metabolism in type 2 diabetic rats. Int J Biol Macromolecules (2020) 155:890–902. doi: 10.1016/j.ijbiomac.2019.11.047
62. Chen L, Gao Y, Zhao Y, Yang G, Wang C, Zhao Z, et al. Chondroitin sulfate stimulates the secretion of H2S by Desulfovibrio to improve insulin sensitivity in NAFLD mice. Int J Biol Macromolecules (2022) 213:631–8. doi: 10.1016/j.ijbiomac.2022.05.195
63. Zhang C, Zhang M, Wang S, Han R, Cao Y, Hua W, et al. Interactions between gut microbiota, host genetics and diet relevant to development of metabolic syndromes in mice. ISME J (2009) 4:232–41. doi: 10.1038/ismej.2009.112
64. Doumatey AP, Adeyemo A, Zhou J, Lei L, Adebamowo SN, Adebamowo C, et al. Gut microbiome profiles are associated with type 2 diabetes in urban Africans. Front Cell Infection Microbiol (2020) 10:63. doi: 10.3389/fcimb.2020.00063
65. Park S-K, Kim M-S, Bae J-W. Blautia faecis sp. nov., isolated from human faeces. Int J Systematic Evolutionary Microbiol (2013) 63:599–603. doi: 10.1099/ijs.0.036541-0
66. Park S-K, Kim M-S, Roh SW, Bae J-W. Blautia stercoris sp. nov., isolated from human faeces. Int J Systematic Evolutionary Microbiol (2012) 62:776–9. doi: 10.1099/ijs.0.031625-0
67. Murri M, Leiva I, Gomez-Zumaquero JM, Tinahones FJ, Cardona F, Soriguer F, et al. Gut microbiota in children with type 1 diabetes differs from that in healthy children: a case-control study. BMC Med (2013) 11:1–12. doi: 10.1186/1741-7015-11-46
68. Hosomi K, Saito M, Park J, Murakami H, Shibata N, Ando M, et al. Oral administration of Blautia wexlerae ameliorates obesity and type 2 diabetes via metabolic remodeling of the gut microbiota. Nat Commun (2022) 13:4477. doi: 10.1038/s41467-022-32015-7
69. Sudar-Milovanovic E, Gluvic Z, Obradovic M, Zaric B, Isenovic ER. Tryptophan metabolism in atherosclerosis and diabetes. Curr Medicinal Chem (2022) 29:99–113. doi: 10.2174/0929867328666210714153649
70. Gürcü S, Girgin G, Yorulmaz G, Kılıçarslan B, Efe B, Baydar T. Neopterin and biopterin levels and tryptophan degradation in patients with diabetes. Sci Rep (2020) 10:17025. doi: 10.1038/s41598-020-74183-w
71. Inubushi T, Kamemura N, Oda M, Sakurai J, Nakaya Y, Harada N, et al. L-tryptophan suppresses rise in blood glucose and preserves insulin secretion in type-2 diabetes mellitus rats. J Nutr Sci Vitaminol (2012) 58:415–22. doi: 10.3177/jnsv.58.415
72. Yokoi N, Beppu M, Yoshida E, Hoshikawa R, Hidaka S, Matsubara T, et al. Identification of putative biomarkers for prediabetes by metabolome analysis of rat models of type 2 diabetes. Metabolomics (2015) 11:1277–86. doi: 10.1007/s11306-015-0784-9
73. Brandacher G, Hoeller E, Fuchs D, Weiss H. Chronic immune activation underlies morbid obesity: is IDO A key player? Curr Drug Metab (2007) 8:289–95. doi: 10.2174/138920007780362590
74. Zhang L, Ovchinnikova O, Jönsson A, Lundberg AM, Berg M, Hansson GK, et al. The tryptophan metabolite 3-hydroxyanthranilic acid lowers plasma lipids and decreases atherosclerosis in hypercholesterolaemic mice. Eur Heart J (2012) 33:2025–34. doi: 10.1093/eurheartj/ehs175
75. Yu Y, Lu Q, Chen F, Wang S, Niu C, Liao J, et al. Serum untargeted metabolomics analysis of the mechanisms of evodiamine on type 2 diabetes mellitus model rats. Food Funct (2022) 13(12):6623–6635. doi: 10.1039/d1fo04396j
76. Matsuoka K, Kato K, Takao T, Ogawa M, Ishii Y, Shimizu F, et al. Concentrations of various tryptophan metabolites are higher in patients with diabetes mellitus than in healthy aged male adults. Diabetol Int (2016) 8:69–75. doi: 10.1007/s13340-016-0282-y
77. Yan L, Han P, Man J, Tian Y, Wang F, Wang J. Discovery of lipid profiles of type 2 diabetes associated with hyperlipidemia using untargeted UPLC Q-TOF/MS-based lipidomics approach. Clinica Chimica Acta (2021) 520:53–62. doi: 10.1016/j.cca.2021.05.031
78. Yan Z, Wu H, Zhou H, Chen S, He Y, Zhang W, et al. Integrated metabolomics and gut microbiome to the effects and mechanisms of naoxintong capsule on type 2 diabetes in rats. Sci Rep (2020) 10:10829. doi: 10.1038/s41598-020-67362-2
79. Pan H-J, Lin Y, Chen YE, Vance DE, Leiter EH. Adverse hepatic and cardiac responses to rosiglitazone in a new mouse model of type 2 diabetes: Relation to dysregulated phosphatidylcholine metabolism. Vasc Pharmacol (2006) 45:65–71. doi: 10.1016/j.vph.2005.11.011
80. Virtanen JK, Tuomainen T-P, Voutilainen S. Dietary intake of choline and phosphatidylcholine and risk of type 2 diabetes in men: The Kuopio Ischaemic Heart Disease Risk Factor Study. Eur J Nutr (2020) 59:3857–61. doi: 10.1007/s00394-020-02223-2
81. Yea K, Kim J, Yoon JH, Kwon T, Kim JH, Lee BD, et al. Lysophosphatidylcholine activates adipocyte glucose uptake and lowers blood glucose levels in murine models of diabetes. J Biol Chem (2009) 284:33833–40. doi: 10.1074/jbc.m109.024869
82. Yea K, Kim J, Lim S, Park HS, Park KS, Suh P-G, et al. Lysophosphatidic acid regulates blood glucose by stimulating myotube and adipocyte glucose uptake. J Mol Med (2007) 86:211–20. doi: 10.1007/s00109-007-0269-z
83. Klingler C, Zhao X, Adhikary T, Li J, Xu G, Häring H-U, et al. Lysophosphatidylcholines activate PPARδ and protect human skeletal muscle cells from lipotoxicity. Biochim Biophys Acta (BBA) - Mol Cell Biol Lipids (2016) 1861:1980–92. doi: 10.1016/j.bbalip.2016.09.020
Keywords: type 2 diabetes mellitus, Yu-Ye Tang, gut microbiota, tryptophan metabolism, glycerophospholipid metabolism
Citation: Ma Z, Sun W, Wang L, Wang Y, Pan B, Su X, Li H, Zhang H, Lv S and Wang H (2023) Integrated 16S rRNA sequencing and nontargeted metabolomics analysis to reveal the mechanisms of Yu-Ye Tang on type 2 diabetes mellitus rats. Front. Endocrinol. 14:1159707. doi: 10.3389/fendo.2023.1159707
Received: 06 February 2023; Accepted: 21 August 2023;
Published: 05 September 2023.
Edited by:
Peiyuan Yin, Dalian Medical University, ChinaReviewed by:
Jianjun Liu, Dalian Medical University, ChinaChan-Yen Kuo, Taipei Tzu Chi Hospital, Taiwan
Jiajia Song, Southwest University, China
Copyright © 2023 Ma, Sun, Wang, Wang, Pan, Su, Li, Zhang, Lv and Wang. This is an open-access article distributed under the terms of the Creative Commons Attribution License (CC BY). The use, distribution or reproduction in other forums is permitted, provided the original author(s) and the copyright owner(s) are credited and that the original publication in this journal is cited, in accordance with accepted academic practice. No use, distribution or reproduction is permitted which does not comply with these terms.
*Correspondence: Shuquan Lv, Y3psdnNodXF1YW5AMTYzLmNvbQ==; Hongwu Wang, d2h3MjAwOUB0anV0Y20uZWR1LmNu