 Yuhe Liu1†
 Xueyu Chen2†
 Xuan Deng3†
 Fan Yang4Jinping Zheng5Tianyun Zhou6Ling Xu3Xiaomei Xie7
 Zhenyu Ju4Baoguo Wang8*
 Caiping Zhang1*
 Yong Zhou3*
- 1Institute of Biochemistry and Molecular Biology, Hengyang Medical College, University of South China, Hengyang, Hunan, China
- 2Department of Biostatistics, School of Public Health, Cheeloo College of Medicine, Shandong University, Jinan, China
- 3Clinical Research Institute, Shanghai General Hospital, Shanghai Jiao Tong University School of Medicine, Shanghai, China
- 4The First Affiliated Hospital of Jinan University, Institute of Aging and Regenerative Medicine, Jinan University, Guangzhou, China
- 5Department of Public Health and Preventive Medicine, Changzhi Medical College, Changzhi, China
- 6Clinical Medicine, School of Basic Medicine, Shanghai Medical College Fudan University, Shanghai, China
- 7Department of Clinical Laboratory, Tangshan Gem Flower Hospital, Tangshan, China
- 8Sanbo Brain Hospital, Capital Medical University, Beijing, China
Background: Nicotinamide adenine dinucleotide (NAD+) is a coenzyme and plays a crucial role in several metabolic processes. This study explored the association of nicotinamide adenine dinucleotide (NAD+) levels with metabolic disease (MD) in adults.
Methods: In this cross-sectional study, all data were collected from the Jidong community. MD was defined as the presence of one or more of the following disease components: hypertension, dyslipidemia, diabetes, hyperuricemia, obesity, and non-alcoholic fatty liver disease (NAFLD). The MD components were categorized into three groups: those with one component, those with two components, and those with three to six components. The whole blood NAD+ level was measured using a cycling assay and LC-MS/MS analysis. The participants were divided into four groups based on their NAD+ level quartiles. Multivariable logistic regression was used to evaluate the association of the whole blood NAD+ levels with MD.
Results: Of the 1,394 eligible participants, the average age was 43.2 years, and 74.3% had MD. In the top quartile of NAD+, the prevalence of MD and each of its components (hypertension, hyperlipidemia, diabetes, hyperuricemia, obesity, and NAFLD) were 87.9% 35.2%, 62.3%, 8.7%, 36.9%, 21.0%, and 60.5%, respectively. As compared with the lowest NAD+ quartile (≤29.4 μmol/L), the adjusted odds ratios and 95% confidence interval of the highest quartile were 3.01 (1.87-4.87) for MD, 2.48 (1.44-4.29) for 1 MD component, 2.74 (1.45-5.17) for 2 MD components, and 4.30 (2.32-7.98) for 3-6 MD components. The risk of MD began to increase at NAD+ levels of 31.0 μmol/L, as revealed by the gradient associations of NAD+ levels with MD. There was no significant interaction between age, sex, drinking, smoking, and NAD+ for MD (p for interaction ≥0.10).
Conclusions: Increased NAD+ was significantly associated with MD, as well as its individual components. Our findings provide new evidence for the relationship between blood NAD+ levels and MD.
Introduction
Metabolic disease (MD) has become a significant global health concern due to its increasing incidence and burden on human health (1). The disease typically results from abnormalities in the metabolism of substances or energy, such as diabetes, hypertension, and non-alcoholic fatty liver disease (NAFLD) (2, 3). In 2015, metabolic abnormalities in blood glucose, blood pressure, and lipids contributed to over 24 million deaths worldwide (4). Hyperuricemia, which affects more than 20% of US adults according to data from 2007-2008, is also becoming increasingly prevalent and is considered the second most common MD in China after diabetes (5, 6). Chronic MD can have multiple adverse consequences. NAD+, a pyridine nucleotide, was first discovered by regulating the metabolic rate of yeast extracts, and later was well-known for its role in redox reactions. It has emerged as a key regulator of a variety of metabolic processes in cells, encompassing glycolysis, the TCA cycle, oxidative phosphorylation, DNA repair, and gene expression. Accordingly, this highlights the critical role of NAD+ in maintaining proper metabolic function (7, 8) and the critical role NAD+ plays in maintaining proper metabolic function.
Changes in NAD+ levels have been associated with metabolic dysfunction (9). Several studies have reported that NAD+ plays an important role in regulating processes associated with the pathogenesis of obesity, NAFLD (10), diabetes (11, 12), and hypertension (2, 13). Enhanced NAD+ levels may alleviate symptoms of NAFLD (14). However, several studies have proposed that elevated levels of NAD+ precursors have been significantly associated with diabetes (15) and cardiovascular disease (16, 17). Additionally, in an animal study, nicotinamide mononucleotide (NMN), a NAD+ precursor, impaired the benefits of exercise on glucose metabolism in diet-induced obesity (18). Therefore, the association of NAD+ with clinical diseases, particularly MD, remains controversial. Up to now, no study has evaluated the association of NAD+ with multiple common chronic diseases. As such, the current study aimed to investigate the association between NAD+ levels and MD, including hypertension, hyperlipidemia, diabetes, hyperuricemia, obesity, and NAFLD, in a large, community-based cross-sectional study.
Methods
Study design and participants
The participants were recruited from the Jidong community in Tangshan, a large modern city in northern China. From 2019 to 2020, a total of 1,532 participants were recruited for the study after excluding participants with an abnormal value of NAD+ (n=2), missing data on blood pressure (BP) and body mass index (BMI) (n=75), or having excess alcohol intake (n=61) (Figure 1). All participants provided informed consent, and the study was conducted in accordance with the Helsinki Declaration and approved by the Ethical Committees of the Staff Hospital of Jidong Oilfield of China National Petroleum Corporation.
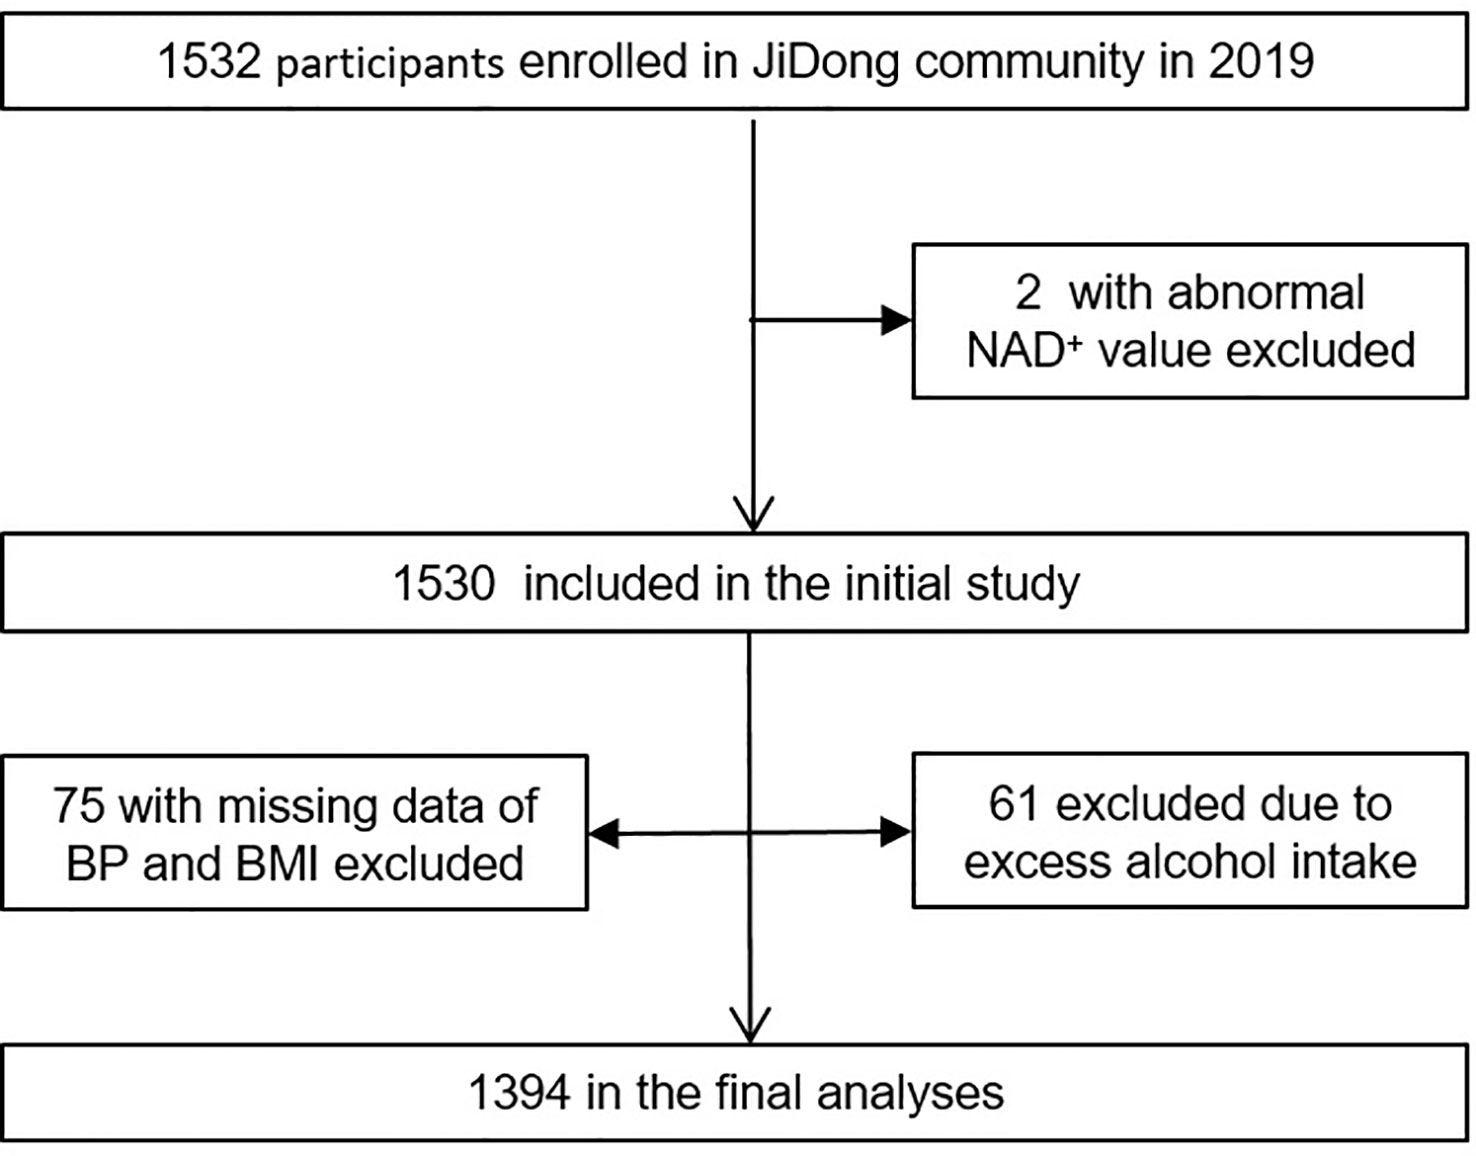
Figure 1 Flow chart of this study. BP, blood pressure; BMI, body mass index.
Data collection
Participants were interviewed and completed a structured questionnaire on demographic characteristics, smoking habits, alcohol consumption, and medical history. Exercise frequency was classified as “Inactive”, “Moderately active”, and “Very active”. Education level was categorized as “Middle school or below” or “college or above”. BMI was calculated by dividing measured weight in kilograms by the square of measured height in meters and was categorized as “<18.5”, “18.5-23.9”, “24.0-27.9”, and “≥28.0”. Blood pressure was measured using an automatic digital blood pressure monitor. The intake of meat and vegetables in the daily diet was categorized as “Never”, “Occasionally”, and “Very often”.
Measurement of NAD+ levels
After overnight fasting, blood samples were collected from the large antecubital veins, preserved in EDTA tubes (ethylene diamine tetraacetic acid), and NAD+ levels were determined in the laboratory by cycling assay and LC-MS/MS analysis. The cycling assay mainly applies the biochemical basis of NAD+, which transitions back and forth between redox states during the assay. LC-MS/MS analysis is a powerful tool for detecting compounds’ qualitative and quantitative analysis. These methods are consistent with our previous study (19). Finally, the data measured by the cycling assay and LC–MS/MS are compared and validated to ensure the reliability of the data.
Assessment of metabolic disease
MD was defined as the presence of one or more of the following disease components: hypertension, dyslipidemia, diabetes, hyperuricemia, obesity, and NAFLD. Hypertension was defined as systolic blood pressure (SBP) ≥140mmHg or diastolic blood pressure (DBP) ≥90mmHg or self-reported taking antihypertensive medication or having been diagnosed with hypertension (20). Dyslipidemia was defined as serum total cholesterol ≥5.7 mmol/L, triglyceride≥1.7 mmol/L, low-density lipoprotein cholesterol level ≥4.1 mmol/L any use of lipid-lowering drugs, or any self-reported history of dyslipidemia. Diabetes was defined as fasting glucose ≥7.0 mmol/L, any use of glucose-lowering drugs, or any self-reported history of diabetes (21). Hyperuricemia was defined as a serum uric acid (SUA) level above 420 μmol/L in men and above 357 μmol/L in women (22). Obesity was defined as a body mass index ≥28 kg/m2 (23). NAFLD was defined as diffusely increased echogenicity of the liver relative to the kidney, ultrasound beam attenuation, and poor visualization of intrahepatic structures, excluding those with excess alcohol intake and other liver diseases (24).
Statistical analysis
Participants were divided into four groups by the quartile of NAD+ levels. Normally distributed continuous variables were expressed as mean ± standard deviation (SD) and analyzed using one-way analysis of variance (ANOVA). Categorical variables are shown as frequencies and percentages and analyzed using the chi-square test. Logistic regression analysis was used to analyze the relationship between NAD+ levels and MD.
Additionally, the number of MD components was categorized as “1 component”, “2 components”, and “3-6 components”. Multivariate generalized linear regression analysis and restricted cubic splines (RCS) were used to determine the association of NAD+ levels with MD components after adjusting for age, gender, and the number of red blood cell counts (RBC), smoke, drink, exercise, education, and the meat diet. We performed the same association analysis in a population stratified by age, sex, drink, and smoke, grouping by NAD+ cutoff value and NAD+ quartiles, respectively. All statistical analyses were two-sided and the level of significance was α=0.05. The statistical analyses were performed using SAS software, version 9.4 (SAS Institute Inc., Cary, NC, USA).
Results
Baseline characteristics of eligible participants
Out of the 1,532 participants with NAD+ data, 1,394 participants were ultimately analyzed after meeting our inclusion and exclusion criteria (Figure 1). Table 1 displays the demographic characteristics of all included participants, stratified by quartiles of NAD+ levels. The mean age of participants was 43.2 years, with 52.7% being male. The proportion of participants with MD was 74.3%, with a gradual increase observed from quartile 1 to quartile 4 of NAD+ levels. Significant differences were found among NAD+ quartile groups in terms of gender, smoking habits, drinking habits, BMI, SBP, DBP, TG, LDL-C, and HDL-C (all p values <0.001). Mean RBCs were higher in quartile 3 and quartile 4 compared to quartile 1 and quartile 2, while there were no significant differences in mean total cholesterol levels, exercise frequency, meat diet, and vegetable diet.
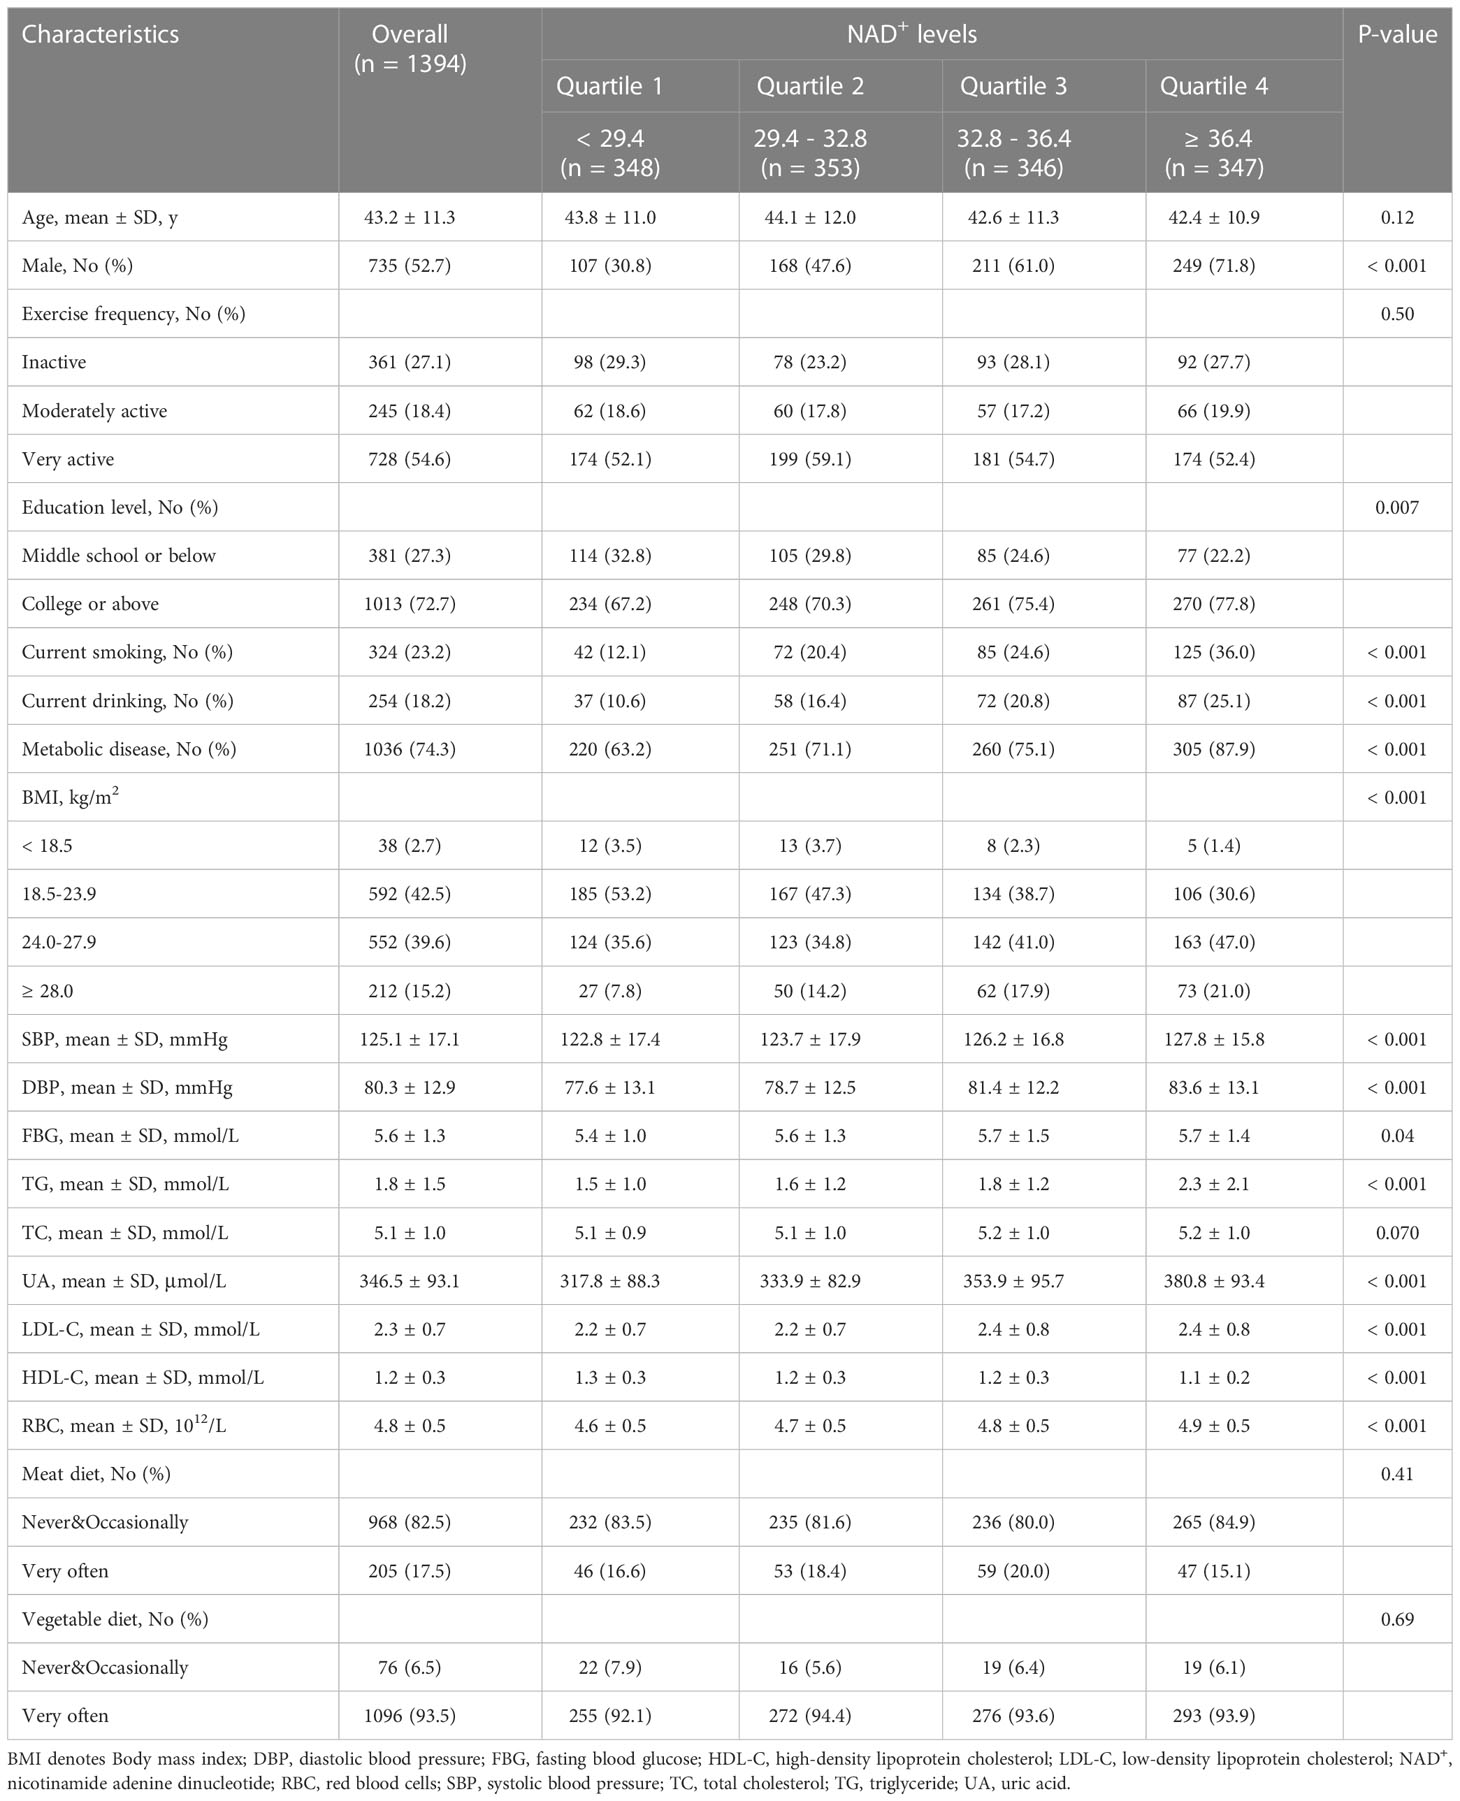
Table 1 Baseline characteristics of eligible participants according to NAD+ levels in the study.
Prevalence of metabolic disease in the study population
Figure 2 illustrates the prevalence of MD and its individual components across NAD+ categories. In the fourth quartile of NAD+, the overall percentage of MD was 87.9%. In the highest NAD+ quartile, the prevalence rates of MD, hypertension, hyperlipidemia, diabetes, hyperuricemia, obesity, and NAFLD were 87.9%, 35.2%, 62.3%, 8.7%, 36.9%, 21.0%, and 60.5%, respectively.

Figure 2 Prevalence of metabolic disease and each component of metabolic disease according to NAD+ levels. Metabolic disease is defined as hypertension, hyperlipidemia, diabetes, hyperuricemia, obesity, or NAFLD among the whole participants. NAFLD, non-alcoholic fatty liver disease; *indicates p < 0.05; **p < 0.01; ***p < 0.001; Comparison between 2nd, 3rd, 4th vs 1st quartile of the NAD+ levels.
Association of NAD+ levels with MD or its components
Table 2 presents the association between NAD+ levels and MD in the entire population after adjusting for confounding variables. Compared to the first NAD+ quartile, the adjusted odds ratio for MD was 3.07 (1.91-4.95) in the highest quartile. Table 3 displays the results of multinomial logistic regression analysis examining the association between NAD+ levels and MD components. Compared to the first NAD+ quartile, the adjusted odds ratio for the highest quartile was 2.49 (1.45-4.28) for the group with 1 MD component and 2.78 (1.48-5.24) for the group with 2 MD components. For the group with 3-6 MD components, the adjusted odds ratio for the highest NAD+ quartile was 4.44 (2.40-8.21), compared to the first quartile of NAD+ levels.
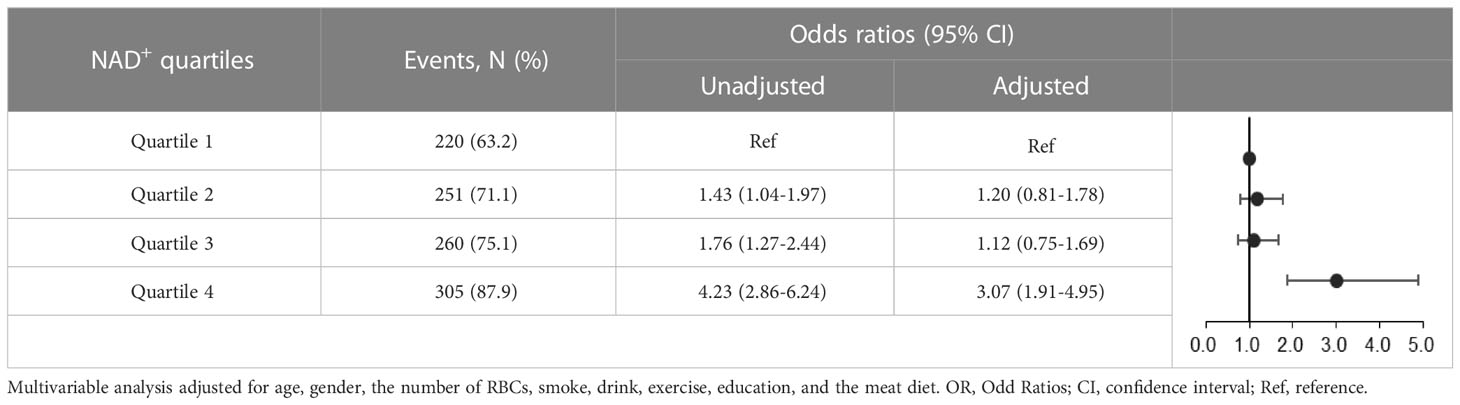
Table 2 Association of NAD+ levels with metabolic disease in the whole population.
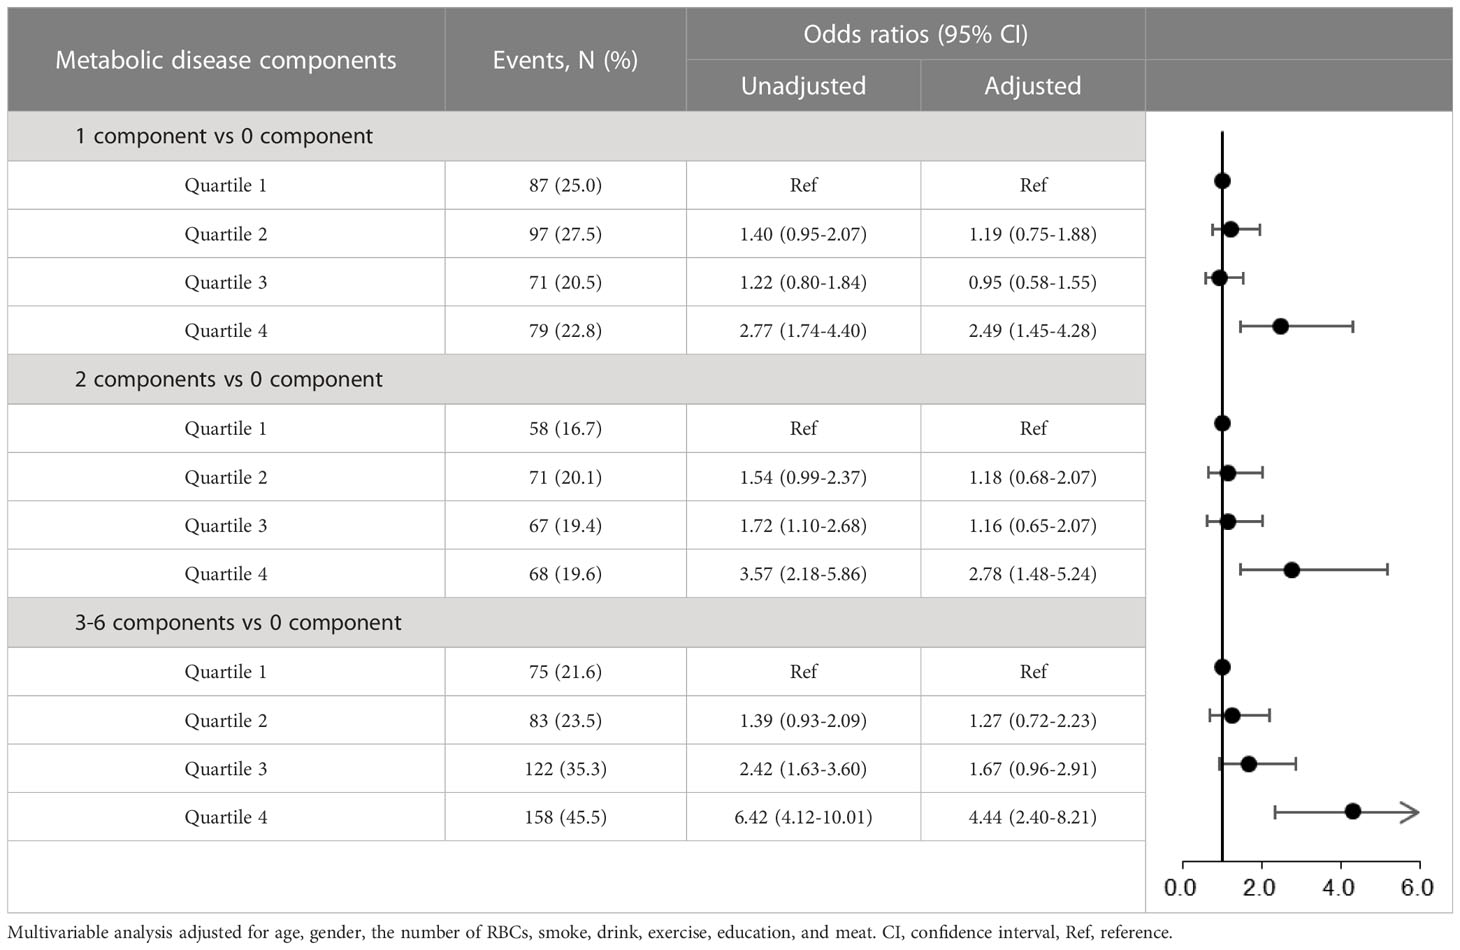
Table 3 Association of NAD+ levels with metabolic disease components in the multivariable analysis among the whole population.
Restricted cubic splines analysis for NAD+ in MD or its components
To illustrate the relationship between NAD+ levels and MD, we utilized restricted cubic splines to depict the risk of MD or its components in a given population (Figure 3). Our findings indicate that the risk of MD remained constant in individuals with NAD+ levels below 31.0 μmol/L, but increased as the levels surpassed 31.0 μmol/L. For those with 1 MD component, the risk slightly decreased before the 31.0 μmol/L threshold but increased afterward. The risk of 2 MD components increased initially, plateaued before 27.0 μmol/L, and then continued to increase. Additionally, the risk of 3-6 MD components began to rise at the 31.0 μmol/L threshold.

Figure 3 Restricted cubic spline plots for associations of NAD+ levels with metabolic disease (A), 1 metabolic disease component (B), 2 metabolic disease components (C), and 3-6 metabolic disease components (D) in the population of interest. Models were adjusted for age, gender, the number of RBCs, smoking, drinking, exercise, education, and meat. The red line and shaded area represent the odds ratios and corresponding 95% confidence intervals.
Stratified analysis for NAD+ in MD or its components
In order to assess the association of NAD+ level with MD, further subgroup analyses were performed by age, sex, drinking, and smoking. The results demonstrated that age, sex, drinking, and smoking did not significantly alter the associations between NAD+ levels and MD or its components (Supplementary Table 1). In addition, the results of the subgroup analysis based on the NAD+ cut-off values were consistent with the results of the NAD+ quartiles (Supplementary Table 2).
Discussion
In the cross-sectional analysis, approximately 75% of the participants were found to have MD. Participants with elevated NAD+ levels of more than 36.4 μmol/L were observed to have a 3-fold higher risk of MD and about a 4.5-fold higher risk of 3-6 MD components, as compared to those with low NAD+ levels of less than approximately 31.0 μmol/L. Furthermore, the risk of MD and its components exhibited a rapid increase around the 31.0 μmol/L mark of NAD+ levels. These associations remained significant and were not significantly altered by age, sex, drinking status, or smoking status. Our findings provide compelling new evidence for the relationship between blood NAD+ levels and MD.
Our study revealed that the prevalence of MD was high, with more than 70% of the study population affected. In 2015, the prevalence of metabolic disease multimorbidity in China was about 30% (25). The reason for the higher prevalence in our was that our definition of MD, which includes at least one chronic disease, differs from the definition of metabolic disease multimorbidity, which requires the presence of two or more chronic conditions. A meta-analysis in 2016 reported the prevalence of metabolic syndrome to be approximately 25% in mainland China (26), while previous studies in other countries, such as the United States (35%) (27), Turkey (44%) (28), and Iran (37%) (29), have reported varying prevalence rates. These differences may be due to regional disparities, data collection methods, or sample population characteristics. In addition, we found that the percentage of diabetes and hypertension was 8.7% and 35.2% in the highest NAD+ quartiles, respectively. However, a previous prospective study reported percentages of diabetes (24.4%) and hypertension (87.9%) among individuals in the highest quartiles of NAD+ precursor level (30). The observed differences may be attributed to variations in the ethnicities of the populations studied. Therefore, further research is warranted to explore the prevalence of MD and its components in large cohort studies.
In our study, higher NAD+ levels were associated with an increased risk of MD and its components. In addition, we observed that there was a significant association of NAD+ levels with the number of metabolic disease components. A study found that pro-neurotensin/neuromedin N (pro-NT/NMN), another NAD+ precursor, was positively associated with incident metabolic syndrome (MetS) (31), which is consistent with our findings of the effect of NAD+ on hyperuricemia and NAFLD. Reasons for Geographic and Racial Differences in Stroke (REGARDS) cohort also showed that elevated systemic pro-NT/NMN was significantly associated with the risk of incident ischemic stroke in the whole population (32). A high level of N1-methyl nicotinamide, the NAD+ precursor, was also strongly associated with both diseases, obesity, and diabetes which is similar to our results (33). Extracellular nicotinamide phosphoribosyltransferase (eNAMPT), the rate-limiting enzyme in the NAD+ synthesis pathway, might play an important role in the pathogenesis of vascular inflammation in obesity and diabetes (34–36). In addition, we could not exclude the possibility that an increase in NAD would be compensatory under pathological conditions. Nevertheless, the results regarding the association of NAD+ with MD remain controversial and need to be further explored by the mechanism of biomedical sciences. It will be necessary for our findings to be verified by other large-scale, prospective, and longitudinal studies in the future.
The NAD+ dose-dependent analysis further supports the above-mentioned association of NAD+ levels with MD or its components. We found that the cut-off point of NAD+ was around 31.0 μmol/L, where the risk of MD began to increase more rapidly. In addition, it has to be mentioned that with increasing NAD+ levels, no statistical difference for MD components was observed, probably due to the limited sample size of our study. However, we did not find that the association of NAD+ with MD was altered by sex, age, drinking, and smoking after analysis based on different subgroups of NAD+ levels. There may be differences due to sample size limitations, but the overall trend was consistent. A study has reported that NAD+ levels are markedly reduced when blood alcohol levels are high (37). Our previous research showed that NAD+ content declines with age, especially in males (19). In our subgroup analysis, the same conclusion was reached. Meanwhile, in this study, we found that relatively high levels of NAD+ were positively associated with MD compared to relatively low levels of NAD+.
The study had several limitations that need to be acknowledged. Firstly, as our analysis was based on cross-sectional data, we were unable to determine causality between MD and NAD+ levels. Secondly, while our study was the first of its kind to be conducted on a large scale in China, it was limited by the sample size. Thirdly, it is important to note that our findings may not be generalizable to other ethnicities or races since our study was conducted solely on participants from a northern Chinese city. Furthermore, we lack data on NAD+-related metabolic compounds in the present study, such as NADH, NAAD, NMN, NAMN, NAM, NA, ADPR, and 5’AMP. In future studies, we will explore the relationship between metabolic disease and compounds of NAD+ comprehensively and systematically.
This study indicated that there was a significant association between high blood NAD+ levels and MD and its components. Specifically, our findings show that the risk of MD starts to increase significantly when NAD+ levels reach 31.0 μmol/L. This novel evidence adds to understanding of the connections between blood NAD+ levels and MD.
Data availability statement
The raw data supporting the conclusions of this article will be made available by the authors, without undue reservation.
Ethics statement
The studies involving human participants were reviewed and approved by the Ethics Committee of the Jidong Oilfield Staff Hospital of China National Petroleum Corporation. The patients/participants provided their written informed consent to participate in this study.
Author contributions
YZ and CZ conceived and designed the study and analyses. YL, XC, and XD analyzed data and drafted the paper. ZJ, FY and JZ washed the data. BW revised it critically for important intellectual content. TZ and XX performed the material preparation and data collection. XL carried out the critical revision of the article. YL, XC, and XD contributed equally. All authors contributed to the article and approved the submitted version.
Funding
This work was supported by the National Key R&D Program of China [Grant Numbers 2021YFC2500500, 2018YFC2000704]; the National Natural Science Foundation of China [Grant Numbers 92049302, 81973112, 91749205]; the Nature Science Fund of Hunan province [Grant Number 2022JJ3051]. The funders had no role in the study design, data collection and analysis, decision to publish, or preparation of the manuscript.
Acknowledgments
The authors thank all the survey teams of the JiDong study group for their contribution and the study participants who contributed their information.
Conflict of interest
The authors declare that the research was conducted in the absence of any commercial or financial relationships that could be construed as a potential conflict of interest.
Publisher’s note
All claims expressed in this article are solely those of the authors and do not necessarily represent those of their affiliated organizations, or those of the publisher, the editors and the reviewers. Any product that may be evaluated in this article, or claim that may be made by its manufacturer, is not guaranteed or endorsed by the publisher.
Supplementary material
The Supplementary Material for this article can be found online at: https://www.frontiersin.org/articles/10.3389/fendo.2023.1164788/full#supplementary-material
References
1. Heber MF, Ptak GE. The effects of assisted reproduction technologies on metabolic health and diseasedagger. Biol Reprod (2021) 104(4):734–44. doi: 10.1093/biolre/ioaa224
2. Kane AE, Sinclair DA. Sirtuins and NAD(+) in the development and treatment of metabolic and cardiovascular diseases. Circ Res (2018) 123(7):868–85. doi: 10.1161/CIRCRESAHA.118.312498
3. Tilg H, Zmora N, Adolph TE, Elinav E. The intestinal microbiota fuelling metabolic inflammation. Nat Rev Immunol (2020) 20(1):40–54. doi: 10.1038/s41577-019-0198-4
4. GBD 2015 Risk Factors Collaborators. Global, regional, and national comparative risk assessment of 79 behavioural, environmental and occupational, and metabolic risks or clusters of risks, 1990-2015: a systematic analysis for the Global Burden of Disease Study 2015. Lancet (2016) 388(10053):1659–724. doi: 10.1016/S0140-6736(16)31679-8
5. Zhu Y, Pandya BJ, Choi HK. Prevalence of gout and hyperuricemia in the US general population: the national health and nutrition examination survey 2007-2008. Arthritis Rheum (2011) 63(10):3136–41. doi: 10.1002/art.30520
6. Kanamori KS, de Oliveira GC, Auxiliadora-Martins M, Schoon RA, Reid JM, Chini EN. Two different methods of quantification of oxidized nicotinamide adenine dinucleotide (NAD(+)) and reduced nicotinamide adenine dinucleotide (NADH) intracellular levels: enzymatic coupled cycling assay and ultra-performance liquid chromatography (UPLC)-mass spectrometry. Bio Protoc (2018) 8(14):e2937. doi: 10.21769/BioProtoc.2937
7. Poljsak B, Kovac V, Spalj S, Milisav I. The central role of the NAD+ molecule in the development of aging and the prevention of chronic age-related diseases: strategies for NAD+ modulation. Int J Mol Sci (2023) 24(3):2959. doi: 10.3390/ijms24032959
8. Sultani G, Samsudeen AF, Osborne B, Turner N. NAD(+) : a key metabolic regulator with great therapeutic potential. J Neuroendocrinol (2017) 29(10):e12508. doi: 10.1111/jne.12508
9. Amjad S, Nisar S, Bhat AA, Shah AR, Frenneaux MP, Fakhro K, et al. Role of NAD(+) in regulating cellular and metabolic signaling pathways. Mol Metab (2021) 49(101195):101195. doi: 10.1016/j.molmet.2021.101195
10. Dahl TB, Haukeland JW, Yndestad A, Ranheim T, Gladhaug IP, Damas JK, et al. Intracellular nicotinamide phosphoribosyltransferase protects against hepatocyte apoptosis and is down-regulated in nonalcoholic fatty liver disease. J Clin Endocrinol Metab (2010) 95(6):3039–47. doi: 10.1210/jc.2009-2148
11. Xiao W, Wang RS, Handy DE, Loscalzo J. NAD(H) and NADP(H) redox couples and cellular energy metabolism. Antioxid Redox Signal (2018) 28(3):251–72. doi: 10.1089/ars.2017.7216
12. Yoshino J, Mills KF, Yoon MJ, Imai S. Nicotinamide mononucleotide, a key NAD(+) intermediate, treats the pathophysiology of diet- and age-induced diabetes in mice. Cell Metab (2011) 14(4):528–36. doi: 10.1016/j.cmet.2011.08.014
13. Gao P, Xu TT, Lu J, Li L, Xu J, Hao DL, et al. Overexpression of SIRT1 in vascular smooth muscle cells attenuates angiotensin II-induced vascular remodeling and hypertension in mice. J Mol Med (Berl) (2014) 92(4):347–57. doi: 10.1007/s00109-013-1111-4
14. Mardinoglu A, Bjornson E, Zhang C, Klevstig M, Soderlund S, Stahlman M, et al. Personal model-assisted identification of NAD(+) and glutathione metabolism as intervention target in NAFLD. Mol Syst Biol (2017) 13(3):916. doi: 10.15252/msb.20167422
15. Melander O, Maisel AS, Almgren P, Manjer J, Belting M, Hedblad B, et al. Plasma proneurotensin and incidence of diabetes, cardiovascular disease, breast cancer, and mortality. JAMA (2012) 308(14):1469–75. doi: 10.1001/jama.2012.12998
16. Fawad A, Bergmann A, Struck J, Nilsson PM, Orho-Melander M, Melander O. Proneurotensin predicts cardiovascular disease in an elderly population. J Clin Endocrinol Metab (2018) 103(5):1940–7. doi: 10.1210/jc.2017-02424
17. Januzzi JL Jr., Lyass A, Liu Y, Gaggin H, Trebnick A, Maisel AS, et al. Circulating proneurotensin concentrations and cardiovascular disease events in the community: the framingham heart study. Arterioscler Thromb Vasc Biol (2016) 36(8):1692–7. doi: 10.1161/ATVBAHA.116.307847
18. Yu J, Laybutt DR, Kim LJ, Quek LE, Wu LE, Morris MJ, et al. Exercise-induced benefits on glucose handling in a model of diet-induced obesity are reduced by concurrent nicotinamide mononucleotide. Am J Physiol Endocrinol Metab (2021) 321(1):E176–89. doi: 10.1152/ajpendo.00446.2020
19. Yang F, Deng X, Yu Y, Luo L, Chen X, Zheng J, et al. Association of human whole blood NAD(+) contents with aging. Front Endocrinol (Lausanne) (2022) 13:829658. doi: 10.3389/fendo.2022.829658
20. Luo Y, Wang X, Matsushita K, Wang C, Zhao X, Hu B, et al. Associations between estimated glomerular filtration rate and stroke outcomes in diabetic versus nondiabetic patients. Stroke (2014) 45(10):2887–93. doi: 10.1161/STROKEAHA.114.005380
21. Wang X, Wang Y, Wang C, Zhao X, Xian Y, Wang D, et al. Association between estimated glomerular filtration rate and clinical outcomes in patients with acute ischaemic stroke: results from China national stroke registry. Age Ageing (2014) 43(6):839–45. doi: 10.1093/ageing/afu090
22. Wang J, Wang Y, Zhao D, Guo X, Zhong JQ. Association between serum uric acid and mortality in a Chinese population of hypertensive patients. Ren Fail (2015) 37(1):73–6. doi: 10.3109/0886022X.2014.964148
23. Pranata R, Henrina J, Yonas E, Putra ICS, Cahyadi I, Lim MA, et al. BMI and atrial fibrillation recurrence post catheter ablation: a dose-response meta-analysis. Eur J Clin Invest (2021) 51(6):e13499. doi: 10.1111/eci.13499
24. Chen X, Shi F, Xiao J, Huang F, Cheng F, Wang L, et al. Associations between abdominal obesity indices and nonalcoholic fatty liver disease: Chinese visceral adiposity index. Front Endocrinol (Lausanne) (2022) 13:831960(831960). doi: 10.3389/fendo.2022.831960
25. Zhao Y, Zhang P, Lee JT, Oldenburg B, van Heusden A, Haregu TN, et al. The prevalence of metabolic disease multimorbidity and its associations with spending and health outcomes in middle-aged and elderly Chinese adults. Front Public Health (2021) 9:658706(658706). doi: 10.3389/fpubh.2021.658706
26. Li R, Li W, Lun Z, Zhang H, Sun Z, Kanu JS, et al. Prevalence of metabolic syndrome in mainland China: a meta-analysis of published studies. BMC Public Health (2016) 16(296):296. doi: 10.1186/s12889-016-2870-y
27. Aguilar M, Bhuket T, Torres S, Liu B, Wong RJ. Prevalence of the metabolic syndrome in the united states, 2003-2012. JAMA (2015) 313:1973–4. doi: 10.1001/jama.2015.4260
28. Gundogan K, Bayram F, Gedik V, Kaya A, Karaman A, Demir O, et al. Metabolic syndrome prevalence according to ATP III and IDF criteria and related factors in Turkish adults. Arch Med Sci (2013) 9(2):243–53. doi: 10.5114/aoms.2013.34560
29. Amirkalali B, Fakhrzadeh H, Sharifi F, Kelishadi R, Zamani F, Asayesh H, et al. Prevalence of metabolic syndrome and its components in the Iranian adult population: a systematic review and meta-analysis. Iran Red Crescent Med J (2015) 17(12):e24723. doi: 10.5812/ircmj.24723
30. Nicoli CD, Howard VJ, Judd SE, Struck J, Manly JJ, Cushman M. Pro-Neurotensin/Neuromedin n and risk of cognitive impairment in a prospective study. J Alzheimers Dis (2020) 76(4):1403–12. doi: 10.3233/JAD-200456
31. Nicoli CD, Carson AP, Plante TB, Leann Long D, McClure LA, Schulte J, et al. Pro-Neurotensin/Neuromedin n and risk of incident metabolic syndrome and diabetes mellitus in the REGARDS cohort. J Clin Endocrinol Metab (2021) 106(9):e3483–94. doi: 10.1210/clinem/dgab355
32. Nicoli CD, Wettersten N, Judd SE, Howard G, Howard VJ, Struck J, et al. Pro-neurotensin/neuromedin n and risk of ischemic stroke: the REasons for geographic and racial differences in stroke (REGARDS) study. Vasc Med (2020) 25(6):534–40. doi: 10.1177/1358863X20957406
33. Liu M, Li L, Chu J, Zhu B, Zhang Q, Yin X, et al. Serum N(1)-methylnicotinamide is associated with obesity and diabetes in Chinese. J Clin Endocrinol Metab (2015) 100(8):3112–7. doi: 10.1210/jc.2015-1732
34. Garten A, Petzold S, Korner A, Imai S, Kiess W. Nampt: linking NAD biology, metabolism and cancer. Trends Endocrinol Metab (2009) 20(3):130–8. doi: 10.1016/j.tem.2008.10.004
35. Verdin E. NAD+ in aging, metabolism, and neurodegeneration. Science (2015) 350(6265):1208–13. doi: 10.1126/science.aac4854
36. Adya R, Tan BK, Chen J, Randeva HS. Nuclear factor-kappaB induction by visfatin in human vascular endothelial cells: its role in MMP-2/9 production and activation. Diabetes Care (2008) 31(4):758–60. doi: 10.2337/dc07-1544
Keywords: nicotinamide adenine dinucleotide, metabolic disease, cross-sectional study, whole blood, population
Citation: Liu Y, Chen X, Deng X, Yang F, Zheng J, Zhou T, Xu L, Xie X, Ju Z, Wang B, Zhang C and Zhou Y (2023) Association of NAD+ levels with metabolic disease in a community-based study. Front. Endocrinol. 14:1164788. doi: 10.3389/fendo.2023.1164788
Received: 20 February 2023; Accepted: 04 April 2023;
Published: 20 April 2023.
Edited by:
Xilin Yang, Tianjin Medical University, ChinaReviewed by:
Dipendra Khadka, Wonkwang University School of Medicine, Republic of KoreaJie Wu, Peking Union Medical College Hospital (CAMS), China
Lixing Zhou, Sichuan University, China
Copyright © 2023 Liu, Chen, Deng, Yang, Zheng, Zhou, Xu, Xie, Ju, Wang, Zhang and Zhou. This is an open-access article distributed under the terms of the Creative Commons Attribution License (CC BY). The use, distribution or reproduction in other forums is permitted, provided the original author(s) and the copyright owner(s) are credited and that the original publication in this journal is cited, in accordance with accepted academic practice. No use, distribution or reproduction is permitted which does not comply with these terms.
*Correspondence: Yong Zhou, eW9uZ3pob3U3ODIxNEAxNjMuY29t; Caiping Zhang, emhhbmdjcGluQDE2My5jb20=; Baoguo Wang, d2FuZ2JnQGNjbXUuZWR1LmNu
†These authors have contributed equally to this work