 Qiyang Chen
 Yujiang Liu
 Linxue Qian
 Xiangdong Hu
- Department of Ultrasound, Beijing Friendship Hospital, Capital Medical University, Beijing, China
Purpose: The aim of this study was to develop and validate a dynamic nomogram by combining conventional ultrasound (US) and contrast-enhanced US (CEUS) to preoperatively evaluate the probability of central lymph node metastases (CLNMs) for patients with papillary thyroid carcinoma (PTC).
Methods: A total of 216 patients with PTC confirmed pathologically were included in this retrospective and prospective study, and they were divided into the training and validation cohorts, respectively. Each cohort was divided into the CLNM (+) and CLNM (−) groups. The least absolute shrinkage and selection operator (LASSO) regression method was applied to select the most useful predictive features for CLNM in the training cohort, and these features were incorporated into a multivariate logistic regression analysis to develop the nomogram. The nomogram’s discrimination, calibration, and clinical usefulness were assessed in the training and validation cohorts.
Results: In the training and validation cohorts, the dynamic nomogram (https://clnmpredictionmodel.shinyapps.io/PTCCLNM/) had an area under the receiver operator characteristic curve (AUC) of 0.844 (95% CI, 0.755–0.905) and 0.827 (95% CI, 0.747–0.906), respectively. The Hosmer–Lemeshow test and calibration curve showed that the nomogram had good calibration (p = 0.385, p = 0.285). Decision curve analysis (DCA) showed that the nomogram has more predictive value of CLNM than US or CEUS features alone in a wide range of high-risk threshold. A Nomo-score of 0.428 as the cutoff value had a good performance to stratify high-risk and low-risk groups.
Conclusion: A dynamic nomogram combining US and CEUS features can be applied to risk stratification of CLNM in patients with PTC in clinical practice.
1 Introduction
Papillary thyroid carcinoma (PTC) is the most common type of thyroid cancer, accounting for 80%–90% of all thyroid carcinomas (1, 2). PTC is a lymphotropic tumor, and 20%–90% of patients with PTC develop cervical lymph node metastasis (LNM), and approximately 70% of these cases involve central lymph node metastasis (CLNM) (3, 4). For patients with PTC, CLNM is an important risk factor for distant metastasis or tumor recurrence and an indicator for surgical strategy (5–8); in these cases, central compartment lymph node dissection (CLND) is recommended (9). However, preoperative identification of CLNM has been a challenge. Approximately 45% of PTC patients with clinically negative central ventricular LNs (cN0) were reported to have CLNM pathologically confirmed after surgery (10). Whether prophylactic CLND should be performed in cN0 PTC patients is still under debate, possibly raising risks of nerve injury and hypoparathyroidism (11). Therefore, accurate and noninvasive preoperative prediction of CLNM has been of increasing importance in clinical practice to optimize treatment decisions.
Conventional ultrasound (US) is the first-line modality for evaluating thyroid nodules and cervical lymph nodes (9). However, US is limited in detecting CLNM because of interference of the thyroid gland and adjacent organs. As reported, just 30.0%–53.2% of cases with CLNM could be detected by US (2, 12, 13). In recent years, some US-based imaging modalities were proposed to enhance the capability of identifying CLNM. A radiomics nomogram based on the shear wave elastography (SWE) was established by Jiang et al. (7). However, SWE has not been widely used in clinical practice.
Contrast-enhanced US (CEUS) is an imaging modality that reveals tumor microvascular perfusion through the accumulation of contrast agent microbubbles in blood vessels (14). CEUS has been widely applied to distinguish benign and malignant thyroid nodules (15, 16). Several studies reported that CEUS may be a potential tool to predict CLNM in patients with PTC (14, 17). However, most studies focused on CEUS features alone and failed to provide a feasible and generalizable prediction model.
In this study, we aimed to develop and validate a nomogram by combining US and CEUS features to facilitate preoperative risk stratification for individualizing treatment decision.
2 Materials and methods
2.1 Patients
This two-way cohort study was approved by the Ethics Committee of our hospital. The requirement for individual consent for retrospective data was waived. All patients with prospective data signed informed consent.
Patients who underwent total or partial (lobectomy or near-total thyroidectomy) thyroidectomy for PTC between January 2017 and December 2019 were retrospectively evaluated from the institutional database. From February 2021 to October 2021, we prospectively recruited PTC patients who were diagnosed by ultrasound-guided fine needle aspiration and prepared to receive surgery in our institution. Patients were enrolled according to the following inclusion criteria (1): solitary PTC was determined pathologically; (2) CLND was performed; and (3) US and CEUS were performed preoperatively. The exclusion criteria were as follows: (1) maximum tumor diameter was <5 mm (CEUS is limited by respiratory motion and volume effect); (2) US or CEUS image was incomplete or unclear; (3) skip metastases were found; and (4) history of secondary malignancy.
A total of 216 patients with pathologically confirmed PTC were included. The patients were divided into the training and validation cohorts, with a patient ratio in the training to validation cohorts of 1:1. The training cohort consisted of 108 patients (33 male and 75 female patients; mean age, 43.72 ± 12.44 years), and the validation cohort enrolled 108 patients (20 male and 88 female patients; mean age, 44.4 ± 11.48 years) who were randomly selected from the prospective data. Each cohort was divided into CLNM (+) and CLNM (−) groups according to the pathology results. Figure 1 shows the patient selection.
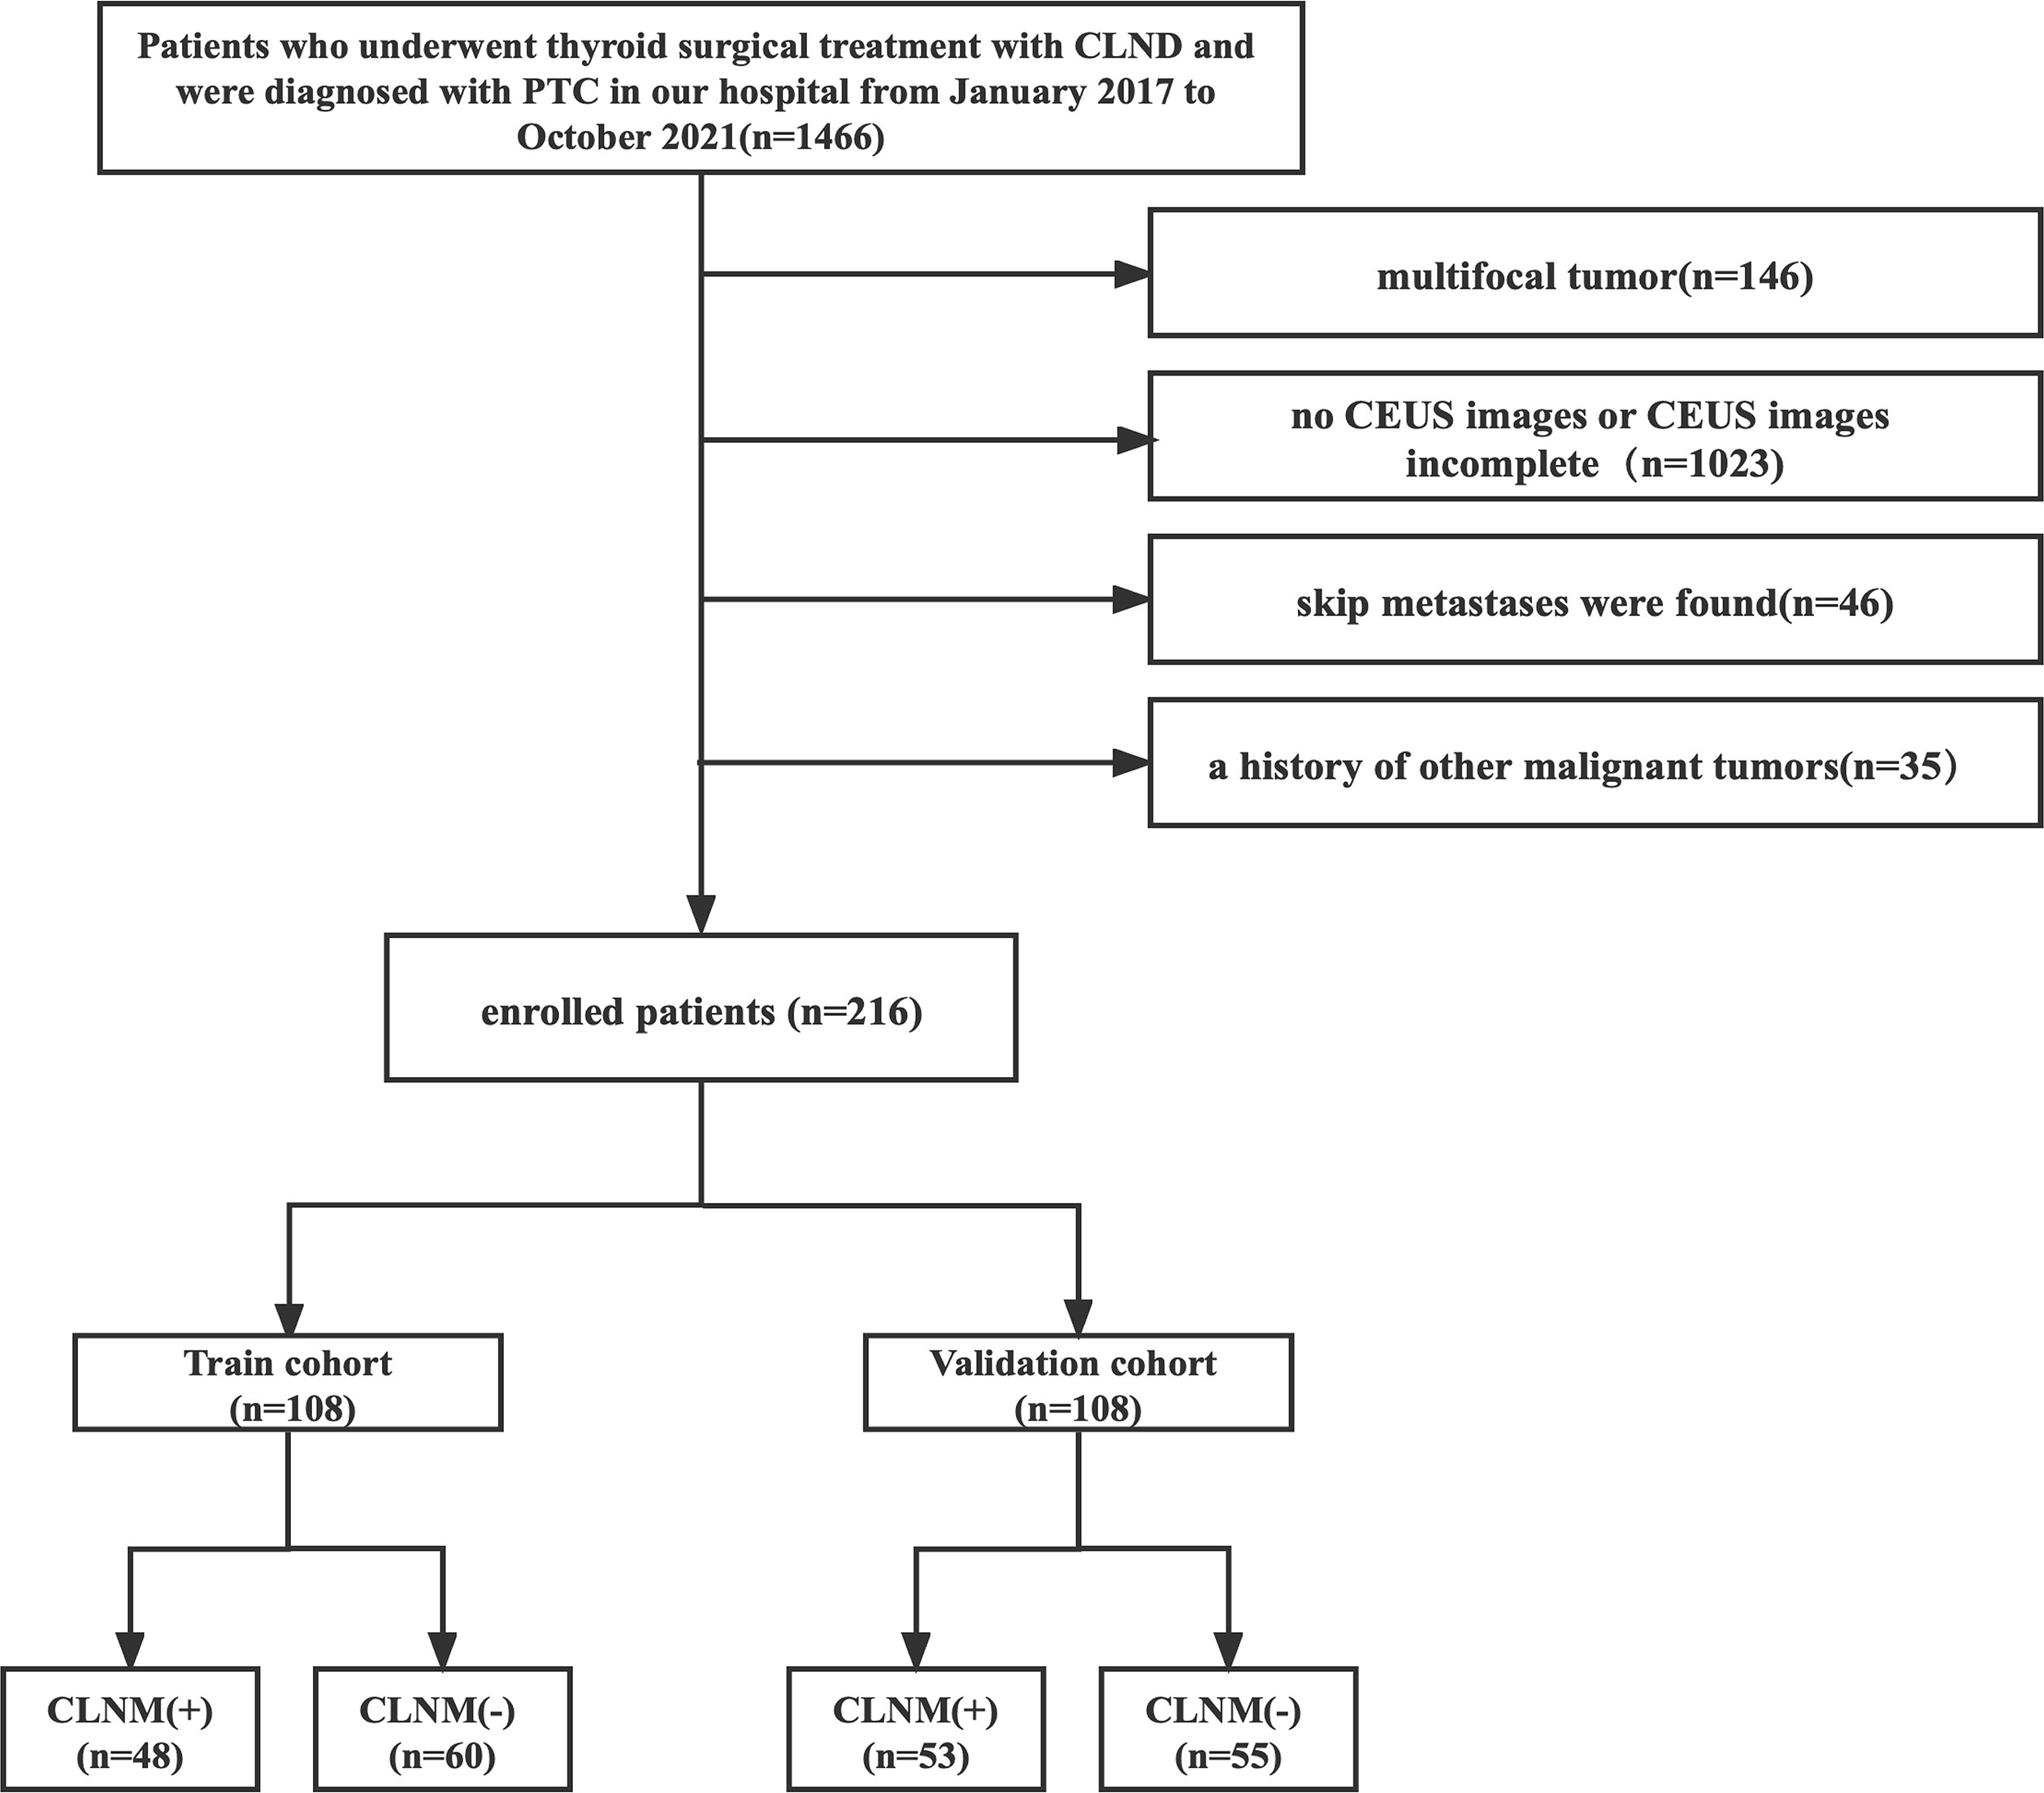
Figure 1 Flowchart of patient enrollment in the study.
2.2 US and CEUS image acquisition
Training cohort images were acquired with an EPIQ5 (Philips Ultrasound, Inc., Bothell, Washington, USA) system equipped with a 5- to 12-MHz linear probe, and validation cohort images were acquired with a Resona7 (Shenzhen Mindray Bio-Medical Electronics Co., Ltd., Shenzhen, China) system equipped with a 5- to 12-MHz linear probe. US and CEUS images for individuals were obtained from the same instruments. SonoVue (Bracco, SpA, Milan, Italy) was used for all patients as a contrast agent with a mechanical index of 0.08 and a volume of 1.2–2.4 ml (2.4 ml in the validation cohort) when CEUS was performed. The US features of the lesion were carefully evaluated, including size, location, margin, echogenicity, aspect ratio, calcification, and contact with the capsule. The longitudinal plane with the clear lesion was selected for CEUS. The contrast agent was injected intravenously as a bolus, followed by a 5-ml saline flush (0.9% sodium chloride). All CEUS images were observed for 3 min and stored on the hard disk for further analysis.
The US and CEUS features were independently analyzed by two experienced radiologists (with more than 10 years of experience in thyroid imaging) blinded to pathological outcomes. If the radiologists disagreed, a consensus was obtained by discussion.
2.3 Conventional US image analysis
US features were characterized as follows. Size refers to the maximum tumor diameter. The location was classified into the left lobe, right lobe, and isthmus. The margin was divided into regular or irregular. Echogenicity was classified into hypoechoic, isoechoic, or hyperechoic relative to surrounding thyroid parenchyma. The aspect ratio was classified as ≤1 or >1. Contact with the capsule was described as yes or no according to whether more than 20% of the tumor was touching the thyroid capsule or an absence of echogenicity of the thyroid capsule on US.
2.4 CEUS image analysis
The CEUS qualitative parameters were defined as follows: (1) enhancement patterns (centripetal or hybrid enhancement), (2) homogeneity of enhancement (homogeneous or heterogeneous), (3) enhancement intensity (hypo-enhancement, iso-, or hyperenhancement compared with surrounding thyroid parenchyma), (4) time of wash-in (earlier or concurrent and later), (5) time of wash-out time (earlier or concurrent and later), and (6) discontinuous capsular enhancement (anterior and/or posterior hyperechoic thyroid capsular was discontinued).
The CEUS quantitative parameters were obtained by QLAB or Resona7 system software. The region of interest (ROI) was first outlined along the outer margin of the tumor, defined as ROI1. ROI2 was copied from ROI1 and outlined in the surrounding thyroid parenchyma at the same tumor depth. Two time–intensity curves (TIC) were obtained. The analysis time was the first 60 s of the dynamic CEUS images. TIC parameters included the following: (1) wash in slope (WIS), (2) time to peak (TP), (3) peak intensity (PI), and (4) area under the curve (AUC). These values were measured three times for each tumor and averaged as PROI1 and PROI2. The ratio of PROI1 to PROI2 (PROI1/ROI2) was used for comparison to reduce the potential effect of differences from the imaging system, image analysis software, and contrast agent doses.
2.5 Feature selection and model construction
The least absolute shrinkage and selection operator (LASSO) regression with penalty parameter tuning conducted by 10-fold cross-validation was applied in the training cohort to select useful predictive features for CLNM. Univariate and multivariate logistic analyses were performed to identify the risk factors of CLNM. The prediction model was established by combining LASSO and multivariate logistic regression analysis and presented in the form of a nomogram.
2.6 Evaluation and validation of the model
The prediction model’s performance was evaluated by receiver operating characteristic (ROC) curves in the training and validation cohorts. AUC was calculated to assess the discrimination performance of the prediction model in the training and validation cohorts. Calibration of the nomogram was evaluated using the calibration curve and Hosmer–Lemeshow test.
2.7 Clinical utility of the prediction model
To estimate the predictive value of the prediction model, decision curve analysis (DCA) was performed by quantifying the net benefits at different threshold probabilities in the validation cohort.
The Nomo-score, that is, the nomogram-predicted probability, was calculated in each patient. The cutoff value of the Nomo-score was obtained through the maximum Youden index, and patients were classified as high risk and low risk using this value.
2.8 Statistical analysis
Statistical analysis was conducted with SPSS Statistics version 26.0 (IBM Corp.), R software version 4.1.0 (The R Foundation for Statistical Computing), and GraphPad Prism 9.0. Quantitative data were presented as mean ± standard deviation, and Mann–Whitney U tests were used for comparison. Categorical data were presented as numbers and percentages, and the chi-square test was used for comparison. The Delong test was used in ROC. The two-sided p < 0.05 was considered as significant difference.
3 Results
3.1 Patient characteristics
Clinical characteristics, US, and CEUS features of all patients are summarized in Table 1. Except for margin, aspect ratio, and time of wash-in, there were no differences in characteristics between the two cohorts (p > 0.05). The rates of CLNM were 44.4% (48/108) and 49.1% (53/108) in the training and validation cohorts, respectively, with no significant difference found between the cohorts (p = 0.495).

Table 1 Characteristics of patients in the training and validation cohorts.
3.2 Correlation between clinical characteristics and CLNM
As shown in Table 2, sex, age, tumor size, enhancement intensity, and homogeneity of enhancement were significantly different between CLNM (+) and CLNM (−) subgroups of patients with PTC in both the training and validation cohorts (p < 0.05). The ROC curve showed that the best cutoff values of age and tumor size were 42 years with an AUC of 0.675 and 0.95 cm with an AUC of 0.709, respectively.
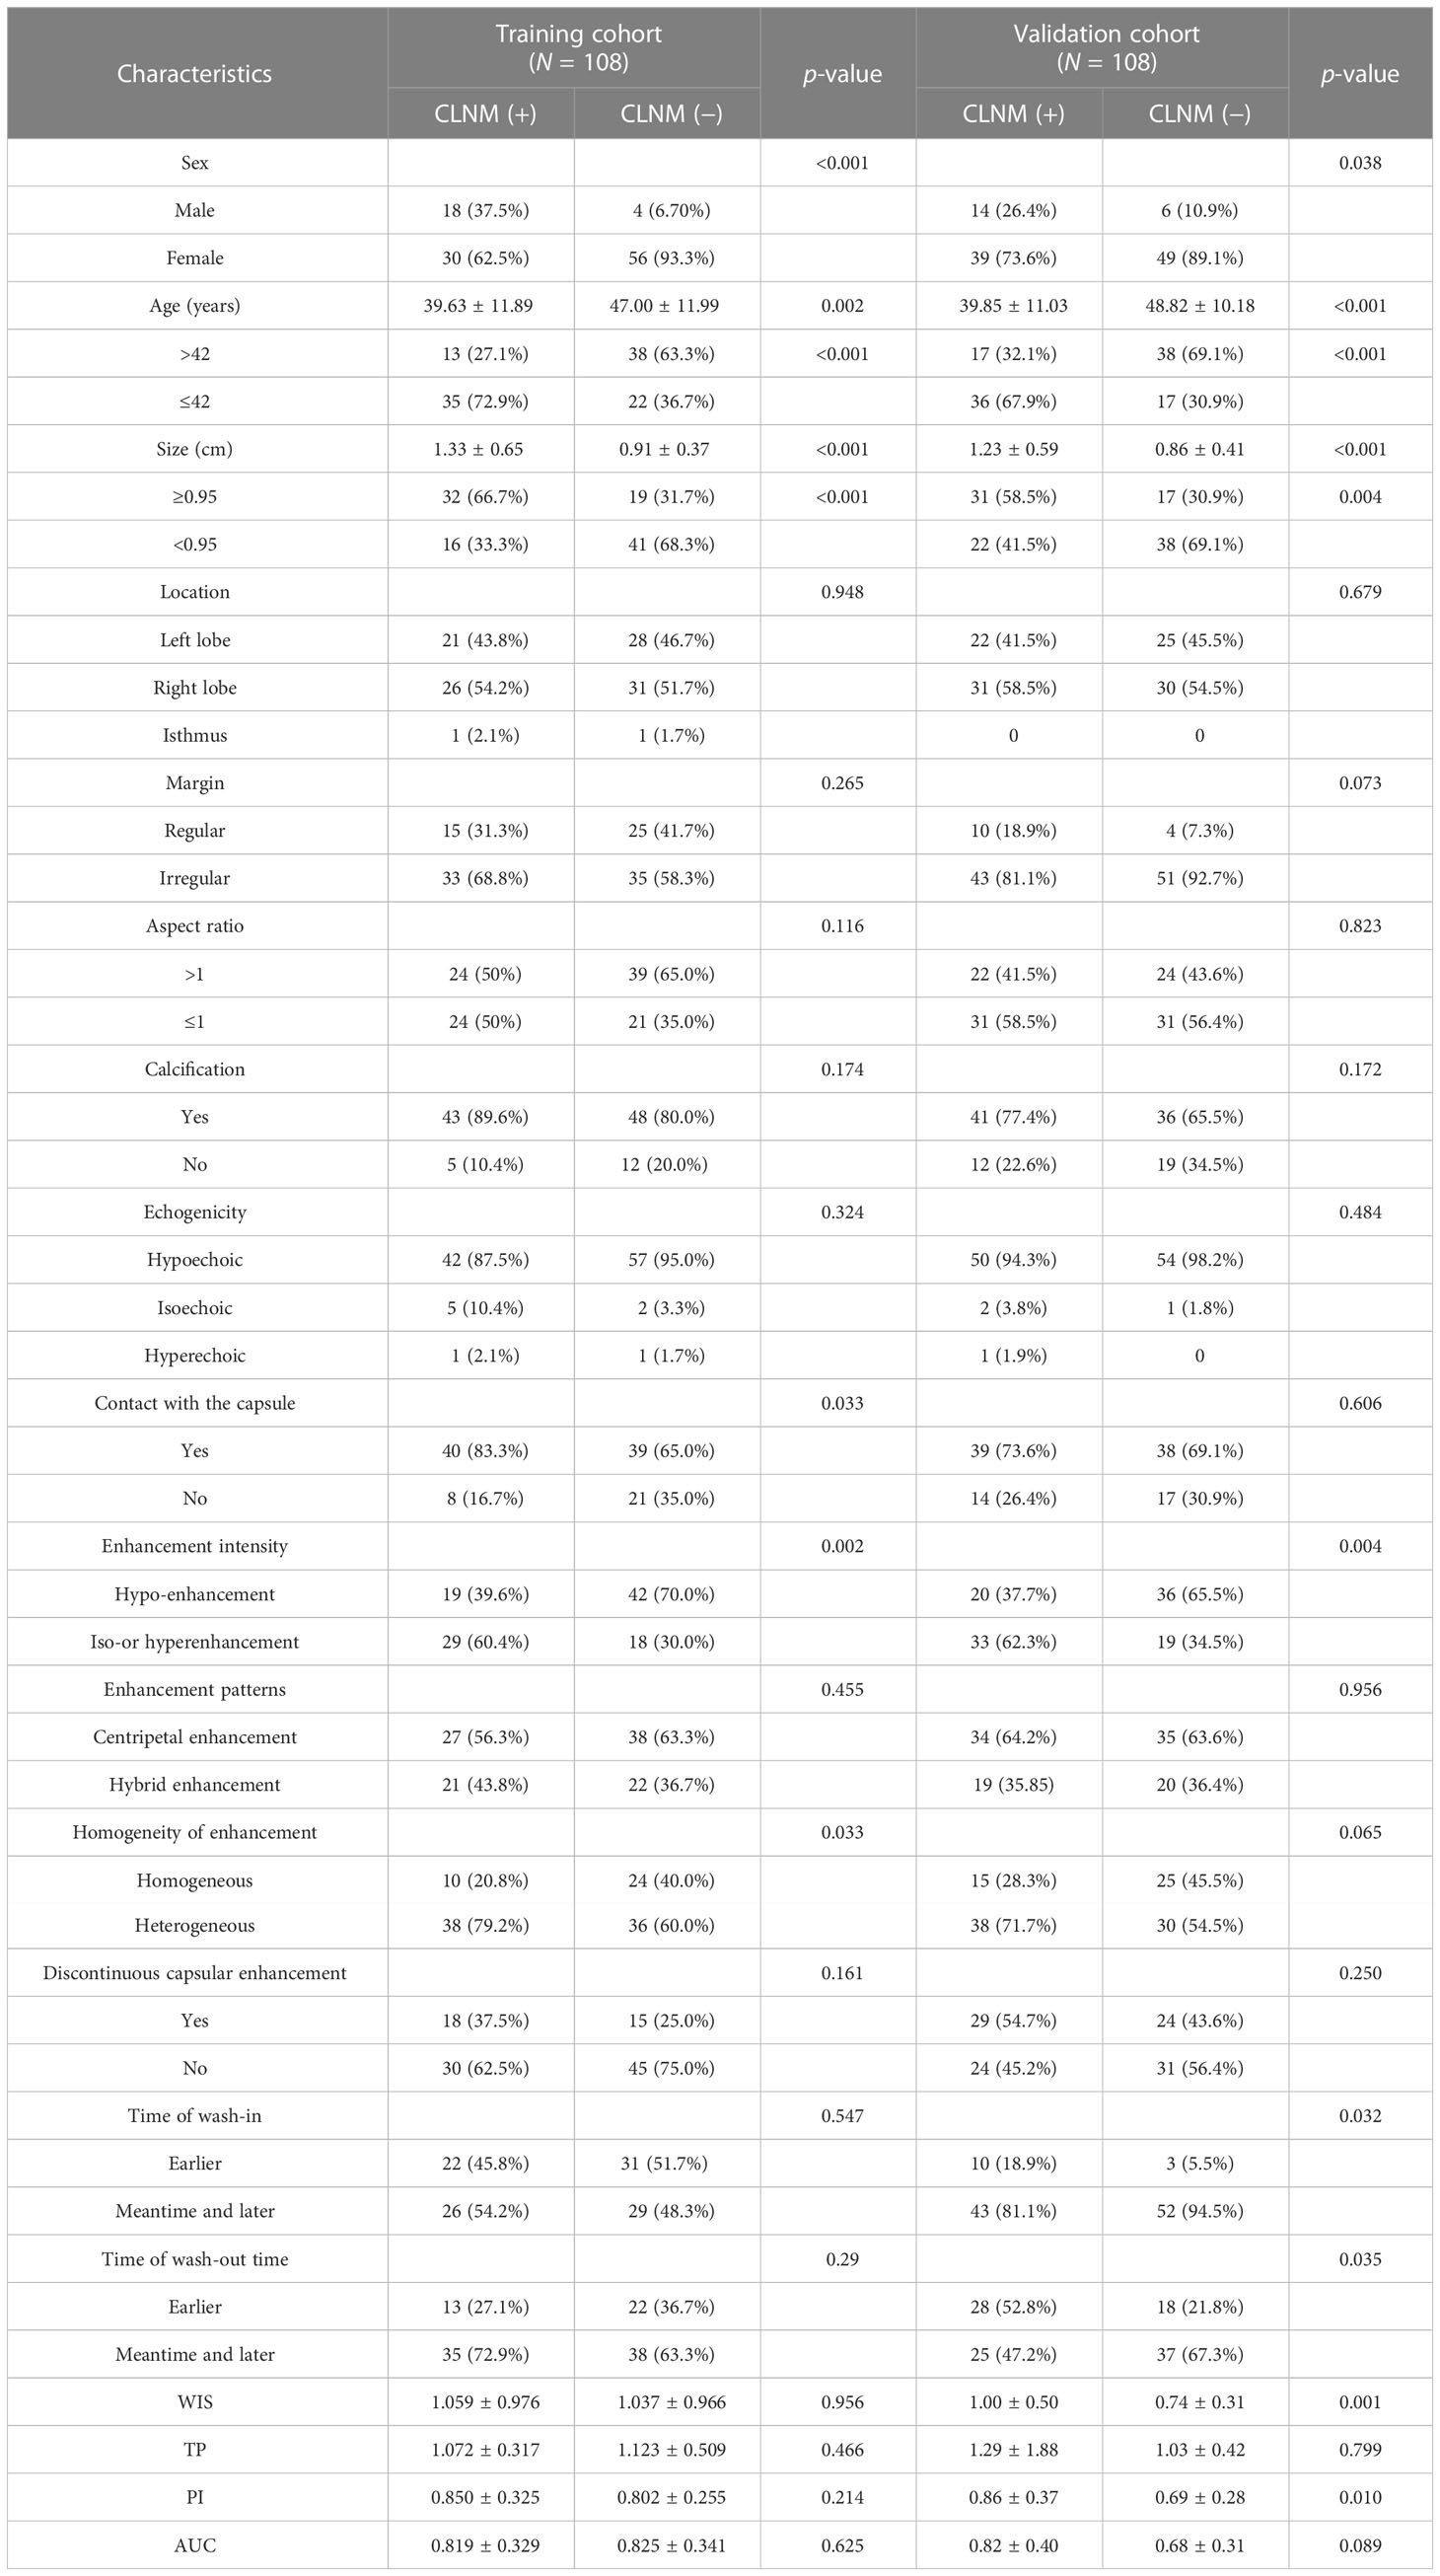
Table 2 Associations between the lymph node status and characteristics of patients in the training and validation cohorts.
Contact with the capsule was associated with CLNM only in the training cohort (p = 0.033). Differences of WIS (p = 0.001) and PI (p = 0.010) between CLNM (+) and CLNM (−) groups were only observed in the validation cohort. There was no significant difference in other clinical characteristics. There were no differences of US and CEUS features between CLNM (+) and CLNM (−) patients with PTC (p > 0.05).
3.3 Feature selection and model construction
In the training cohort, LASSO regression analysis was performed to select the useful predictive features for CLNM, including sex, age (≤42 years), size, and enhancement intensity (Figure 2). Multivariate logistic regression analysis revealed that sex, age (≤ 42 years), size, enhancement intensity, and homogeneity of enhancement were independent risk factors for CLNM (Table 3). All these risk factors were incorporated into the prediction model (Figure 3). This prediction model is displayed as a dynamic nomogram (https://clnmpredictionmodel.shinyapps.io/PTCCLNM/).
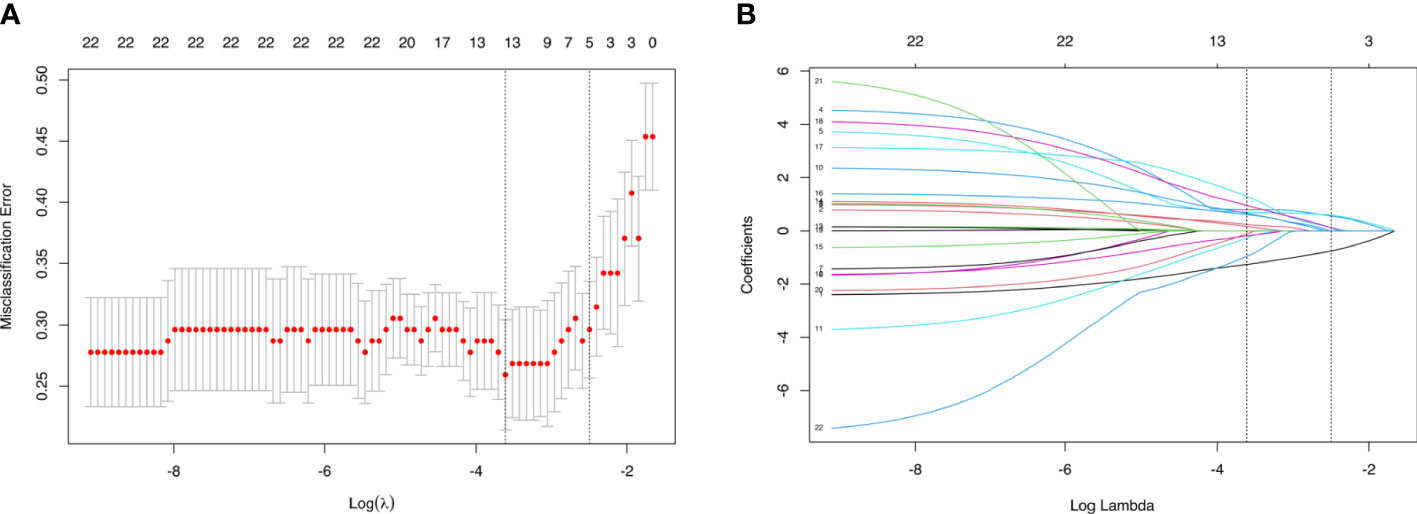
Figure 2 Parameters of prediction model selection using the LASSO logistic regression model in the training cohort. (A) The area under the receiver operating characteristic curve was plotted versus log (λ). (B) The features were profiled by the LASSO coefficient.
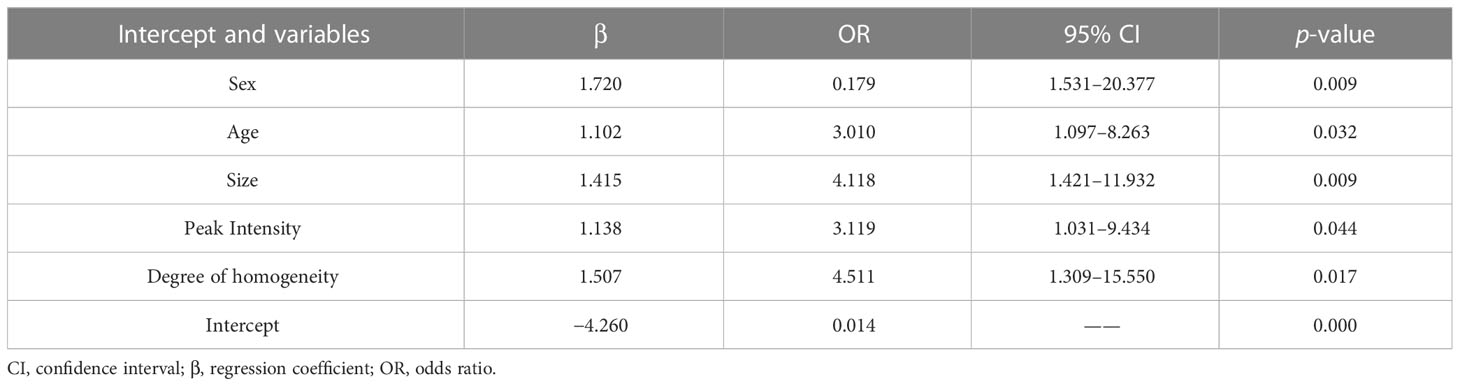
Table 3 Risk factors for cervical lymph node metastasis in the prediction model.
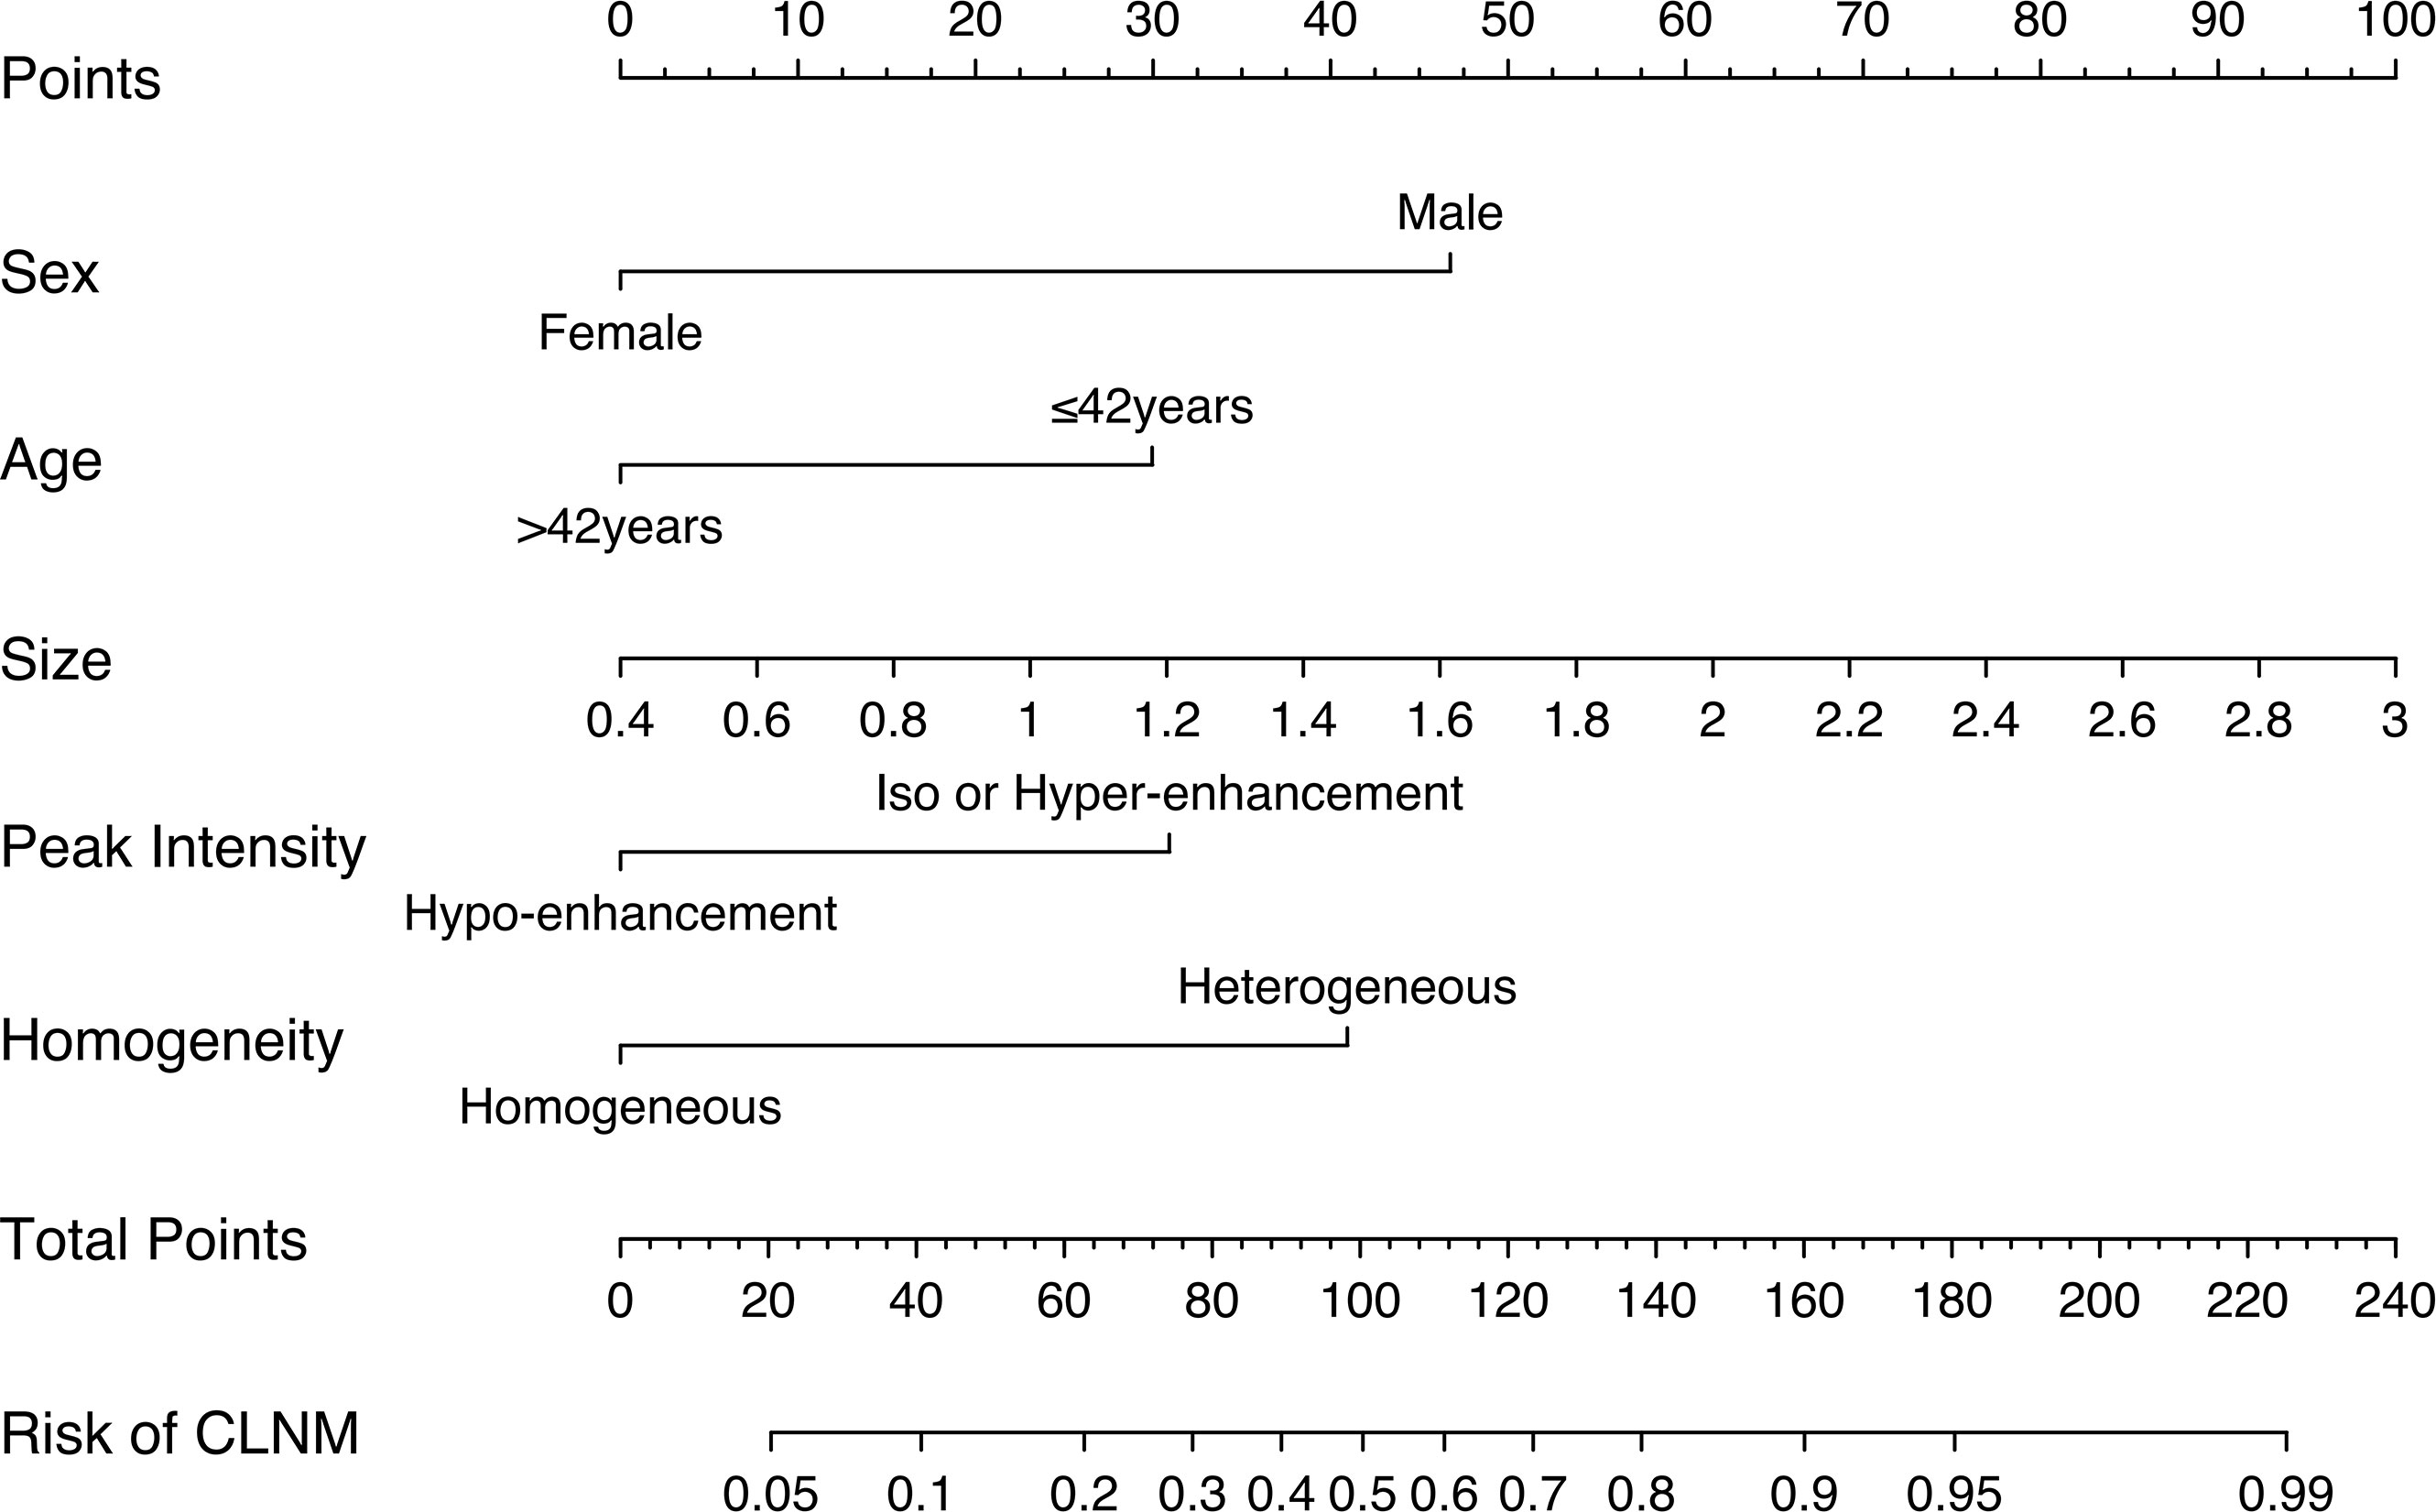
Figure 3 Nomogram of the prediction model to assess the risk of CLNM in patients with PTC.
3.4 Evaluation and validation of the prediction models
The ROC curves of the prediction model and the single ultrasonic features in the training and validation cohorts are shown in Figure 3. There was good discrimination of the prediction model in the training (AUC: 0.844, 0.773–0.915) or validation (AUC: 0.827, 0.747–0.906) cohorts (Table 4). The AUC value of the prediction model was higher compared with any single US or CEUS feature (p < 0.05) (Figure 4).
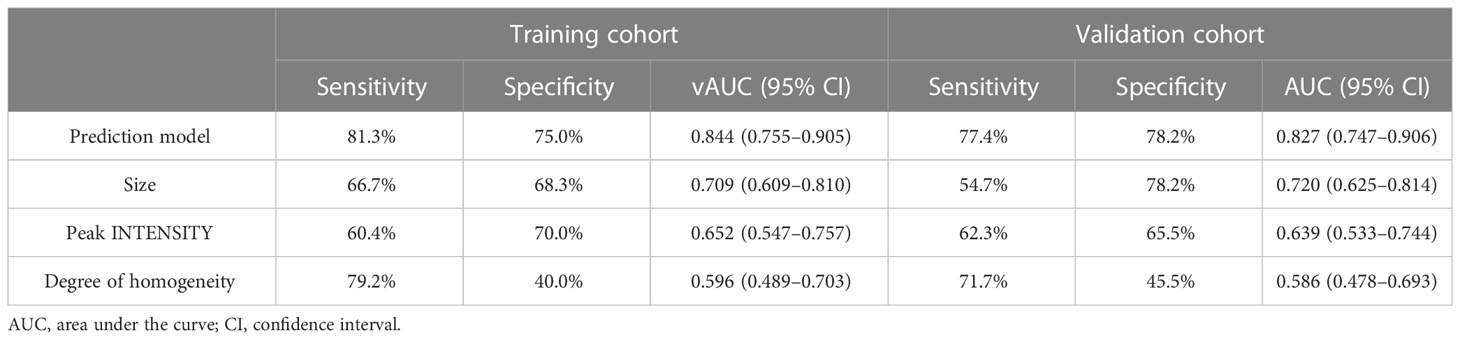
Table 4 Performance of prediction model and the single US and CEUS features in the training and validation cohorts.
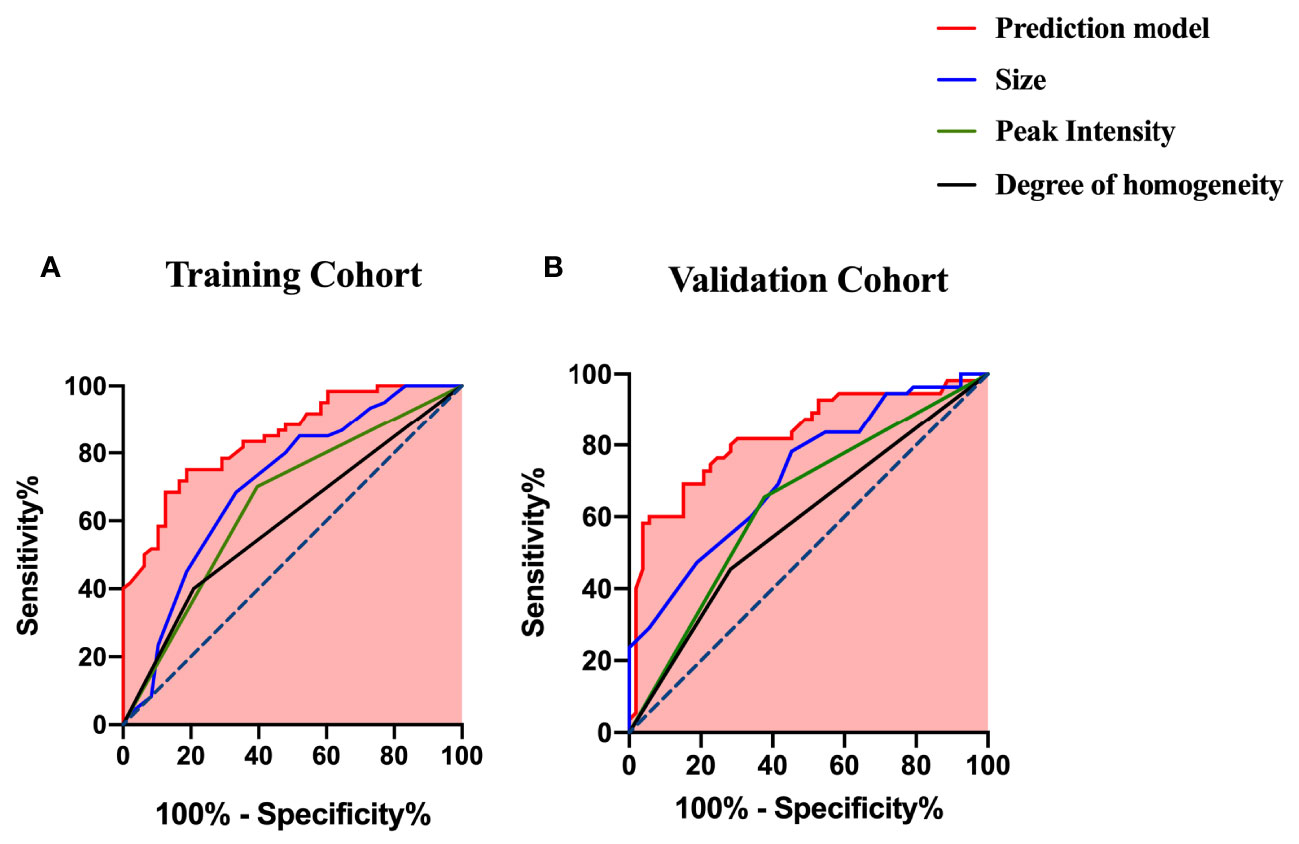
Figure 4 ROC curves of the prediction model and the single US and CEUS features for predicting CLNM (A) in the training cohort and (B) in the validation cohort.
The calibration curve and Hosmer–Lemeshow test showed that the prediction model had good concordance in the training (p = 0.385) and validation (p = 0.285) cohorts (Figure 5).
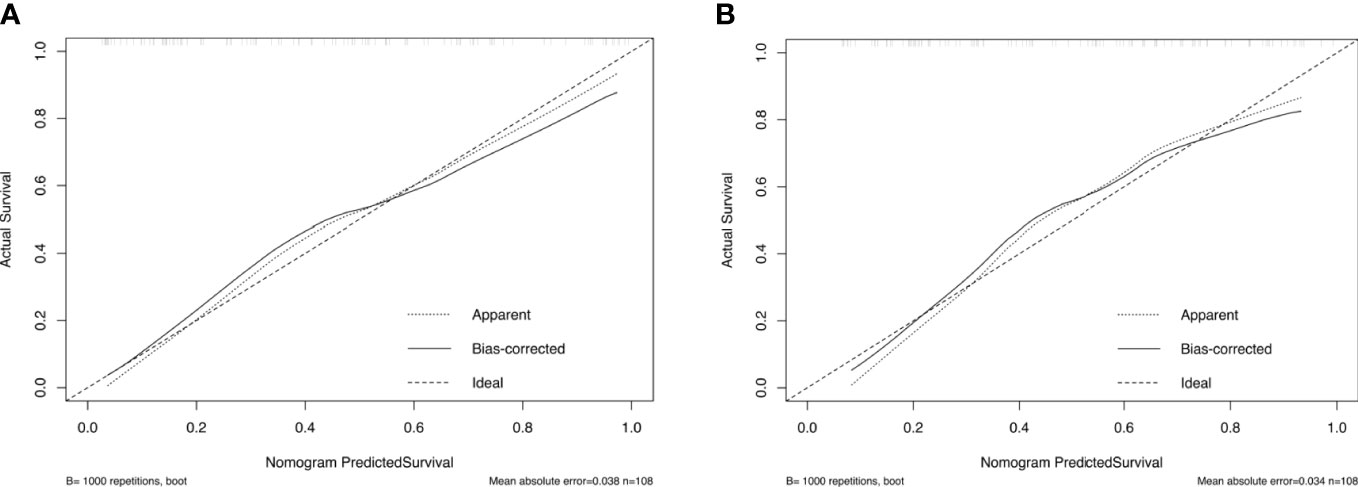
Figure 5 Calibration curves of the nomogram in the training (A) and validation (B) cohorts.
3.5 Clinical use
The DCA results of the prediction and clinical models are presented in Figure 6. Based on the DCA results, the prediction model has a higher clinical net benefit rate than the US or CEUS features alone in predicting CLNM when the threshold probability is between 7% and 82%.
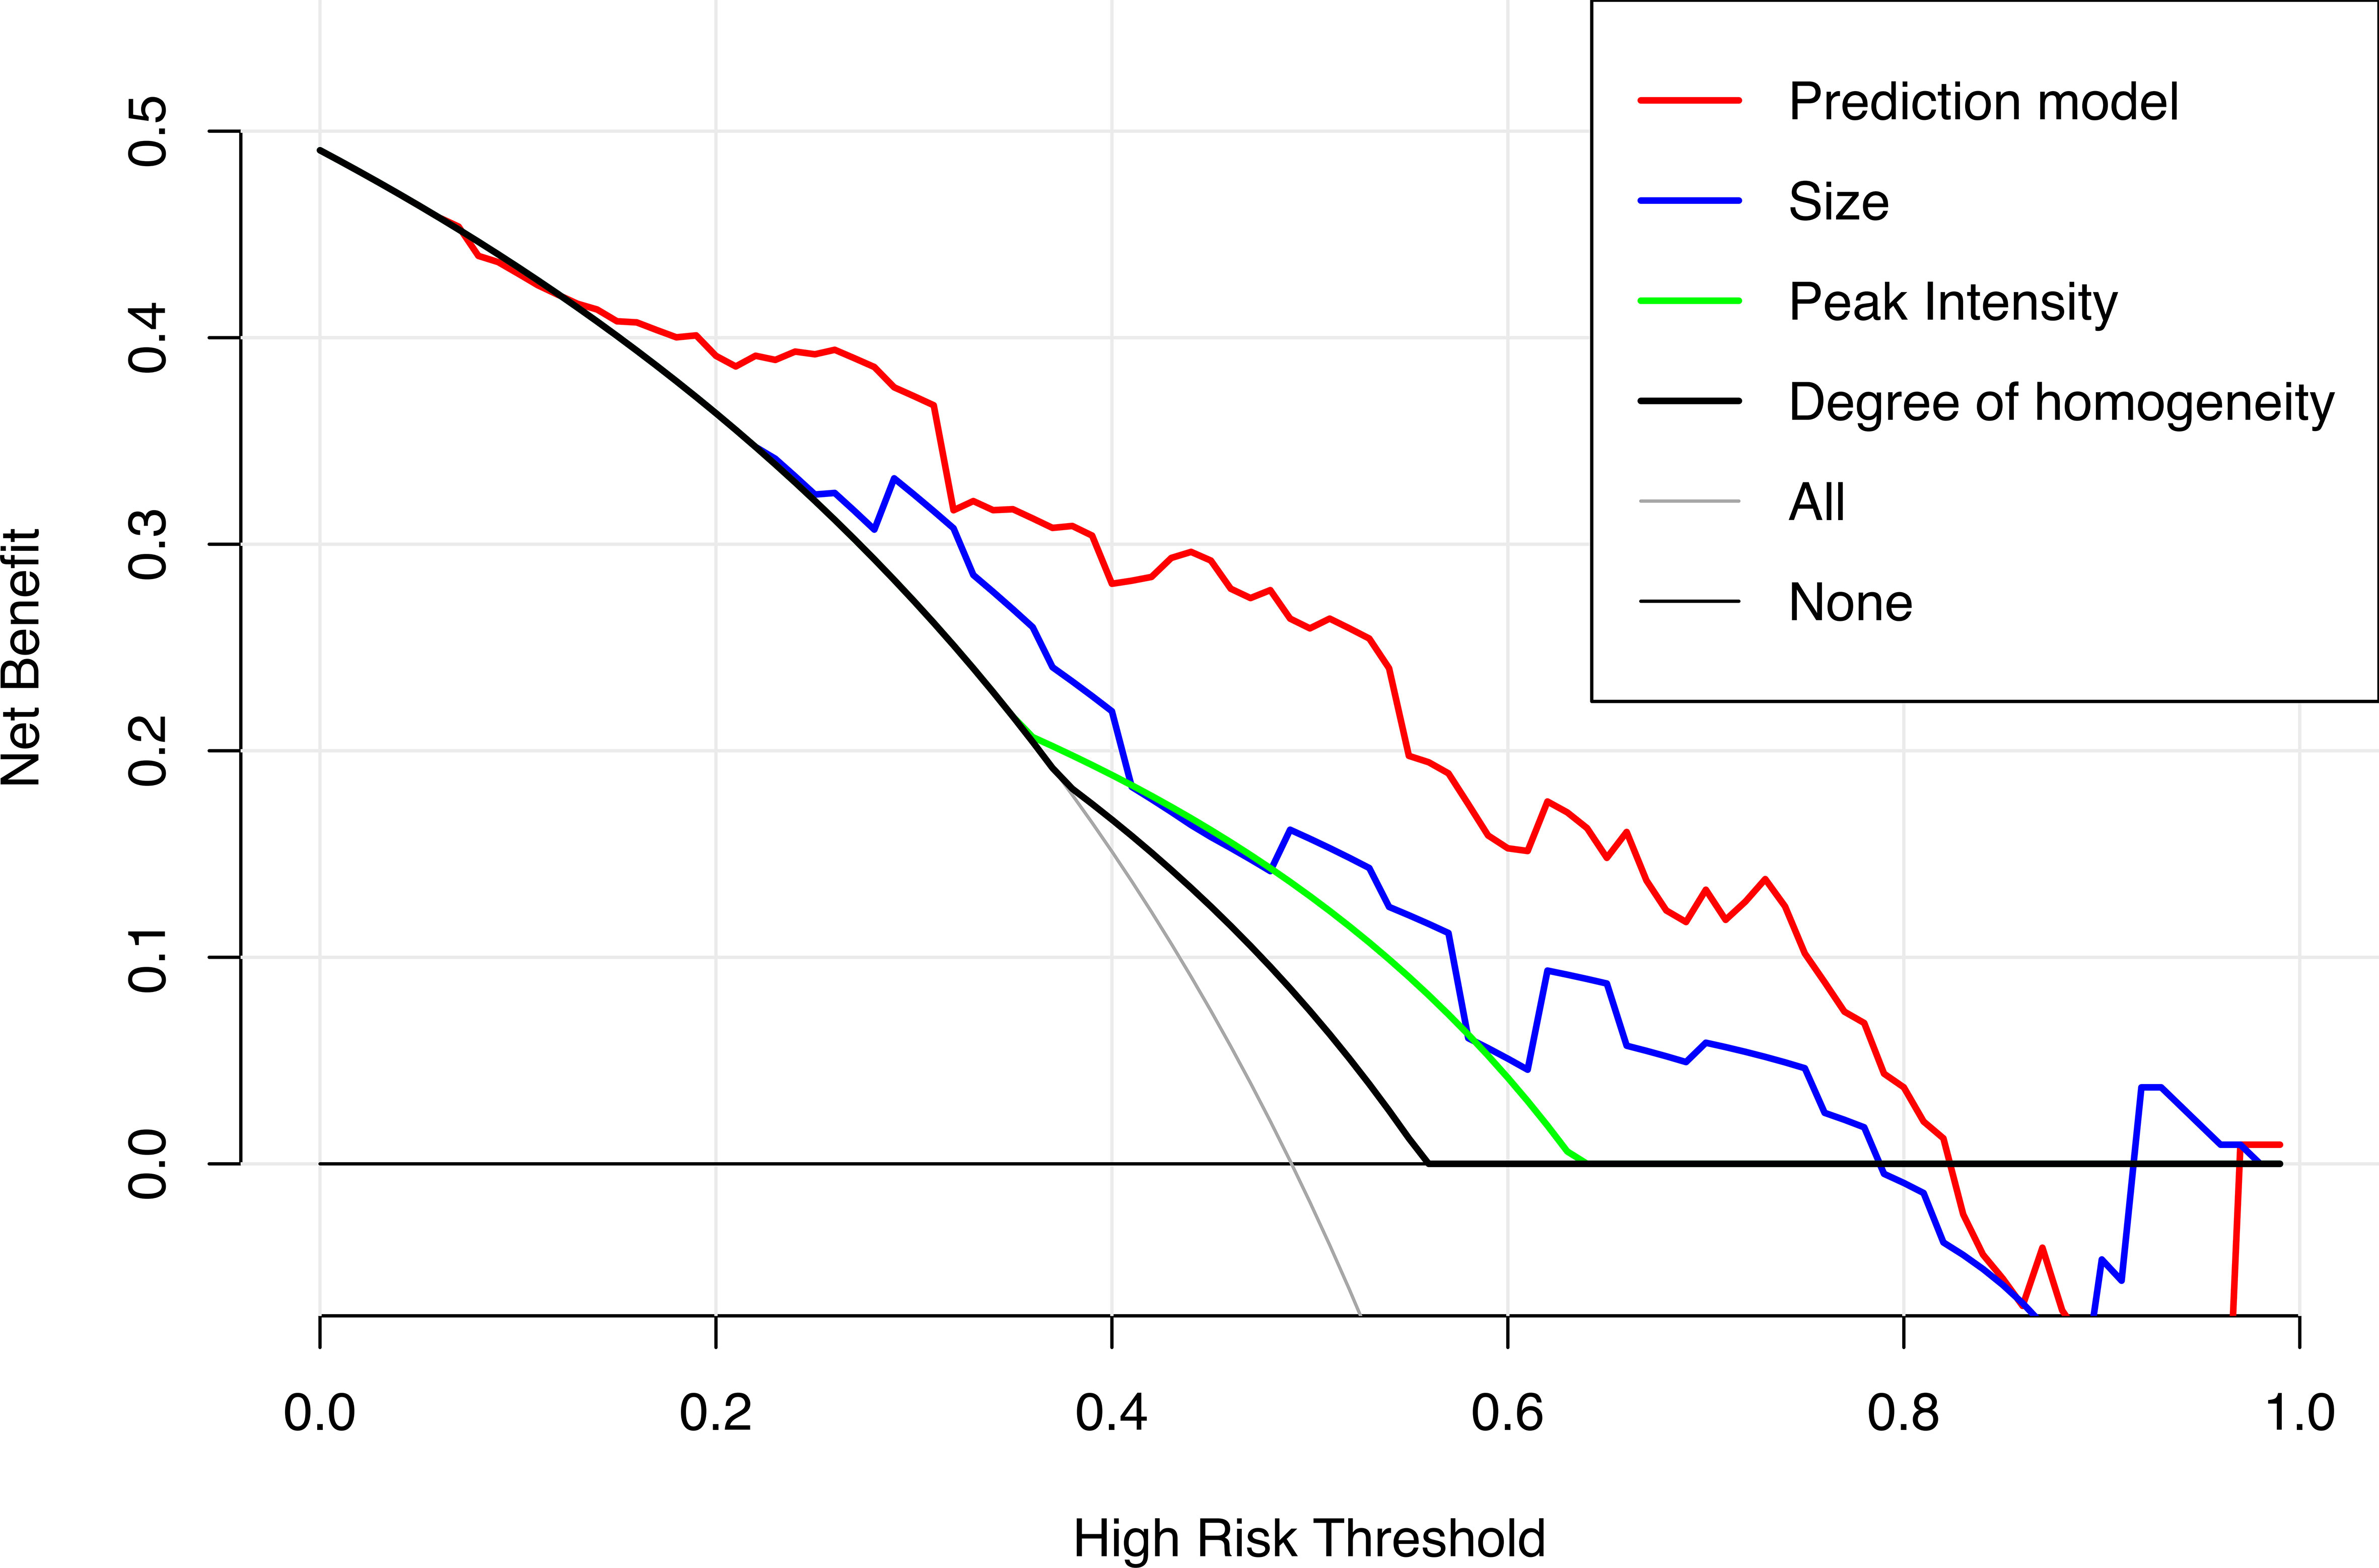
Figure 6 Decision curves of the prediction model and the single US and CEUS features in predicting CLNM for papillary thyroid carcinoma.
The cutoff value of the Nomo-score for the diagnosis of CLNM was ≥0.428. We divided patients into low-risk (100 patients) and high-risk groups (116 patients) using this cutoff value. Patients in the high-risk group were more likely to have CLNM (p < 0.001). CLNM (+) and CLNM (−) were discriminated well with a cutoff value of 0.428 in both the training and validation cohorts (Figure 7).
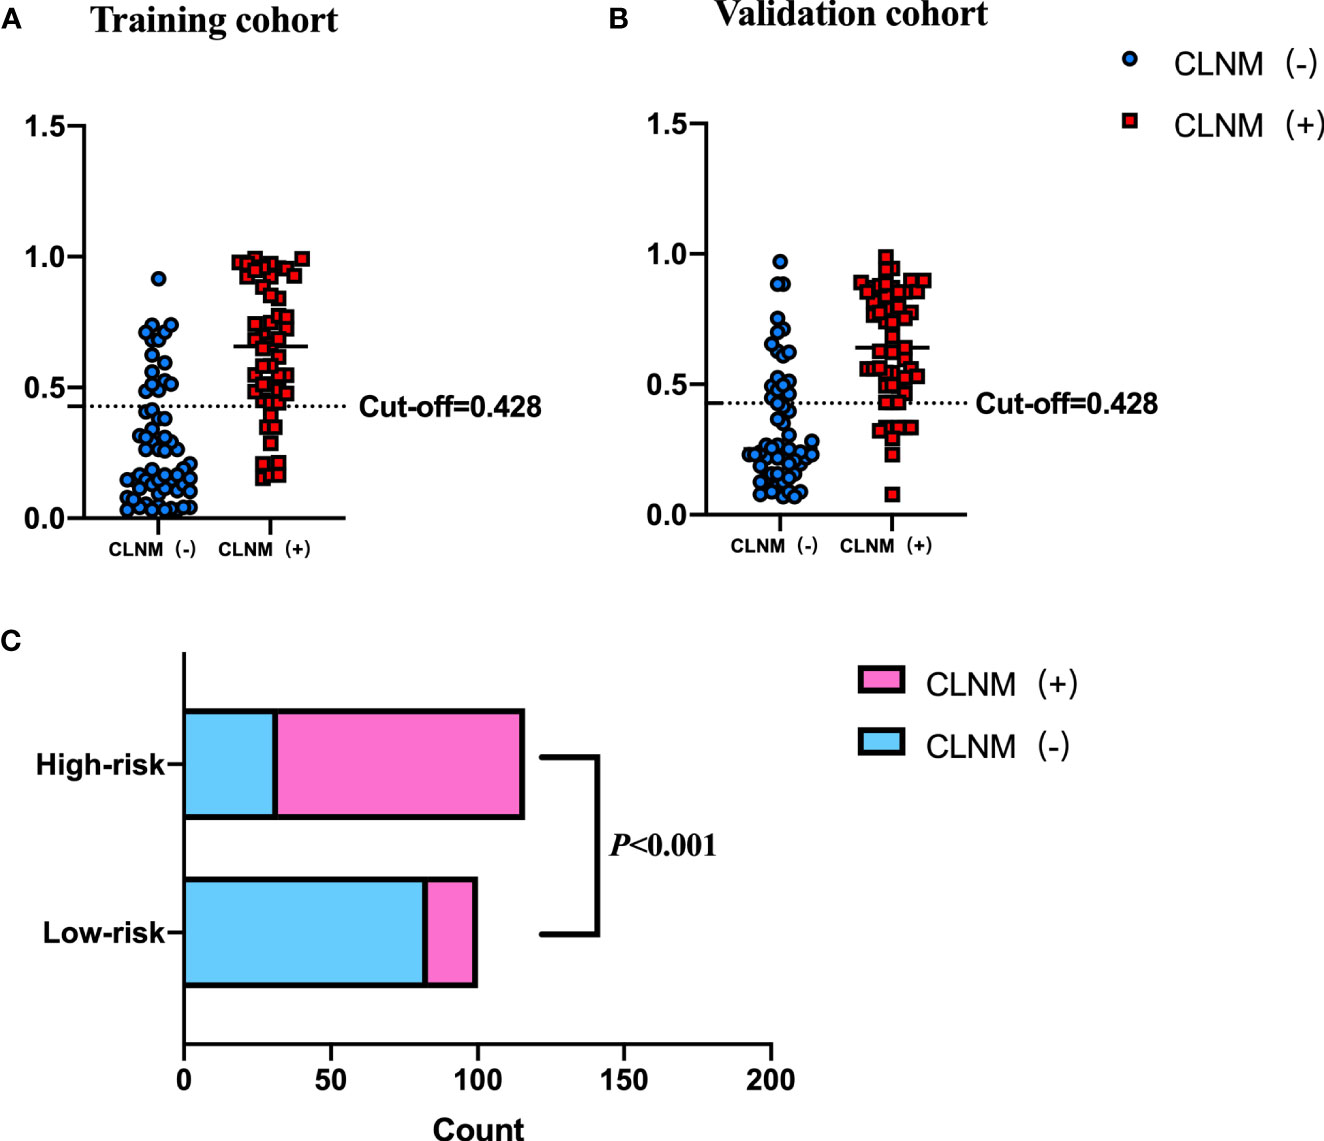
Figure 7 Performance of the cutoff value for predicting CLNM in patients with PTC. In (A, B), the cutoff value of the Nomo-score performed well in the differential diagnosis of pN1 from pN0 in the training and validation cohorts, respectively. (C) The risk classification performance of the cutoff value is shown.
4 Discussion
In this study, we developed and validated a prediction model by combining US and CEUS features for evaluating the risk of CLNM in PTC patients. The prediction model presented as a dynamic nomogram was more convenient for clinical use, and it showed good diagnostic performance in both training and validation cohorts. A cutoff value derived from Nomo-score can be used for CLNM risk stratification in patients with PTC.
Only half of CLNM cases can be accurately detected by the conventional US (18–20). Some studies reported that the US features of PTC, such as calcification, taller than wide, and contact with the capsule, are related to CLNM (21, 22). However, these US features were not correlated with the CLNM in our study, likely owing to different definitions of US features among prior studies. For example, Tian et al. (23) reported that microcalcification within PTC was the strongest predictor for CLNM, and the type of microcalcification depended on its size. In contrast, we classified the microcalcification pattern as present or absent. Previous studies showed that larger tumor size was associated with an increased risk of CLNM (24). In our study, the binary variable of tumor size according to 0.95 cm was not related to CLNM in the LASSO logistic regression and multivariate logistic regression (p = 0.175). Considering that tumor size was associated with CLNM in both the training and validation cohorts, we incorporated tumor size into the prediction model as a continuous variable, and multivariate regression revealed a strong correlation with CLNM (OR: 4.118, p = 0.009).
Previous studies have shown that some US features were valuable for predicting CLNM in PTC patients, but the results were not consistent. In addition, it is difficult to predict CLNM with US alone. Therefore, we explored the value of multimodal US in the diagnosis of CLNM.
In this study, regarding the CEUS features of PTC, heterogeneous enhancement and iso- or hyperenhancement were associated with CLNM, which is consistent with some previous studies. PTC may destroy neovascular tissue when tumorous infiltration and metastasis occur, and it may cause perfusion defects as presented in heterogeneous enhancement (25). Of note, iso- or hyperenhancement is the strongest risk factor in the prediction model. Angiogenesis plays an important role in the process of tumor invasion and underlies the development, growth, and metastasis of tumor. Hyperenhancement indicates an abundant blood supply in the tumor microenvironment, which is associated with an increased risk for CLNM. Similar findings were found in high-grade breast tumors (26). As previously reported, some CEUS quantitative parameters can be applied to predict the risk of CLNM in PTC patients. We also analyzed quantitative parameters such as WIS, TP, PI, and AUC. In the training cohort, the PI and WIS were higher in patients with PTC who had CLNM than in patients without CLNM, but the difference was not statistically significant (p > 0.05). Tao et al. (14) reported that PI was an independent risk factor of CLNM. Considering PI value is likely related to tumor microvessel density, further showing angiogenesis’ important role in the development and metastases of tumors (27). However, limited sample in this study leads to the cautious interpretation of the results; thus, further study is required.
In the present study, younger age and male were related to a higher risk of CLNM in PTC patients, consistent with other studies (28, 29). Ning et al. (30) suggested that younger age may indicate a higher biological aggressiveness of tumor. Our study concluded that PTC patients who are less than 42 years old are prone to have CLNM, with an age cutoff value close to the value suggested by Tian et al. (≤40 years old). Accumulating evidence has shown an association between being male and a poor prognosis of PTC, but the results have been inconsistent (31–33).
We used LASSO and multivariate logistic regression in this study to select features. Our prediction model combining US, CEUS features, and clinical factors showed better diagnostic efficiency compared with the single ultrasonic imaging features in both training and validation cohorts. According to the DCA curve, the application of the prediction model could benefit patients more than a treat-none or treat-all strategy when the threshold probability was between 7% and 82%. We also established a risk stratification criterion based on the Nomo-score and showed that patients with a Nomo-score ≥ 0.428 were likely to have a higher incidence of CLNM. Therefore, this prediction model can be used to evaluate individuals preoperatively, and CLND was recommended for patients with a Nomo-score ≥ 0.428.
Our study has several limitations. First, the training cohort in this study was retrospective, and some bias inevitably exists. Second, the data might be affected by the different machines and probes used in the training and validation cohorts, but a ratio was used to reduce this effect. Third, this study needs to be further validated using a study with a larger sample size. Finally, all data were obtained from a single institution; thus, external validation in multicenter clinical trials is warranted.
In conclusion, a web-based dynamic nomogram based on US and CEUS features was constructed and showed a good performance in predicting the CLNM risk in PTC patients. This may be instrumental in refining surgery strategy in PTC patients.
Data availability statement
The original contributions presented in the study are included in the article/supplementary material. Further inquiries can be directed to the corresponding author.
Author contributions
QC performed the statistical work and wrote the first draft of the manuscript. YL, JL, and YS completed the data collection work. LQ and XH edited and revised the manuscript. All authors revised the manuscript critically and approved the final version of the manuscript.
Funding
This work was supported by the Ministry of Industry and Information Technology of the People's Republic of China (2018MND102015) and Beijing key Clinical Discipline Funding (2021-135).
Conflict of interest
The authors declare that the research was conducted in the absence of any commercial or financial relationships that could be construed as a potential conflict of interest.
Publisher’s note
All claims expressed in this article are solely those of the authors and do not necessarily represent those of their affiliated organizations, or those of the publisher, the editors and the reviewers. Any product that may be evaluated in this article, or claim that may be made by its manufacturer, is not guaranteed or endorsed by the publisher.
References
1. Giordano TJ. Genomic hallmarks of thyroid neoplasia. Annu Rev Pathol (2018) 13:141–62. doi: 10.1146/annurev-pathol-121808-102139
2. Huang C, Cong S, Liang T, Feng Z, Gan K, Zhou R, et al. Development and validation of an ultrasound-based nomogram for preoperative prediction of cervical central lymph node metastasis in papillary thyroid carcinoma. Gland Surg (2020) 9(4):956–67. doi: 10.21037/gs-20-75
3. Al Afif A, Williams BA, Rigby MH, Bullock MJ, Taylor SM, Trites J, et al. Multifocal papillary thyroid cancer increases the risk of central lymph node metastasis. Thyroid (2015) 25(9):1008–12. doi: 10.1089/thy.2015.0130
4. Kim SK, Chai YJ, Park I, Woo JW, Lee JH, Lee KE, et al. Nomogram for predicting central node metastasis in papillary thyroid carcinoma. J Surg Oncol (2017) 115(3):266–72. doi: 10.1002/jso.24512
5. Zheng CM, Ji YB, Song CM, Ge MH, Tae K. Number of metastatic lymph nodes and ratio of metastatic lymph nodes to total number of retrieved lymph nodes are risk factors for recurrence in patients with clinically node negative papillary thyroid carcinoma. Clin Exp Otorhinolaryngol (2018) 11(1):58–64. doi: 10.21053/ceo.2017.00472
6. Maksimovic S, Jakovljevic B, Gojkovic Z. Lymph node metastases papillary thyroid carcinoma and their importance in recurrence of disease. Med Arch (2018) 72(2):108–11. doi: 10.5455/medarh.2018.72.108-111
7. Jiang M, Li C, Tang S, Lv W, Yi A, Wang B, et al. Nomogram based on shear-wave elastography radiomics can improve preoperative cervical lymph node staging for papillary thyroid carcinoma. Thyroid (2020) 30(6):885–97. doi: 10.1089/thy.2019.0780
8. Li F, Pan D, He Y, Wu Y, Peng J, Li J, et al. Using ultrasound features and radiomics analysis to predict lymph node metastasis in patients with thyroid cancer. BMC Surg (2020) 20(1):315. doi: 10.1186/s12893-020-00974-7
9. Haugen BR, Alexander EK, Bible KC, Doherty GM, Mandel SJ, Nikiforov YE, et al. 2015 American Thyroid association management guidelines for adult patients with thyroid nodules and differentiated thyroid cancer: the American thyroid association guidelines task force on thyroid nodules and differentiated thyroid cancer. Thyroid (2016) 26(1):1–133. doi: 10.1089/thy.2015.0020
10. Liang K, He L, Dong W, Zhang H. Risk factors of central lymph node metastasis in Cn0 papillary thyroid carcinoma: a study of 529 patients. Med Sci Monit (2014) 20:807–11. doi: 10.12659/msm.890182
11. Zhao WJ, Luo H, Zhou YM, Dai WY, Zhu JQ. Evaluating the effectiveness of prophylactic central neck dissection with total thyroidectomy for Cn0 papillary thyroid carcinoma: an updated meta-analysis. Eur J Surg Oncol (2017) 43(11):1989–2000. doi: 10.1016/j.ejso.2017.07.008
12. Choi JS, Kim J, Kwak JY, Kim MJ, Chang HS, Kim EK. Preoperative staging of papillary thyroid carcinoma: comparison of ultrasound imaging and ct. AJR Am J Roentgenol (2009) 193(3):871–8. doi: 10.2214/ajr.09.2386
13. Choi YJ, Yun JS, Kook SH, Jung EC, Park YL. Clinical and imaging assessment of cervical lymph node metastasis in papillary thyroid carcinomas. World J Surg (2010) 34(7):1494–9. doi: 10.1007/s00268-010-0541-1
14. Tao L, Zhou W, Zhan W, Li W, Wang Y, Fan J. Preoperative prediction of cervical lymph node metastasis in papillary thyroid carcinoma Via conventional and contrast-enhanced ultrasound. J Ultrasound Med (2020) 39(10):2071–80. doi: 10.1002/jum.15315
15. Liu Q, Cheng J, Li J, Gao X, Li H. The diagnostic accuracy of contrast-enhanced ultrasound for the differentiation of benign and malignant thyroid nodules: a prisma compliant meta-analysis. Med (Baltimore) (2018) 97(49):e13325. doi: 10.1097/md.0000000000013325
16. Zhan J, Diao X, Chen Y, Wang W, Ding H. Predicting cervical lymph node metastasis in patients with papillary thyroid cancer (Ptc) - why contrast-enhanced ultrasound (Ceus) was performed before thyroidectomy. Clin Hemorheol Microcirc (2019) 72(1):61–73. doi: 10.3233/ch-180454
17. Zhan J, Zhang LH, Yu Q, Li CL, Chen Y, Wang WP, et al. Prediction of cervical lymph node metastasis with contrast-enhanced ultrasound and association between presence of Braf(V600e) and extrathyroidal extension in papillary thyroid carcinoma. Ther Adv Med Oncol (2020) 12:1758835920942367. doi: 10.1177/1758835920942367
18. Goto K, Watanabe S. Large-Billed crows (Corvus macrorhynchos) have retrospective but not prospective metamemory. Anim Cognit (2012) 15(1):27–35. doi: 10.1007/s10071-011-0428-z
19. Baek SK, Jung KY, Kang SM, Kwon SY, Woo JS, Cho SH, et al. Clinical risk factors associated with cervical lymph node recurrence in papillary thyroid carcinoma. Thyroid (2010) 20(2):147–52. doi: 10.1089/thy.2008.0243
20. O'Connell K, Yen TW, Quiroz F, Evans DB, Wang TS. The utility of routine preoperative cervical ultrasonography in patients undergoing thyroidectomy for differentiated thyroid cancer. Surgery (2013) 154(4):697–701. doi: 10.1016/j.surg.2013.06.040
21. Guo L, Ma YQ, Yao Y, Wu M, Deng ZH, Zhu FW, et al. Role of ultrasonographic features and quantified Brafv600e mutation in lymph node metastasis in Chinese patients with papillary thyroid carcinoma. Sci Rep (2019) 9(1):75. doi: 10.1038/s41598-018-36171-z
22. Wang QC, Cheng W, Wen X, Li JB, Jing H, Nie CL. Shorter distance between the nodule and capsule has greater risk of cervical lymph node metastasis in papillary thyroid carcinoma. Asian Pac J Cancer Prev (2014) 15(2):855–60. doi: 10.7314/apjcp.2014.15.2.855
23. Tian X, Song Q, Xie F, Ren L, Zhang Y, Tang J, et al. Papillary thyroid carcinoma: an ultrasound-based nomogram improves the prediction of lymph node metastases in the central compartment. Eur Radiol (2020) 30(11):5881–93. doi: 10.1007/s00330-020-06906-6
24. Andrioli M, Valcavi R. Sonography of normal and abnormal thyroid and parathyroid glands. Front Horm Res (2016) 45:1–15. doi: 10.1159/000442273
25. Zhang Y, Luo YK, Zhang MB, Li J, Li CT, Tang J, et al. Values of ultrasound features and mmp-9 of papillary thyroid carcinoma in predicting cervical lymph node metastases. Sci Rep (2017) 7(1):6670. doi: 10.1038/s41598-017-07118-7
26. Szabó BK, Saracco A, Tánczos E, Aspelin P, Leifland K, Wilczek B, et al. Correlation of contrast-enhanced ultrasound kinetics with prognostic factors in invasive breast cancer. Eur Radiol (2013) 23(12):3228–36. doi: 10.1007/s00330-013-2960-5
27. Lee SH, Lee SJ, Jin SM, Lee NH, Kim DH, Chae SW, et al. Relationships between lymph node metastasis and expression of Cd31, D2-40, and vascular endothelial growth factors a and c in papillary thyroid cancer. Clin Exp Otorhinolaryngol (2012) 5(3):150–5. doi: 10.3342/ceo.2012.5.3.150
28. Liu W, Cheng R, Ma Y, Wang D, Su Y, Diao C, et al. Establishment and validation of the scoring system for preoperative prediction of central lymph node metastasis in papillary thyroid carcinoma. Sci Rep (2018) 8(1):6962. doi: 10.1038/s41598-018-24668-6
29. Kwak JY, Han KH, Yoon JH, Moon HJ, Son EJ, Park SH, et al. Thyroid imaging reporting and data system for us features of nodules: a step in establishing better stratification of cancer risk. Radiology (2011) 260(3):892–9. doi: 10.1148/radiol.11110206
30. Qu N, Zhang L, Ji QH, Zhu YX, Wang ZY, Shen Q, et al. Number of tumor foci predicts prognosis in papillary thyroid cancer. BMC Cancer (2014) 14:914. doi: 10.1186/1471-2407-14-914
31. Wang F, Zhao S, Shen X, Zhu G, Liu R, Viola D, et al. Braf V600e confers Male sex disease-specific mortality risk in patients with papillary thyroid cancer. J Clin Oncol (2018) 36(27):2787–95. doi: 10.1200/jco.2018.78.5097
32. Suman P, Wang CH, Abadin SS, Moo-Young TA, Prinz RA, Winchester DJ. Risk factors for central lymph node metastasis in papillary thyroid carcinoma: a national cancer data base (Ncdb) study. Surgery (2016) 159(1):31–9. doi: 10.1016/j.surg.2015.08.032
Keywords: contrast-enhanced ultrasound (CEUS), papillary thyroid carcinoma, central lymph node metastasis, risk assessment, dynamic nomogram
Citation: Chen Q, Liu Y, Liu J, Su Y, Qian L and Hu X (2023) Development and validation of a dynamic nomogram based on conventional ultrasound and contrast-enhanced ultrasound for stratifying the risk of central lymph node metastasis in papillary thyroid carcinoma preoperatively. Front. Endocrinol. 14:1186381. doi: 10.3389/fendo.2023.1186381
Received: 14 March 2023; Accepted: 05 June 2023;
Published: 20 June 2023.
Edited by:
Emese Mezosi, University of Pécs, HungaryReviewed by:
Anupam Kotwal, University of Nebraska Medical Center, United StatesLudovico Docimo, University of Campania Luigi Vanvitelli, Italy
Copyright © 2023 Chen, Liu, Liu, Su, Qian and Hu. This is an open-access article distributed under the terms of the Creative Commons Attribution License (CC BY). The use, distribution or reproduction in other forums is permitted, provided the original author(s) and the copyright owner(s) are credited and that the original publication in this journal is cited, in accordance with accepted academic practice. No use, distribution or reproduction is permitted which does not comply with these terms.
*Correspondence: Xiangdong Hu, aHV4ZDIwMDVAMTI2LmNvbQ==