 Xiaohua Wang
 Shuo Yang
 Lin Xie
- Department of Spine Surgery, Affiliated Hospital of Integrated Traditional Chinese and Western Medicine, Nanjing University of Chinese Medicine, Nanjing, China
Introduction: The weight-adjusted waist index (WWI) serves as an innovative obesity measure, seemingly surpassing body mass index (BMI) and waist circumference (WC) in evaluating lean and fat mass. This study aimed to explore the relationship between WWI and total bone mineral density (BMD) in US adolescents.
Methods: This population-based study investigated adolescents aged 8–19 years with comprehensive WWI and total BMD data from the National Health and Nutrition Examination Survey (NHANES) 2011–2018. WWI was computed by dividing WC by the square root of body weight. Weighted multivariate linear regression and smoothed curve fitting were employed to examine linear and non-linear associations. Threshold effects were determined using a two-part linear regression model. Additionally, subgroup analyses and interaction tests were conducted.
Results: Multivariate linear regression analysis revealed a significant negative association between WWI and total BMD in 6,923 US adolescents aged 8–19 years [β = -0.03, 95% CI: (-0.03, -0.03)]. This negative correlation remained consistent across all subcategories, with the exception of age, encompassing gender,ethnicity, and diabetes status subgroups. Furthermore, a non-linear relationship and saturation effect between WWI and total BMD were identified, with an inflection point at 9.88 cm/√kg.
Conclusions: Our research demonstrated a notable negative relationship and saturation effect between WWI and total BMD among US adolescents.
1 Background
Osteoporosis (OP) is a systemic degenerative bone disorder characterized by diminished bone density and compromised bone microarchitecture, resulting in bone fragility and fractures (1–3). A global epidemiological investigation estimated that roughly 200 million individuals suffer from OP worldwide, with this number increasing annually (4). Childhood and adolescence represent critical phases for bone development, with bone mass typically peaking in late adolescence (5, 6). Numerous studies have shown that bone mineral density (BMD) is traceable from childhood to adolescence and into adulthood (7, 8). Consequently, bone metabolism during childhood and adolescence plays a vital role in preventing OP in later life (9).
Obesity is defined by abnormal or excessive body fat, which negatively impacts health and is closely associated with the development of various chronic diseases (10). Childhood obesity is a major concern in the United States, affecting an estimated 14.4 million children and adolescents (11). While body mass index (BMI) and waist circumference (WC) are the predominant measures of obesity, the obesity paradox has cast doubt on the utility of BMI. It has been proposed that BMI fails to distinguish between lean and fat mass and is subject to influence by factors such as age, gender, and ethnic differences (12, 13). In contrast, WC is considered a superior indicator of body fat for predicting obesity-related diseases compared to BMI, as it demonstrates a strong correlation with abdominal fat accumulation (14, 15). However, the substantial correlation between WC and BMI constrains the utility of WC as an independent obesity marker. Consequently, in 2018, Park et al. proposed a new obesity index, the weight-adjusted waist index (WWI), which standardizes WC and body weight, rendering it easy to measure (16). Furthermore, WWI highlights the advantages of WC and reduces the correlation between WC and BMI by primarily reflecting weight-independent central obesity. Numerous studies have demonstrated a positive relationship between WWI and the onset of hypertension, diabetes, and even all-cause and cardiovascular mortality (17–19).
As ongoing research progresses, scholars observed a potential correlation between body fat composition and bone tissue development. Consequently, tracking this development through easily quantifiable obesity indicators proves valuable. To date, no studies have established a connection between WWI and total BMD. The objective of this investigation was to examine the relationship between WWI and total BMD in US adolescents aged 8–19 years, utilizing data from the National Health and Nutrition Examination Survey (NHANES).
2 Methods
2.1 Data source and study population
NHANES is a comprehensive cross-sectional survey carried out in the United States to furnish impartial statistics regarding health concerns and population health issues (20–22). This study employed NHANES data from 2011 to 2018; out of 39,156 eligible participants, 2,165 lacked weight data, 4,242 lacked WC data, 15,042 lacked total BMD data, and 10,784 individuals aged over 19 were excluded. Ultimately, 6,923 adolescents were enrolled in the study (Figure 1).
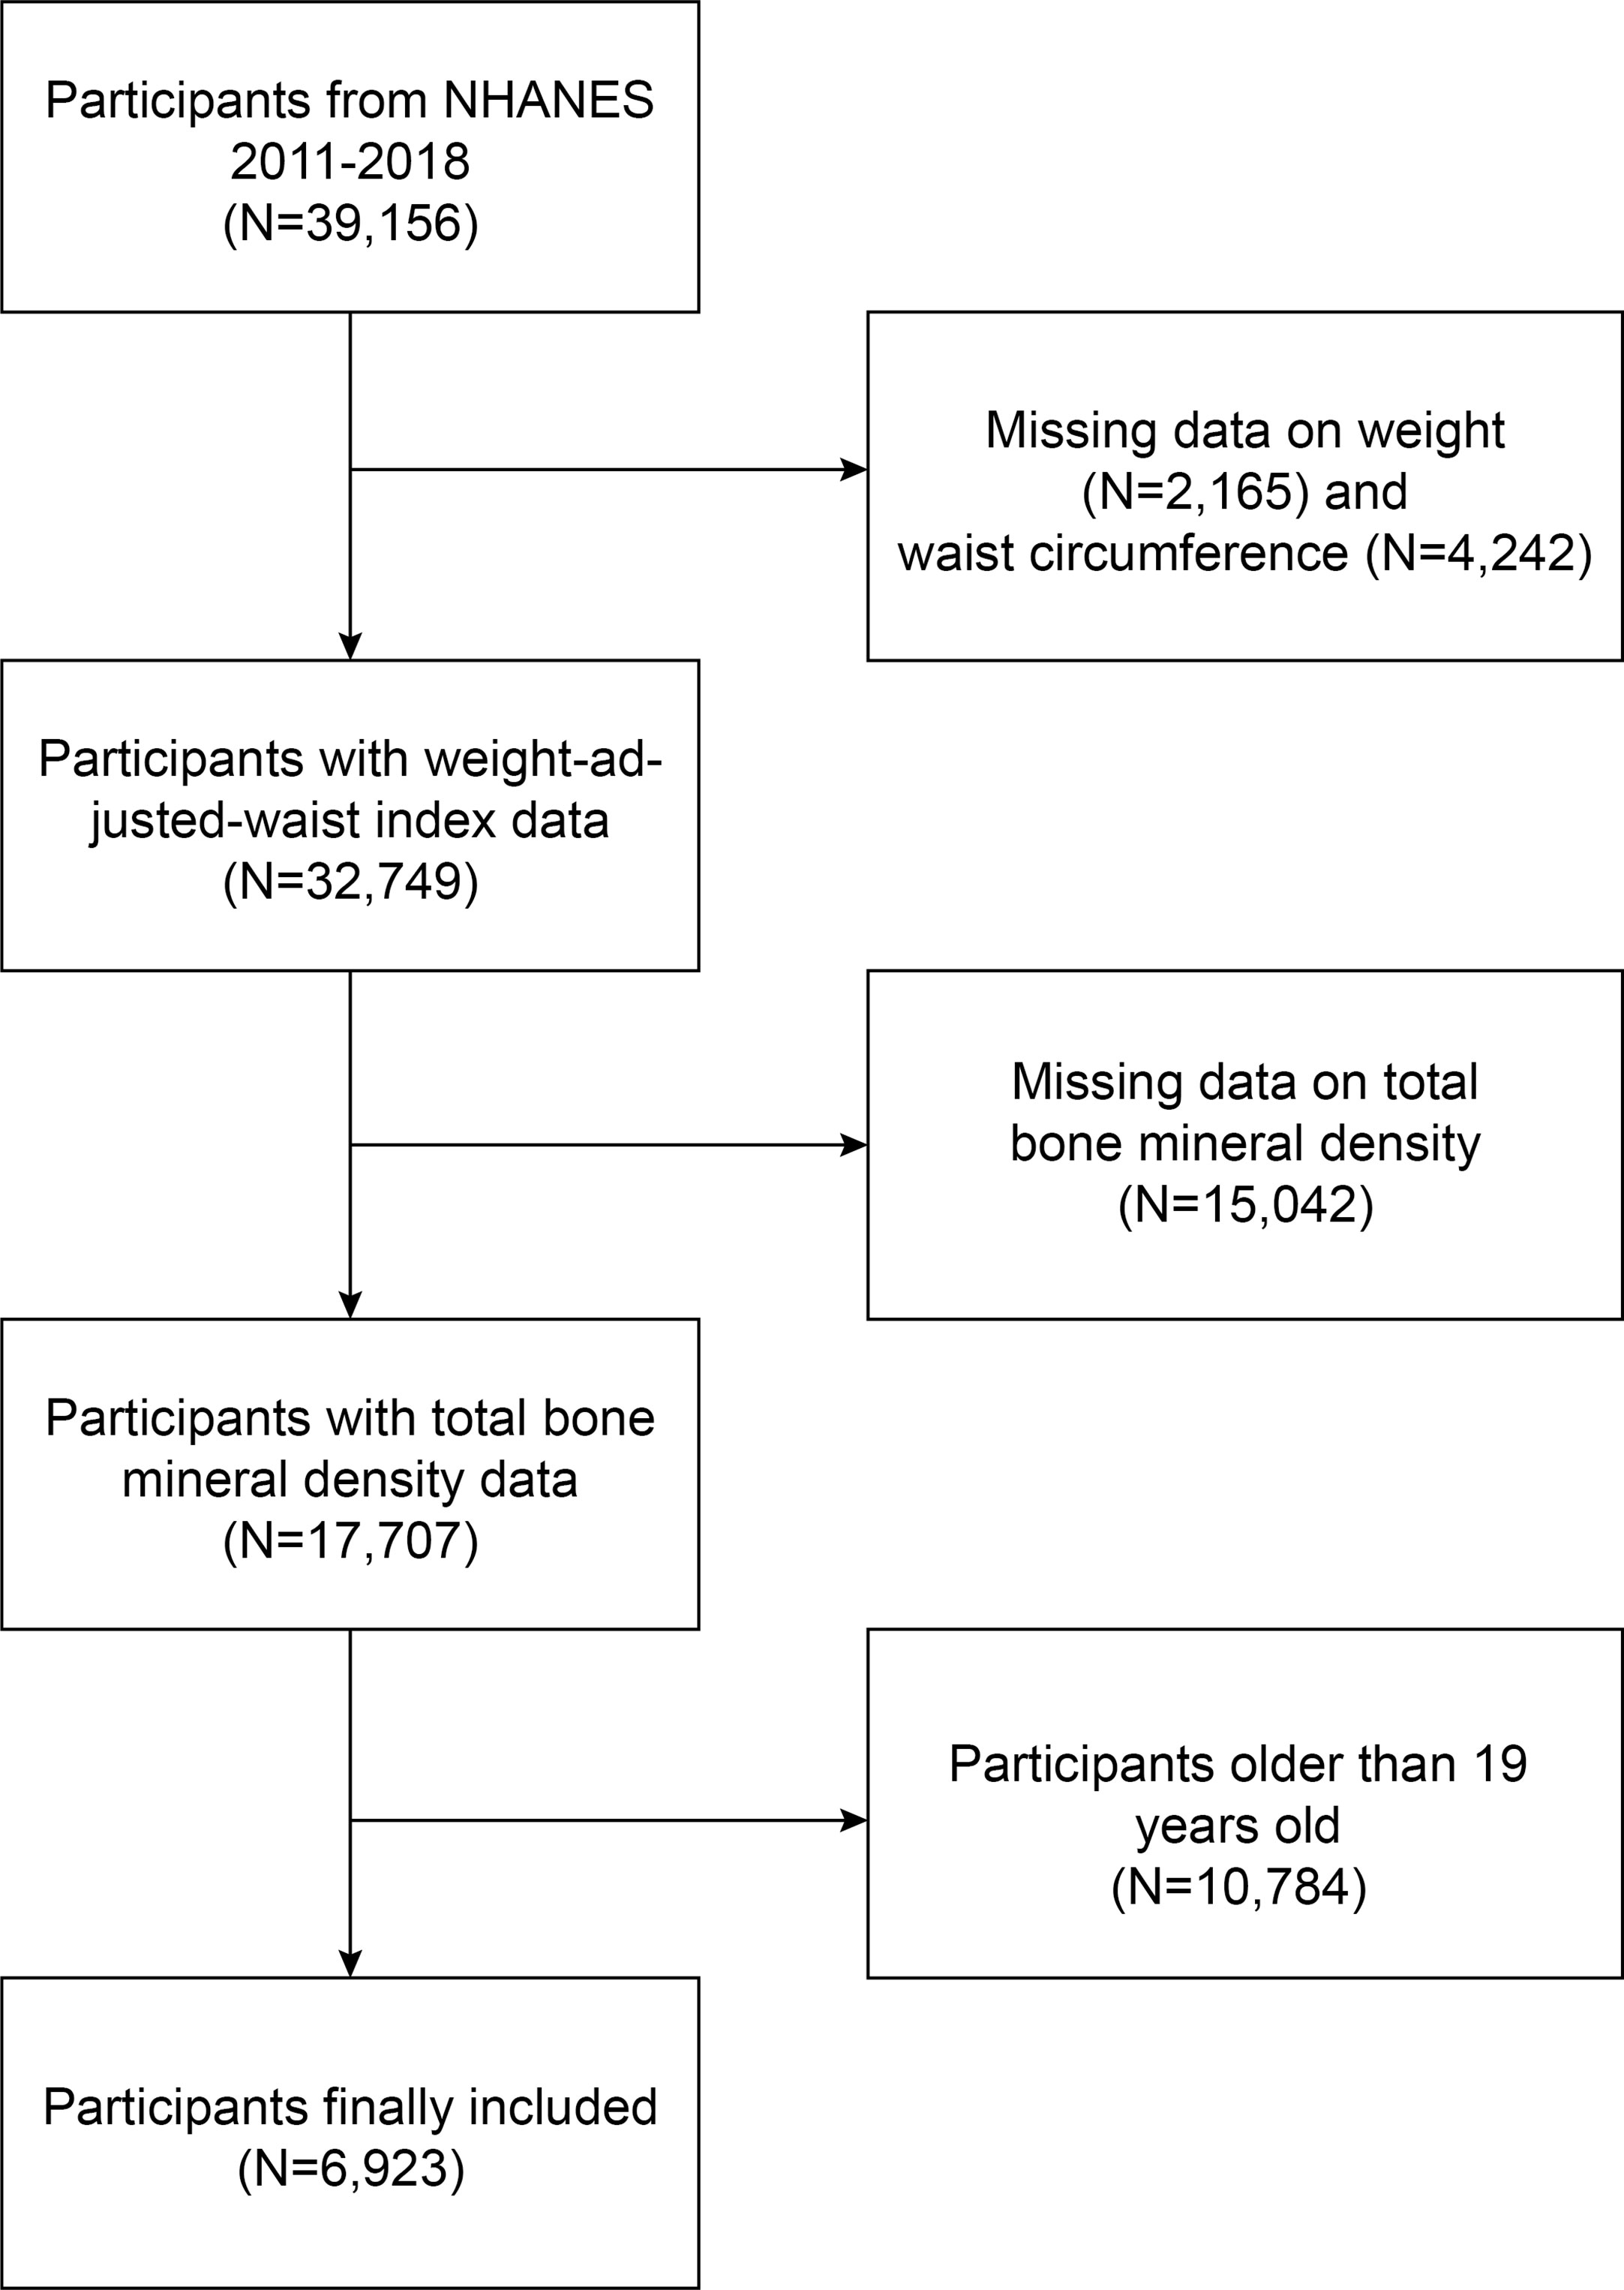
Figure 1 Baseline characteristics of participants.
2.2 Ethics statement
The NHANES protocol received approval from the National Research Ethics Committee on Health Statistics, and signed consent forms were obtained. Once anonymized, the NHANES data were made publicly available, enabling researchers to transform the data into a research-appropriate format. We adhered to research data usage guidelines, ensuring that data were employed solely for statistical analysis and that all experiments conformed to current standards and regulations. The authors did not access any information capable of identifying individual participants during or after data collection.
2.3 Study variables
In this study, the dependent variable is total BMD, with the expected independent variable being WWI. WWI (cm/√kg) is computed by dividing WC (cm) by the square root of body weight (kg). To guarantee data reliability, outliers were inspected as needed. Age, weight, and gender were employed to confirm data accuracy, and any erroneous data were eliminated. Total BMD was calculated using dual-energy X-ray absorptiometry results. Covariates included age, sex, race, ratio of family income to poverty (PIR), diabetes status, uric acid, albumin, alanine aminotransferase (ALT), direct high-density lipoprotein cholesterol (HDL-C), weight, alkaline phosphatase (ALP), 25OHD2 + 25OHD3, BMI, WC, aspartate aminotransferase (AST), blood urea nitrogen (BUN), glycated hemoglobin, creatinine, triglycerides, total cholesterol, total calcium, low-density lipoprotein cholesterol (LDL-C), phosphorus, and serum glucose. For additional information on confounding factors, visit http://www.cdc.gov/nchs/nhanes/.
2.4 Statistical analysis
Statistical evaluations in this investigation were executed using R (http://www.r-project.org) and EmpowerStats (http://www.empowerstats.com), adopting a significance threshold of p<0.05. As NHANES aims to generate data representative of the non-institutionalized civilian population within the United States, all estimates were computed utilizing sample weights in line with NCHS analytical guidelines (23, 24). Weighted multiple linear regression analysis was implemented to explore the linear relationship between WWI and total BMD, while smoothing curve fitting and threshold effects evaluation were applied to assess the non-linear association between WWI and total BMD. The study incorporated three models: Model 1 entailed no variable adjustments; Model 2 accounted for age, gender, and race; and Model 3 adjusted for all the covariates listed in Table 1 except BMI, WC, and weight. Subgroup analyses were additionally performed.
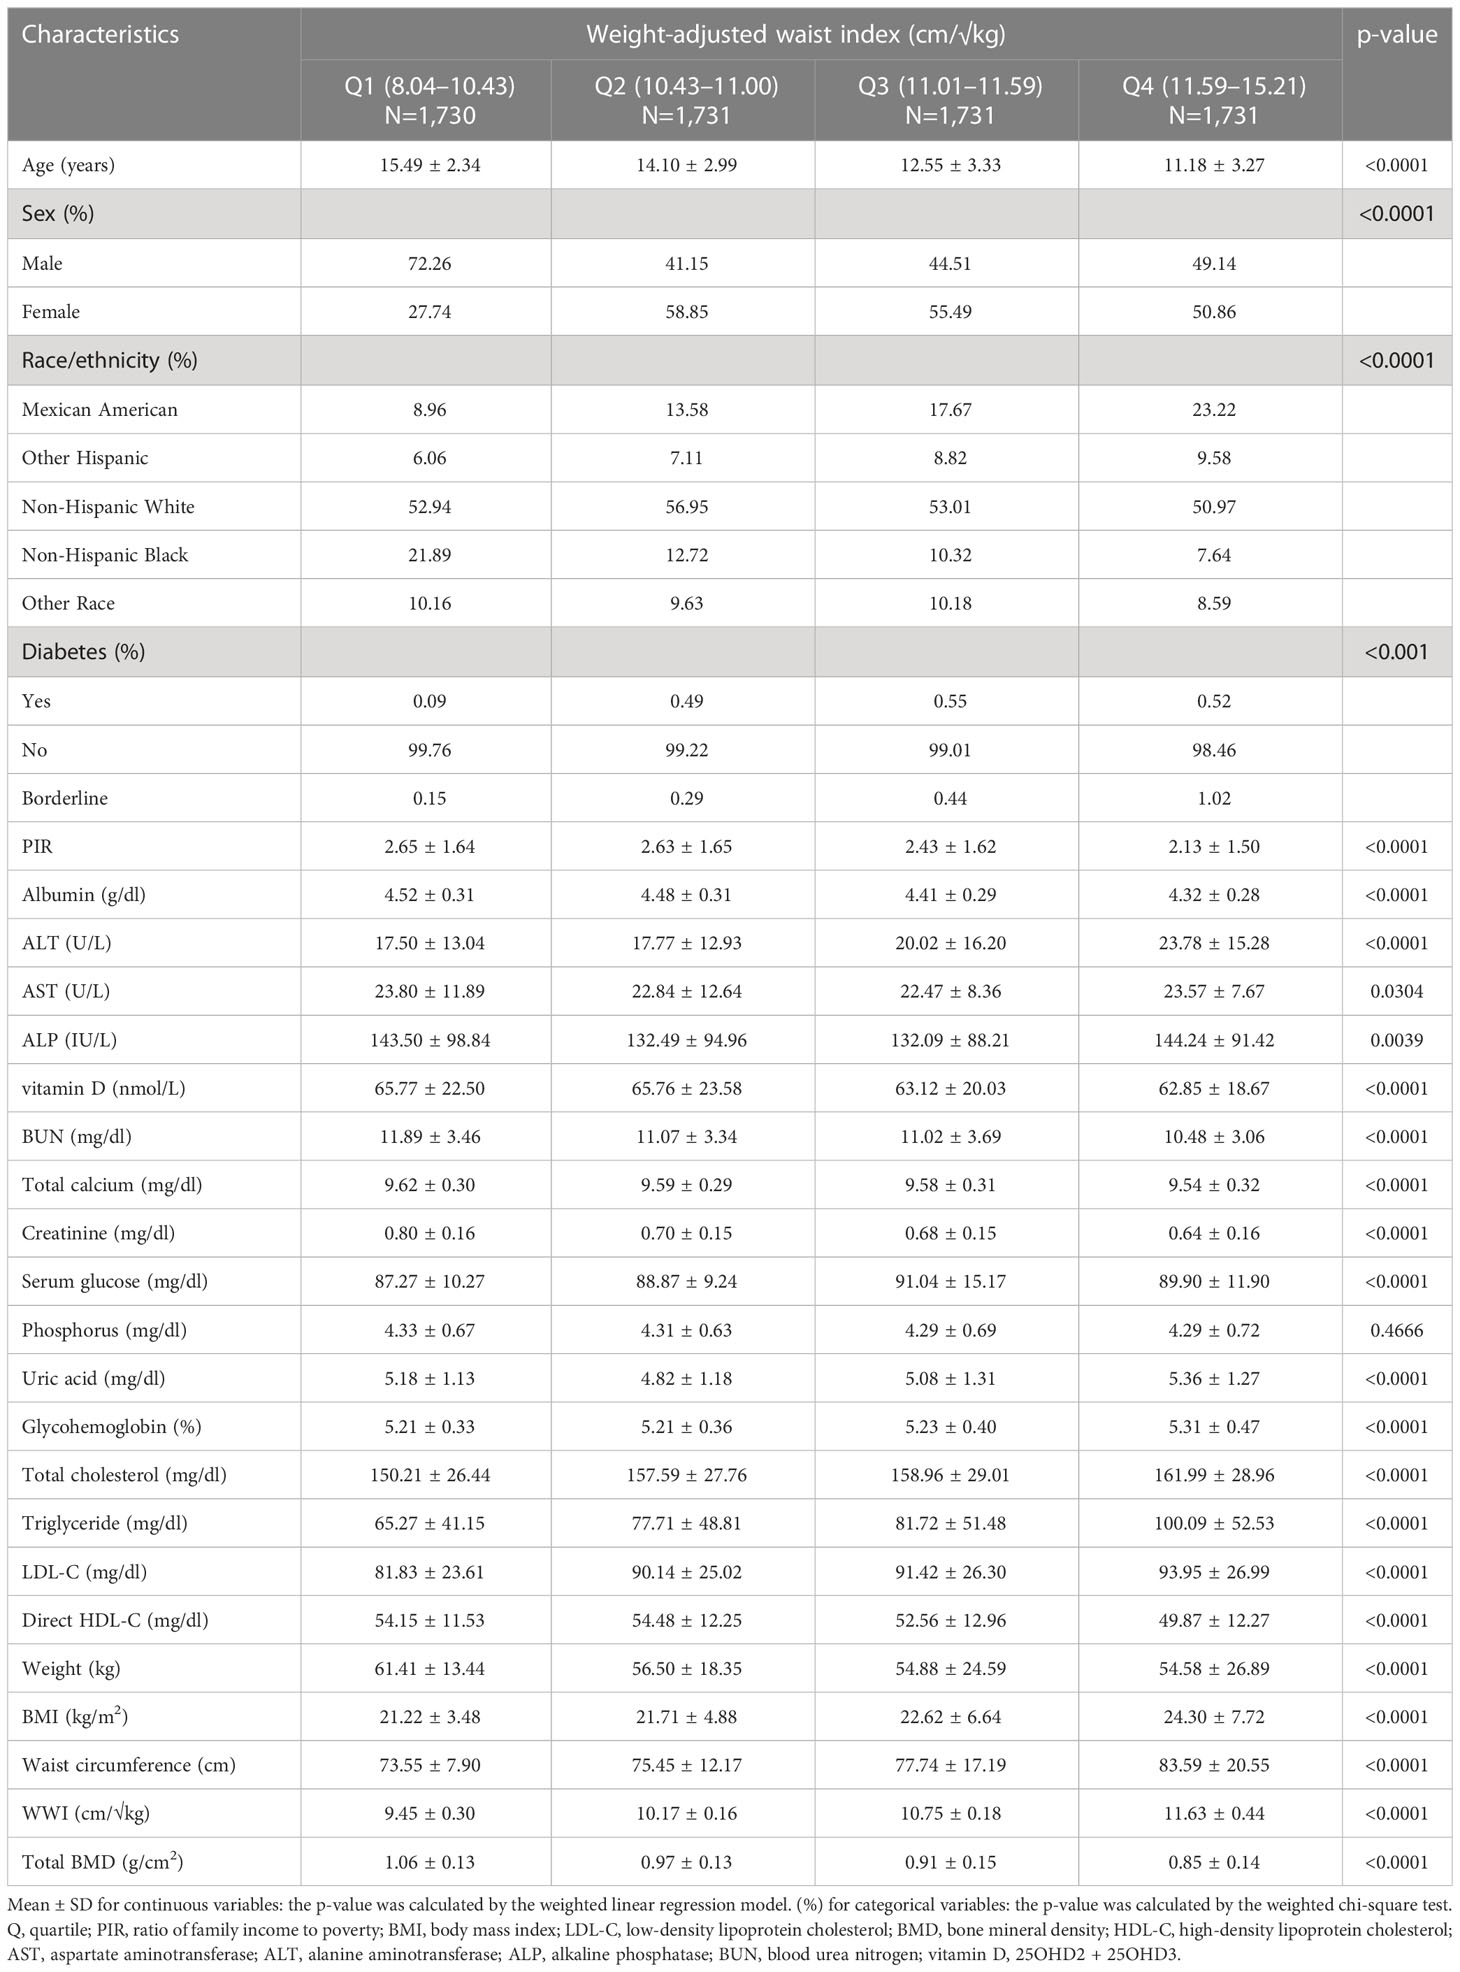
Table 1 Basic characteristics of participants by weight-adjusted waist index quartile.
3 Results
3.1 Baseline characteristics
After applying inclusion and exclusion criteria, 6,923 participants, with a mean age of 13.03 ± 3.45 years, were included in the study. The sample comprised 51.86% boys and 48.14% girls, along with 20.05% non-Hispanic white people, 24.38% non-Hispanic black people, 20.99% Mexican-American people, 10.63% other Hispanic people, and 16.94% individuals from other racial backgrounds. The average (SD) values of WWI and total BMD were 10.50 (0.86) cm/√kg and 0.94 (0.16) g/cm2, respectively. Table 1 outlines the clinical characteristics of the participants, with columns displaying stratified groups based on WWI quartiles. Relative to the bottom quartile, those in the top WWI quartile were more likely to be female and younger, have a higher proportion of Mexican Americans and other Hispanics, exhibit a higher prevalence of diabetes, and show increased levels of ALT, ALP, serum glucose, uric acid, glycohemoglobin, total cholesterol, triglyceride, LDL-C, BMI, and WC. Conversely, they demonstrated lower levels of PIR, albumin, AST, 25OHD2 + 25OHD3, BUN, total calcium, creatinine, direct HDL-C, weight, and total BMD (p < 0.05) (Table 1).
3.2 Association between WWI and total BMD
Table 2 presents the connection between WWI and total BMD. All models exhibited an inverse association between WWI and total BMD. Upon adjusting for all confounding variables, a one-unit increment in WWI was significantly linked to a 0.03 g/cm2 reduction in total BMD (Model 3: β = −0.03, 95% CI: −0.03, −0.03). This correlation persisted as statistically significant when categorizing WWI into quartiles: a one-unit rise in WWI corresponded to a 0.06-unit larger decrease in total BMD for cipants in the top WWI quartile compared to those in the bottom WWI quartile (β = -0.06, 95% CI: −0.06, −0.05; p for trend < 0.001).
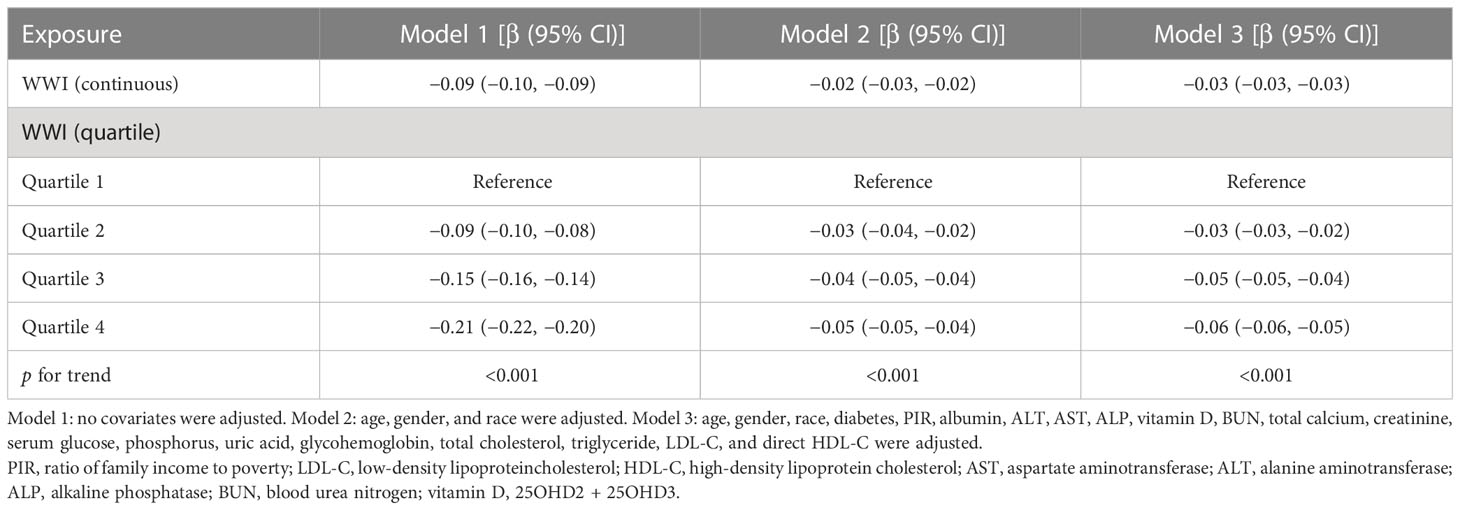
Table 2 Association between weight-adjusted waist index (cm/√kg) and total bone mineral density (g/cm2).
3.3 Subgroup analysis
A subgroup analysis was conducted to evaluate the stability of the relationship between WWI and total BMD across different demographic contexts. The results indicated that the influence of factors other than age stratification on the relationship between WWI and total BMD was not significant. As illustrated in Table 3, the inverse association between WWI and total BMD was not significantly affected by any of the remaining strata, including gender, ethnicity, diabetes status, and the ratio of family income to poverty, except for the age stratum (p > 0.05 for all interactions). However, in the age-stratified subgroup analyses, the absolute effect values for 8–11-year-olds were significantly smaller than those for 12–19-year-olds. This implies that each unit increase in WWI for 8–11-year-olds was associated with a 0.01 cm/√kg decrease in total BMD, while each unit increase in WWI for 12–19-year-olds corresponded to a 0.03 cm/√kg decrease in total BMD. Furthermore, the results of the WWI quartile subgroup analysis demonstrated a dose–response relationship between WWI and total BMD (Table 3).
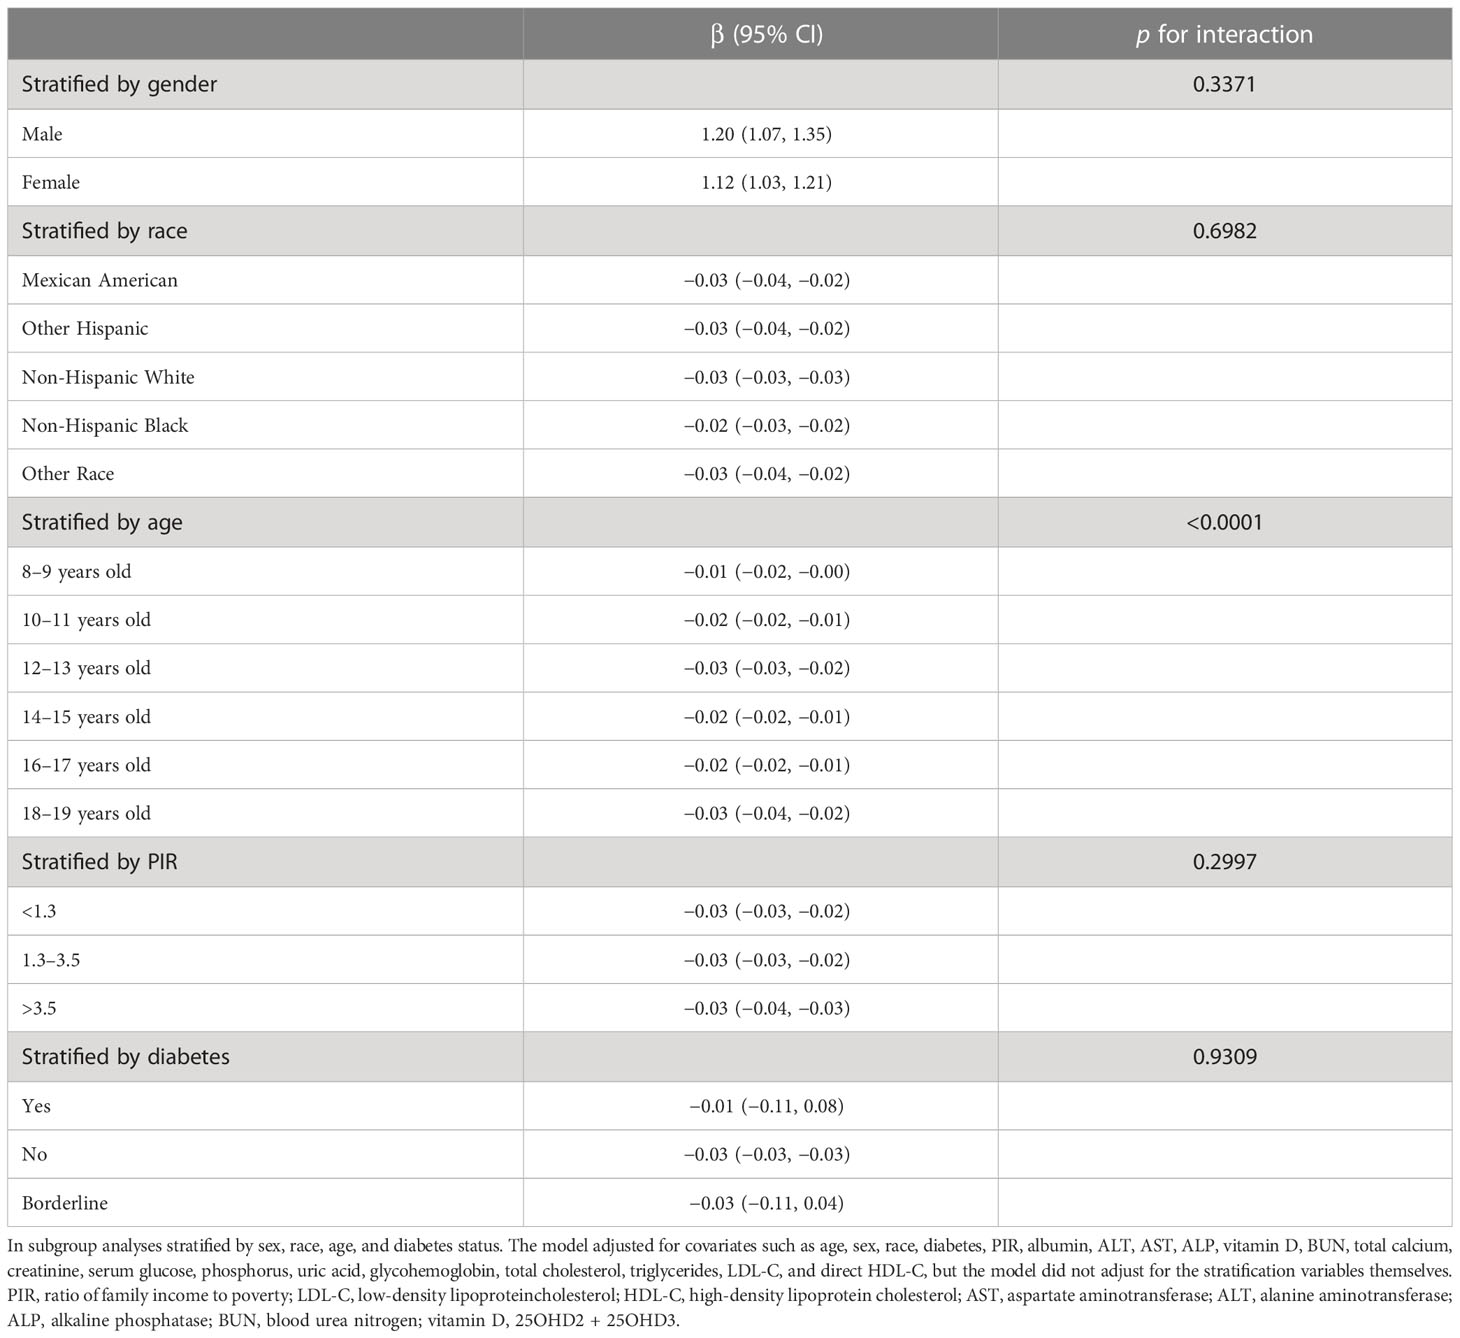
Table 3 Association between weight-adjusted waist index (cm/√kg) and total bone mineral density (g/cm2).
3.4 Non-linearity and saturation effect analysis between WWI and total BMD
Smooth curve fitting was implemented to delineate the non-linear association and saturation phenomenon between WWI and total BMD (Figure 2). The results uncovered that the saturation effect value for the WWI–total BMD relationship was 9.88 cm/√kg for all participants (Table 4). When WWI was below 9.88 cm/√kg, the effect value registered at −0.06; on the other hand, when WWI surpassed 9.88 cm/√kg, the effect value transitioned to −0.02. All participants were segregated into three groups with 2-year age intervals. Smooth curves and saturation effect evaluation were applied to ascertain WWI saturation values for total BMD within each age bracket (Table 4; Figure 3).
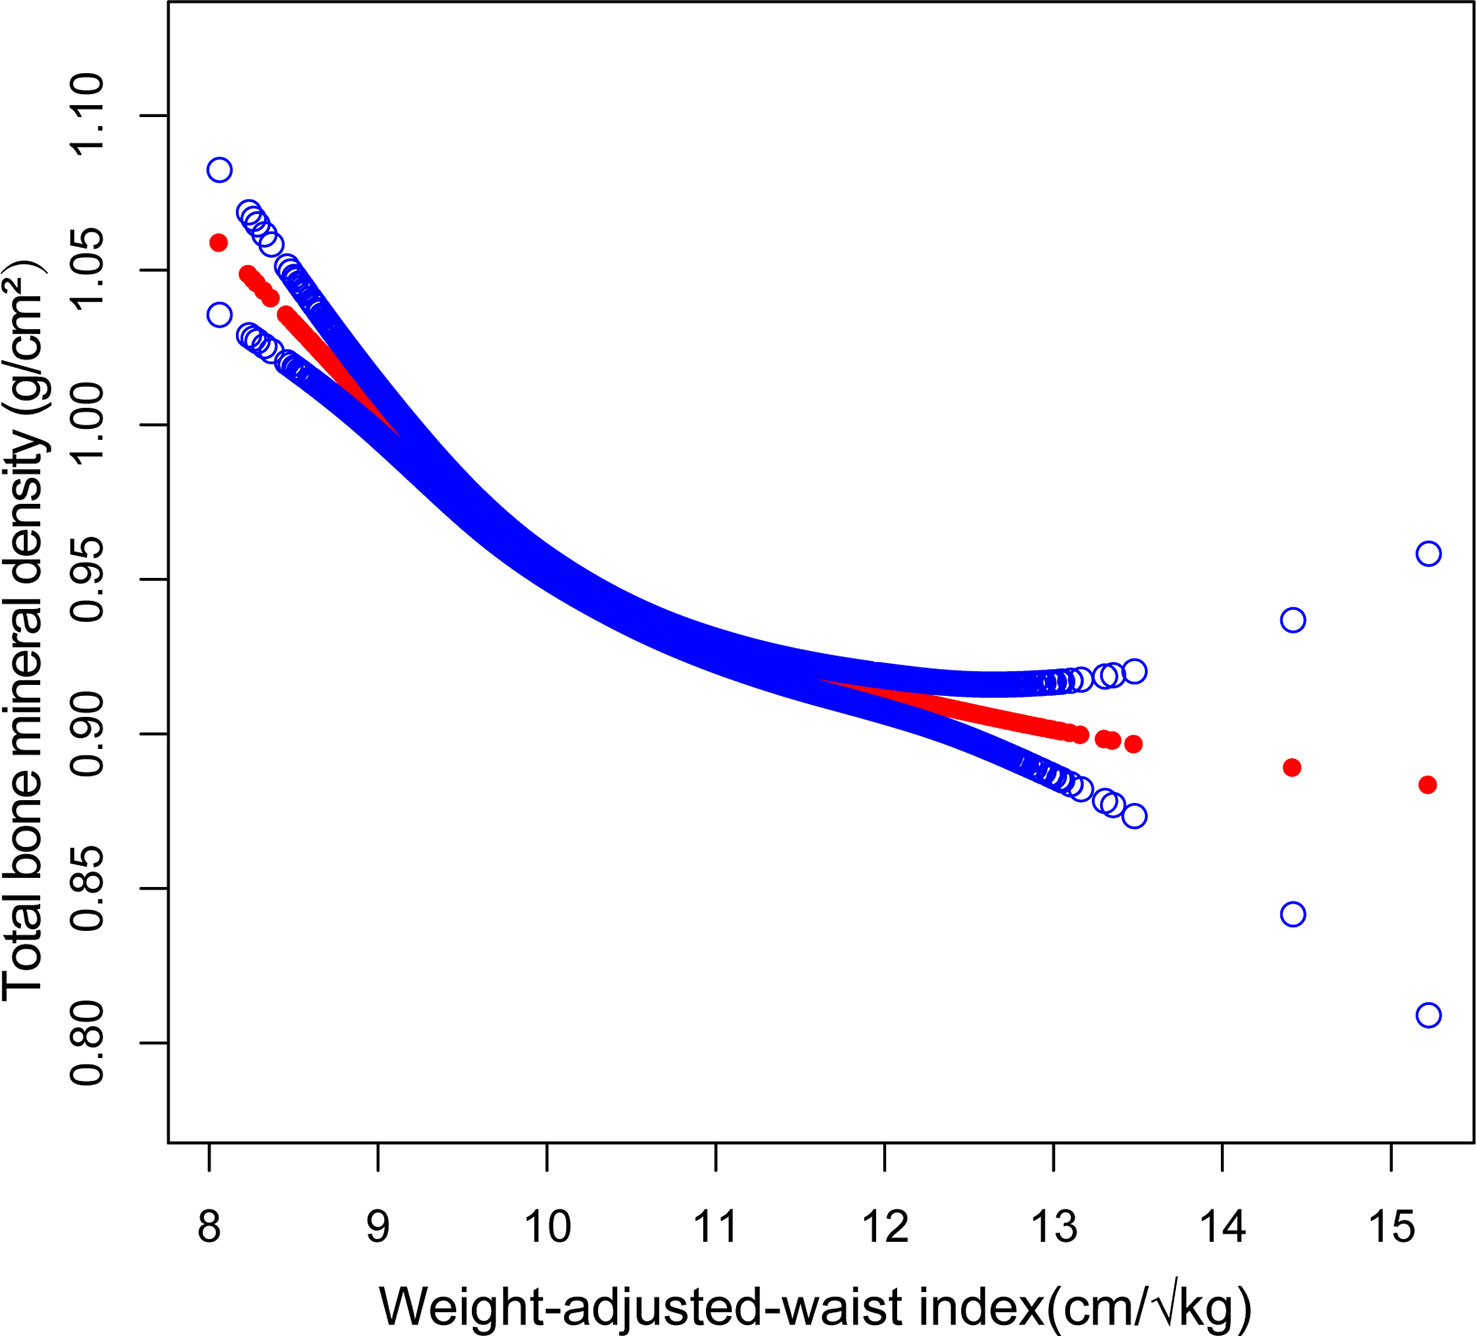
Figure 2 Association between WWI and total bone mineral density (The solid red line represents the smooth curve fit between variables. Blue bands represent the 95% confidence interval from the fit).
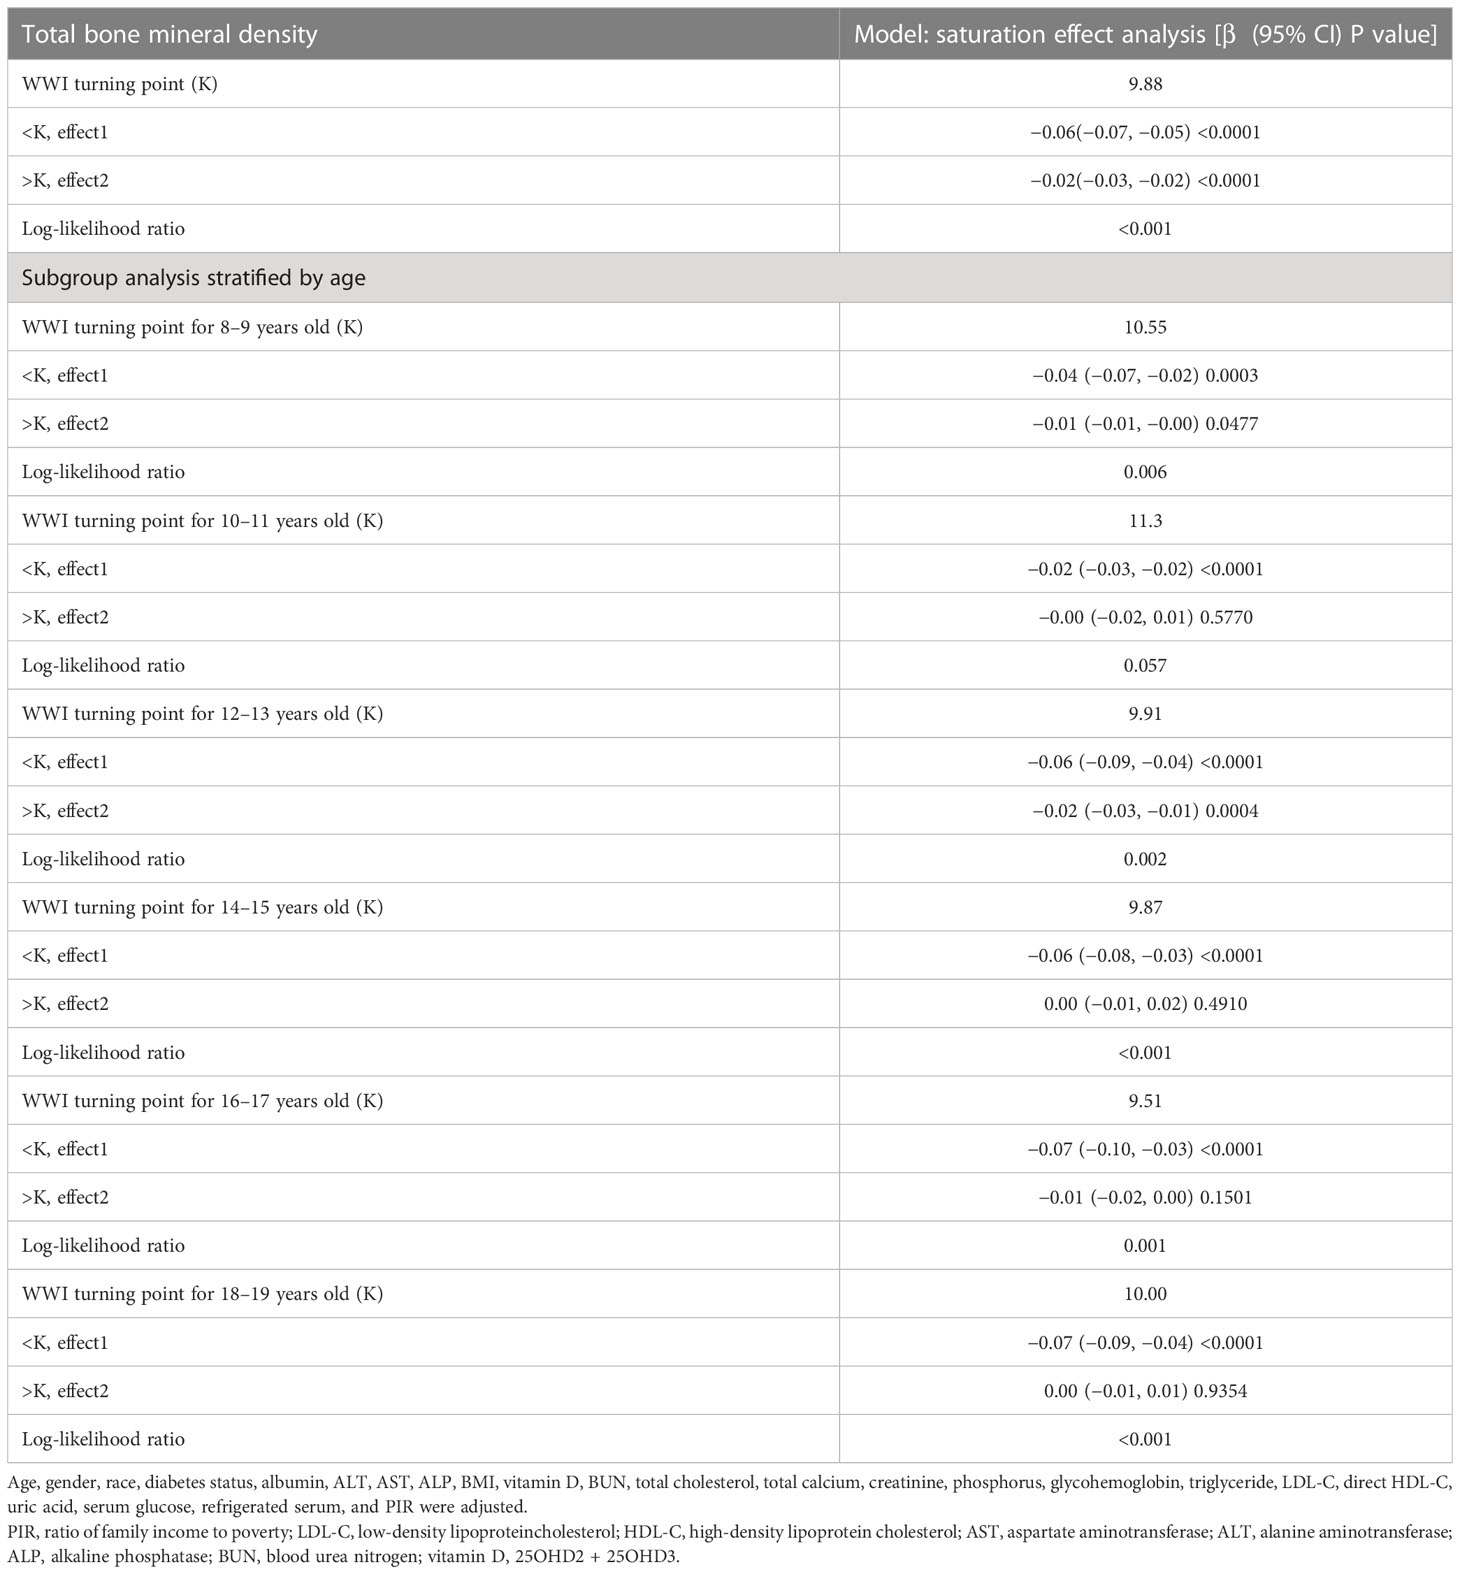
Table 4 Saturation effect analysis of WWI (cm/√kg) on total BMD (g/cm2).
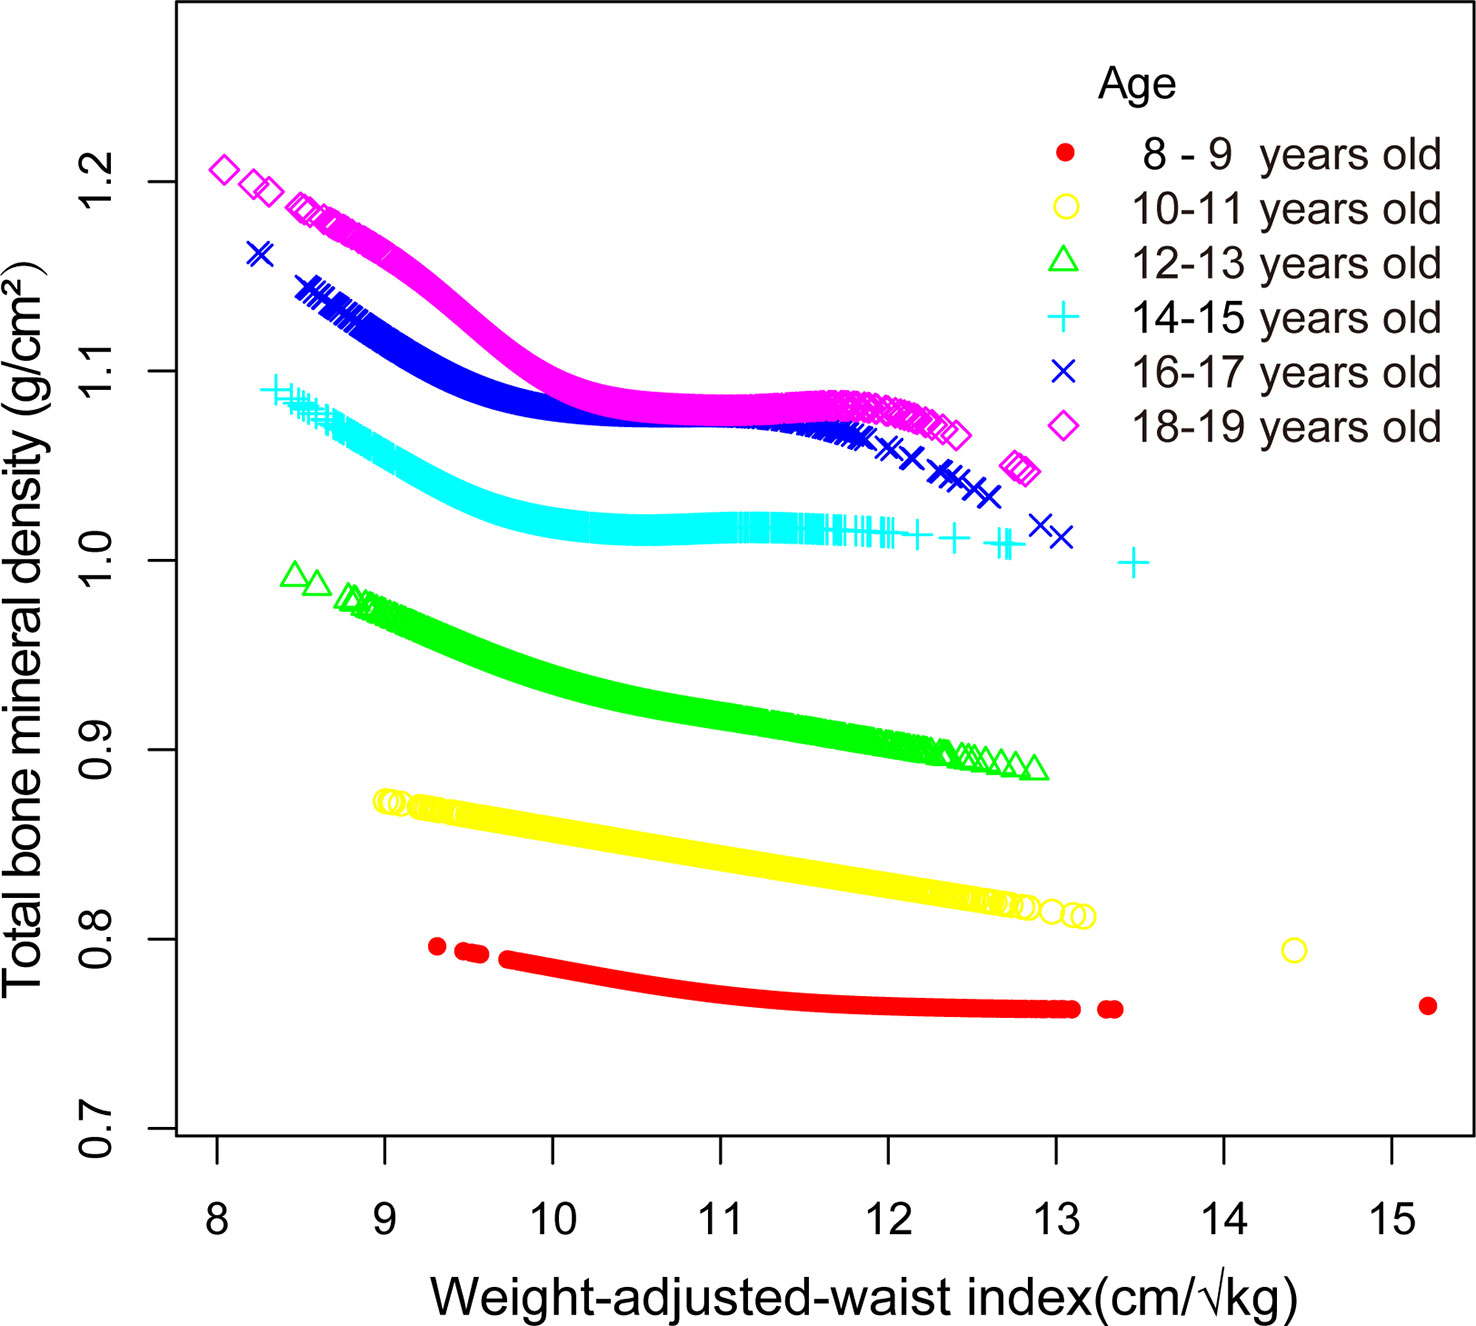
Figure 3 Association between WWI and total bone mineral density stratified by age.
4 Discussion
Our cross-sectional investigation uncovered a notable negative correlation between WWI and total BMD among adolescents. Subgroup analyses and interaction evaluations revealed that this negative correlation remained consistent across all subcategories, with the exception of age, encompassing gender, ethnicity, and diabetes status subgroups. Notably, we discerned an L-shaped association between WWI and total BMD, exhibiting an inflection point at 9.98 cm/√kg.
To the best of our knowledge, this constitutes the first cross-sectional investigation exploring the relationship between WWI and total BMD. Globally, recognized standards for defining obesity include BMI and WC (14, 25–27). Numerous studies have reported a positive correlation between BMI, WC, and BMD (28, 29). Leonard, et al. concluded that childhood and adolescent obesity is linked to increased BMD by analyzing data from 182 children and adolescents aged 4–20 years, gathered from the Nutrition and Growth Laboratory at the Children’s Hospital of Philadelphia, and categorizing them into obese and non-obese groups based on BMI and WC (30). However, due to the limited sample size in this study, additional research with a larger sample is warranted. Ouyang et al. incorporated data from 6,143 adolescents aged 8–19 from the 2011–2020 NHANES and utilized smooth curve fitting and threshold effect analysis for statistical evaluation. The smooth curve fitting results revealed a significant positive association between BMI and BMD. Threshold effect analysis determined that maintaining BMI at saturation (21.5kg/m2) could minimize other adverse consequences and optimize BMD (31). Wang et al. evaluated the association between BMI, WC, and BMD by incorporating data from 4,056 US adolescents aged 8–19 years from the 2011–2018 NHANES. They concluded that both BMI and WC were positively associated with total BMD and that a saturation effect of BMD could be achieved by maintaining BMI at 22 kg/m2 and WC at 70.5 cm (32). However, as research has progressed, some scholars have discovered an obesity paradox when using BMI and WC as obesity measures. The obesity paradox suggests that obesity does not necessarily shorten patients’ expected survival time and that overweight individuals may have a slightly lower risk of death compared to those with normal weight and may even exhibit beneficial effects in some cases. The existence of the obesity paradox raises questions about the validity of BMI and WC as obesity measures among researchers (33–36). Consequently, identifying an obesity index that eliminates the obesity paradox is essential; WWI is a recently devised anthropometric index that has gained recognition as a reliable obesity measure alongside BMI and WC, attributed to its straightforward calculation and capacity to discern between lean and fat masses (37, 38). Contemporary research has substantiated WWI’s ability to differentiate muscle mass from fat mass, and its application has extended to various fields, including cardiovascular disease and obesity (39). Numerous studies have demonstrated that WWI is a distinct anthropometric index positively associated with heart failure incidence and mortality rates (40, 41). Remarkably, the obesity paradox observed in the relationship between BMI and mortality is absent in the association between WWI and mortality (42). Moreover, some researchers contend that the obesity paradox might not exist at all, potentially due to BMI’s limitations in differentiating between muscle mass and fat mass (43, 44). Our findings diverge from prior studies. While earlier research has indicated positive correlations between BMI, WC, and total BMD, our investigation identified a negative association between WWI and total BMD.
At present, the potential mechanisms underpinning the observed negative association between WWI and total BMD are not well elucidated. Several mechanisms might be involved (32). First, excessive body fat accumulation and elevated obesity levels result in increased static mechanical compliance, imposing various static mechanical stresses on bones and inducing alterations in bone structure (45–47). Subsequently, research has indicated that obesity augments the population of adipocytes within the bone marrow while concurrently modifying their metabolic function. The bone marrow houses bone mesenchymal stem cells (BMSCs), which possess the capacity to differentiate into both osteoblasts and adipocytes (48, 49). The presence of obesity has been demonstrated to promote the differentiation of BMSCs towards adipocytes, culminating in a heightened presence of adipocytes within the bone marrow and a concomitant reduction in the osteoblast population (50). Excessive fat cell accumulation within the bone marrow results in an imbalance in osteocyte activity and diminished bone turnover, predisposing individuals to surgical intervention at a younger age (51). Moreover, obesity is associated with an increased susceptibility to inflammation (52). The expansion of adipocytes in the bone marrow microenvironment not only stimulates osteoclastogenesis and activation but also restricts osteoprotegerin secretion, inhibits osteoblast differentiation, and expedites the release of inflammatory and immunomodulatory factors that facilitate osteoclast formation (53, 54).
The conclusions drawn from this study warrant careful consideration, given several constraints. Primarily, the study’s cross-sectional framework hinders the establishment of a causal link between WWI and total BMD. Additionally, database restrictions precluded the collection of information regarding lifestyle, dietary habits, bone metabolism parameters, and calcium and vitamin D intake for all participants, which may have impacted total BMD. Lastly, the unavailability of youth fracture data due to database limitations rendered it infeasible to ascertain whether the fracture incidence was elevated in young individuals with higher WWI compared to the general population. Notwithstanding the aforementioned constraints, the merits of this investigation warrant recognition. Primarily, employing a nationally representative cohort ensured that the results encapsulated the heterogeneity of the youth demographic across the United States. Additionally, the substantial sample size facilitated subgroup analyses by segregating participants aged 8–19 into distinct age categories.
5 Conclusion
This investigation’s outcomes reveal an inverse association and saturation phenomenon between WWI and total BMD among American adolescents. The implications suggest that maintaining WWI within the optimal range could be vital for effectively managing bone metabolic health during this developmental stage. Nonetheless, to corroborate these conclusions, additional longitudinal research with more extensive cohorts is required.
Data availability statement
Publicly available datasets were analyzed in this study. This data can be found here: https://www.cdc.gov/nchs/nhanes/index.htm.
Ethics statement
The studies involving human participants were reviewed and approved by The National Research Ethics Committee. Written informed consent to participate in this study was provided by the participants’ legal guardian/next of kin.
Author contributions
XW and LX designed the research. XW, SY, and GH collected and analyzed the data. XW drafted the manuscript. LX revised the manuscript. All authors contributed to the article and approved the submitted version.
Funding
The current research was funded by Jiangsu Provincial Traditional Chinese Medicine Science and Technology Development Plan Project (2020 ZD202008), Science and Technology Projects in Jiangsu Province (2019 BE2019765), and Natural Science Foundation of Jiangsu Province (BK20221420).
Conflict of interest
The authors declare that the research was conducted in the absence of any commercial or financial relationships that could be construed as a potential conflict of interest.
Publisher’s note
All claims expressed in this article are solely those of the authors and do not necessarily represent those of their affiliated organizations, or those of the publisher, the editors and the reviewers. Any product that may be evaluated in this article, or claim that may be made by its manufacturer, is not guaranteed or endorsed by the publisher.
Abbreviations
WWI, weight-adjusted waist index; BMI, body mass index; WC, waist circumference; BMD, bone mineral density; OP, osteoporosis; PBM, peak bone mass; NHANES, National Health and Nutrition Examination Survey; ALP, alkaline phosphatase; AST, aspartate aminotransferase; HDL-C, high-density lipoprotein cholesterol; LDL-C, low-density lipoprotein cholesterol; PIR, ratio of family income to poverty; BUN, blood urea nitrogen; NCHS, National Center for Health Statistics.
References
1. Fassio A, Idolazzi L, Rossini M, Gatti D, Adami G, Giollo A, et al. The obesity paradox and osteoporosis. Eat Weight Disord (2018) 23:293–302. doi: 10.1007/s40519-018-0505-2
2. Bliuc D, Nguyen ND, Milch VE, Nguyen TV, Eisman JA, Center JR. Mortality risk associated with low-trauma osteoporotic fracture and subsequent fracture in men and women. Jama (2009) 301:513–21. doi: 10.1001/jama.2009.50
3. Barrett-Connor E, Siris ES, Wehren LE, Miller PD, Abbott TA, Berger ML, et al. Osteoporosis and fracture risk in women of different ethnic groups. J Bone Miner Res (2005) 20:185–94. doi: 10.1359/JBMR.041007
4. Qaseem A, Forciea MA, McLean RM, Denberg TD, Barry MJ, Cooke M, et al. Treatment of low bone density or osteoporosis to prevent fractures in men and women: a clinical practice guideline update from the American college of physicians. Ann Intern Med (2017) 166:818–39. doi: 10.7326/M15-1361
5. Baxter-Jones AD, Faulkner RA, Forwood MR, Mirwald RL, Bailey DA. Bone mineral accrual from 8 to 30 years of age: an estimation of peak bone mass. J Bone Miner Res (2011) 26:1729–39. doi: 10.1002/jbmr.412
6. Pan K, Zhang C, Yao X, Zhu Z. Association between dietary calcium intake and BMD in children and adolescents. Endocr Connect (2020) 9:194–200. doi: 10.1530/EC-19-0534
7. Yang Y, Wu F, Winzenberg T, Jones G. Tracking of areal bone mineral density from age eight to young adulthood and factors associated with deviation from tracking: a 17-year prospective cohort study. J Bone Miner Res (2018) 33:832–9. doi: 10.1002/jbmr.3361
8. Foley S, Quinn S, Jones G. Tracking of bone mass from childhood to adolescence and factors that predict deviation from tracking. Bone (2009) 44:752–7. doi: 10.1016/j.bone.2008.11.009
9. Ma CM, Lu N, Zhang MM, Kong FS, Lu Q, Yin FZ, et al. The relationship between obesity and bone mineral density in children and adolescents: analysis of the national health and nutrition examination survey. Arch Osteoporos (2023) 18:25. doi: 10.1007/s11657-022-01208-4
10. Rinonapoli G, Pace V, Ruggiero C, Ceccarini P, Bisaccia M, Meccariello L, et al. Obesity and bone: a complex relationship. Int J Mol Sci (2021) 22:24. doi: 10.3390/ijms222413662
11. Skinner AC, Ravanbakht SN, Skelton JA, Perrin EM, Armstrong SC. Prevalence of obesity and severe obesity in US children, 1999-2016. Pediatr (2018) 141(3):e20173459. doi: 10.1542/peds.2017-3459
12. Jackson AS, Stanforth PR, Gagnon J, Rankinen T, Leon AS, Rao DC, et al. The effect of sex, age and race on estimating percentage body fat from body mass index: the heritage family study. Int J Obes Relat Metab Disord (2002) 26:789–96. doi: 10.1038/sj.ijo.0802006
13. Lam BC, Koh GC, Chen C, Wong MT, Fallows SJ. Comparison of body mass index (BMI), body adiposity index (BAI), waist circumference (WC), waist-To-Hip ratio (WHR) and waist-To-Height ratio (WHtR) as predictors of cardiovascular disease risk factors in an adult population in Singapore. PloS One (2015) 10:e0122985. doi: 10.1371/journal.pone.0122985
14. Cornier MA, Després JP, Davis N, Grossniklaus DA, Klein S, Lamarche B, et al. Assessing adiposity: a scientific statement from the American heart association. Circulation (2011) 124:1996–2019. doi: 10.1161/CIR.0b013e318233bc6a
15. Pischon T, Boeing H, Hoffmann K, Bergmann M, Schulze MB, Overvad K, et al. General and abdominal adiposity and risk of death in Europe. N Engl J Med (2008) 359:2105–20. doi: 10.1056/NEJMoa0801891
16. Park Y, Kim NH, Kwon TY, Kim SG. A novel adiposity index as an integrated predictor of cardiometabolic disease morbidity and mortality. Sci Rep (2018) 8:16753. doi: 10.1038/s41598-018-35073-4
17. Li Q, Qie R, Qin P, Zhang D, Guo C, Zhou Q, et al. Association of weight-adjusted-waist index with incident hypertension: the rural Chinese cohort study. Nutr Metab Cardiovasc Dis (2020) 30:1732–41. doi: 10.1016/j.numecd.2020.05.033
18. Ding C, Shi Y, Li J, Li M, Hu L, Rao J, et al. Association of weight-adjusted-waist index with all-cause and cardiovascular mortality in China: a prospective cohort study. Nutr Metab Cardiovasc Dis (2022) 32:1210–7. doi: 10.1016/j.numecd.2022.01.033
19. Liu Y, Liu X, Zhang S, Zhu Q, Fu X, Chen H, et al. Association of anthropometric indices with the development of diabetes among hypertensive patients in China: a cohort study. Front Endocrinol (Lausanne) (2021) 12:736077. doi: 10.3389/fendo.2021.736077
20. Curtin LR, Mohadjer LK, Dohrmann SM, Kruszon-Moran D, Mirel LB, Carroll MD, et al. National health and nutrition examination survey: sample design, 2007-2010. Vital Health Stat (2013) 2:1–23.
21. Xie R, Zhang Y. Is assessing the degree of hepatic steatosis and fibrosis based on index calculations the best choice for epidemiological studies? Environ pollut (2023) 317:120783. doi: 10.1016/j.envpol.2022.120783
22. Xie R, Zhang Y. Association between 19 dietary fatty acids intake and rheumatoid arthritis: results of a nationwide survey. Prostaglandins Leukot Essent Fatty Acids (2023) 188:102530. doi: 10.1016/j.plefa.2022.102530
23. Xie R, Zhang Y. Associations between dietary flavonoid intake with hepatic steatosis and fibrosis quantified by VCTE: evidence from NHANES and FNDDS. Nutr Metab Cardiovasc Dis (2023) S0939–4753(23)00090-X. doi: 10.1016/j.numecd.2023.03.005
24. Xie R, Liu Y, Wang J, Zhang C, Xiao M, Liu M, et al. Race and gender differences in the associations between cadmium exposure and bone mineral density in US adults. Biol Trace Elem Res (2022). doi: 10.1007/s12011-022-03521-y
25. Browning LM, Hsieh SD, Ashwell M. A systematic review of waist-to-height ratio as a screening tool for the prediction of cardiovascular disease and diabetes: 0·5 could be a suitable global boundary value. Nutr Res Rev (2010) 23:247–69. doi: 10.1017/S0954422410000144
26. Nguyen NT, Magno CP, Lane KT, Hinojosa MW, Lane JS. Association of hypertension, diabetes, dyslipidemia, and metabolic syndrome with obesity: findings from the national health and nutrition examination survey, 1999 to 2004. J Am Coll Surg (2008) 207:928–34. doi: 10.1016/j.jamcollsurg.2008.08.022
27. Wilson PW, D'Agostino RB, Sullivan L, Parise H, Kannel WB. Overweight and obesity as determinants of cardiovascular risk: the framingham experience. Arch Intern Med (2002) 162:1867–72. doi: 10.1001/archinte.162.16.1867
28. Julian V, O'Malley G, Metz L, Weghuber D, Courteix D, Fillon A, et al. Does the severity of obesity influence bone density, geometry and strength in adolescents? Pediatr Obes (2021) 16:e12826. doi: 10.1111/ijpo.12826
29. Zhang L, Li H, Zhang Y, Kong Z, Zhang T, Zhang Z. Association of body compositions and bone mineral density in chinese children and adolescents: compositional data analysis. BioMed Res Int (2021) 2021:1904343. doi: 10.1155/2021/1904343
30. Leonard MB, Shults J, Wilson BA, Tershakovec AM, Zemel BS. Obesity during childhood and adolescence augments bone mass and bone dimensions. Am J Clin Nutr (2004) 80:514–23. doi: 10.1093/ajcn/80.2.514
31. Ouyang Y, Quan Y, Guo C, Xie S, Liu C, Huang X, et al. Saturation effect of body mass index on bone mineral density in adolescents of different ages: a population-based study. Front Endocrinol (Lausanne) (2022) 13:922903. doi: 10.3389/fendo.2022.922903
32. Wang GX, Fang ZB, Li HL, Liu DL, Chu SF, Zhao HX. Effect of obesity status on adolescent bone mineral density and saturation effect: a cross-sectional study. Front Endocrinol (Lausanne) (2022) 13:994406. doi: 10.3389/fendo.2022.994406
33. Mesinovic J, Jansons P, Zengin A, de Courten B, Rodriguez AJ, Daly RM, et al. Exercise attenuates bone mineral density loss during diet-induced weight loss in adults with overweight and obesity: a systematic review and meta-analysis. J Sport Health Sci (2021) 10:550–9. doi: 10.1016/j.jshs.2021.05.001
34. Aparisi Gómez MP, Ayuso Benavent C, Simoni P, Aparisi F, Guglielmi G, Bazzocchi A. Fat and bone: the multiperspective analysis of a close relationship. Quant Imaging Med Surg (2020) 10:1614–35. doi: 10.21037/qims.2020.01.11
35. Chin KY, Wong SK, Ekeuku SO, Pang KL. Relationship between metabolic syndrome and bone health - an evaluation of epidemiological studies and mechanisms involved. Diabetes Metab Syndr Obes (2020) 13:3667–90. doi: 10.2147/DMSO.S275560
36. Jensen VFH, Mølck AM, Dalgaard M, McGuigan FE, Akesson KE. Changes in bone mass associated with obesity and weight loss in humans: applicability of animal models. Bone (2021) 145:115781. doi: 10.1016/j.bone.2020.115781
37. Kim JY, Choi J, Vella CA, Criqui MH, Allison MA, Kim NH. Associations between weight-adjusted waist index and abdominal fat and muscle mass: multi-ethnic study of atherosclerosis. Diabetes Metab J (2022) 46:747–55. doi: 10.4093/dmj.2021.0294
38. Wu L, Zhu W, Qiao Q, Huang L, Li Y, Chen L. Novel and traditional anthropometric indices for identifying metabolic syndrome in non-overweight/obese adults. Nutr Metab (Lond) (2021) 18:3. doi: 10.1186/s12986-020-00536-x
39. Kim JE, Choi J, Kim M, Won CW. Assessment of existing anthropometric indices for screening sarcopenic obesity in older adults. Br J Nutr (2023) 129:875–87. doi: 10.1017/S0007114522001817
40. Zhang D, Shi W, Ding Z, Park J, Wu S, Zhang J. Association between weight-adjusted-waist index and heart failure: results from national health and nutrition examination survey 1999-2018. Front Cardiovasc Med (2022) 9:1069146. doi: 10.3389/fcvm.2022.1069146
41. Cai S, Zhu T, Ding Y, Cheng B, Zhang A, Bao Q, et al. The relationship between the weight-adjusted-waist index and left ventricular hypertrophy in Chinese hypertension adults. Hypertens Res (2023) 46:253–60. doi: 10.1038/s41440-022-01075-z
42. Kim NH, Park Y, Kim NH, Kim SG. Weight-adjusted waist index reflects fat and muscle mass in the opposite direction in older adults. Age Ageing (2021) 50:780–6. doi: 10.1093/ageing/afaa208
43. Antonopoulos AS, Oikonomou EK, Antoniades C, Tousoulis D. From the BMI paradox to the obesity paradox: the obesity-mortality association in coronary heart disease. Obes Rev (2016) 17:989–1000. doi: 10.1111/obr.12440
44. Standl E, Erbach M, Schnell O. Defending the con side: obesity paradox does not exist. Diabetes Care (2013) 36 Suppl 2:S282–6. doi: 10.2337/dcS13-2040
45. Lanyon LE. Control of bone architecture by functional load bearing. J Bone Miner Res (1992) 7 Suppl 2:S369–75. doi: 10.1002/jbmr.5650071403
46. Hla MM, Davis JW, Ross PD, Wasnich RD, Yates AJ, Ravn P, et al. A multicenter study of the influence of fat and lean mass on bone mineral content: evidence for differences in their relative influence at major fracture sites. Early Postmenopausal Intervention Cohort (EPIC) Study Group Am J Clin Nutr (1996) 64:354–60. doi: 10.1093/ajcn/64.3.345
47. Dakanalis A, Mentzelou M, Papadopoulou SK, Papandreou D, Spanoudaki M, Vasios GK, et al. The association of emotional eating with overweight/obesity, depression, anxiety/stress, and dietary patterns: a review of the current clinical evidence. Nutrients (2023) 15:5. doi: 10.3390/nu15051173
48. Zong Q, Bundkirchen K, Neunaber C, Noack S. Are the properties of bone marrow-derived mesenchymal stem cells influenced by overweight and obesity? Int J Mol Sci (2023) 24:5. doi: 10.3390/ijms24054831
49. Vanhie JJ, Kim W, Ek Orloff L, Ngu M, Collao N, De Lisio M. The role of exercise-and high fat diet-induced bone marrow extracellular vesicles in stress hematopoiesis. Front Physiol (2022) 13:1054463. doi: 10.3389/fphys.2022.1054463
50. Khan AU, Qu R, Fan T, Ouyang J, Dai J. A glance on the role of actin in osteogenic and adipogenic differentiation of mesenchymal stem cells. Stem Cell Res Ther (2020) 11:283. doi: 10.1186/s13287-020-01789-2
51. Fintini D, Cianfarani S, Cofini M, Andreoletti A, Ubertini GM, Cappa M, et al. The bones of children with obesity. Front Endocrinol (Lausanne) (2020) 11:200. doi: 10.3389/fendo.2020.00200
52. Guerrero-Romero F, Castellanos-Juárez FX, Salas-Pacheco JM, Morales-Gurrola FG, Salas-Leal AC, Simental-Mendía LE. Association between the expression of TLR4, TLR2, and MyD88 with low-grade chronic inflammation in individuals with metabolically healthy obesity. Mol Biol Rep (2023) 50(5):4723–8. doi: 10.1007/s11033-023-08338-z
53. Segar AH, Fairbank JCT, Urban J. Leptin and the intervertebral disc: a biochemical link exists between obesity, intervertebral disc degeneration and low back pain-an in vitro study in a bovine model. Eur Spine J (2019) 28:214–23. doi: 10.1007/s00586-018-5778-7
Keywords: bone mineral density, NHANES, obese, osteoporosis, weight-adjusted-waist index, adolescent
Citation: Wang X, Yang S, He G and Xie L (2023) The association between weight-adjusted-waist index and total bone mineral density in adolescents: NHANES 2011–2018. Front. Endocrinol. 14:1191501. doi: 10.3389/fendo.2023.1191501
Received: 22 March 2023; Accepted: 03 May 2023;
Published: 17 May 2023.
Edited by:
Helen Knowles, University of Oxford, United KingdomReviewed by:
Anna Kęska, Józef Piłsudski University of Physical Education in Warsaw, PolandRuijie Xie, German Cancer Research Center (DKFZ), Germany
Mingjiang Liu, University of South China, China
Copyright © 2023 Wang, Yang, He and Xie. This is an open-access article distributed under the terms of the Creative Commons Attribution License (CC BY). The use, distribution or reproduction in other forums is permitted, provided the original author(s) and the copyright owner(s) are credited and that the original publication in this journal is cited, in accordance with accepted academic practice. No use, distribution or reproduction is permitted which does not comply with these terms.
*Correspondence: Lin Xie, eGllbGluQG5qdWNtLmVkdS5jbg==