 Marieh Salavatizadeh1,2
 Samira Soltanieh1,2
 Amirhossein Ataei Kachouei3Zahra Abdollahi Fallahi4
 Hamed Kord-Varkaneh5Hossein Poustchi6
 Asieh Mansour7Mohammad E. Khamseh2
 Fariba Alaei-Shahmiri2
 Heitor O. Santos8
 Azita Hekmatdoost1*
- 1Department of Clinical Nutrition and Dietetics, Faculty of Nutrition and Food Technology, Shahid Beheshti University of Medical Sciences, Tehran, Iran
- 2Endocrine Research Center, Institute of Endocrinology and Metabolism, Iran University of Medical Sciences, Tehran, Iran
- 3Department of Clinical Nutrition, School of Nutrition & Food Science, Isfahan University of Medical Sciences, Isfahan, Iran
- 4Science and Research Branch, Islamic Azad University, Tehran, Iran
- 5Department of Nutrition and Food Hygiene, School of Medicine, Nutrition Health Research Center, Hamadan University of Medical Sciences, Hamadan, Iran
- 6Liver and Pancreatobiliary Diseases Research Center, Digestive Diseases Research Institute, Shariati Hospital, Tehran University of Medical Sciences, Tehran, Iran
- 7Endocrinology and Metabolism Research Center, Endocrinology and Metabolism Clinical Sciences Institute, Tehran University of Medical Sciences, Tehran, Iran
- 8School of Medicine, Federal University of Uberlandia (UFU), Uberlandia, Minas Gerais, Brazil
Objective: Managing dietary glycemic index (GI) deserves further attention in the interplay between non-alcoholic fatty liver disease (NAFLD) and type 2 diabetes mellitus (T2DM). This study aimed to evaluate the relationship between dietary GI and the odds of NAFLD in patients with T2DM.
Methods: A cross-sectional study was carried out between April 2021 and February 2022, including 200 participants with T2DM aged 18-70 years, of which 133 had NAFLD and 67 were in the non-NAFLD group. Cardiometabolic parameters were analyzed using standard biochemical kits and dietary intake was assessed using a validated food frequency questionnaire. Binary logistic regression was applied to explore odds ratios (ORs) and 95% confidence intervals (CIs) for NAFLD according to tertiles of dietary GI.
Results: Highest vs. lowest tertile (< 57 vs. > 60.89) of energy-adjusted GI was not associated with the odds of having NAFLD (OR 1.25, 95% CI = 0.6-2.57; P-trend = 0.54) in the crude model. However, there was an OR of 3.24 (95% CI = 1.03-10.15) accompanied by a significant trend (P-trend = 0.04) after full control for potential confounders (age, gender, smoking status, duration of diabetes, physical activity, waist circumference, HbA1c, triglycerides, total cholesterol, dietary intake of total carbohydrates, simple carbohydrates, fat, and protein).
Conclusion: High dietary GI is associated with increased odds of NAFLD in subjects with T2DM. However, interventional and longitudinal cohort studies are required to confirm these findings.
1 Introduction
Diabetes is one of the main health issues worldwide with an estimated prevalence of 9.3% (463 million), reaching 10.2% (578 million) by 2030. Within this population, almost 90% have type 2 diabetes mellitus (T2DM) (1). It is a metabolic disorder characterized by hyperglycemia resulting from either insufficient insulin secretion or ineffective insulin action (2). Deficit in insulin secretion and high insulin resistance increase the lipase enzyme activity gradually leading to impairment of free fatty acid (FFA) metabolism and exceeding the amount of FFA beyond the liver’s ability to oxidize (3, 4). Over-accumulation of these FFAs in the form of hepatic triglycerides (TG) results in a phenomenon known as nonalcoholic fatty liver disease (NAFLD) (4).
NAFLD occurs in 75% of T2DM patients (5). In contrast, T2DM is present in nearly a quarter of patients with NAFLD, and approximately half of the non-alcoholic steatohepatitis patients (5). This coexistence occurs due to shared pathogenic abnormalities caused by excess adipose tissue and insulin resistance (6). Furthermore, the concomitant presence of T2DM and NAFLD has been proposed to be associated with higher overall mortality and mortality related to liver and cardiovascular diseases (3, 7). Therefore, it seems crucial to detect the contributing factors of this co-occurrence.
Nutrition is known as a major modifiable environmental factor in the development and management of NAFLD (8), whose disease when left untreated increases the risk of hepatic and extra-hepatic cancers (e.g., lung, breast, gynecologic, and urinary system cancers) (9–11). The glycemic index (GI) has been studied extensively as a contributing factor for T2DM (12), as well as for alarming diseases such as cancer (13). GI is defined as the ratio between the area under the glucose response curve after consumption of 50 g carbohydrates from a test food and the area under the curve after consumption of 50 g reference food (either white bread or glucose) (14, 15). Food sources of carbohydrates that are digested, absorbed, and metabolized quickly are referred to as high GI foods (16). On the other hand, food sources of carbohydrates with slow digestion, absorption, and metabolism are considered low GI foods (16).
Several studies suggest that a low GI diet may reduce insulin resistance (17–19). In a meta-analysis of cohort studies, diets higher in GI significantly increased the risk of T2DM in healthy individuals regardless of dietary fiber (12). In addition, a meta-analysis of randomized clinical trials (RCTs) suggested anti-inflammatory properties of diets with low overall dietary GI (20). Interestingly, a low GI Mediterranean diet decreased NAFLD scores in an RCT (21). Conversely, diets with high total dietary GI could increase indicators of systemic inflammation considered to be key factors of the NAFLD risk in individuals with T2DM (22, 23).
Therefore, individuals with T2DM need to specifically be considered in the evaluation of potential dietary prevention strategies for NAFLD. Correspondingly, to the best of our knowledge, the association between dietary GI and the development of NAFLD in individuals with T2DM has not yet been examined. Thus, the present study was conducted to assess possible associations between dietary GI and odds of NAFLD in individuals with T2DM.
2 Materials and methods
2.1 Study participants
This cross-sectional study was carried out between April 2021 and February 2022 on patients with T2DM aged between18-70 years from the diabetes clinic affiliated with the Institute of Diabetes and Metabolism, Iran University of Medical Sciences, Tehran, Iran.
Patients with a history of any type of pathologically confirmed cancer, chemotherapy or radiotherapy (due to cancer), drug use, chronic inflammatory disease, heart failure, myocardial infarction, and kidney disease were not included in the study. Moreover, participants were excluded upon recently weight-loss diet, taking weight-loss medications, pregnancy, lactation, more than 10% weight reduction during the last 6 months, history of acute and chronic liver diseases (hepatitis, autoimmune disease, biliary disease, hereditary disorders of the liver including Wilson’s disease) and hemochromatosis, and using toxins or drugs affecting the liver such as NSAIDs, anti-inflammatory drugs, etc. Participants with a clear drinking history (≥21 units/week in men and ≥14 units/week in women) were also excluded from the study. Patients who were on insulin therapy were not included. Therefore, participants took only oral hypoglycemic agents for diabetes control. Body mass index (BMI) ≥ 23 kg/m2 was an inclusion criterion for all subjects. The participant selection flowchart is indicated in Figure 1. In order to detect and quantify liver steatosis, we used the controlled attenuation parameter (CAP) determined by transient elastography (TE) using the FibroScan®, equipped with M and XL probes. In the present study, the cut-off value for diagnosing hepatic steatosis was the CAP value > 270 dB/m (24). Data on demographic characteristics were collected by means of a standard questionnaire by trained interviewers.
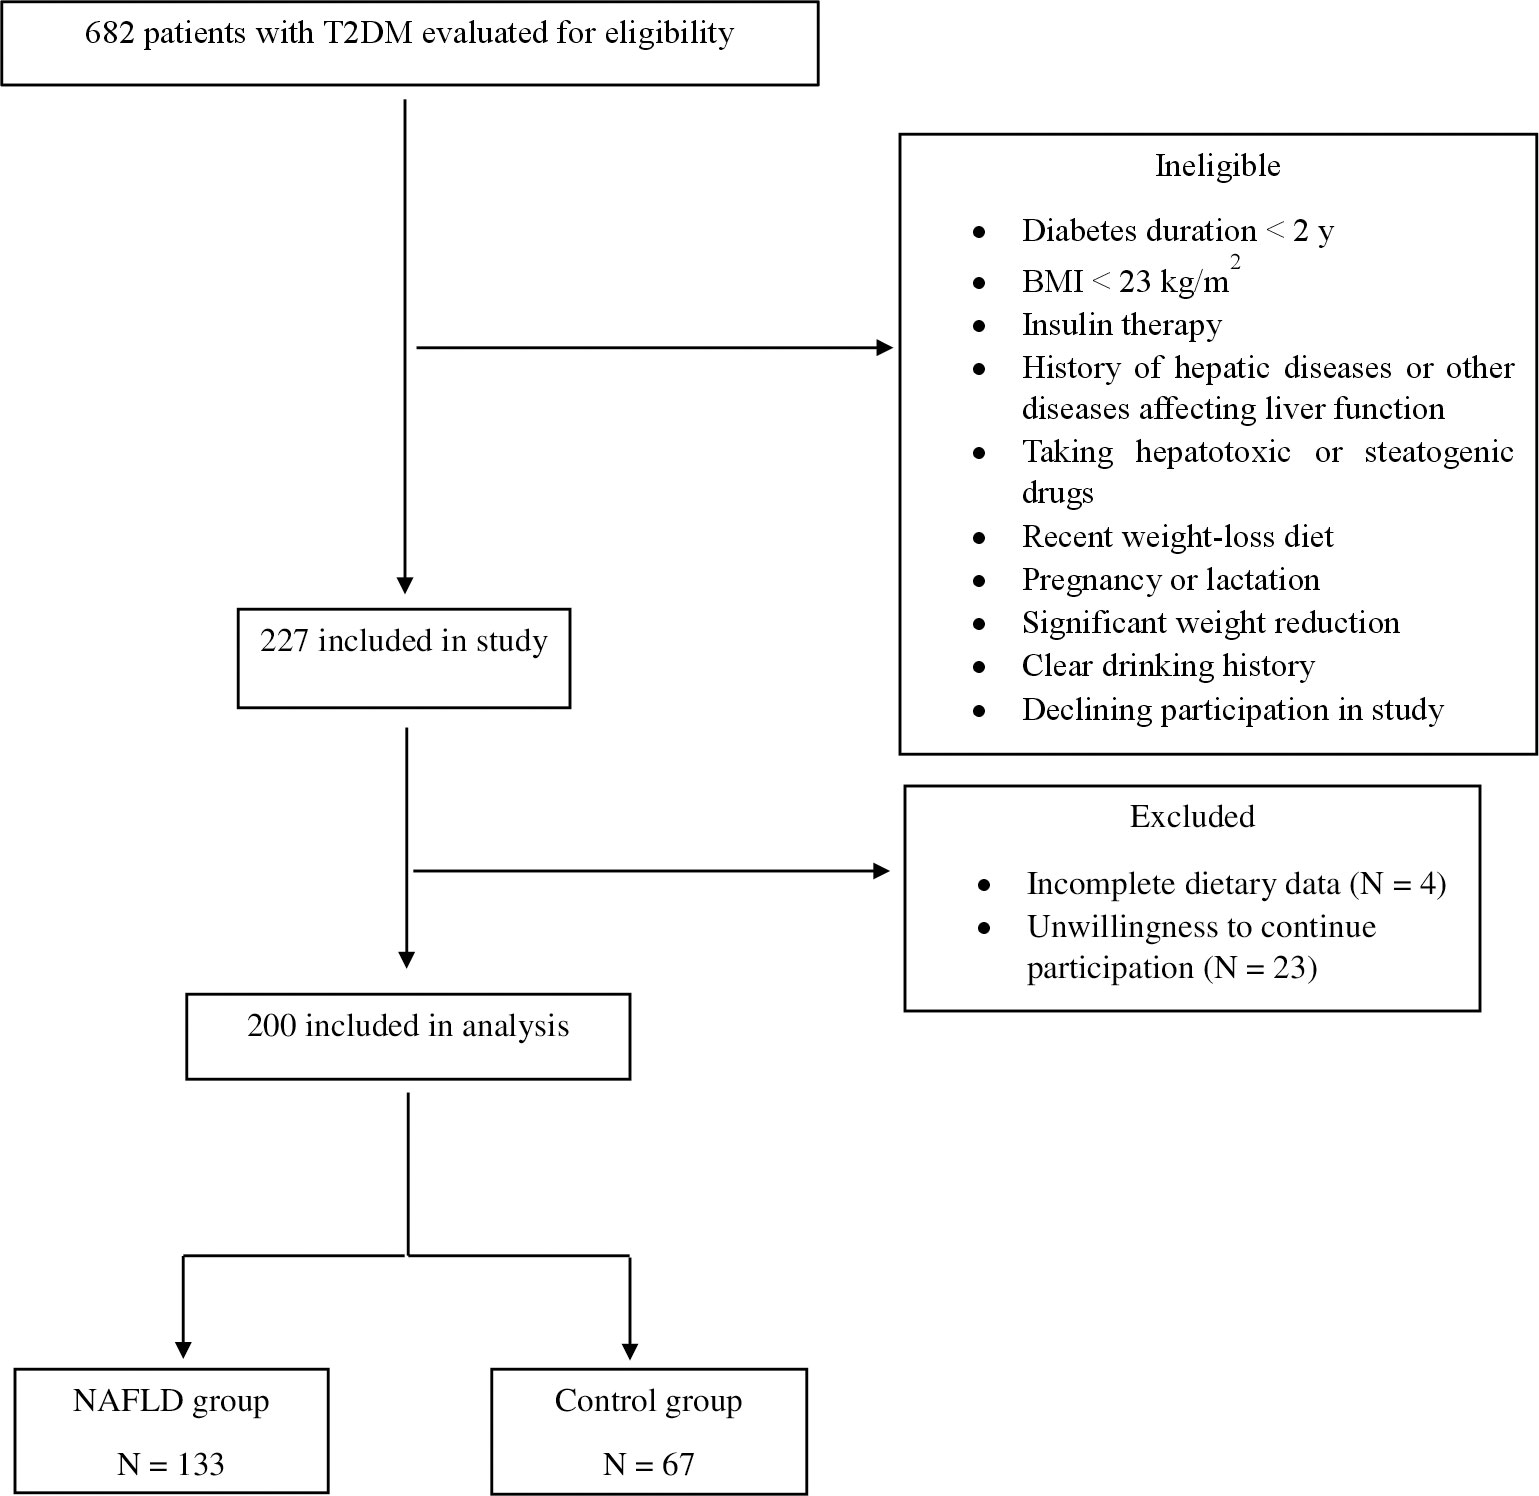
Figure 1 Flow chart of participation.
The study protocol was approved by the Ethics Committee of the Shahid Beheshti University of Medical Sciences (NO: IR.SBMU.NNFTRI.REC.1399.061). Eligible volunteers were selected by the use of the consecutive-sampling method and provided informed written consent, prior to study commencement.
2.2 Sample size calculation
The sample size was based on a previous study (25) with SGOT levels of 14 ± 7 and 11 ± 3 IU/L for patients suffering from T2DM with and without NAFLD, respectively. At 95% CI and 80% power of the study, a sample of at least 56 subjects in each group was estimated using the following formula:
2.3 Anthropometric and physical activity assessments
Subjects’ body mass (kg) was evaluated unshod and in light clothing using a digital scale (Seca, Germany) to the nearest 100 g. Height was measured without shoes in a standing position using a fixed tape measure to the nearest 0.5 cm. Finally, BMI was calculated by dividing weight (kg) by the square of height (meters).
The International Physical Activity Questionnaire (IPAQ) short form was applied to assess subjects’ physical activity during the last 7 days and was expressed as the metabolic equivalent task (MET)-min/week (26). The validity and reliability of this questionnaire have previously been evaluated in Iranian adult women. Blood pressure was measured for all participants using an automatic sphygmomanometer (OMRON, Germany) on the left arm in a sitting position after a rest of at least 10 minutes. By selecting an appropriate cuff size and preventing patients from speaking during measurements, errors were avoided.
2.4 Laboratory measurements
Venous blood samples were collected after 10-12 hours of overnight fasting. The enzymatic colorimetric method was applied to determine fasting blood sugar (FBS) levels. Enzymatic assays were performed to measure the serum levels of TG, total cholesterol (TC), and high-density lipoprotein (HDL) by the use of standard biochemical kits (Pars Azmun Co., Iran) with between- and within-run coefficient of variations<6.2%. Low-density lipoprotein (LDL) was calculated through the use of the modified version of the Friedewald equation (27). Roche Diagnostics kits (Roche Cobas 6000 analyzer) were used to measure serum insulin levels by means of the ECLIA method. HOMA-IR (Homeostatic Model Assessment for Insulin Resistance) was calculated by the following equation: (28). QUICKI (Quantitative Insulin Sensitivity Check Index) was computed as (29). TyG (Triglyceride and glucose) index was determined as (30).
2.5 Dietary intake assessment
Dietary intakes of participants over the past year were examined using a validated 147-item semi-quantitative food frequency questionnaire (FFQ) (31). An expert registered dietitian was totally unaware of the participants’ condition (in terms of having NAFLD) and applied the FFQ via face-to-face interviews. Each participant reported the average intake of different food items during the preceding year on a daily, weekly, or monthly basis which was converted to grams per day using household measures (32). Subsequently, daily nutrients and energy intakes were determined using Nutritionist 4 software (First Databank Inc., Hearst Corp., San Bruno, CA, USA) modified for Iranian foods.
2.6 Calculation of the dietary glycemic index
The GI of every consumed food item was calculated by using the following formula: (GI × available carbohydrate per one gram of food × gram per day of food)/total available carbohydrate, where total available carbohydrates were determined as daily consumed carbohydrates minus total fiber consumed daily (33). The daily GI values of each carbohydrate-containing food and beverage were determined based on the International Glycemic Index Table 2008 (34). The Iranian GI table was used for calculating the GI for some Iranian food which did not found in the international table (35). Moreover, for food items whose GI was not available on these tables, physically and chemically similar foods were used. Glucose was applied as a reference food to determine the GI variable in this study. For composite mixed meals, the GI values were estimated based on the GIs of individual food components (35). The overall dietary GI was calculated by summing the GIs for all foods consumed in the diet. Dietary glycemic index was adjusted for total energy intake by the residual method (36).
2.7 Statistical analysis
The results are presented as mean ± standard deviation (SD) for continuous data and percent for qualitative data. The normality of the data distribution was checked using the Kolmogorov–Smirnov test and the histogram chart. The independent Student’s t-test and Mann–Whitney test were used to compare general characteristics with normal and abnormal distributions between the study groups, respectively. The X2 test was applied for qualitative variables.
Participants were categorized into tertiles of dietary GI. Comparisons for general characteristics, biochemical parameters, and dietary intakes across tertiles of dietary GI were performed by applying the Kruskal-Wallis test and analysis of covariance (ANOVA) for continuous variables and the X2 test for categorical variables. Binary logistic regression in different models was used to explore the association between dietary GI and NAFLD in patients with T2DM. In all analyses, the first tertile of dietary GI was regarded as the reference category. A broad range of confounders was controlled to examine whether the association was independent of them. We used a stepwise (forward) selection procedure for modeling, and variables entered as confounders to the logistic models based on the following confounding criteria: 1) differed between the NAFLD and non-NAFLD groups, 2) associated with the exposure of interest (dietary GI) and 3) not an intermediate the pathway. Moreover, all covariates were assessed for multicollinearity. The exponential of betas was interpreted as Odds Ratios. The tertiles of the dietary GI were included as an ordinal variable in the model to examine the overall trend of ORs. All statistical analyses were performed using SPSS (SPSS Inc., version 25). P-values less than 0.05 were considered significant.
3 Results
In this study, 200 subjects were enrolled and divided into two groups: NAFLD and non-NAFLD groups, on the basis of CAP score. Those with a CAP score > 270 dB/m were regarded as the NAFLD group whereas participants in the non-NAFLD group had a CAP score ≤ 270 dB/m. Comparisons for characteristics between NAFLD and non-NAFLD groups are presented in Table 1. Participants had a mean age of 52.21 ± 9.27 years. Women accounted for 58.64% of the individuals with NAFLD, while 44.77% of the non-NAFLD group were women. Compared to the non-NAFLD group, patients with NAFLD significantly had higher values of BMI (p<0.001), WC (p<0.001), TC (p=0.002), TG (p=0.005), LDL (p=0.005), SGPT (p=0.02), SGOT (p=0.04), HbA1c (p=0.01), and TyG index (p=0.02), as well as HOMA-IR (P<0.001) while QUICKI was significantly lower in NAFLD group (P<0.001). However, there was no statistically significant difference considering smoking status, duration of diabetes, blood pressure, physical activity, FBS, HDL, and dietary GI.

Table 1 General characteristics of enrolled subjects‡.
General characteristics of the participants are represented in Table 2 based on dietary GI tertiles. Age (p=0.002), duration of diabetes (p=0.005), body mass (p=0.03), HDL among men (p=0.001), SGOT (p=0.03), insulin (p<0.001), HOMA-IR (p<0.001), and QUICKI (p<0.001) were significantly different between dietary GI tertiles. However, there was no significant difference in the distribution of sex, smoking status, BMI, blood pressure, physical activity, TyG index, FBS, and HbA1c.
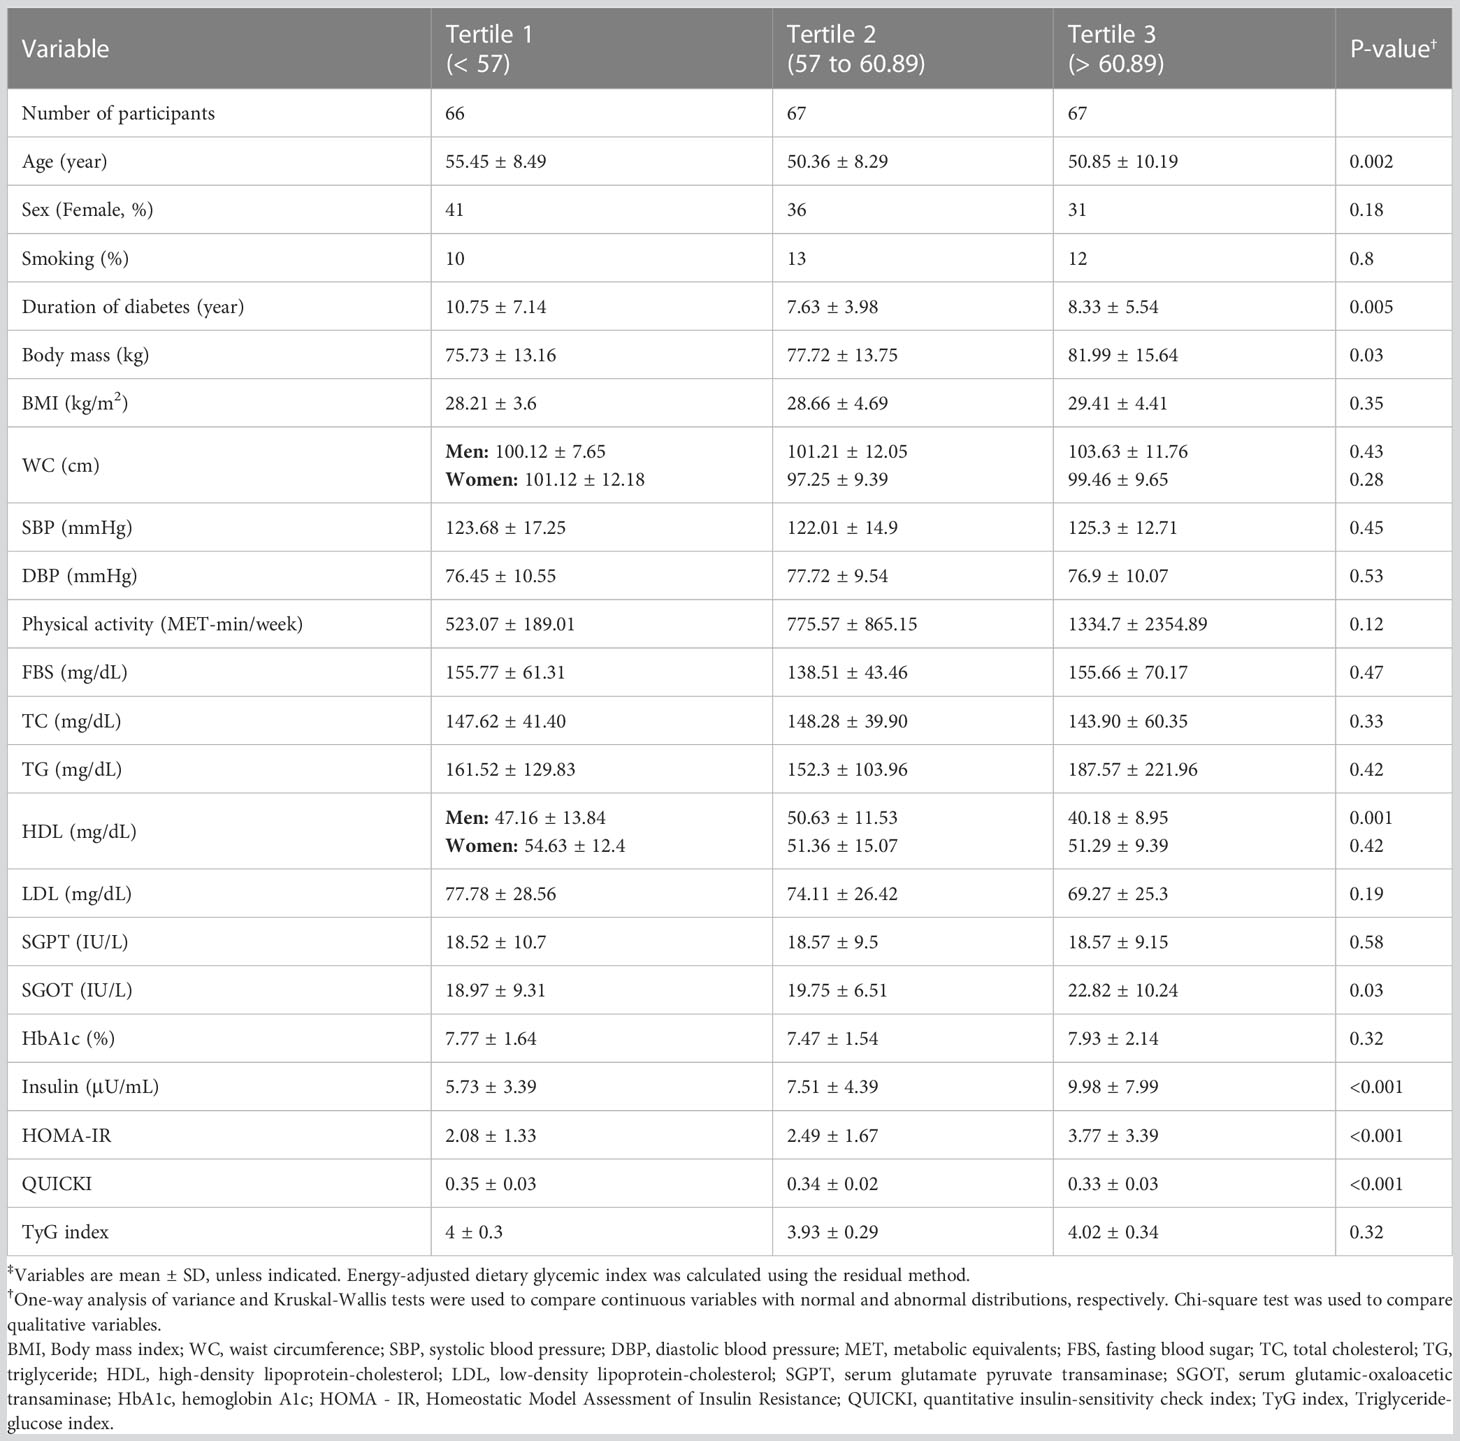
Table 2 General characteristics of subjects across tertiles of energy-adjusted dietary glycemic index‡.
Table 3 depicts the food intake distribution stratified by dietary GI tertiles. The energy intake was not significantly different among tertiles. Nevertheless, significant differences in the intake of carbohydrates (p=0.03), fruits (p=0.001), sweetened beverages (p=0.03), dairy products (p=0.002), vegetables (p<0.001), bread, and legumes (p<0.001) were observed in the dietary GI tertiles. A statistically significant difference was seen for fat (p=0.005), MUFA (p<0.001), and potassium (p<0.001) intake between tertiles.
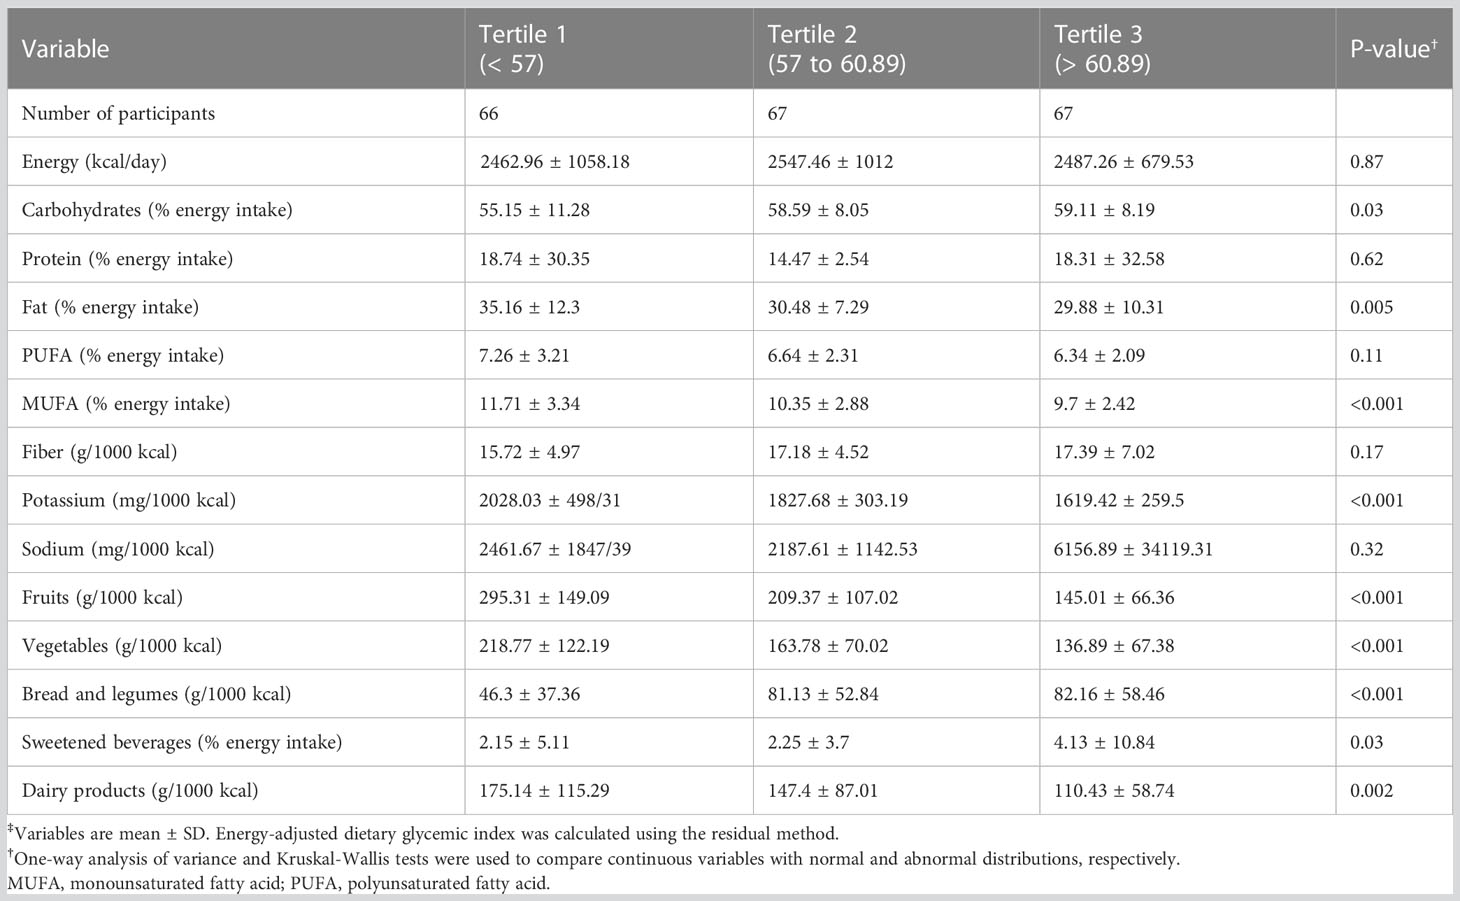
Table 3 Dietary intakes of subjects across tertiles of energy-adjusted dietary glycemic index‡.
Table 4 represents the association between GI and the odds of having NAFLD along with T2DM. According to the crude model, GI tertiles and NAFLD did not correlate significantly. However, after adjustment for potential confounders including age, gender, smoking status, duration of diabetes, physical activity, WC, Hb1Ac, TG, TC, dietary intake of carbohydrates, fat, protein, and simple carbohydrates, there was a significant positive association between GI and the odds of NAFLD (P for trend = 0.04).
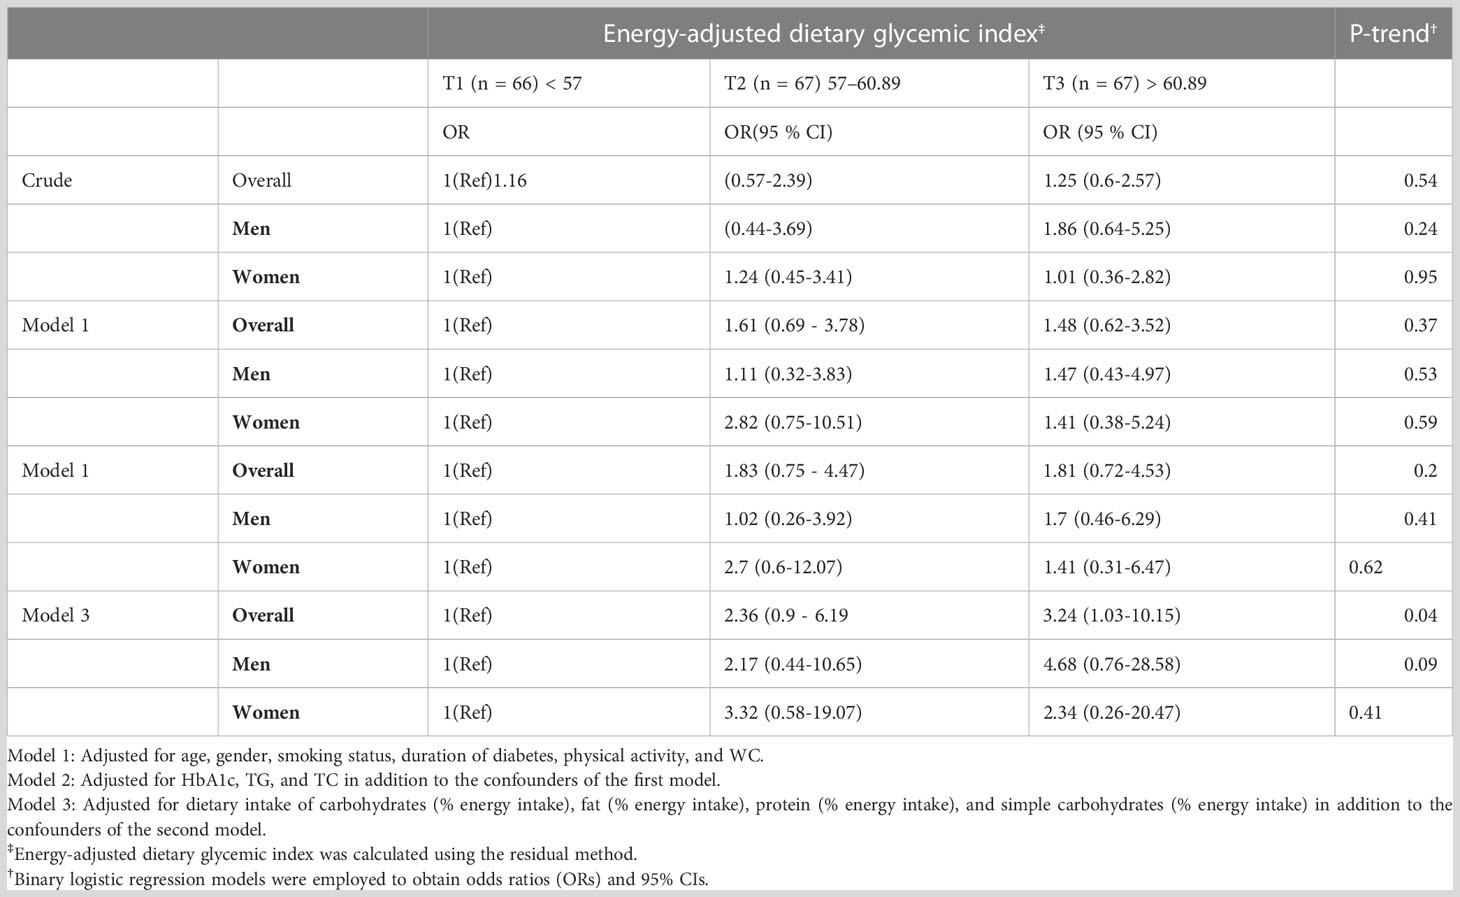
Table 4 Crude and multivariable-adjusted odds ratios (ORs) and 95% confidence intervals (95% CIs) for NAFLD in patients with T2DM across tertiles of energy-adjusted dietary glycemic index.
4 Discussion
Taken together, this study shows that a higher GI can be associated with NAFLD in patients with T2DM. More specifically, patients in the highest tertile of the dietary GI had 3.24 times increased likelihood of having NAFLD (95% CI: 10.15 - 1.03) compared to those in the first tertile, whose result was observed over full adjustment. On the other hand, we did not observe associations between GI and NAFLD in the other adjusted models, as well as in the crude model. Given that the adjusted model 1 focused on demographic variables (age, sex, smoking status, duration of diabetes, physical activity, in addition to WC as an indicator of obesity) and the adjusted model 2 focused on the addition of traditional metabolic biomarkers (HbA1c, TG, and TC) to the model 1, the inclusion of dietary data from adjustment model 3 (% energy intake of dietary intake of total carbohydrates, simple carbohydrates, fat, and protein, alongside confounders from model 2) seemingly reached statistical significance because it provided a more reliable result after controlling for crucial confounders in nutrition.
Regarding the mechanisms between T2DM and NAFLD, there is a close pathophysiological link between these ailments for which hepatic insulin resistance is likely the central tenet by raising hepatic TG synthesis triggered by fatty acids released from insulin-resistant adipocytes and De Novo Lipogenesis, whose latter process consists of elevated glycerol esterification of glycerol upon increased gluconeogenesis and decreased glycogenesis (37, 38). Acutely, in postprandial hyperglycemia, there is an overload of acetyl-CoA release by excess intake of carbohydrates and lipids; acetyl-CoA then enters the citric acid cycle, where the acetyl group is oxidized to carbon dioxide and water, and the released energy produces ATP and free radicals at the same time, which chronic overload may affect the integrity of hepatocytes due to the sharp damage induced by oxidative stress (16, 39).
Our results are of clinical relevance given the relationship between GI and postprandial glycemia, in which higher postprandial glycemia is associated with histological severity in patients with NAFLD (40). Additionally, higher postprandial glycemia is a harbinger of cardiometabolic diseases (e.g., diabetes and heart disease), while low-GI diets portray protection comparable to that seen for whole grain and high fiber intake, as shown by a systematic review of 37 prospective cohort studies (41). Although our study does not infer causation, a meta-analysis of RCTs with interventions >4 weeks detected a decrease of 0.4 HbA1c with low-GI diets compared with higher-GI diets in patients with T1DM or T2DM (n = 457 from 7 studies) (42). Moreover, the review by Parker et al. and Kim supports that low GI can reduce hepatic fat mass and SGOT levels in patients with NAFLD (43).
Apart from the overall results of meta-analyses, well-controlled RCTs must be examined alone to provide expanded specificity. That said, in the GLYNDIET study, a 6-month RCT consisting of 122 patients with overweight and obesity, those who followed a low-GI diet containing moderate amounts of carbohydrates had more efficacy at reducing body weight and controlling glucose and insulin metabolism compared to a high-GI diet containing moderate amounts of carbohydrates and to a low-fat and high-GI diet, in which the 3 diets were isocaloric with energy restriction (44). In contrast, in a 3-moth RCT with a crossover fashion encompassing 19 women with overweight or obesity accompanied by moderate hyperinsulinemia, reducing GI by managing versions of common carbohydrate-rich foods (e.g., breakfast cereals, breads, pasta, and potatoes, and rice) did not enhance body weight, energy intake, and satiety when compared to the condition of high GI (45).
Although low-, moderate-, and high-GI foods have a GI of ≤55 or less, between 56 and 69, and ≥70, respectively (46), in our study, the GI in tertiles 1, 2, and 3 ranged<57, 57 to 60.89, and >60.89, respectively, and thus have some differences compared to the traditional GI classification. At best, this was a reasonable way to categorize the population according to GI, whose tertiles are expected to be closer to the traditional GI classification, but not necessarily the same. The GI theory is convenient for educational purposes, but it should be deciphered and used widely due to its limitations. Correspondingly, the GI has a questionable practical application in the field of clinical nutrition, as carbohydrate sources are commonly combined with different foods, in which little amounts of fat, protein, and fiber can lower the GI of the food markedly. Moreover, the GI concept is paradoxical, while foods with high amounts of monosaccharides have a high GI, and high fiber foods and polysaccharides have a lower GI, fructose is a low GI monosaccharide and some starch sources can have a high GI.
Potato consumption can be a universal example that a high GI food is not necessarily unhealthy and leads to fat gain; conversely, it can be an ally. Although potatoes are classified as a high-GI food, they are sources of potassium and have fewer calories—due to the lower carbohydrate content—compared to traditional food substitutes such as rice, bread, and pasta. Interestingly, while the GI of white potatoes alone is 69-98 (47) and the GI of pasta alone is 43-61 (47, 48), white boiled potatoes have 125 kcal and 20.4 carbohydrates per 100 g [FDC ID: 1102882 (49)], while cooked pasta has 30.7 g of carbohydrates and 157 kcal per 100 g [FDC ID: 1101529 (50)].
In an RCT consisting of healthy participants, daily intake of non-fried potatoes did not affect glycemic markers and was associated with better diet quality compared to refined grains by increasing potassium and fiber intake (51). Taking into account the nutritional facts of potatoes, however, it must be noted that increasing potassium intake tends to be more clinically relevant than increasing fiber intake. For example, according to the USDA, there are 372 mg of potassium and 1.4 g of total fiber per 100 g of white boiled potato [FDC ID: 1102882 (52)], and optimal intakes of potassium are at ~3000 mg/d (53) and of fiber at ~25-38 g/d (53).
It is noteworthy that the interest in developing pharmacological agents capable of converting meals into low GI meals, i.e., alpha-glucosidase inhibitors (acarbose and voglibose), reinforces the importance of low GI as a means of reducing the risk of T2DM and accompanying diseases by improving glycemic control and post-load insulin levels (54, 55). Regarding the medication use of our population, participants took only oral hypoglycemic agents for diabetes control, and hence those who were on insulin therapy were not included. While our results aim at patients with T2DM on oral hypoglycemic agents, it is imperative to mention that high GI foods can be fundamental to mitigating hypoglycemic episodes in patients with T1DM receiving intensive insulin therapy. Therefore, the use of high GI cannot be considered harmful as a whole; instead, it may be useful in some circumstances.
Notwithstanding the attractive concept of GI, a plethora of dietary strategies (e.g., DASH diet, Mediterranean diet, and intermittent fasting) can assist in metabolic effects regardless of GI (56–60). Albeit a low free sugar diet is an efficient method of reducing hepatic steatosis and fibrosis while improving glycemic indices in patients with NAFLD (61), long-term adherence ought to be considered and thus dietary models with moderate amounts of sugars are apparently more feasible. Interestingly, a recent RCT shows that intermittent fasting can reduce hepatic steatosis alongside fat mass in patients with NAFLD (62), and intermittent fasting has emerged as a flexible dietary model in which moderate amount of sugars are easily considered within a personalized approach. In general, however, energy restriction can be the cornerstone of dietary efficacy irrespective of the pattern (63, 64). Given that the individuals in our study were in the overweight classification, they would appear to have metabolic benefits in case of an energy‐restricted intervention.
Beyond manipulation of carbohydrate intake, different dietary models, and energy restriction, functional foods can be considered in an attempt to control T2DM and NAFLD. For instance, omega-3 fatty acids are essential nutrients that can be part of the treatment of both diseases (65). Furthermore, vinegar, cinnamon, curcumin, garlic, and ginger are some examples of common functional foods that can improve the metabolism of glucose and TG (66–73). The latter items are sources of antioxidants, which may attenuate the formation of advanced glycation end products and therefore provide benefits in metabolic and tissue markers (74, 75). Although promising, there is no consensus regarding the use of natural products as a first-line treatment to cure/alleviate NAFLD, whose physicians should only consider them an alternative therapeutic approach (76). At last, the practice of physical exercise is another non-pharmacological approach that deserves substantial attention because of its undisputable effects on improving glucose update and reducing visceral fat (77).
Our study has limitations that cannot be neglected. First and foremost, we did not have access to the types of hypoglycemic agents and hence we did not control the statistical confounders for medications. Indeed, the control for hypoglycemic agents is crucial, as some agents provide benefits to NAFLD progression, but at different magnitudes (78). Second, the cross-sectional design does not assess causality due to the lack of temporality. Third, the sample size can be questioned when compared with epidemiological studies. Fourth, although we used a validated FFQ, remembering the frequencies of food consumption during the last year is a limitation of FFQs. Lastly, people with T2DM had some dietary restrictions which made ranges between GI tertiles very narrow resulting in difficulty in finding differences. Since the present study was conducted in patients with BMI ≥ 23 kg/m2, further studies encompassing patients within the traditional healthy BMI range of 18.5 to 24.9 kg/m2 are required.
5 Conclusion
A low GI diet can decrease the odds of having NAFLD in patients with T2DM. Further interventional and prospective studies are warranted to confirm these findings and investigate causal links.
Data availability statement
The raw data supporting the conclusions of this article will be made available by the authors, without undue reservation.
Ethics statement
The present study was approved by the Ethics Committee of the Shahid Beheshti University of Medical Sciences, Tehran, Iran (NO: IR.SBMU.NNFTRI.REC.1399.061). The patients provided their written informed consent to participate in this study.
Author contributions
MS: Conceptualization, Formal analysis, Writing—Original Draft. SS and AM: Investigation, Resources. AAK and HS: Writing—Original Draft. ZA and HK-V: Writing—Review & Editing. HP: Data Curation. MK, FA-S, HS, and AH: Writing—Review & Editing. AH: Supervision. All authors have read and approved the final version to be published.
Funding
Funding for this study was provided by Shahid Beheshti University of Medical Sciences, Tehran, Iran [grant number: 26839].
Conflict of interest
The authors declare that the research was conducted in the absence of any commercial or financial relationships that could be construed as a potential conflict of interest.
Publisher’s note
All claims expressed in this article are solely those of the authors and do not necessarily represent those of their affiliated organizations, or those of the publisher, the editors and the reviewers. Any product that may be evaluated in this article, or claim that may be made by its manufacturer, is not guaranteed or endorsed by the publisher.
References
1. Saeedi P, Petersohn I, Salpea P, Malanda B, Karuranga S, Unwin N, et al. Global and regional diabetes prevalence estimates for 2019 and projections for 2030 and 2045: Results from the International Diabetes Federation Diabetes Atlas, 9th edition. Diabetes Res Clin Practice (2019) 157:107843. doi: 10.1016/j.diabres.2019.107843
2. Leite NC, Villela-Nogueira CA, Cardoso CRL, Salles GF. Non-alcoholic fatty liver disease and diabetes: from physiopathological interplay to diagnosis and treatment. World J Gastroenterol (2014) 20(26):8377–92. doi: 10.3748/wjg.v20.i26.8377
3. Younossi ZM, Gramlich T, Matteoni CA, Boparai N, McCullough AJ. Nonalcoholic fatty liver disease in patients with type 2 diabetes. Clin Gastroenterol Hepatology. (2004) 2(3):262–5. doi: 10.1016/S1542-3565(04)00014-X
4. Afolabi BI, Ibitoye BO, Ikem RT, Omisore AD, Idowu BM, Soyoye DO. The relationship between glycaemic control and non-alcoholic fatty liver disease in Nigerian type 2 diabetic patients. J Natl Med Assoc (2018) 110(3):256–64. doi: 10.1016/j.jnma.2017.06.001
5. Younossi ZM, Koenig AB, Abdelatif D, Fazel Y, Henry L, Wymer M. Global epidemiology of nonalcoholic fatty liver disease—Meta-analytic assessment of prevalence, incidence, and outcomes. Hepatology (2016) 64(1):73–84. doi: 10.1002/hep.28431
6. Smith BW, Adams LA. Nonalcoholic fatty liver disease and diabetes mellitus: pathogenesis and treatment. Nat Rev Endocrinology. (2011) 7(8):456–65. doi: 10.1038/nrendo.2011.72
7. Targher G, Bertolini L, Padovani R, Rodella S, Tessari R, Zenari L, et al. Prevalence of nonalcoholic fatty liver disease and its association with cardiovascular disease among type 2 diabetic patients. Diabetes Care (2007) 30(5):1212–8. doi: 10.2337/dc06-2247
8. Talenezhad N, Mirzavandi F, Rahimpour S, Amel Shahbaz AP, Mohammadi M, Hosseinzadeh M. Empirically derived dietary pattern and odds of non-alcoholic fatty liver diseases in overweight and obese adults: a case–control study. BMC gastroenterology. (2022) 22(1):1–13. doi: 10.1186/s12876-022-02222-z
9. Björkström K, Widman L, Hagström H. Risk of hepatic and extrahepatic cancer in NAFLD: A population-based cohort study. Liver Int Off J Int Assoc Study Liver. (2022) 42(4):820–8. doi: 10.1111/liv.15195
10. Crocetto F, Pandolfo SD, Aveta A, Martino R, Trama F, Caputo VF, et al. A comparative study of the triglycerides/HDL ratio and pseudocholinesterase levels in patients with bladder cancer. Diagnostics (Basel Switzerland) (2022) 12(2):431. doi: 10.3390/diagnostics12020431
11. Mantovani A, Petracca G, Beatrice G, Csermely A, Tilg H, Byrne CD, et al. Non-alcoholic fatty liver disease and increased risk of incident extrahepatic cancers: a meta-analysis of observational cohort studies. Gut (2022) 71(4):778–88. doi: 10.1136/gutjnl-2021-324191
12. Livesey G, Taylor R, Livesey HF, Buyken AE, Jenkins DJA, Augustin LSA, et al. Dietary glycemic index and load and the risk of type 2 diabetes: A systematic review and updated meta-analyses of prospective cohort studies. Nutrients (2019) 11(6):1280. doi: 10.3390/nu11061280
13. Turati F, Galeone C, Augustin LSA, La Vecchia C. Glycemic index, glycemic load and cancer risk: an updated meta-analysis. Nutrients (2019) 11(10). doi: 10.3390/nu11102342
14. Jenkins AL. The glycemic index: Looking back 25 years. Cereal foods world. (2007) 52(2):50. doi: 10.1094/CFW-52-1-0050
15. Wolever TM, Jenkins DJ, Jenkins AL, Josse RG. The glycemic index: methodology and clinical implications. Am J Clin Nutr (1991) 54(5):846–54. doi: 10.1093/ajcn/54.5.846
16. Augustin LSA, Kendall CWC, Jenkins DJA, Willett WC, Astrup A, Barclay AW, et al. Glycemic index, glycemic load and glycemic response: An International Scientific Consensus Summit from the International Carbohydrate Quality Consortium (ICQC). Nutrition metabolism Cardiovasc Dis NMCD. (2015) 25(9):795–815. doi: 10.1016/j.numecd.2015.05.005
17. Pereira MA, Swain J, Goldfine AB, Rifai N, Ludwig DS. Effects of a low–glycemic load diet on resting energy expenditure and heart disease risk factors during weight loss. JAMA (2004) 292(20):2482–90. doi: 10.1001/jama.292.20.2482
18. Visuthranukul C, Sirimongkol P, Prachansuwan A, Pruksananonda C, Chomtho S. Low-glycemic index diet may improve insulin sensitivity in obese children. Pediatr Res (2015) 78(5):567–73. doi: 10.1038/pr.2015.142
19. Cheng G, Xue H, Luo J, Jia H, Zhang L, Dai J, et al. Relevance of the dietary glycemic index, glycemic load and genetic predisposition for the glucose homeostasis of Chinese adults without diabetes. Sci Rep (2017) 7(1):400. doi: 10.1038/s41598-017-00453-9
20. Buyken AE, Goletzke J, Joslowski G, Felbick A, Cheng G, Herder C, et al. Association between carbohydrate quality and inflammatory markers: systematic review of observational and interventional studies. Am J Clin Nutr (2014) 99(4):813–33. doi: 10.3945/ajcn.113.074252
21. Misciagna G, del Pilar Díaz M, Caramia DV, Bonfiglio C, Franco I, Noviello MR, et al. Effect of a low glycemic index Mediterranean diet on non-alcoholic fatty liver disease. A randomized Controlled clinici trial. J nutrition Health aging. (2017) 21(4):404–12. doi: 10.1007/s12603-016-0809-8
22. Popov SS, Kryl'skii ED, Shulgin KK, Raskina EA, Popova TN, Pashkov AN, et al. Inflammation is associated with impairment of oxidative status, carbohydrate and lipid metabolism in type 2 diabetes complicated by non-alcoholic fatty liver disease. Minerva Endocrinology. (2022). doi: 10.23736/S2724-6507.20.03257-5
23. Jayedi A, Soltani S, Jenkins D, Sievenpiper J, Shab-Bidar S. Dietary glycemic index, glycemic load, and chronic disease: an umbrella review of meta-analyses of prospective cohort studies. Crit Rev Food Sci Nutr (2022) 62(9):2460–9. doi: 10.1080/10408398.2020.1854168
24. Cai C, Song X, Chen X, Zhou W, Jin Q, Chen S, et al. Transient elastography in alcoholic liver disease and nonalcoholic fatty liver disease: A systemic review and meta-analysis. Can J Gastroenterol hepatology. (2021) 2021:8859338. doi: 10.1155/2021/8859338
25. Mantovani A, Sani E, Fassio A, Colecchia A, Viapiana O, Gatti D, et al. Association between non-alcoholic fatty liver disease and bone turnover biomarkers in post-menopausal women with type 2 diabetes. Diabetes Metab (2019) 45(4):347–55. doi: 10.1016/j.diabet.2018.10.001
26. Moghaddam MB, Aghdam FB, Jafarabadi MA, Allahverdipour H, Nikookheslat SD, Safarpour S. The Iranian Version of International Physical Activity Questionnaire (IPAQ) in Iran: content and construct validity, factor structure, internal consistency and stability. World Appl Sci J (2012) 18(8):1073–80. doi: 10.5829/idosi.wasj.2012.18.08.754
27. Friedewald WT, Levy RI, Fredrickson DS. Estimation of the concentration of low-density lipoprotein cholesterol in plasma, without use of the preparative ultracentrifuge. Clin Chem (1972) 18(6):499–502. doi: 10.1093/clinchem/18.6.499
28. Bonora E, Targher G, Alberiche M, Bonadonna RC, Saggiani F, Zenere MB, et al. Homeostasis model assessment closely mirrors the glucose clamp technique in the assessment of insulin sensitivity: studies in subjects with various degrees of glucose tolerance and insulin sensitivity. Diabetes Care (2000) 23(1):57–63. doi: 10.2337/diacare.23.1.57
29. Katz A, Nambi SS, Mather K, Baron AD, Follmann DA, Sullivan G, et al. Quantitative insulin sensitivity check index: a simple, accurate method for assessing insulin sensitivity in humans. J Clin Endocrinol Metab (2000) 85(7):2402–10. doi: 10.1210/jcem.85.7.6661
30. Simental-Mendía LE, Rodríguez-Morán M, Guerrero-Romero F. The product of fasting glucose and triglycerides as surrogate for identifying insulin resistance in apparently healthy subjects. Metab syndrome related Disord (2008) 6(4):299–304. doi: 10.1089/met.2008.0034
31. Esmaillzadeh A, MirmIran P, Azizi F. Whole-grain intake and the prevalence of hypertriglyceridemic waist phenotype in Tehranian adults. Am J Clin Nutr (2005) 81(1):55–63. doi: 10.1093/ajcn/81.1.55
32. Ghaffarpour M, Houshiar-Rad A, Kianfar H. The manual for household measures, cooking yields factors and edible portion of foods. Tehran: Nashre Olume Keshavarzy. (1999) 7(213):42–58.
33. Wolever TM, Yang M, Zeng XY, Atkinson F, Brand-Miller JC. Food glycemic index, as given in glycemic index tables, is a significant determinant of glycemic responses elicited by composite breakfast meals. Am J Clin Nutr (2006) 83(6):1306–12. doi: 10.1093/ajcn/83.6.1306
34. Foster-Powell K, Holt SH, Brand-Miller JC. International table of glycemic index and glycemic load values: 2002. Am J Clin Nutr (2002) 76(1):5–56. doi: 10.1093/ajcn/76.1.5
35. Taleban F, Esmaeili M. Glycemic index of Iranian foods. Natl Nutr Food Technol Res Institute Publ (1999).
36. Willett WC, Howe GR, Kushi LH. Adjustment for total energy intake in epidemiologic studies. Am J Clin Nutr (1997) 65(4):1220S–8S. doi: 10.1093/ajcn/65.4.1220S
37. Otero YF, Stafford JM, McGuinness OP. Pathway-selective insulin resistance and metabolic disease: the importance of nutrient flux. J Biol Chem (2014) 289(30):20462–9. doi: 10.1074/jbc.R114.576355
38. Chao H-W, Chao S-W, Lin H, Ku H-C, Cheng C-F. Homeostasis of glucose and lipid in non-alcoholic fatty liver disease. Int J Mol Sci (2019) 20(2):298. doi: 10.3390/ijms20020298
39. Rolo AP, Teodoro JS, Palmeira CM. Role of oxidative stress in the pathogenesis of nonalcoholic steatohepatitis. Free Radical Biol Med (2012) 52(1):59–69. doi: 10.1016/j.freeradbiomed.2011.10.003
40. Kimura Y, Hyogo H, Ishitobi T, Nabeshima Y, Arihiro K, Chayama K. Postprandial insulin secretion pattern is associated with histological severity in non-alcoholic fatty liver disease patients without prior known diabetes mellitus. J Gastroenterol hepatology. (2011) 26(3):517–22. doi: 10.1111/j.1440-1746.2010.06567.x
41. Barclay AW, Petocz P, McMillan-Price J, Flood VM, Prvan T, Mitchell P, et al. Glycemic index, glycemic load, and chronic disease risk–a meta-analysis of observational studies. Am J Clin Nutr (2008) 87(3):627–37. doi: 10.1093/ajcn/87.3.627
42. Thomas DE, Elliott EJ. The use of low-glycaemic index diets in diabetes control. Br J Nutr (2010) 104(6):797–802. doi: 10.1017/S0007114510001534
43. Parker A, Kim Y. The effect of low glycemic index and glycemic load diets on hepatic fat mass, insulin resistance, and blood lipid panels in individuals with nonalcoholic fatty liver disease. Metab syndrome related Disord (2019) 17(8):389–96. doi: 10.1089/met.2019.0038
44. Juanola-Falgarona M, Salas-Salvadó J, Ibarrola-Jurado N, Rabassa-Soler A, Díaz-López A, Guasch-Ferré M, et al. Effect of the glycemic index of the diet on weight loss, modulation of satiety, inflammation, and other metabolic risk factors: a randomized controlled trial. Am J Clin Nutr (2014) 100(1):27–35. doi: 10.3945/ajcn.113.081216
45. Aston LM, Stokes CS, Jebb SA. No effect of a diet with a reduced glycaemic index on satiety, energy intake and body weight in overweight and obese women. Int J Obes (2005). (2008) 32(1):160–5. doi: 10.1038/sj.ijo.0803717
46. Vega-López S, Venn BJ, Slavin JL. Relevance of the glycemic index and glycemic load for body weight, diabetes, and cardiovascular disease. Nutrients (2018) 10(10):1361. doi: 10.3390/nu10101361
47. Aston LM. Glycaemic index and metabolic disease risk. Proc Nutr Society. (2006) 65(1):125–34. doi: 10.1079/PNS2005485
48. Jeya K C, Henry PST. The glycaemic index: concept, recent developments and its impact on diabetes and obesity. London: Smith-Gordon (2011).
49. Potato, boiled. USA: NFS (2020). Available at: https://fdc.nal.usda.gov/fdc-app.html#/food-details/1102882/nutrients.
50. Pasta, cooked . Available at: https://fdc.nal.usda.gov/fdc-app.html#/food-details/1101529/nutrients.
51. Johnston EA, Petersen KS, Kris-Etherton PM. Daily intake of non-fried potato does not affect markers of glycaemia and is associated with better diet quality compared with refined grains: a randomised, crossover study in healthy adults. Br J Nutr (2020) 123(9):1032–42. doi: 10.1017/S0007114520000252
52. Potato, boiled. NFS. (2020). Available at: https://fdc.nal.usda.gov/fdc-app.html#/food-details/1102882/nutrients.
53. Slavin JL. Position of the American Dietetic Association: health implications of dietary fiber. J Am Dietetic Assoc (2008) 108(10):1716–31. doi: 10.1016/j.jada.2008.08.007
54. Moelands SV, Lucassen PL, Akkermans RP, De Grauw WJ, Van de Laar FA. Alpha-glucosidase inhibitors for prevention or delay of type 2 diabetes mellitus and its associated complications in people at increased risk of developing type 2 diabetes mellitus. Cochrane Database systematic Rev (2018) 12(12):Cd005061. doi: 10.1002/14651858.CD005061.pub3
55. van de Laar FA, Lucassen PL, Akkermans RP, van de Lisdonk EH, Rutten GE, van Weel C. Alpha-glucosidase inhibitors for patients with type 2 diabetes: results from a Cochrane systematic review and meta-analysis. Diabetes Care (2005) 28(1):154–63. doi: 10.2337/diacare.28.1.154
56. Varkaneh Kord H, MT G, OS H, Zand H, Nazary A, Fatahi S, et al. The influence of fasting and energy-restricted diets on leptin and adiponectin levels in humans: A systematic review and meta-analysis. Clin Nutr (Edinburgh Scotland). (2021) 40(4):1811–21. doi: 10.1016/j.clnu.2020.10.034
57. Meng H, Zhu L, Kord-Varkaneh H, OS H, Tinsley GM, Fu P. Effects of intermittent fasting and energy-restricted diets on lipid profile: A systematic review and meta-analysis. Nutr (Burbank Los Angeles County Calif). (2020) 77:110801. doi: 10.1016/j.nut.2020.110801
58. Santos HO, Genario R, Tinsley GM, Ribeiro P, Carteri RB, Coelho-Ravagnani CF, et al. A scoping review of intermittent fasting, chronobiology, and metabolism. Am J Clin Nutr (2022) 115(4):991–1004. doi: 10.1093/ajcn/nqab433
59. Zargarzadeh N, Tadbir Vajargah K, Ebrahimzadeh A, Mousavi SM, Khodaveisi H, Akhgarjand C, et al. Higher adherence to the mediterranean dietary pattern is inversely associated with severity of COVID-19 and related symptoms: A cross-sectional study. Front Med (2022) 9:911273. doi: 10.3389/fmed.2022.911273
60. Lari A, Sohouli MH, Fatahi S, Cerqueira HS, Santos HO, Pourrajab B, et al. The effects of the Dietary Approaches to Stop Hypertension (DASH) diet on metabolic risk factors in patients with chronic disease: A systematic review and meta-analysis of randomized controlled trials. Nutrition metabolism Cardiovasc Dis NMCD. (2021) 31(10):2766–78. doi: 10.1016/j.numecd.2021.05.030
61. Khodami B, Hatami B, Yari Z, Alavian SM, Sadeghi A, Varkaneh HK, et al. Effects of a low free sugar diet on the management of nonalcoholic fatty liver disease: a randomized clinical trial. Eur J Clin Nutr (2022) 76(7):987–94. doi: 10.1038/s41430-022-01081-x
62. Kord Varkaneh H, Salehi Sahlabadi A, Găman MA, Rajabnia M, Sedanur Macit-Çelebi M, Santos HO, et al. Effects of the 5:2 intermittent fasting diet on non-alcoholic fatty liver disease: A randomized controlled trial. Front Nutr (2022) 9:948655. doi: 10.3389/fnut.2022.948655
63. Santos HO, Lavie CJ. Weight loss and its influence on high-density lipoprotein cholesterol (HDL-C) concentrations: A noble clinical hesitation. Clin Nutr ESPEN. (2021) 42:90–2. doi: 10.1016/j.clnesp.2021.01.033
64. Santos HO. Intermittent fasting and fat mass: what is the clinical magnitude? Obesities (2022) 2(1):1–7. doi: 10.3390/obesities2010001
65. Santos HO, Price JC, Bueno AA. Beyond fish oil supplementation: the effects of alternative plant sources of omega-3 polyunsaturated fatty acids upon lipid indexes and cardiometabolic biomarkers-an overview. Nutrients (2020) 12(10):3159. doi: 10.3390/nu12103159
66. Santos HO, de Moraes W, da Silva GAR, Prestes J, Schoenfeld BJ. Vinegar (acetic acid) intake on glucose metabolism: A narrative review. Clin Nutr ESPEN. (2019) 32:1–7. doi: 10.1016/j.clnesp.2019.05.008
67. Sohouli MH, Kutbi E, Al Masri MK, Dadhkhah H, Fatahi S, Santos HO, et al. Effects of vinegar consumption on cardiometabolic risk factors: a systematic review and meta-analysis of randomized controlled trials. Eur J Integr Med (2022) 102176:102176. doi: 10.1016/j.eujim.2022.102176
68. Delpino FM, Figueiredo LM, da Silva BGC, da Silva TG, Mintem GC, Bielemann RM, et al. Omega-3 supplementation and diabetes: A systematic review and meta-analysis. Crit Rev Food Sci Nutr (2022) 62(16):4435–48. doi: 10.1080/10408398.2021.1875977
69. Santos HO, da Silva GAR. To what extent does cinnamon administration improve the glycemic and lipid profiles? Clin Nutr ESPEN (2018) 27:1–9. doi: 10.1016/j.clnesp.2018.07.011
70. Zhu C, Yan H, Zheng Y, Santos HO, Macit MS, Zhao K. Impact of cinnamon supplementation on cardiometabolic biomarkers of inflammation and oxidative stress: A systematic review and meta-analysis of randomized controlled trials. Complementary therapies Med (2020) 53:102517. doi: 10.1016/j.ctim.2020.102517
71. de Melo ISV, Dos Santos AF, Bueno NB. Curcumin or combined curcuminoids are effective in lowering the fasting blood glucose concentrations of individuals with dysglycemia: Systematic review and meta-analysis of randomized controlled trials. Pharmacol Res (2018) 128:137–44. doi: 10.1016/j.phrs.2017.09.010
72. Zhu J, Chen H, Song Z, Wang X, Sun Z. Effects of ginger (Zingiber officinale roscoe) on type 2 diabetes mellitus and components of the metabolic syndrome: A systematic review and meta-analysis of randomized controlled trials. Evidence-Based complementary Altern Med eCAM. (2018) 2018:5692962. doi: 10.1155/2018/5692962
73. Shabani E, Sayemiri K, Mohammadpour M. The effect of garlic on lipid profile and glucose parameters in diabetic patients: A systematic review and meta-analysis. Primary Care diabetes. (2019) 13(1):28–42. doi: 10.1016/j.pcd.2018.07.007
74. Sohouli MH, Fatahi S, Sharifi-Zahabi E, Santos HO, Tripathi N, Lari A, et al. The impact of low advanced glycation end products diet on metabolic risk factors: a systematic review and meta-analysis of randomized controlled trials. Adv Nutr (2021) 12(3):766–76. doi: 10.1093/advances/nmaa150
75. Santos HO, Penha-Silva N. Translating the advanced glycation end products (AGEs) knowledge into real-world nutrition strategies. Eur J Clin Nutr (2022) 76(7):922–8. doi: 10.1038/s41430-021-01028-8
76. Tarantino G, Balsano C, Santini SJ, Brienza G, Clemente I, Cosimini B, et al. It is high time physicians thought of natural products for alleviating NAFLD. Is there sufficient evidence to use them? Int J Mol Sci (2021) 22(24):13424. doi: 10.3390/ijms222413424
77. Macedo RCO, Santos HO, Tinsley GM, Reischak-Oliveira A. Low-carbohydrate diets: Effects on metabolism and exercise - A comprehensive literature review. Clin Nutr ESPEN. (2020) 40:17–26. doi: 10.1016/j.clnesp.2020.07.022
Keywords: carbohydrate, diet, NAFLD, diabetes, insulin resistance
Citation: Salavatizadeh M, Soltanieh S, Ataei Kachouei A, Abdollahi Fallahi Z, Kord-Varkaneh H, Poustchi H, Mansour A, Khamseh ME, Alaei-Shahmiri F, Santos HO and Hekmatdoost A (2023) Association between dietary glycemic index and non-alcoholic fatty liver disease in patients with type 2 diabetes mellitus. Front. Endocrinol. 14:1228072. doi: 10.3389/fendo.2023.1228072
Received: 24 May 2023; Accepted: 26 July 2023;
Published: 22 August 2023.
Edited by:
Lixin Li, Cental Michigan University, United StatesReviewed by:
Sergio Perez-Burillo, Public University of Navarre, SpainKornanong Yuenyongchaiwat,Thammasat University, Thailand
Rafael De La Torre, Hospital del Mar Medical Research Institue (IMIM), Spain
Giovanni Tarantino, University of Naples Federico II, Italy
Copyright © 2023 Salavatizadeh, Soltanieh, Ataei Kachouei, Abdollahi Fallahi, Kord-Varkaneh, Poustchi, Mansour, Khamseh, Alaei-Shahmiri, Santos and Hekmatdoost. This is an open-access article distributed under the terms of the Creative Commons Attribution License (CC BY). The use, distribution or reproduction in other forums is permitted, provided the original author(s) and the copyright owner(s) are credited and that the original publication in this journal is cited, in accordance with accepted academic practice. No use, distribution or reproduction is permitted which does not comply with these terms.
*Correspondence: Azita Hekmatdoost, YV9oZWttYXQyMDAwQHlhaG9vLmNvbQ==