 Jie Gao1†
 Peichun Pan2†Jing Li3
 Min Tang1
 Xuejiao Yan1Xin Zhang1Man Wang1
 Kai Ai4Xiaoyan Lei1Xiaoling Zhang1
 Dongsheng Zhang1*
- 1Department of MRI, Shaanxi Provincial People’s Hospital, Xi’an, China
- 2Department of Graduate, Shaanxi University of Chinese Medicine, Xianyang, China
- 3Department of Graduate, Xi’an Medical University, Xi’an, China
- 4Department of Clinical Science, Philips Healthcare, Xi’an, China
Background: This study aimed to identify disruptions in white matter integrity in type 2 diabetes mellitus (T2DM) patients by utilizing the white matter tract integrity (WMTI) model, which describes compartment-specific diffusivities in the intra- and extra-axonal spaces, and to investigate the relationship between WMTI metrics and clinical and cognitive measurements.
Methods: A total of 73 patients with T2DM and 57 healthy controls (HCs) matched for age, sex, and education level were enrolled and underwent diffusional kurtosis imaging and cognitive assessments. Tract-based spatial statistics (TBSS) and atlas-based region of interest (ROI) analysis were performed to compare group differences in diffusional metrics, including fractional anisotropy (FA), mean diffusivity (MD), axonal water fraction (AWF), intra-axonal diffusivity (Daxon), axial extra-axonal space diffusivity (De,//), and radial extra-axonal space diffusivity (De,⊥) in multiple white matter (WM) regions. Relationships between diffusional metrics and clinical and cognitive functions were characterized.
Results: In the TBSS analysis, the T2DM group exhibited decreased FA and AWF and increased MD, De,∥, and De,⊥ in widespread WM regions in comparison with the HC group, which involved 56.28%, 32.07%, 73.77%, 50.47%, and 75.96% of the mean WM skeleton, respectively (P < 0.05, TFCE-corrected). De,⊥ detected most of the WM changes, which were mainly located in the corpus callosum, internal capsule, external capsule, corona radiata, posterior thalamic radiations, sagittal stratum, cingulum (cingulate gyrus), fornix (stria terminalis), superior longitudinal fasciculus, and uniform fasciculus. Additionally, De,⊥ in the genu of the corpus callosum was significantly correlated with worse performance in TMT-A (β = 0.433, P < 0.001) and a longer disease duration (β = 0.438, P < 0.001).
Conclusions: WMTI is more sensitive than diffusion tensor imaging in detecting T2DM-related WM microstructure abnormalities and can provide novel insights into the possible pathological changes underlying WM degeneration in T2DM. De,⊥ could be a potential imaging marker in monitoring disease progression in the brain and early intervention treatment for the cognitive impairment in T2DM.
1 Introduction
Type 2 diabetes (T2DM) is the most common metabolic disease with a high incidence worldwide. According to the latest data from the International Diabetes Federation in 2019, the number of people with T2DM worldwide was 463 million, and the global prevalence rate of T2DM was 9.3% (1). Brain damage caused by persistent hyperglycemia, also defined as diabetic encephalopathy, which includes changes in neurophysiology and brain structures as well as the resultant cognitive impairment involving memory, attention and executive functions (2, 3), has recently attracted increasing attention. Cognitive impairment in T2DM is usually not necessarily accompanied by subjective cognitive complaints (4). Furthermore, with the increasing prevalence of diabetes and an aging population, the incidence of cognitive impairment is expected to increase gradually, posing great challenges for future health effects. However, the neuropathological basis of the cognitive impairment associated with T2DM is still unclear.
A series of recent neuroimaging studies have revealed that T2DM is accompanied by cerebral microstructural impairments related to cognitive decline. In addition to gray matter atrophy, white matter (WM) microstructural abnormalities are also believed to play a prominent role in T2DM-induced cognitive impairment (5–8). Diffusion tensor imaging (DTI) can provide an effective and quantitative method to delineate WM microstructural changes. The integrity of the WM may be inferred on the basis of changes in DTI-derived parameters, including fractional anisotropy (FA), mean diffusivity (MD), axial diffusivity (AD), and radial diffusivity (RD), potentially providing evidence to evaluate pathological changes in T2DM. The existing studies based on DTI have confirmed extensive WM microstructural abnormalities in T2DM, and some important regions of the WM have also been demonstrated to be correlated with neuropsychological performance (9–11). Furthermore, the WM changes in T2DM mainly manifested as decreased FA and increased MD and RD, which may reflect axonal degeneration, myelin breakdown, or other factors. However, due to the non-specificity of DTI measures, this approach showed limitations in determining the altered structures underlying these diffusional abnormalities. In addition, since the DTI model assumes a Gaussian distribution of water-diffusion processes with a mono-exponential signal decay, it cannot easily characterize crossing fibers, leading to limited information.
Diffusional kurtosis imaging (DKI) is a clinically feasible extension of DTI that examines the additional contribution of non-Gaussian diffusion effects to provide additional information on brain microstructural complexity (12). The derived metrics from DKI, including mean kurtosis (MK), axial kurtosis (K∥), and radial kurtosis (K⊥), can measure the complexities of structures and can be used to assess white matter and gray matter simultaneously. Although effective, DKI metrics can only probe voxel-level diffusion that mingles the effects of heterogeneous microenvironments but are not specific to features of microstructure, since they are calculated based on a model of brain tissue microstructure involving a single compartment. This limitation makes it difficult to interpret potential neuropathological changes. For example, the reduced MK, K⊥ and K∥ could be caused by a reduction in axons, demyelination and an increase of free water in the outer space of the axon (or both). Subsequently, a two-compartment non-exchange diffusion model based on DKI has been proposed to identify compartment-specific white matter tract integrity (WMTI) in the intra-axonal spaces and extra-axonal spaces (13). Notably, the derived metrics, including the axonal water fraction (AWF), intra-axonal diffusivity (Daxon), and extra-axonal axial and radial diffusivities (De,//and De,⊥), offer enhanced insights into the microstructural features. Daxon serves as a biomarker with high sensitivity and specificity for detecting axonal abnormalities. De,//and De,⊥indicates a relatively free water content in the extra-axonal space, as well as the integrity of myelin sheath. AWF quantifies the proportion of water within the axons relative to the total water fraction encompassing both intra- and extra-axonal water. These metrics greatly improve the characterization of subtle tissue microstructural changes, and have been demonstrated to deepen the understanding of WM alterations in various neurological disorders, such as Alzheimer’s disease (14), multiple sclerosis (15), aging (16), and mild traumatic brain injury (17).Since WMTI metrics can reveal more specific diffusivity changes from water inside the axons (potentially glial processes) and outside axons (excluding water from myelin sheath and interstitial space), this study aims to (1) determine whether WMTI metrics are more sensitive than DTI metrics in investigating WM microstructural changes in patients with T2DM; (2) further speculate the possible neuropathological changes associated with cognitive impairment in T2DM patients based on additional information provided by WMTI metrics; and (3) investigate the correlations between altered WMTI metrics and clinical/cognitive variables to identify the imaging biomarkers of cognitive decline in patients with T2DM.
2 Materials and methods
2.1 Participants
The study was conducted in accordance with the Helsinki declaration. The Human Ethics Committee of Shaanxi Provincial Peoples Hospital approved all experimental procedures after receiving informed consent (the ethical committee protocol number: 2022K101).
Seventy-three patients with T2DM were recruited from the Department of Endocrinology of Shaanxi Provincial People’s Hospital, and 57 healthy controls (HCs) matched for age, sex, and education level were obtained from our health examination center. All the participants were between 40 and 70 years of age, right-handed, and educated for at least six years. The T2DM patients met the standard criteria proposed by the American Diabetes Association (18) and without a history of hypoglycemia or hyperglycemia. The other inclusion criteria in the HC group were as follows: (1) no symptoms or a family history of diabetes; (2) fasting glucose < 7.0 mmol/L; and (3) glycosylated hemoglobin A1c (HbA1c) level < 6.0%. The exclusion criteria for both groups were as follows: (1) history of neurological disorders, such as cerebral infarctions, brain tumors, vascular malformations, or traumatic brain injury; (2) illicit substance abuse, alcohol abuse, or psychiatric disorders; (3) any other systemic disease irrelevant to diabetes and affecting cognition; (4) periventricular or deep WM hyperintensities with a Fazekas score > 1 on T2-weighted fluid-attenuated inversion recovery (FLAIR) images; and (5) inability to complete MRI examinations or unsatisfactory MRI images.
2.2 Clinical data and neuropsychological test results
All participants’ clinical data, including information regarding their age, sex, educational level, blood pressure, height, weight, and body mass index (BMI), were obtained from medical records and questionnaires. Laboratory tests, including blood biochemical analysis and evaluation of fasting plasma glucose (FPG) and HbA1c levels were performed and their results were recorded. All participants underwent the following series of neuropsychological assessments: Mini-Mental State Examination (MMSE) and Montreal Cognitive Assessment (MoCA) were used to assess general cognitive function; Trail-Making Test A (TMT-A) reflected cognitive processing skills (psychomotor speed, processing speed, and visuospatial skills) and attention; Trail-Making Test B (TMT-B) provided information regarding executive function; Auditory Verbal Learning Test (AVLT) was used to evaluate episodic memory; and Clock Drawing Test (CDT) was performed to evaluate visuospatial skills. Neuropsychological tests were performed by a psychiatrist trained in systematic testing.
2.3 Image acquisition
Conventional MRI and DKI data were obtained using a 3.0 T MR scanner (Ingenia, Philips Medical Systems, the Netherlands) equipped with a 16-channel phase-array head coil. Conventional MRI, including sagittal three-dimensional T1-weighted imaging (repetition time [TR]/excitation time [TE] = 7.5/3.5 ms, field of view [FOV] = 250 × 250 mm2, matrix = 256 × 256, slice thickness = 1 mm) and T2 FLAIR (TR/TE = 6000/150 ms, FOV = 230 × 230 mm2, matrix = 320 × 320, slice thickness = 6 mm) were used to identify visible brain lesions. DKI was performed using a spin-echo echo-planar imaging sequence with the following parameters: TR/TE = 6000/150 ms, slice thickness = 6 mm, FOV = 224 × 224 mm2, matrix = 112 × 112, number of excitations = 1, b value = 0, 1000, 2000 s/mm2, 32 diffusion encoding directions for each nonzero b value with the same distribution. The gradient directions were uniformly distributed by performing the electro-static repulsion method (19, 20).
2.4 Data processing
Data pre-processing included the following steps. First, the image format was converted from DICOM to NIFTI. Second, non-brain tissues, such as the scalp and skull, were removed using the Brain Extraction Tool (BET), which was performed in FMRIB’s Software Library (FSL). Third, the diffusion-weighted images were realigned to the non-weighted b0 images to correct head motion and eddy current-induced distortions (also a tool of FSL). Finally, artifact-corrupted diffusion-weighted imaging scans were excluded by using an automated method (21). Only two b values (0 and 1000 s/mm2) were used for DTI fitting, which was performed with the FMRIB diffusion toolbox (FDT), and four DTI parameters, including FA and MD, were obtained. The kurtosis tensor was estimated by using a constrained weighted linear least squares method (CWLLS) (22, 23) in MATLAB (MathWorks, Natick, Massachusetts). Then, the WMTI metrics, including AWF, Daxon, De,∥, and De,⊥, were estimated using the algorithms of the WMTI model (13) with an in-house program implemented in MATLAB.
2.5 TBSS analysis
FSL with tract-based spatial statistics (TBSS, part of FSL) was used to analyze all of the above DTI and WMTI metrics and compare intergroup differences in WM. All participants’ FA images were first aligned to a common target FMRIB58_FA in the MNI 152 standard space using nonlinear registration. Then, the mean FA image and its skeleton were generated. The aligned FA image of each participant was projected onto the mean FA skeleton (threshold = 0.2). The resulting FA skeleton images were fed into voxel-wise cross-subject statistics to identify intergroup differences in major WM tracts. The number of permutations was set at 5000. The results were corrected for multiple comparisons by controlling the family-wise error rate after threshold-free cluster enhancement (TFCE). TBSS analysis was also performed for other DTI and WMTI metrics parameters. The results of all tests were considered to be significant at P < 0.05. The Johns Hopkins University (JHU) WM ICBM-DTI-81 WM labels atlas in FSL (http://fsl.fmrib.ox.ac.uk/fsl/fslwiki/Atlases) was used to label significant tracts.
2.6 ROI analysis
ROI analysis was also performed based on the Johns Hopkins University WM label atlas, in which the entire WM was parceled into 48 ROIs. The FA, MD, and WMTI metrics were measured in these ROIs and reported as mean ± standard deviation. The ROI-based comparisons between the T2DM and the HC groups were further performed in regions that showed significant differences in the TBSS analysis described above.
The correlations between DTI and WMTI metrics within the resultant ROIs and the neuropsychological assessment scores, disease duration, and HbA1c level in T2DM patients were analyzed by using the multiple linear regression analyses, with age, sex, and years of education as the covariates. The Bonferroni correction was applied to correct for multiple comparisons. The regression coefficients (β) and P values were calculated.
2.7 Statistical analysis
The demographic, clinical, and neuropsychological data were analyzed by using SPSS (SPSS version 20.0, IBM, USA). The measurement data were reported as mean ± standard deviation, and categorical data were presented as frequencies and percentages. Intergroup comparisons of these data were performed using Student’s t tests or χ2 tests as appropriate. All tests were taken to be significant at P < 0.05.
3 Results
3.1 Clinical and neuropsychological data
Clinical and neuropsychological data are presented in Table 1. The T2DM and control groups showed no significant differences in sex, age, years of education, BMI, blood pressure, and the total cholesterol, triglyceride, and low-density lipoprotein levels. The T2DM group showed higher HbA1c and FPG levels and lower high-density lipoprotein levels than the HC group (P < 0.001). Of the 73 patients with T2DM, 32 were receiving insulin treatment, and the remaining 41 patients were receiving oral hypoglycemic agents. The T2DM group showed poorer performance in general cognitive function (MMSE, P = 0.016; MoCA, P < 0.001). In addition, the T2DM group showed significantly worse results in the cognitive domains of attention, executive function, and episodic memory than the HCs.
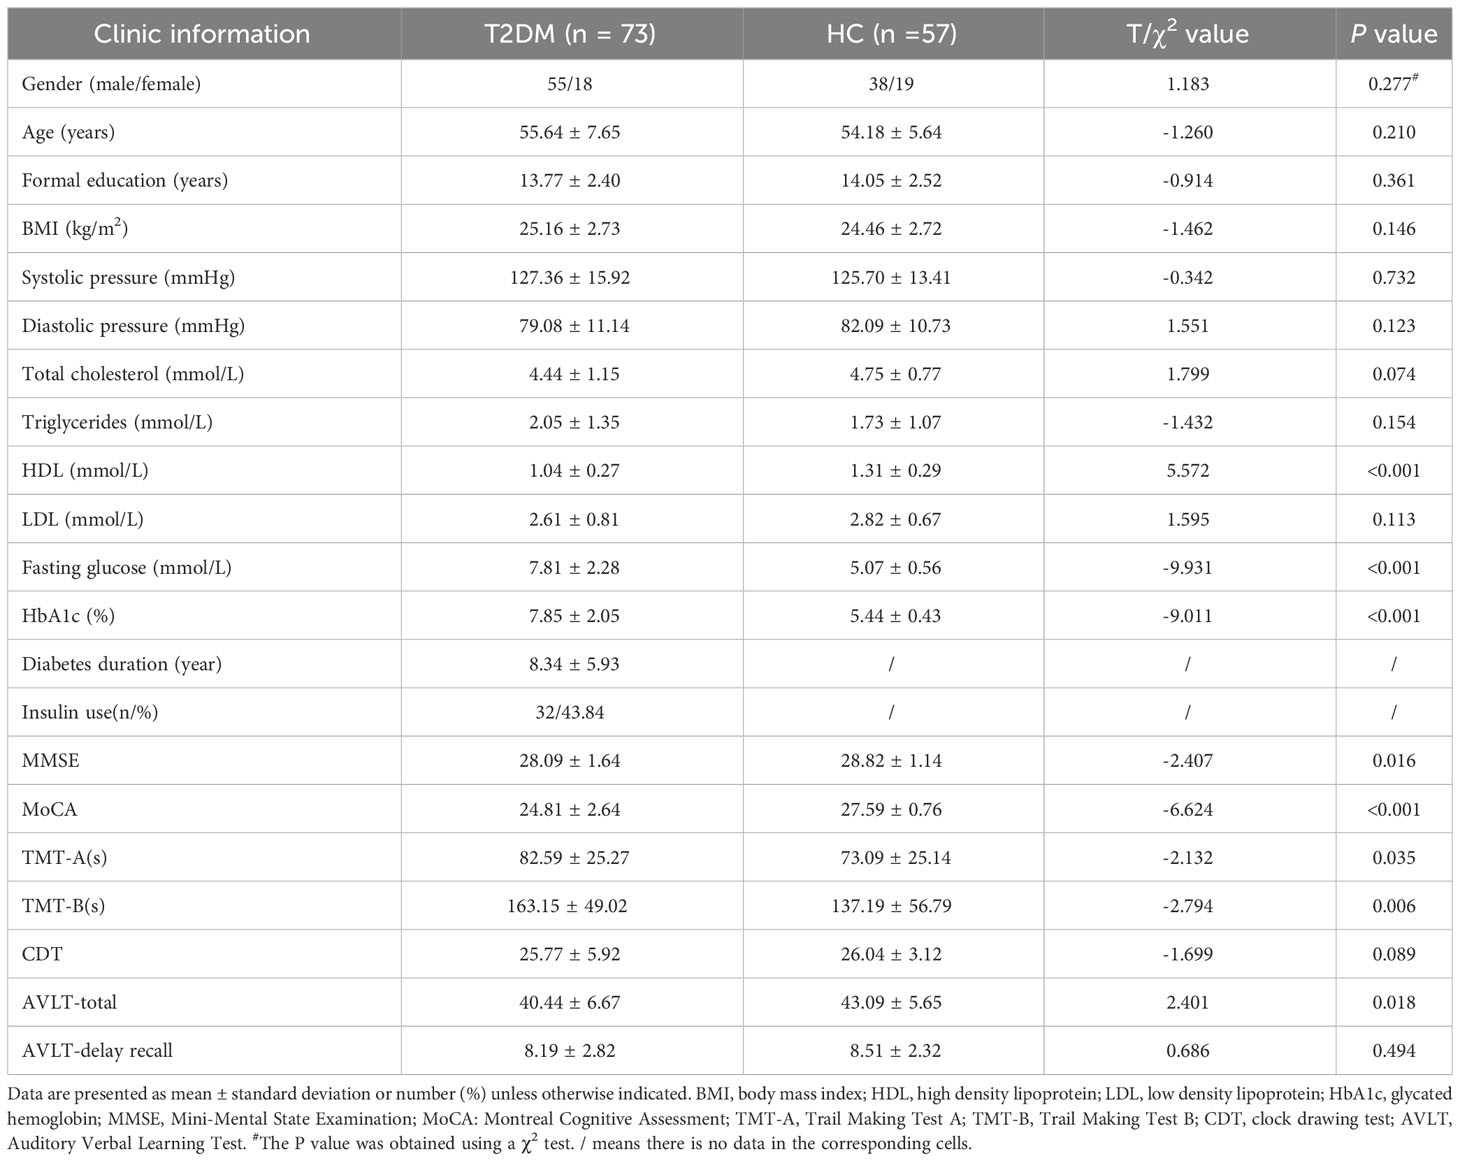
Table 1 Clinical characteristics of participants.
3.2 WM skeleton voxel-wise TBSS comparisons
Figure 1 shows the derived FA, MD, AWF, Daxon, De,∥ and De,⊥ maps from an HC for illustration. In TBSS analysis, the T2DM group exhibited significantly deceased FA and AWF and increased MD, De,∥, and De,⊥ over widespread WM regions (as shown in Figure 2), which involved 56.28% (33874/60190 voxels), 32.07% (19303/60190 voxels), 73.77% (44404/60190 voxels), 50.47% (30380/60190 voxels), and 75.96% (45721/60190 voxels) of the mean WM skeleton, respectively (P < 0.05, TFCE-corrected). Additionally, increased Daxon values were only found in some discrete WM regions in the T2DM group compared with HC group. To recognize the more robust and severely impaired WM tracts in T2DM patients, additional investigations with more strict criteria (P < 0.01, TFCE-corrected) were performed in the TBSS analysis. These results also showed that De,⊥ exhibited more involved WM regions (43.83%) than FA and MD (39.66% and 29.45%, respectively), which were mainly located in the whole corpus callosum (CC), internal capsule (IC), external capsule (EC), corona radiata (CR), posterior thalamic radiations (PTR), sagittal stratum (SS), cingulum (cingulate gyrus), fornix (stria terminalis), superior longitudinal fasciculus (SLF), and uncinate fasciculus (UF).
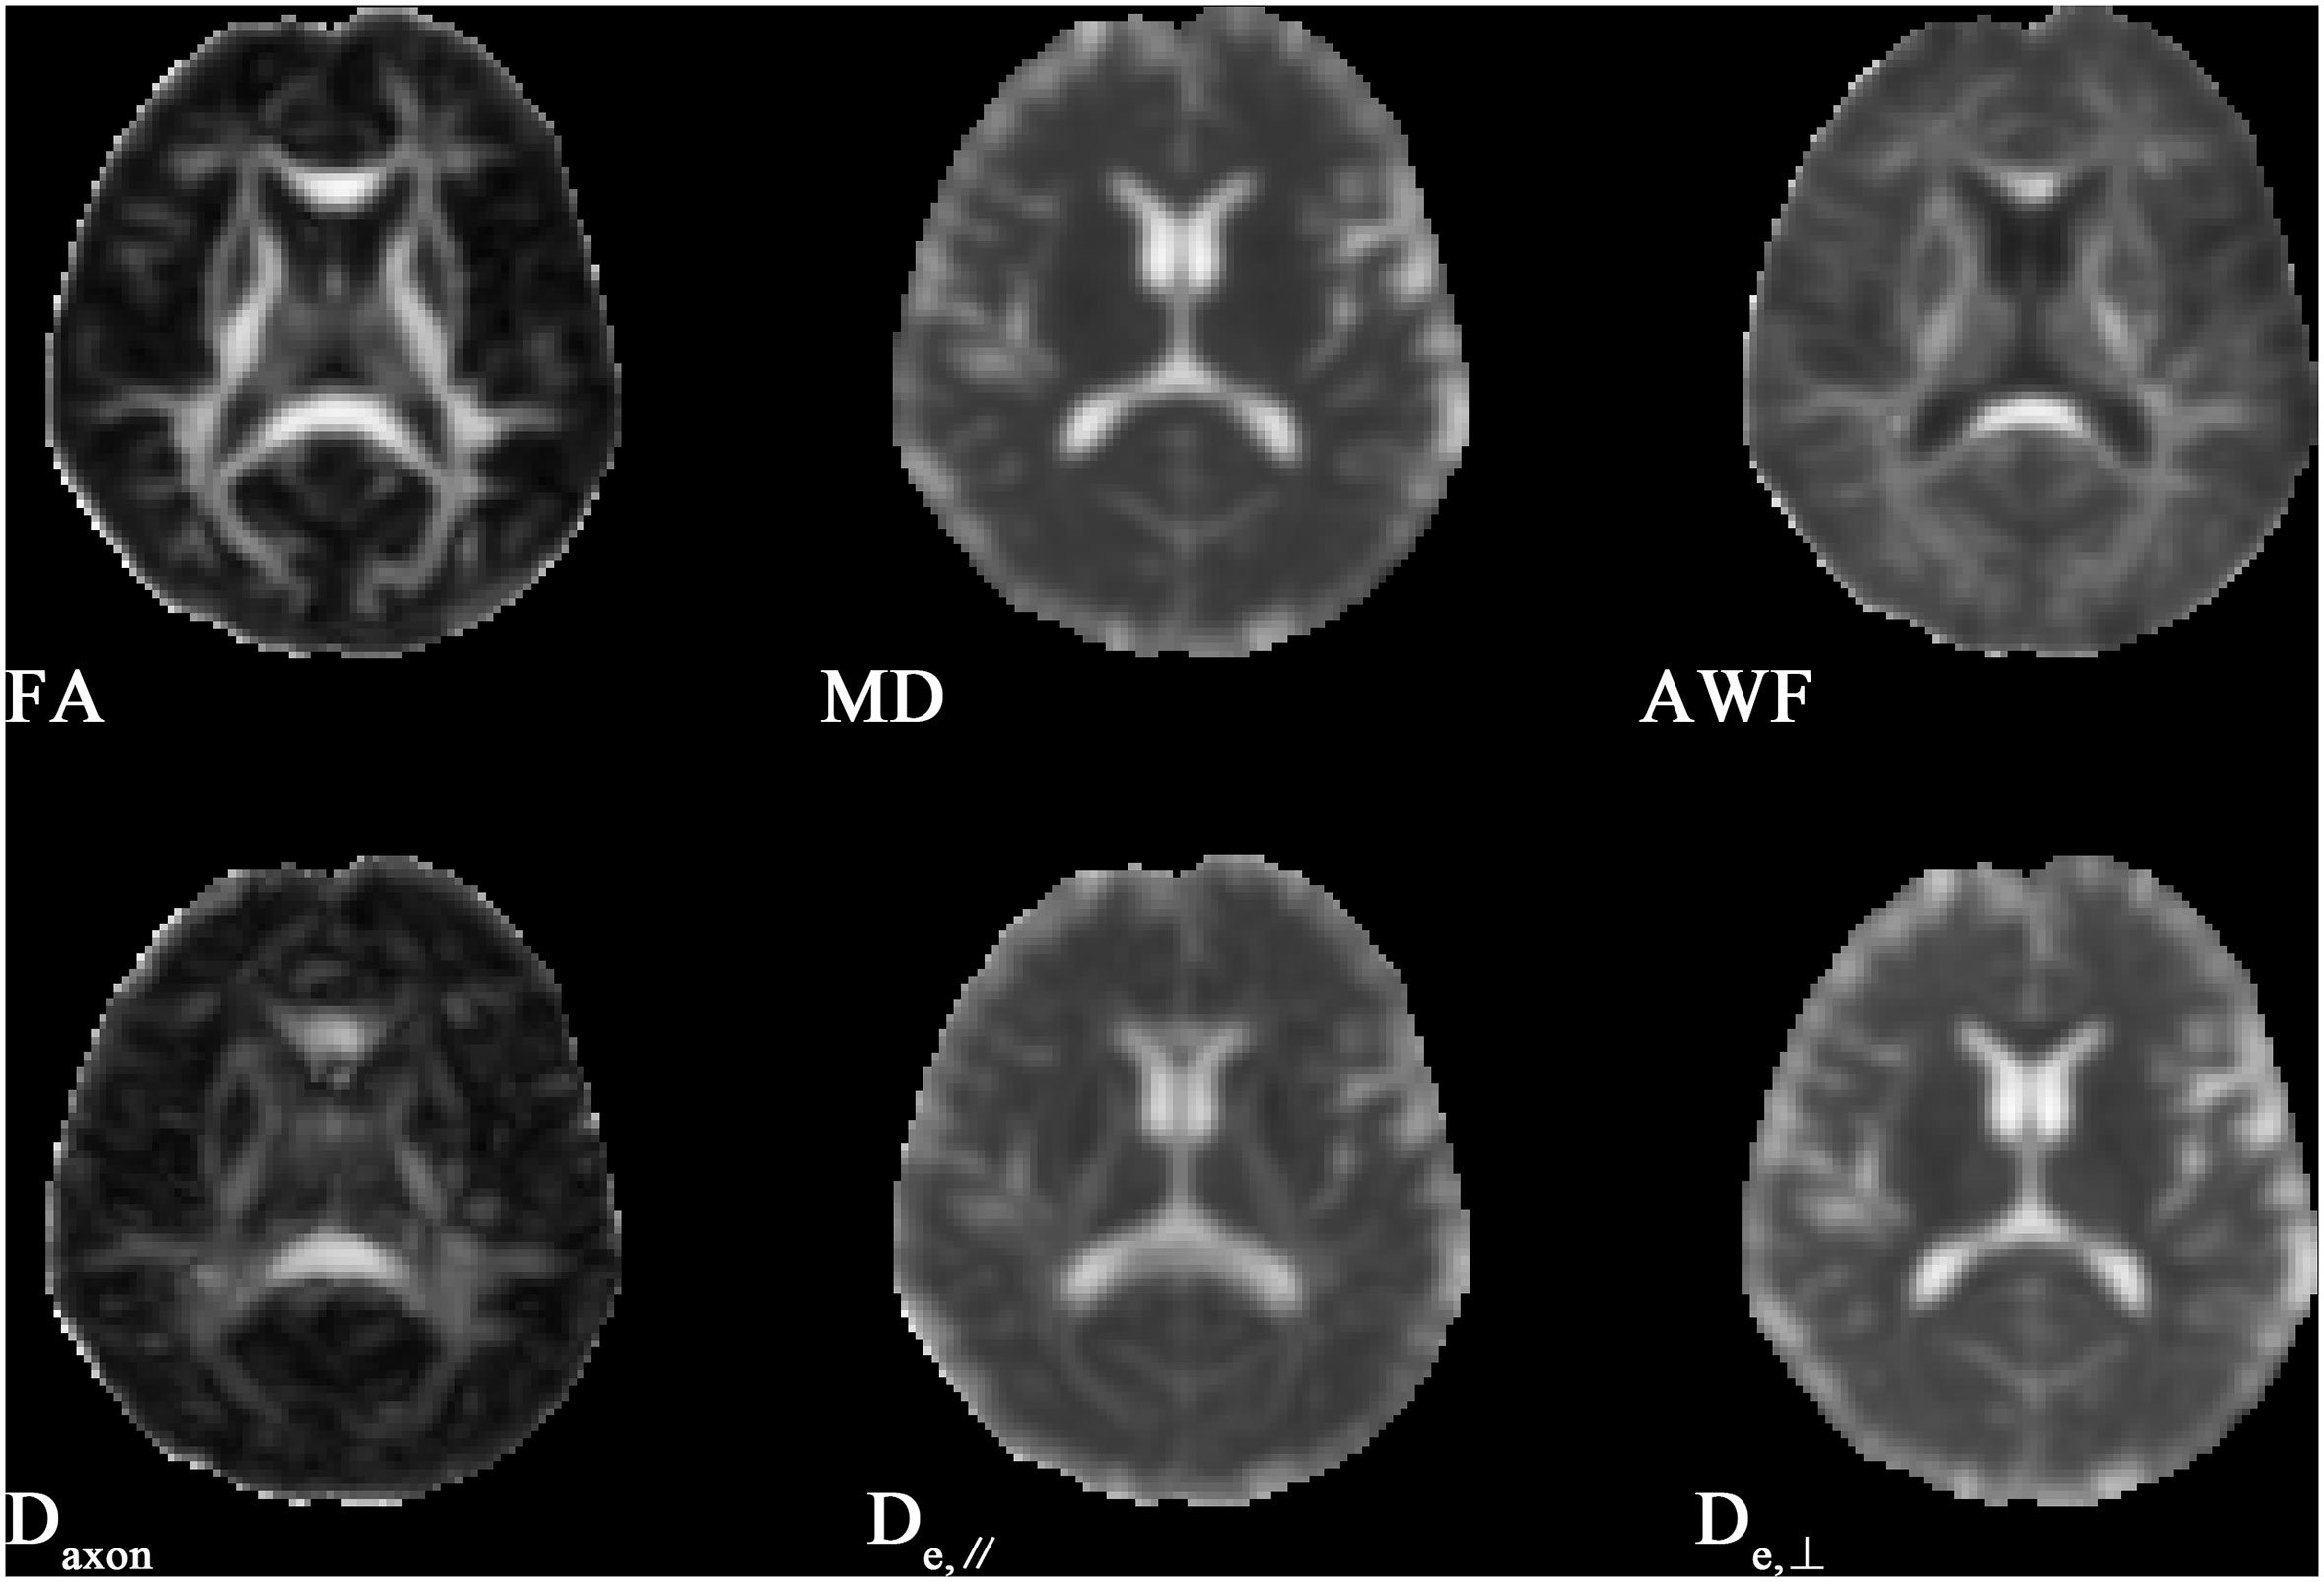
Figure 1 Illustrations of FA, MD and WMTI metrics in slice of basal ganglia of a healthy control.
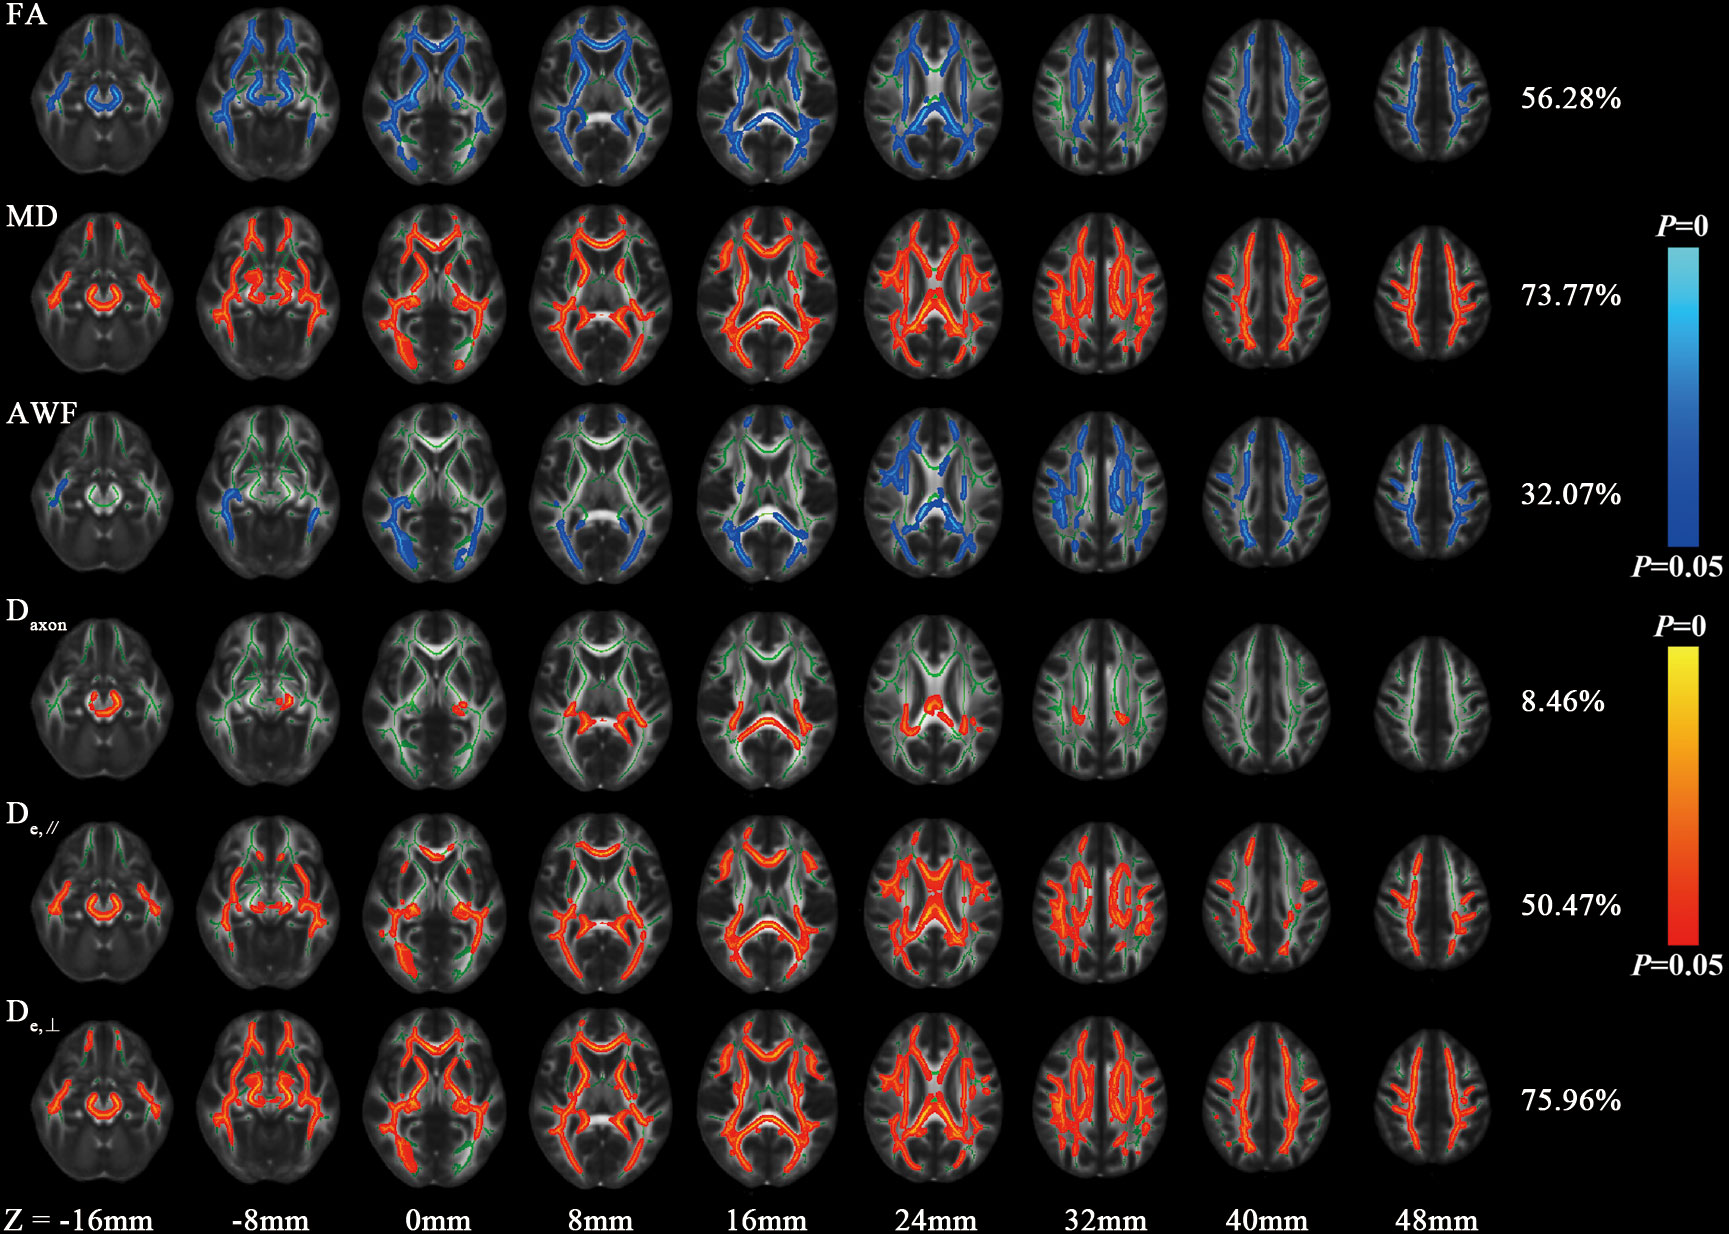
Figure 2 Differences of FA, MD and WMTI metrics between HC and T2DM group by voxel-wise TBSS analysis. Regions colored light blue-blue represent significantly decreased voxels (P< 0.05) in the T2DM group compared with the HC group, while regions colored yellow-red represent significantly increased voxels (P< 0.05). These have been overlaid on the mean FA template with a mean skeleton (regions colored green). Numbers on the right of each row are percentage of voxels that changed in the whole brain.
3.3 Group differences in the atlas-based tract ROIs
In the ROI-based quantitative analysis, the T2DM patients again showed similar changes in FA, AWF, MD, Daxon, De,∥, and De,⊥ in most WM regions as in the TBSS analysis. In the 48 WM tracts defined in the JHU WM ICBM-DTI-81 WM labels, more regions had increased De,⊥ (28/48 regions) than decreased FA (18/48 regions) in the T2DM group (shown in Tables 2, 3). Figure 3 summarizes the FA and De,⊥ differences in some WM fiber tracts. Notably, only De,⊥ differences were found in some crossing fibers, including the pontine crossing tract, bilateral PTR, right SLF, and bilateral UF.
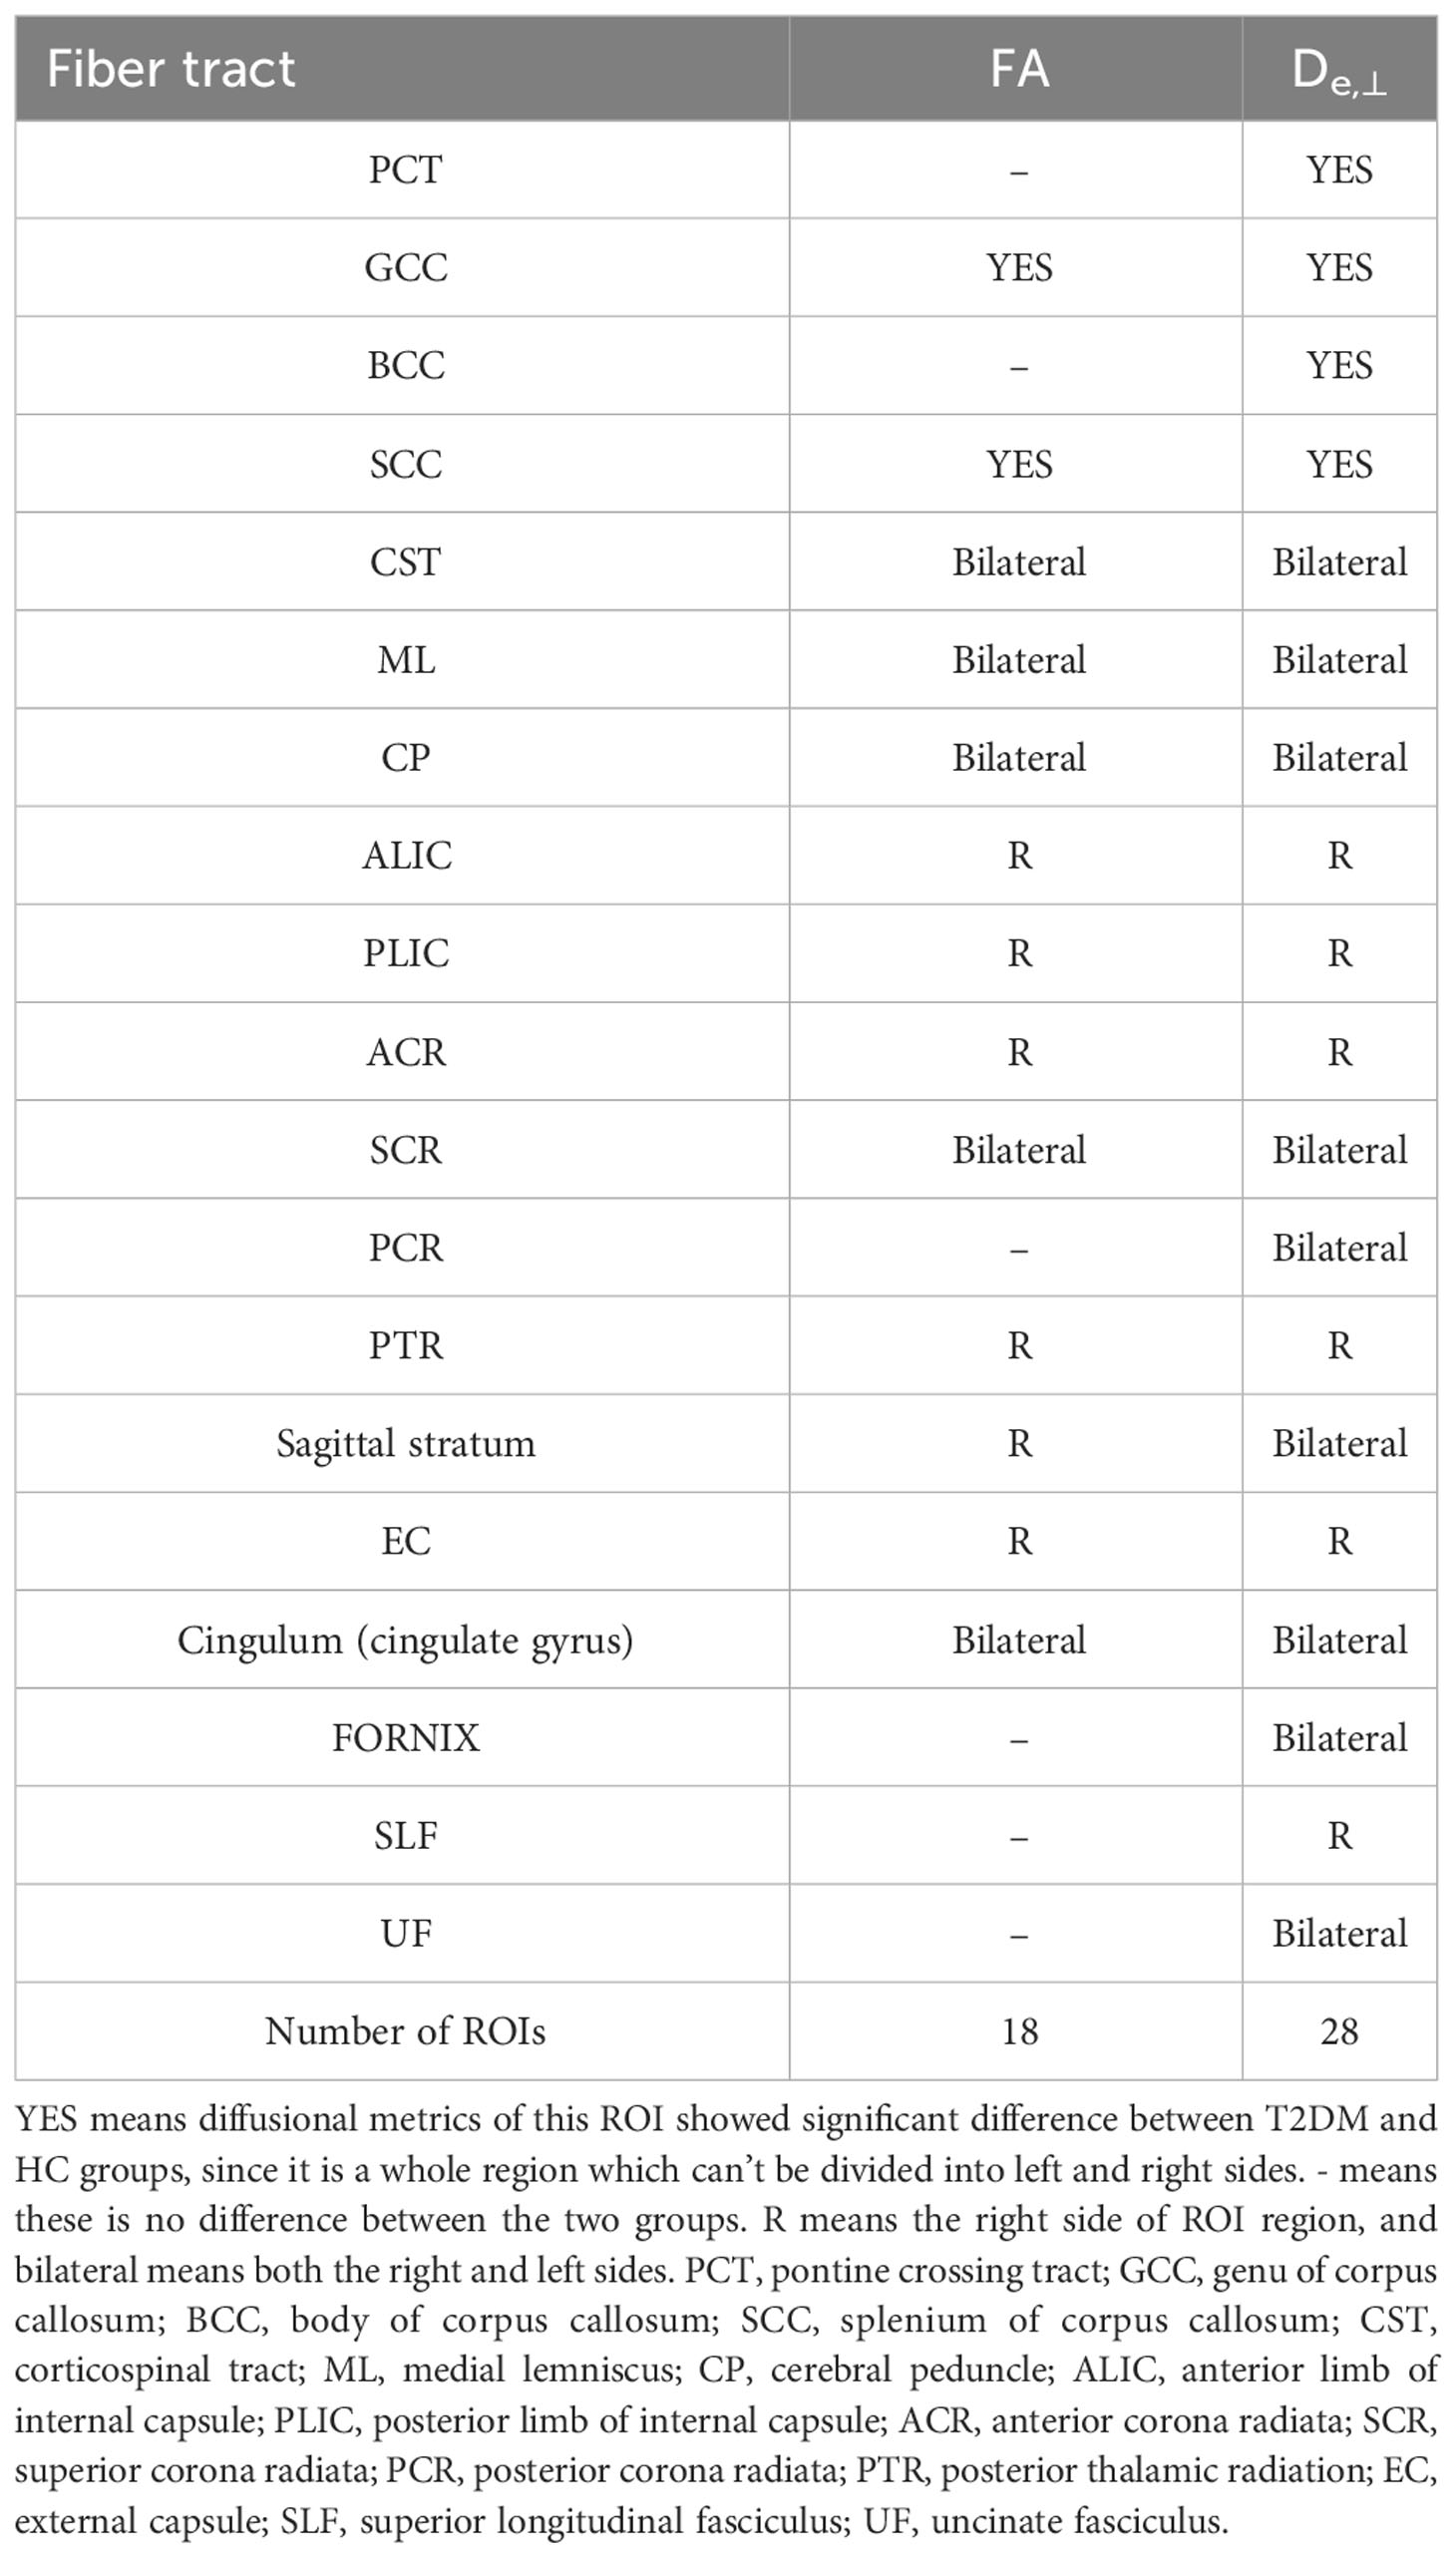
Table 2 White matter integrity differences of FA and De,⊥ in disrupted WM tracts between T2DM and HC group during ROI-based statistical analysis.
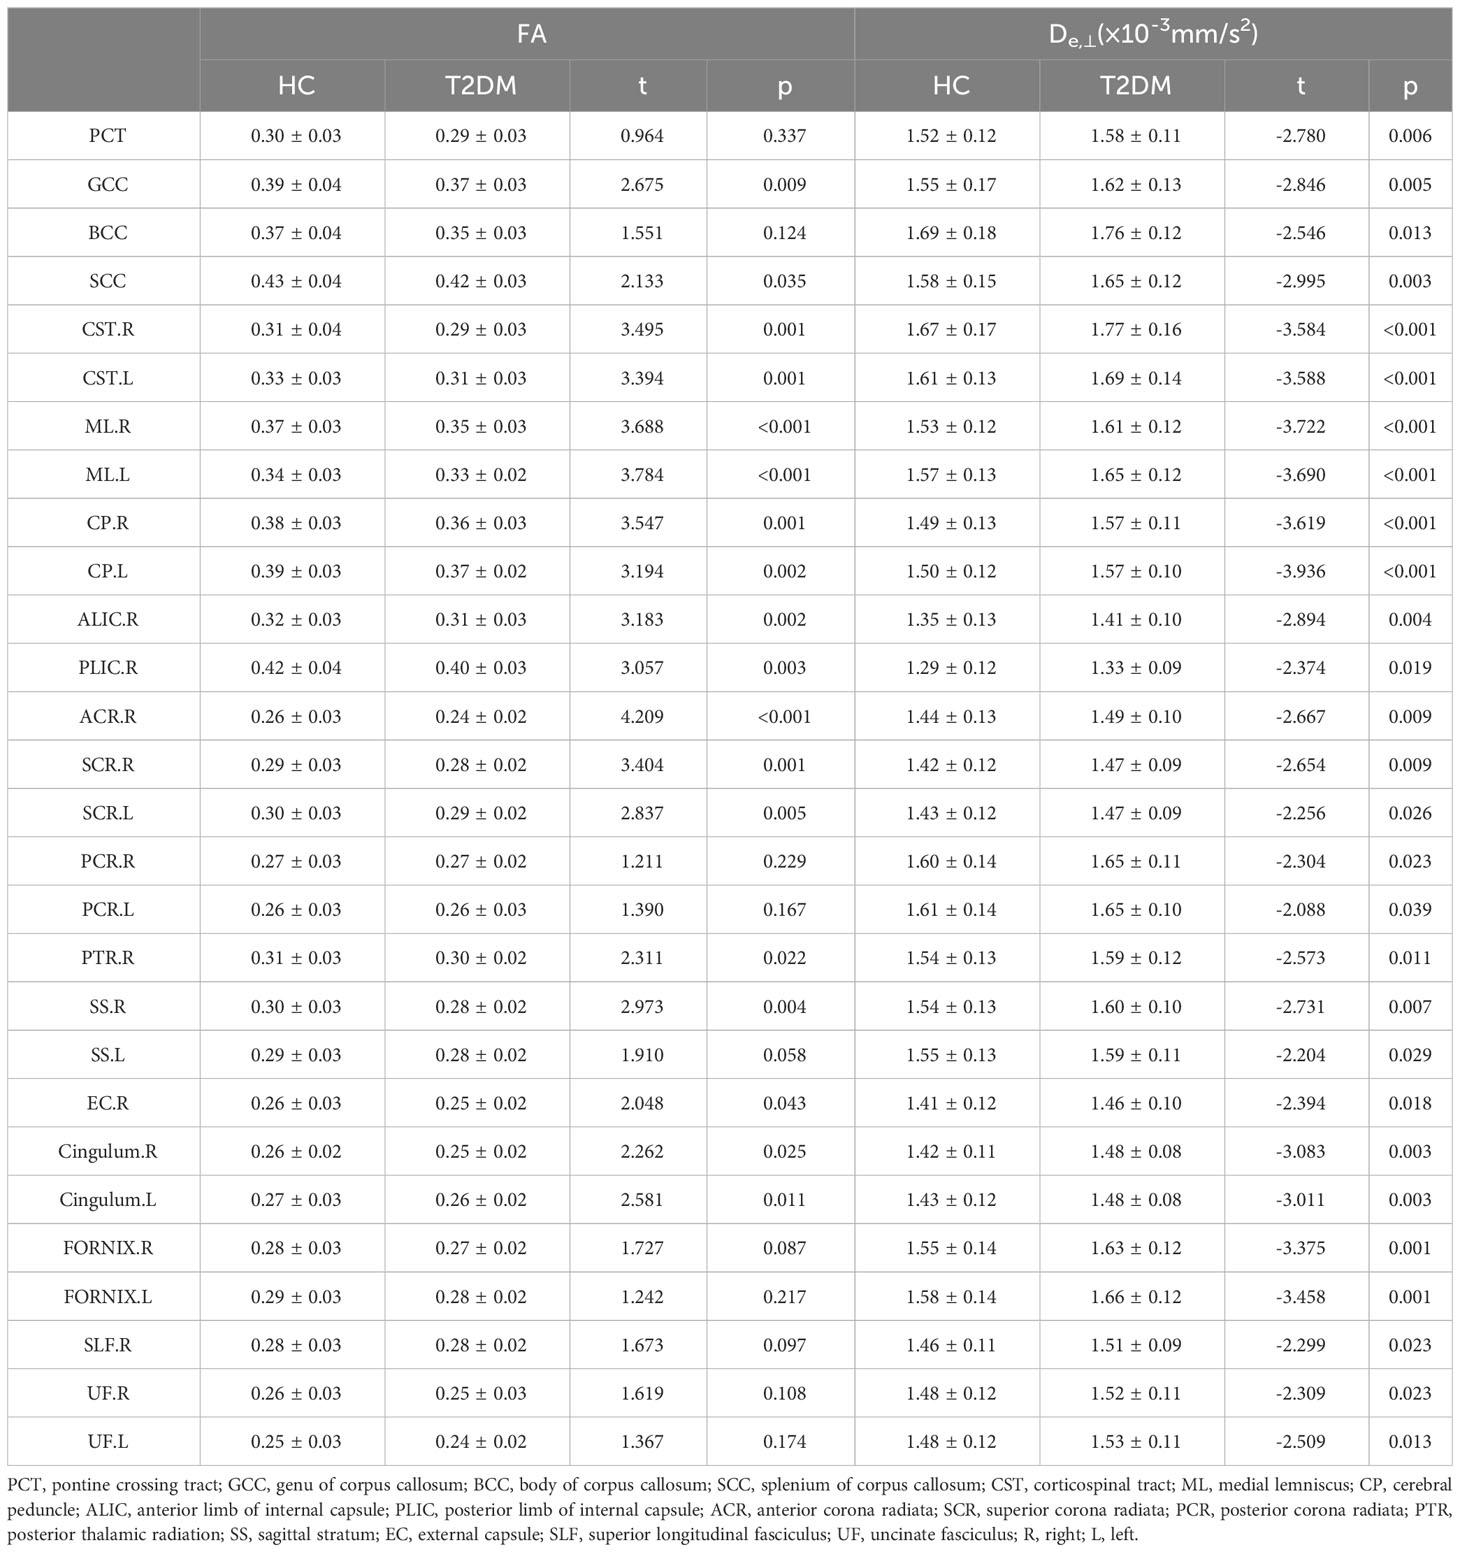
Table 3 Differences of FA and De,⊥ (means ± SDs) between T2DM and HC group during ROI-based statistical analysisROI.
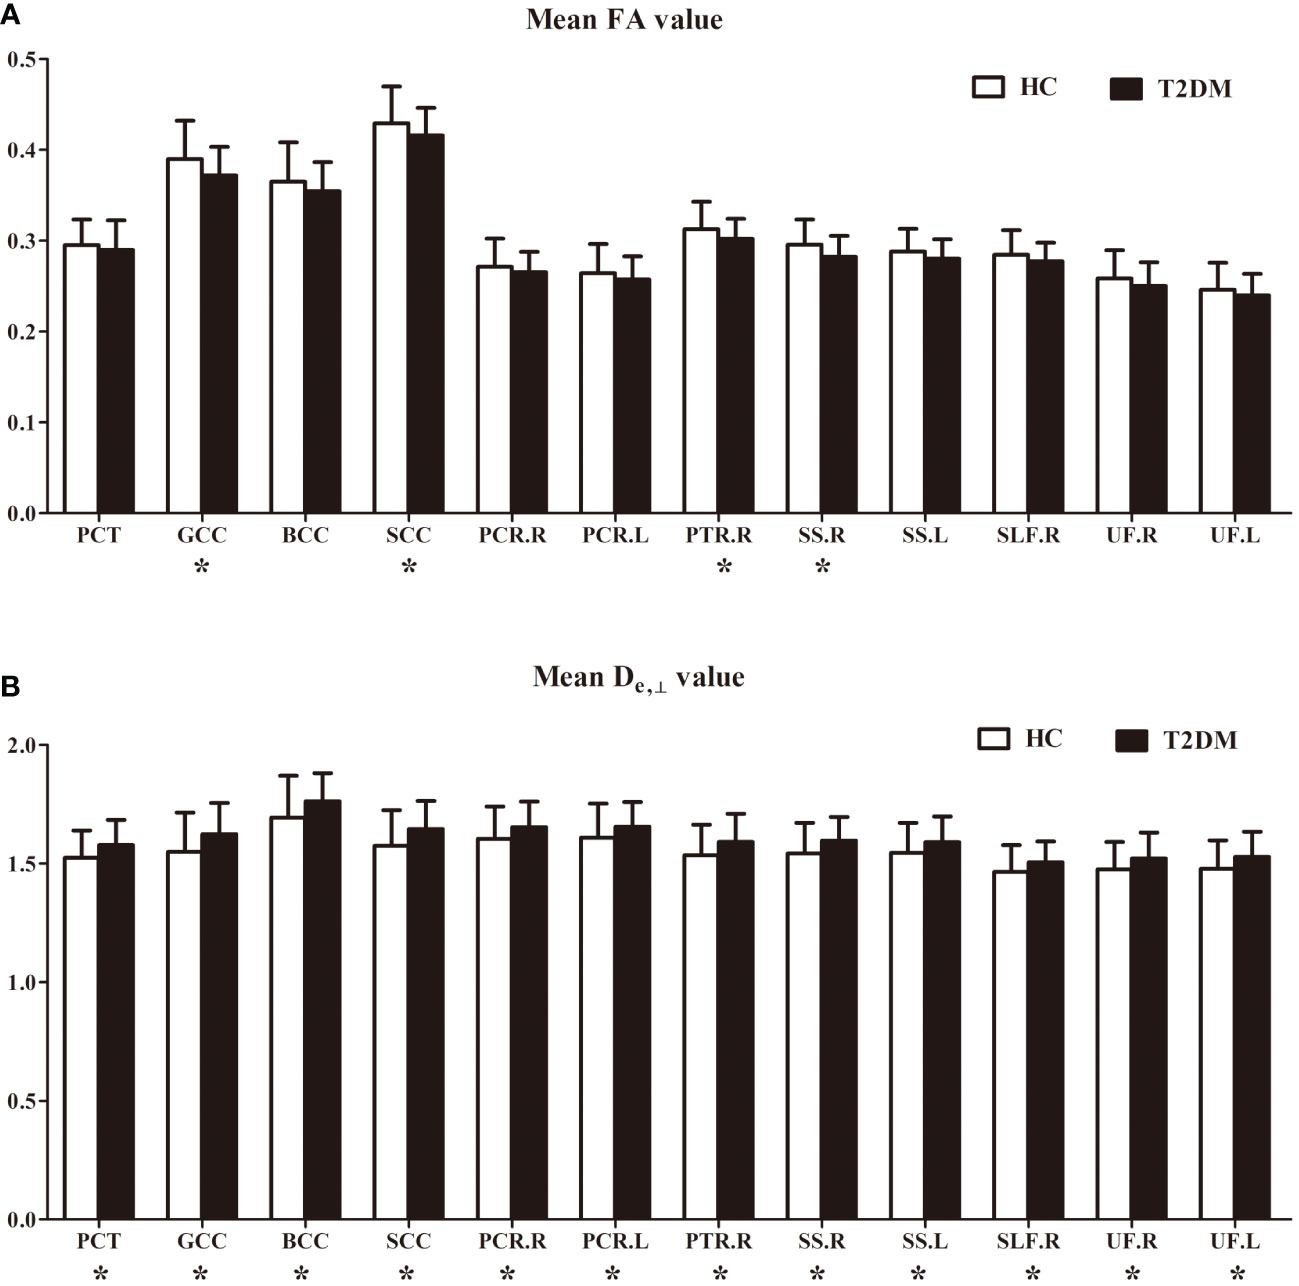
Figure 3 FA (A) and De, ⊥ (B) differences in some white matter fiber tracts. PCT, pontine crossing tract; GCC, genu of corpus callosum; BCC, body of corpus callosum; SCC, splenium of corpus callosum; PCR, posterior corona radiata; PTR, posterior thalamic radiation; SS, sagittal stratum; SLF, superior longitudinal fasciculus; UF, uncinate fasciculus; R, right; L, left. *indicates a significant difference between the two groups at a significance level of 0.05.
3.4 Correlations between ROI-wise diffusion metrics and cognitive and clinical data
Based on the WM fiber tracts showing significant intergroup differences, we explored the relationships between diffusion metrics (FA and De,⊥) of these tracts and the neuropsychological scores, disease duration, and HbA1c level in T2DM patients. The results showed that higher De,⊥ values in the genu of the CC (GCC) were significantly correlated with worse performance in the TMT-A (β = 0.433, P < 0.001) and longer disease duration (β = 0.438, P < 0.001), as shown in Figure 4. Subsequently, we conducted additional analysis employing bootstrap methodology to examine the mediating influence of disease duration on the relationship between De,⊥ values in the GCC and TMT-A. The findings indicated that the indirect impact of disease duration was not statistically significant (β = 0.041, 95%[CI] = [-.171, 0.253]). The comprehensive statistical outcomes are presented in Table 4. De,⊥ in the resultant ROIs was not significantly correlated with the HbA1c level (R < 0.4 or P > 0.05). FA was not significantly correlated with any the neuropsychological scores, disease duration, or HbA1c level (R < 0.4 or P > 0.05).
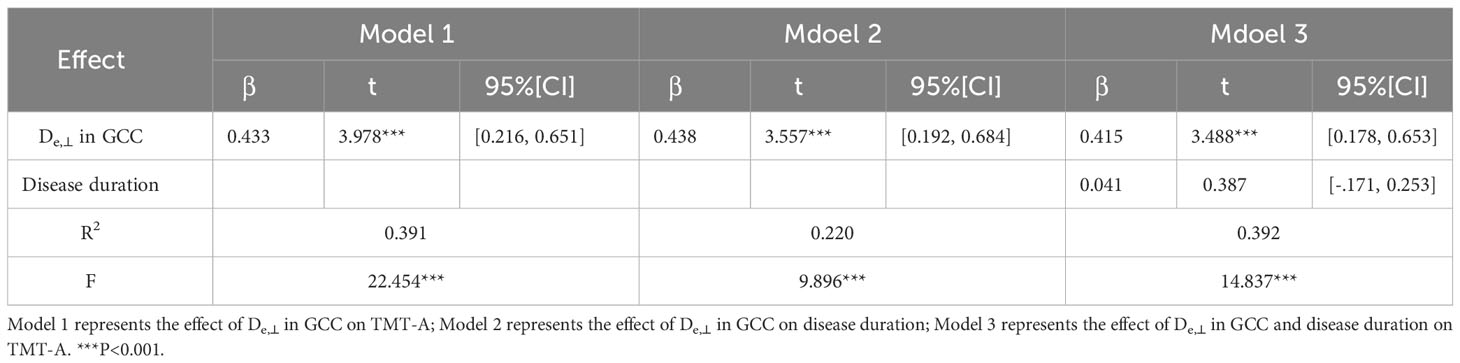
Table 4 The mediating role of disease duration between De,⊥ values in the GCC and TMT-A in T2DM patients.
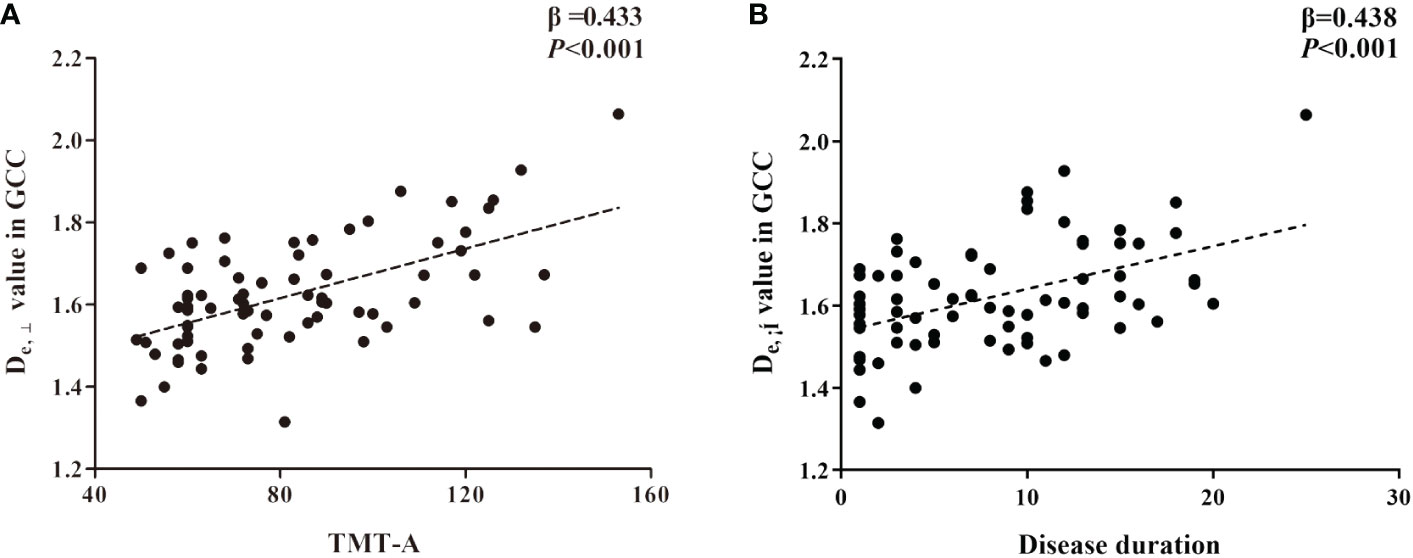
Figure 4 The significant correlations between De,⊥ metrics in genu of corpus callosum (GCC) and cognitive (A) and clinical data (B) in T2DM patients based on ROI-wise analysis.
4 Discussion
The present study is the first to investigate WM microstructural changes in T2DM patients by using WMTI models based on DKI. This study demonstrated decreased FA and AWF and increased MD, De,//, and De,⊥ in widespread WM regions in T2DM patients. Additionally, our findings suggest that among all diffusional metrics, De,⊥ is the most sensitive metric for detecting WM disruptions. In particular, the T2DM and HC groups showed only De,⊥ differences in some crossing fibers, including the pontine crossing tract, bilateral PTR, right SLF, and bilateral UF. Additionally, De,⊥ showed significant correlations with disease duration and cognitive performance, potentially providing valuable imaging evidence for predicting cognitive impairment.
Chronic brain damage in patients with T2DM has been a topic of concern, and understanding the pathogenesis of WM impairment in patients with T2DM has become increasingly important, since WM is believed play a prominent role in T2DM-induced cognitive impairment. Previous DTI studies employing TBSS, tractography, and voxel-based methods have consistently shown a reduction in FA and an elevation in MD within the WM of individuals with T2DM (7, 24). DTI is an effective modality for detecting the directional diffusion patterns of water molecules within tissues. FA and MD are two diffusion metrics commonly employed to quantify the directional preference of water molecules and average displacement within the WM (25), and have been widely recognized as significant composite metrics in the assessment of WM microstructural abnormalities. The observed decrease in FA and increase in MD may indicate compromised microstructural integrity of the WM (26, 27), which can be potentially attributed to various pathological processes such as ischemia, demyelination, axonal damage, inflammation, and edema (28). However, the ability of DTI models to accurately differentiate between these distinct pathological changes is limited in terms of specificity. To elaborate further, empirical diffusion measures solely offer indirect assessments of microstructure, thereby introducing uncertainty regarding their physical interpretation in relation to microscopic tissue parameters.
The WMTI model, based on DKI, provides more accurate and specific estimates of the microstructural brain environment by characterizing the intra-axonal and extra-axonal spaces. This allows for a comprehensive understanding of white matter changes from a biophysical perspective. In the model, the intra-axonal space represents impermeable myelinated axons, described by Daxon, while the extra-axonal space represents the permeable medium of glial cells and myelin sheath, described by De,//and De,⊥. In addition, AWF, which characterizes the water fraction inside axons compared to total water fraction, maps axonal packing density and has been validated by electron microscopy images in mice (29). The utilization of WMTI metrics has proven advantageous in investigating WM alterations and potential pathogenesis in various clinical studies involving Alzheimer’s disease (14), multiple sclerosis (15), normal aging (16), and mild traumatic brain injury (17). In the present study, alongside the observed reductions in FA and increases in MD, significantly decreased AWF and increased De,//and De,⊥ were also identified in widespread WM regions of patients with T2DM. In terms of the interpretation of AWF, the decreased AWF could potentially be attributed to a reduction in intra-axonal water or an increase in the overall water content. Given that Daxon did not exhibit a decrease in this study, it is highly likely that the widespread decrease in AWF is primarily attributable to heightened diffusivity originating from the extra-axonal space. Moreover, it can be postulated that the elevated De,⊥ observed in T2DM patients aligns with demyelination, while the increased De,//signifies augmented permeability within the glial cellular environment, induced by hyperglycemia or inflammation. In addition, increased Daxon values were also found in some discrete WM regions, which may simultaneously reflect axonal injury in limited regions.
The aforementioned diffusion findings align with the histological characteristics observed through light and electron microscopy studies (30, 31), which indicated degenerative alterations in glial cells, disruption of the myelin sheath, fragmentation of neurofilaments, and abnormalities in oligodendrocytes in rats with T2DM (31, 32). These WM microstructural abnormalities can be explained by several possible mechanisms. Hyperglycemia is known to cause widespread impairment of microvascular function, including the brain’s microvasculature (33). This impairment may lead to inflammatory responses and reduced blood flow, ultimately resulting in chronic cerebral ischemia (34). Moreover, the elevated oxidative stress resulting from hyperglycemia plays a significant role in the development of endothelial dysfunction, facilitating the pro-inflammatory process (35). These pathogenic factors and pathways are highly likely to contribute to the dysregulation of cerebral blood supply. Notably, the WM is particularly susceptible to inadequate blood supply (36), and disruption of WM microstructural integrity (28) can be predominantly attributed to a combination of hyperglycemia-induced inflammation, hypoperfusion, oxidative stress, and endothelial dysfunction (36). We speculate that the initial pathologic change is mainly characterized by demyelination, and thus seemingly increased the De,//, De,⊥ and AWF across widespread WM regions. As neurodegeneration progresses, the loss of axons occurs secondary to demyelination, leading to the increased Daxon in limited WM regions.
This study showed a large degree of overlap in group differences between WMTI and DTI metrics. Consequently, this outcome serves as evidence of the dependability of the employed metrics in the identification of T2DM-associated microstructural abnormalities. Nevertheless, the DTI model assumes of a Gaussian distribution of water-diffusion processes with a mono-exponential signal decay. This assumption poses challenges in characterizing complex fibers and consequently limits the amount of information that can be obtained. In contrast, DKI allows for the estimation of the non-Gaussian distribution of water molecules and enables calculation of kurtosis parameters such as mean kurtosis, radial kurtosis, and axial kurtosis, which can provide insights into the structural complexity. For patients with T2DM, two studies have investigated brain microstructural integrity using DKI and have confirmed its greater sensitivity than DTI in detecting changes in brain microstructure (37, 38). Since WMTI metrics are derived from DKI, we hypothesized that they could offer supplementary insights into WM microstructural abnormalities. As expected, among the WMTI and DTI metrics, De,⊥ detected more WM region differences in group comparisons, thereby exhibiting higher sensitivity and specificity for identification of subtle brain changes. Additionally, consistent with previous studies utilizing DKI, WMTI metrics also demonstrated remarkable capacity for imaging complex crossing fibers, such as the pontine crossing tract, PTR, SLF, and UF. While DKI metrics are sensitive to microstructural features, they lack specificity. Conversely, the De,⊥ metric derived from the WMTI model provides a specific measurement of the extra-axonal compartments. Neurite orientation dispersion and density imaging (NODDI) is another multicompartment model utilized to distinguish the signal originating from extra- and intra-axonal compartments. A recent investigation employed NODDI to examine microstructural modifications in individuals with T2DM, and revealed a diminished intracellular volume fraction (Vic) in T2DM patients experiencing cognitive decline (39). A reduced Vic suggests a decrease in axon density, potentially indicating degeneration of axons and myelin. This is also consistent with our speculation regarding pathological changes. However, this study did not compare the sensitivity and specificity of the WMTI and NODDI metrics in detecting and monitoring microstructural alterations, since it would prolong the scan time and increase the burden for T2DM patients.
Furthermore, this study demonstrated that the De,⊥ values in the GCC were correlated with cognitive function (TMT-A) scores and disease duration. To further analyze the role of disease duration as a possible mediator between the De,⊥ values in the GCC and TMT-A scores, a mediational model was constructed. However, disease duration did not act as a mediator in this model, which contradicts previous beliefs that longer disease duration leads to more severe neurodegeneration and cognitive decline (5). This may be due to the relatively young age (55.64 ± 7.65 years) and short duration of illness (8.34 ± 5.93) in the current study. Diabetes-associated WM impairments have been observed to manifest prior to cognitive decline, even in individuals with prediabetes (40). Thus, in T2DM patients, impairment of WM microstructural integrity in various regions, particularly the frontal lobe, has been hypothesized to affect both structural and functional connectivity. This disruption may consequently lead to network disturbances and a subsequent reduction in neuronal signal transmission, resulting in slower information processing speed and cognitive decline. While T2DM is associated with a broad spectrum of WM microstructural disruptions, only a subset of these abnormalities appears to be linked to cognitive impairments, indicating the existence of important targets of cognitive impairment in the brain. The GCC, which serves as a principal commissural WM bundle connecting the left and right prefrontal lobes, is closely associated with cognitive function and plays a crucial role in the maintenance of cognitive processes such as attention and execution (41). Additionally, a previous study conducted on patients with prediabetes also indicated that the CC is particularly susceptible to hyperglycemia and may be one of the regions most severely affected by diabetes-related damage (40). Therefore, based on our findings, we propose that the observed increase in De,⊥ within the GCC could potentially serve as an early imaging marker for assessing disease progression and monitoring cognitive function.
The findings in this study also have implications for the clinical management and risk prediction of cognitive decline in patients with T2DM. It has been widely accepted that T2DM was a risk factor associated with mild cognitive impairment and dementia. Cognitive decline starts slowly but can accelerate quickly. Therefore, tracking cognitive performance and changes of WMTI metrics over time and identifying a cut-off value for MCI could help clinicians identify patients with high risk of cognitive impairment early. These patients will receive personalized care, including strict glycemic control and management of cardiovascular risk factors. In addition, they can also benefit from early treatment with medications and cognitive behavioral therapy to prevent or delay cognitive decline.
This study had several limitations. First, this was a single-center study based on a Chinese population and only recruited inpatients with T2DM. Our results require validation in a larger and more diverse population. Second, this was a cross-sectional study, and the follow-up phase is still ongoing. Thus, longitudinal studies have not yet been performed due to the limited number of currently enrolled cases. Longitudinal studies evaluating the effectiveness of WMTI metrics would be useful in this regard. Additionally, patients with T2DM received medications, and we overlooked the effects of these medications on the brain. A partial reflection of medication effects cannot be ruled out in our results. Finally, we only focused on the WM impairments in patients with T2DM. In fact, WMTI metrics based on DKI should also have great potential for mapping changes in gray matter, which is worth further study in the future.
5 Conclusion
This study provides evidence that WMTI metrics exhibit greater sensitivity than DTI metrics in the detection of T2DM-related white matter microstructural abnormalities. The observed changes in WMTI metrics in T2DM indicate varying degrees of degeneration in the myelin sheath and axon. The WMTI model, as a noninvasive and sensitive technique, allows for early assessment of disruptions in white matter integrity among T2DM patients, potentially offering valuable insights into the underlying mechanisms of T2DM-related brain injury. Additionally, the correlation between De,⊥ values in the genu of the corpus callosum and cognitive function and disease severity implies their potential role as imaging markers for monitoring disease progression and cognitive function in patients with T2DM.
Data availability statement
The original contributions presented in the study are included in the article/supplementary material. Further inquiries can be directed to the corresponding author/s.
Ethics statement
The studies involving humans were approved by The Human Ethics Committee of Shaanxi Provincial Peoples Hospital. The studies were conducted in accordance with the local legislation and institutional requirements. The participants provided their written informed consent to participate in this study.
Author contributions
JG: Data curation, Formal analysis, Funding acquisition, Methodology, Writing – original draft, Writing – review & editing. PP: Formal analysis, Methodology, Data curation, Writing – review & editing. JL: Formal analysis, Software, Writing – review & editing, Validation. MT: Data curation, Formal analysis, Writing – review & editing, Validation. XY: Validation, Writing – review & editing, Data curation. XZ: Software, Validation, Visualization, Writing – review & editing, Data curation. MW: Formal analysis, Software, Validation, Writing – review & editing. KA: Methodology, Software, Writing – review & editing. XL: Resources, Supervision, Writing – review & editing. XiaonlingZ: Funding acquisition, Resources, Supervision, Writing – review & editing. DZ: Conceptualization, Funding acquisition, Investigation, Project administration, Resources, Supervision, Writing – review & editing.
Funding
The author(s) declare financial support was received for the research, authorship, and/or publication of this article. This research was supported by the National Natural Science Foundation of China (grant number 82170820 and 81801327), the Key Research and Development Program of Shaanxi Province of China (Grant no. 2018ZDXM-SF-038), the Social Development Science and Technology Research Project of Shaanxi Province of China (grant number 2023-YBSF-579), the Science and Technology Talent Support Program of Shaanxi Provincial People’s Hospital of China (grant number 2021BJ-20), and the Science and Technology Development Incubation Fund Project of Shaanxi Provincial People’s Hospital of China (grant number 2022YJY-02).
Acknowledgments
The authors thank all participants who volunteered for this study as well as the researchers who participated in this project.
Conflict of interest
Author KA was employed by the company Philips Healthcare.
The remaining authors declare that the research was conducted in the absence of any commercial or financial relationships that could be construed as a potential conflict of interest.
Publisher’s note
All claims expressed in this article are solely those of the authors and do not necessarily represent those of their affiliated organizations, or those of the publisher, the editors and the reviewers. Any product that may be evaluated in this article, or claim that may be made by its manufacturer, is not guaranteed or endorsed by the publisher.
References
1. Saeedi P, Petersohn I, Salpea P, Malanda B, Karuranga S, Unwin N, et al. Global and regional diabetes prevalence estimates for 2019 and projections for 2030 and 2045: Results from the International Diabetes Federation Diabetes Atlas, 9(th) edition. Diabetes Res Clin Pract. (2019) 157:107843. doi: 10.1016/j.diabres.2019.107843
2. Moheet A, Mangia S, Seaquist ER. Impact of diabetes on cognitive function and brain structure. Ann N Y Acad Sci. (2015) 1353:60–71. doi: 10.1111/nyas.12807
3. Damanik J, Yunir E. Type 2 diabetes mellitus and cognitive impairment. Acta Med Indones. (2021) 53:213–20. doi: 10.47895/amp.vi0.7648
4. Mijnhout GS, Scheltens P, Diamant M, Biessels GJ, Wessels AM, Simsek S, et al. Diabetic encephalopathy: A concept in need of a definition. Diabetologia. (2006) 49:1447–8. doi: 10.1007/s00125-006-0221-8
5. Antal B, McMahon LP, Sultan SF, Lithen A, Wexler DJ, Dickerson B, et al. Type 2 diabetes mellitus accelerates brain aging and cognitive decline: Complementary findings from UK Biobank and meta-analyses. Elife. (2022) 11:e73138. doi: 10.7554/eLife.73138
6. Zhou C, Li J, Dong M, Ping L, Lin H, Wang Y, et al. Altered white matter microstructures in type 2 diabetes mellitus: A coordinate-based meta-analysis of diffusion tensor imaging studies. Front Endocrinol (Lausanne). (2021) 12:658198. doi: 10.3389/fendo.2021.658198
7. Alotaibi A, Tench C, Stevenson R, Felmban G, Altokhis A, Aldhebaib A, et al. Investigating brain microstructural alterations in type 1 and type 2 diabetes using diffusion tensor imaging: A systematic review. Brain Sci. (2021) 11:140. doi: 10.3390/brainsci11020140
8. Sanjari Moghaddam H, Ghazi Sherbaf F, Aarabi MH. Brain microstructural abnormalities in type 2 diabetes mellitus: A systematic review of diffusion tensor imaging studies. Front Neuroendocrinol. (2019) 55:100782. doi: 10.1016/j.yfrne.2019.100782
9. Xiong Y, Sui Y, Xu Z, Zhang Q, Karaman MM, Cai K, et al. A diffusion tensor imaging study on white matter abnormalities in patients with type 2 diabetes using tract-based spatial statistics. AJNR Am J Neuroradiol. (2016) 37:1462–9. doi: 10.3174/ajnr.A4740
10. Hsu JL, Chen YL, Leu JG, Jaw FS, Lee CH, Tsai YF, et al. Microstructural white matter abnormalities in type 2 diabetes mellitus: a diffusion tensor imaging study. Neuroimage. (2012) 59:1098–105. doi: 10.1016/j.neuroimage.2011.09.041
11. Zhang J, Wang Y, Wang J, Zhou X, Shu N, Wang Y, et al. White matter integrity disruptions associated with cognitive impairments in type 2 diabetic patients. Diabetes. (2014) 63:3596–605. doi: 10.2337/db14-0342
12. Hui ES, Cheung MM, Qi L, Wu EX. Towards better MR characterization of neural tissues using directional diffusion kurtosis analysis. Neuroimage. (2008) 42:122–34. doi: 10.1016/j.neuroimage.2008.04.237
13. Fieremans E, Jensen JH, Helpern JA. White matter characterization with diffusional kurtosis imaging. Neuroimage. (2011) 58:177–88. doi: 10.1016/j.neuroimage.2011.06.006
14. Dong JW, Jelescu IO, Ades-Aron B, Novikov DS, Friedman K, Babb JS, et al. Diffusion MRI biomarkers of white matter microstructure vary nonmonotonically with increasing cerebral amyloid deposition. Neurobiol Aging. (2020) 89:118–28. doi: 10.1016/j.neurobiolaging.2020.01.009
15. de Kouchkovsky I, Fieremans E, Fleysher L, Herbert J, Grossman RI, Inglese M. Quantification of normal-appearing white matter tract integrity in multiple sclerosis: a diffusion kurtosis imaging study. J Neurol. (2016) 263:1146–55. doi: 10.1007/s00415-016-8118-z
16. Billiet T, Vandenbulcke M, Mädler B, Peeters R, Dhollander T, Zhang H, et al. Age-related microstructural differences quantified using myelin water imaging and advanced diffusion MRI. Neurobiol Aging. (2015) 36:2107–21. doi: 10.1016/j.neurobiolaging.2015.02.029
17. Chung S, Wang X, Fieremans E, Rath JF, Amorapanth P, Foo FA, et al. Altered relationship between working memory and brain microstructure after mild traumatic brain injury. AJNR Am J Neuroradiol. (2019) 40:1438–44. doi: 10.3174/ajnr.A6146
18. Association AD. Diagnosis and classification of diabetes mellitus. Diabetes Care. (2013) 36 Suppl 1:S67–74. doi: 10.2337/dc13-S067
19. Caruyer E, Lenglet C, Sapiro G, Deriche R. Design of multishell sampling schemes with uniform coverage in diffusion MRI. Magn Reson Med. (2013) 69:1534–40. doi: 10.1002/mrm.24736
20. Jones DK, Horsfield MA, Simmons A. Optimal strategies for measuring diffusion in anisotropic systems by magnetic resonance imaging. Magn Reson Med. (1999) 42:515–25. doi: 10.1002/(SICI)1522-2594(199909)42:3<515::AID-MRM14>3.3.CO;2-H
21. Li X, Yang J, Gao J, Luo X, Zhou Z, Hu Y, et al. A robust post-processing workflow for datasets with motion artifacts in diffusion kurtosis imaging. PloS One. (2014) 9:e94592. doi: 10.1371/journal.pone.0094592
22. Tabesh A, Jensen JH, Ardekani BA, Helpern JA. Estimation of tensors and tensor-derived measures in diffusional kurtosis imaging. Magn Reson Med. (2011) 65:823–36. doi: 10.1002/mrm.22655
23. Veraart J, Poot DH, Van Hecke W, Blockx I, van der Linden A, Verhoye M, et al. More accurate estimation of diffusion tensor parameters using diffusion Kurtosis imaging. Magn Reson Med. (2011) 65:138–45. doi: 10.1002/mrm.22603
24. Huang L, Zhang Q, Tang T, Yang M, Chen C, Tao J, et al. Abnormalities of brain white matter in type 2 diabetes mellitus: A meta-analysis of diffusion tensor imaging. Front Aging Neurosci. (2021) 13:693890. doi: 10.3389/fnagi.2021.693890
25. Alexander AL, Lee JE, Lazar M, Field AS. Diffusion tensor imaging of the brain. Neurotherapeutics. (2007) 4:316–29. doi: 10.1016/j.nurt.2007.05.011
26. Wheeler-Kingshott CA, Cercignani M. About “axial” and “radial” diffusivities. Magn Reson Med. (2009) 61:1255–60. doi: 10.1002/mrm.21965
27. Wozniak JR, Lim KO. Advances in white matter imaging: a review of in vivo magnetic resonance methodologies and their applicability to the study of development and aging. Neurosci Biobehav Rev. (2006) 30:762–74. doi: 10.1016/j.neubiorev.2006.06.003
28. Winklewski PJ, Sabisz A, Naumczyk P, Jodzio K, Szurowska E, Szarmach A. Understanding the physiopathology behind axial and radial diffusivity changes-what do we know? Front Neurol. (2018) 9:92. doi: 10.3389/fneur.2018.00092
29. Guglielmetti C, Veraart J, Roelant E, Mai Z, Daans J, Van Audekerke J, et al. Diffusion kurtosis imaging probes cortical alterations and white matter pathology following cuprizone induced demyelination and spontaneous remyelination. Neuroimage. (2016) 125:363–77. doi: 10.1016/j.neuroimage.2015.10.052
30. Jespersen SN, Bjarkam CR, Nyengaard JR, Chakravarty MM, Hansen B, Vosegaard T, et al. Neurite density from magnetic resonance diffusion measurements at ultrahigh field: comparison with light microscopy and electron microscopy. Neuroimage. (2010) 49:205–16. doi: 10.1016/j.neuroimage.2009.08.053
31. Hernández-Fonseca JP, Rincón J, Pedreañez A, Viera N, Arcaya JL, Carrizo E, et al. Structural and ultrastructural analysis of cerebral cortex, cerebellum, and hypothalamus from diabetic rats. Exp Diabetes Res. (2009) 2009:329632. doi: 10.1155/2009/329632
32. Kara A, Unal D, Simsek N, Yucel A, Yucel N, Selli J. Ultra-structural changes and apoptotic activity in cerebellum of post-menopausal-diabetic rats: a histochemical and ultra-structural study. Gynecol Endocrinol. (2014) 30:226–31. doi: 10.3109/09513590.2013.864270
33. Sörensen BM, Houben AJ, Berendschot TT, Schouten JS, Kroon AA, van der Kallen CJ, et al. Prediabetes and type 2 diabetes are associated with generalized microvascular dysfunction: the maastricht study. Circulation. (2016) 134:1339–52. doi: 10.1161/CIRCULATIONAHA.116.023446
34. Taylor WD, Aizenstein HJ, Alexopoulos GS. The vascular depression hypothesis: mechanisms linking vascular disease with depression. Mol Psychiatry. (2013) 18:963–74. doi: 10.1038/mp.2013.20
35. Valko M, Leibfritz D, Moncol J, Cronin MT, Mazur M, Telser J. Free radicals and antioxidants in normal physiological functions and human disease. Int J Biochem Cell Biol. (2007) 39:44–84. doi: 10.1016/j.biocel.2006.07.001
36. Sun J, Xu B, Zhang X, He Z, Liu Z, Liu R, et al. The mechanisms of type 2 diabetes-related white matter intensities: A review. Front Public Health. (2020) 8:498056. doi: 10.3389/fpubh.2020.498056
37. Xie Y, Zhang Y, Qin W, Lu S, Ni C, Zhang Q. White matter microstructural abnormalities in type 2 diabetes mellitus: A diffusional kurtosis imaging analysis. AJNR Am J Neuroradiol. (2017) 38:617–25. doi: 10.3174/ajnr.A5042
38. Xiong Y, Sui Y, Zhang S, Zhou XJ, Yang S, Fan Y, et al. Brain microstructural alterations in type 2 diabetes: diffusion kurtosis imaging provides added value to diffusion tensor imaging. Eur Radiol. (2019) 29:1997–2008. doi: 10.1007/s00330-018-5746-y
39. Xiong Y, Zhang S, Shi J, Fan Y, Zhang Q, Zhu W. Application of neurite orientation dispersion and density imaging to characterize brain microstructural abnormalities in type-2 diabetics with mild cognitive impairment. J Magn Reson Imaging. (2019) 50:889–98. doi: 10.1002/jmri.26687
40. Jing J, Zhou Y, Pan Y, Cai X, Zhu W, Zhang Z, et al. Reduced white matter microstructural integrity in prediabetes and diabetes: A population-based study. EBioMedicine. (2022) 82:104144. doi: 10.1016/j.ebiom.2022.104144
Keywords: type 2 diabetes mellitus, diffusion kurtosis imaging, microstructure, white matter tract integrity, neuroimaging
Citation: Gao J, Pan P, Li J, Tang M, Yan X, Zhang X, Wang M, Ai K, Lei X, Zhang X and Zhang D (2024) Analysis of white matter tract integrity using diffusion kurtosis imaging reveals the correlation of white matter microstructural abnormalities with cognitive impairment in type 2 diabetes mellitus. Front. Endocrinol. 15:1327339. doi: 10.3389/fendo.2024.1327339
Received: 24 October 2023; Accepted: 13 February 2024;
Published: 29 February 2024.
Edited by:
Lei Sha, China Medical University, ChinaReviewed by:
Bing Zhang, Nanjing Drum Tower Hospital, ChinaLuca Steardo, University Magna Graecia of Catanzaro, Italy
Copyright © 2024 Gao, Pan, Li, Tang, Yan, Zhang, Wang, Ai, Lei, Zhang and Zhang. This is an open-access article distributed under the terms of the Creative Commons Attribution License (CC BY). The use, distribution or reproduction in other forums is permitted, provided the original author(s) and the copyright owner(s) are credited and that the original publication in this journal is cited, in accordance with accepted academic practice. No use, distribution or reproduction is permitted which does not comply with these terms.
*Correspondence: Dongsheng Zhang, eXVueXVuMTIyNDI0QDEyNi5jb20=
†These authors have contributed equally to this work and share first authorship