 Yuliya Kupriyanova
 Vera Schrauwen-Hinderling
- 1Institute for Clinical Diabetology, German Diabetes Center, Leibniz Center for Diabetes Research at Heinrich Heine University Düsseldorf, Düsseldorf, Germany
- 2German Center for Diabetes Research (DZD), Partner Düsseldorf, Neuherberg, Germany
- 3Department of Radiology and Nuclear Medicine, Maastricht University Medical Center, Maastricht, Netherlands
Magnetic Resonance Spectroscopy (MRS) and Magnetic Resonance Imaging (MRI) yield valuable metabolic information in a non-invasive way. The current mini review addresses current practice and recent advances in metabolic research, specifically in the field of obesity, insulin resistance and diabetes. The potential application of MRS to investigate lipid and glycogen stores, as well as energy metabolism are reviewed and novel methods to extract more detailed information on fatty acid composition or newly detectable metabolites such as acetylcarnitine or nicotinamide adenosine dinucleotide (NAD+) and NADH are discussed. These advances are based on optimization of post-processing or on the application of new schemes for spectral editing to suppress unwanted signal. The advantage of MRS is that it gives real-time dynamic information and therefore, metabolism can be investigated during physiological challenges, such as exercise, food intake or immediate drug action. Due to its non-invasive nature, repeated measurements are possible with MRS, to monitor treatments and interventions and also organs that are not easily accessible for biopsies, such as the liver or the heart can be probed by MRS. When investing in further methodological development, new applications will arise, advancing our understanding of metabolic disease and giving us tools to identify successful treatment and prevention strategies in individuals at risk.
1 Introduction
Magnetic Resonance Spectroscopy (MRS) is a non-invasive method to investigate metabolism in vivo and has proven to be very valuable for research of metabolic disorders (1, 2). MRS is based on the same physical principle as magnetic resonance imaging (MRI), but instead of anatomical information, MRS provides biochemical information about the measured tissue and quantifies distinct metabolites in vivo. Combining MRI and MRS, i.e. acquire an MR image first as a reference for further positioning the region of interest for MRS acquisition, allows one to probe metabolism in a specific location, which is of primary interest for clinical and preclinical studies using MRS. Information on the basic principles of MRS can be found in text books, such as (3). Recently published experts’ consensus recommendations overview terminology and concepts as well as reporting standards for in vivo MRS research (4, 5). An MRS signal can be acquired by interaction with a feature of the nucleus, which is called nuclear spin. Atomic nuclei of several- but not all- elements have spin (where spin ≠ 0) and are thus detectable by MRS. In metabolic research, signal acquisition from 1H, 13C and 31P isotopes is most often used and recently also 2H (6–9). 1H is very abundant constituent of water, lipids and carbohydrates and the sensitivity for MRS is relatively high, making it often the method of choice to observe such metabolites. MRS using other nuclei than 1H (eg 31P, 13C and 2H), are termed multinuclear, or x-nuclear methods.
13C is a stable isotope of carbon with a spin of ½. This is in contrast to the isotope 12C which is MRS invisible. Most of the naturally abundant carbon represents 12C, and 13C has a low natural abundance of only 1.1%. Furthermore, the sensitivity for 13C-MRS is low, due to a low gyromagnetic ratio (four times lower than 1H), which leads to its low detection efficiency. Nevertheless, 13C-MRS is usually the method of choice when quantifying glycogen and regardless of the fact that only 1.1% contributes to the glycogen signal that can be detected, this natural abundance of 13C is enough to generate a measurable signal. The low natural abundance of 13C makes it an interesting candidate for tracer studies to study metabolic fluxes. Interestingly, the recent ‘rediscovery’ of deuterium MRS, which also has a low natural abundance, but requires less sophisticated MRS sequences for detection (6), has opened alternative possibilities to perform in vivo tracer studies by x-nuclei MRS. 31P has a spin of 1/2 and its natural abundance is high (approximately 100%), however due to a lower gyromagnetic ratio, its sensitivity is 2,5 times lower than for 1H. 31P-MRS is used to get insights into energy metabolism, as this method can be employed to quantify high energy metabolites such as adenosine triphosphate (ATP) or creatine phosphate (PCr).
For metabolic health, the balance between substrate availability and the capacity to handle the substrate load is crucial and many metabolic diseases, such as type 2 diabetes are strongly associated with obesity and a lack of physical activity (Figure 1). A chronically, and constantly high supply of fatty acids and carbohydrate to muscle tissue and the liver are typical for these conditions. This leads to expansion of substrate stores. At the same time, chronic metabolic disease was also associated with hampered oxidative capacity, leading to a metabolic ‘gridlock’ (10). Such imbalance of substrate supply and oxidative capacity is typical for chronic metabolic diseases like liver steatosis and metabolic steatohepatitis (MASH) (11), insulin resistance and type 2 diabetes (12). It was reported that the combination of low oxidative capacity and high substrate availability leads to accumulation of metabolic intermediates, such as acyl-CoA, ceramides and diacylglycerols (DAG), which were implicated in the etiology of insulin resistance (13). Information on both sides of this balance (substrate stores and oxidative capacity) can be gained by MRS and can yield important insights to better understand metabolic health and disease.
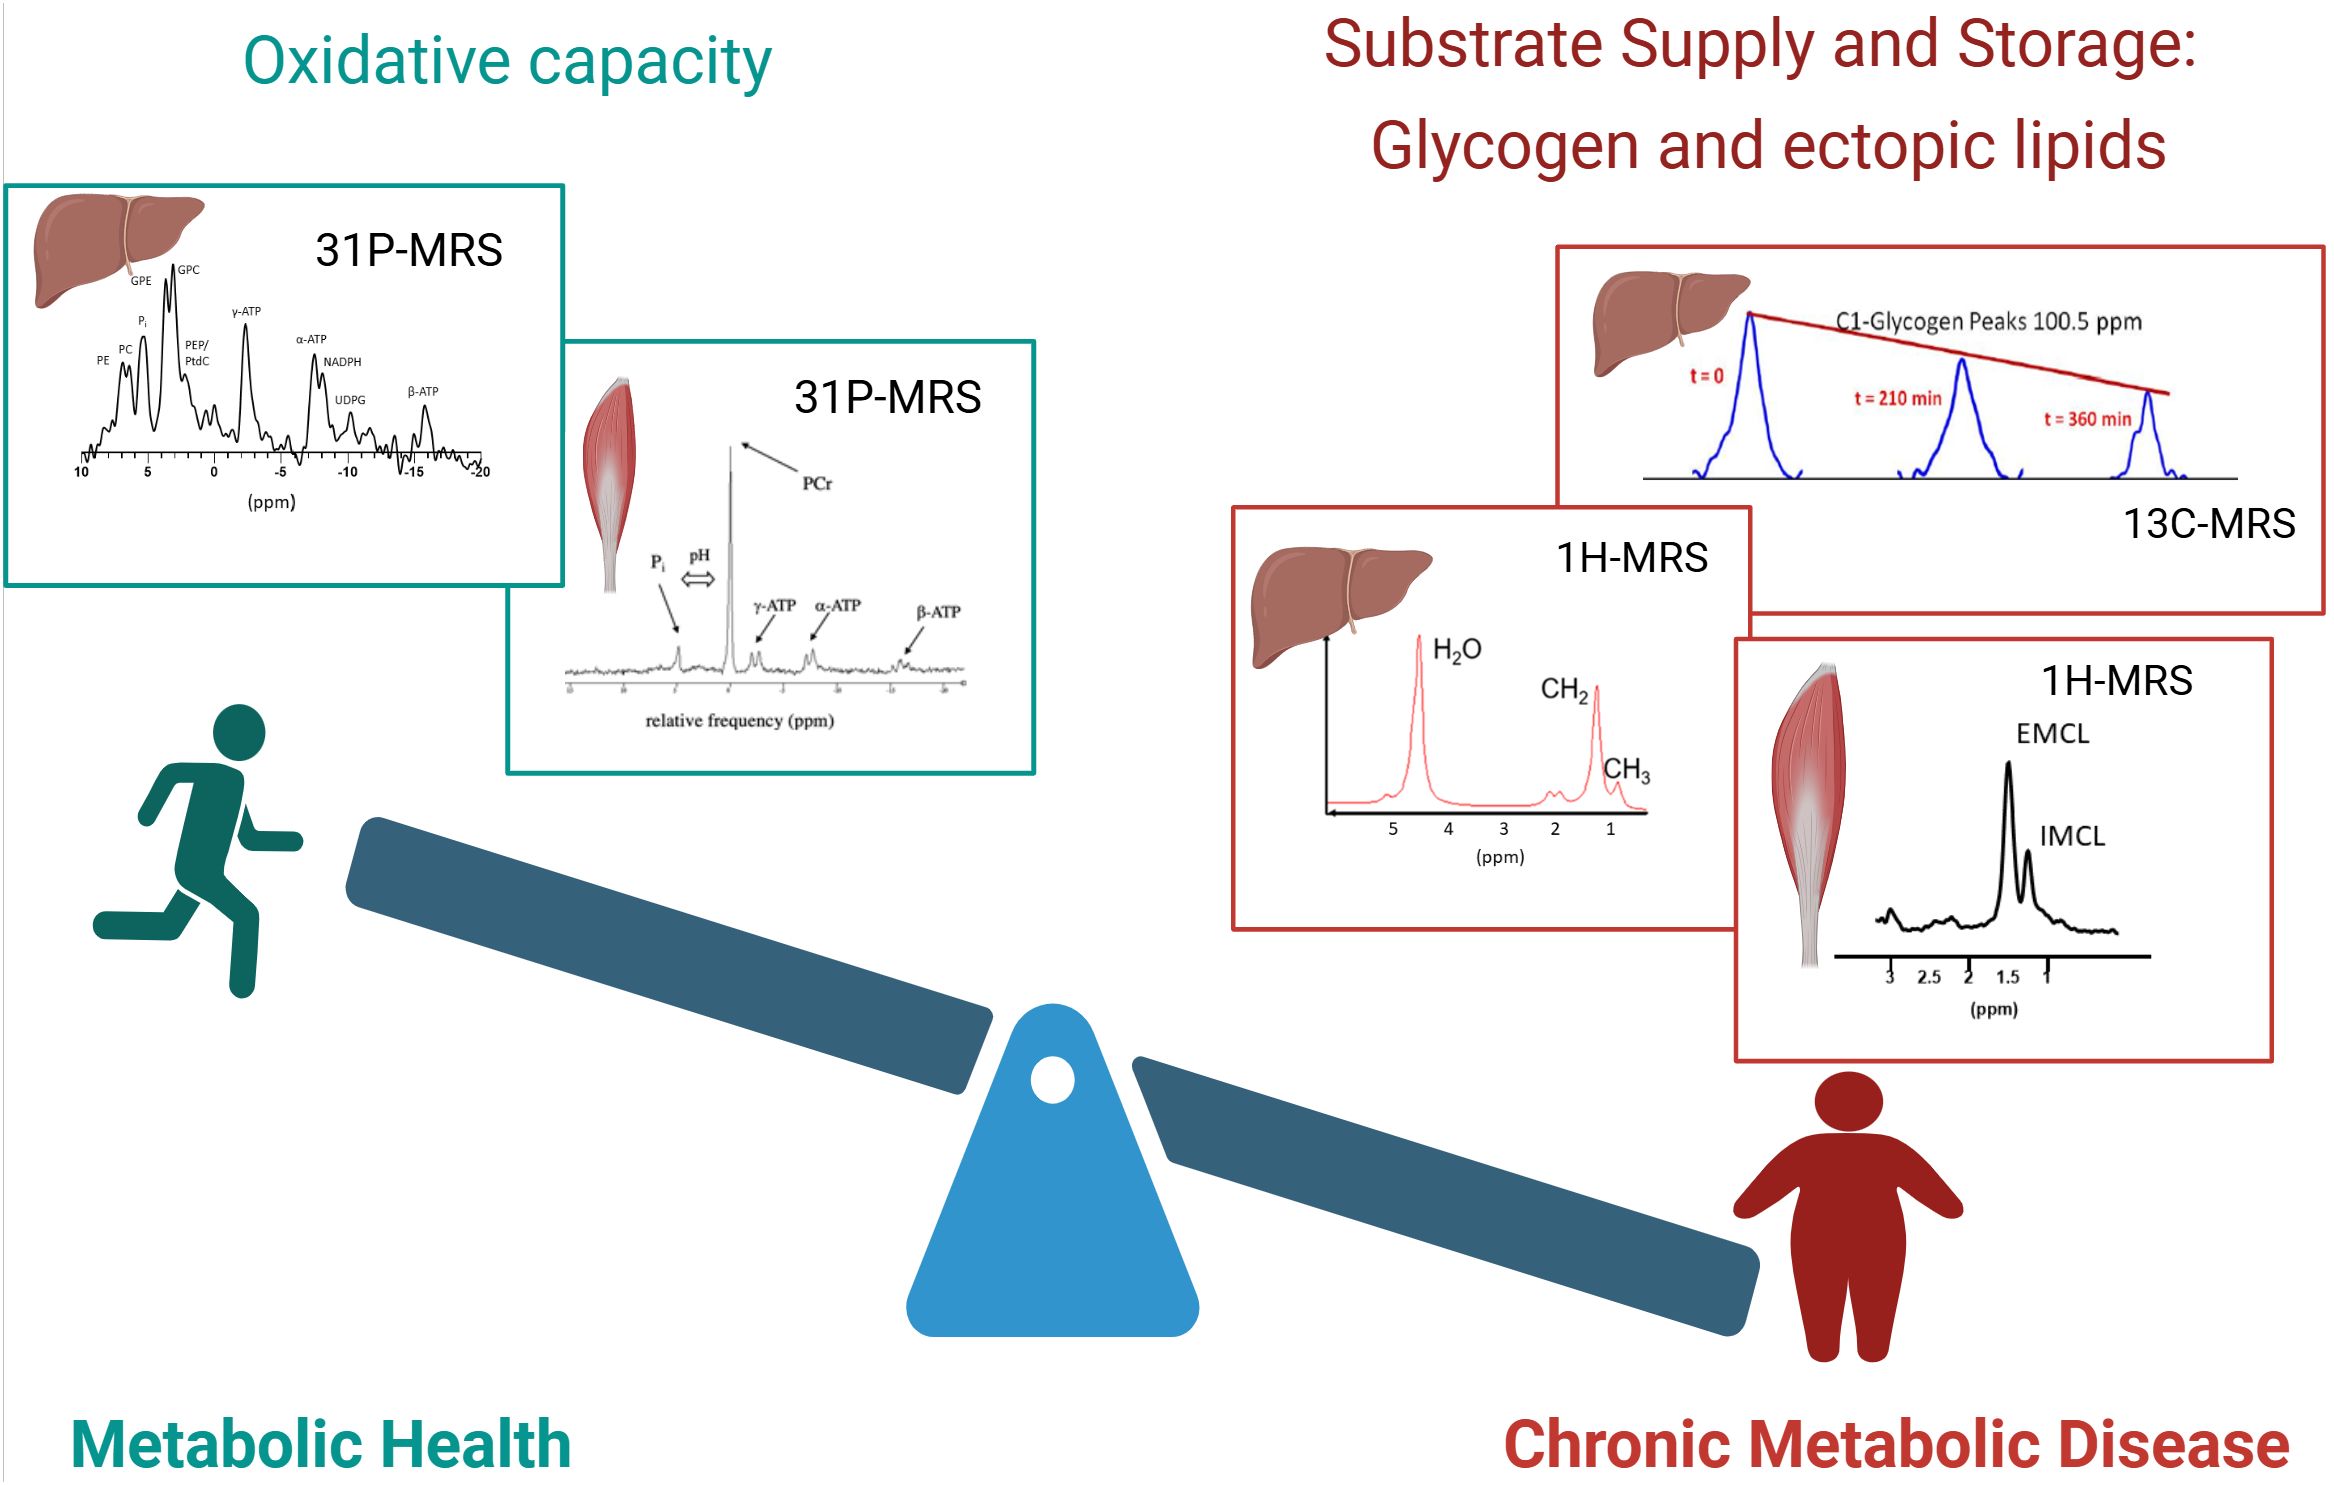
Figure 1. Balance of metabolic health. The balance between substrate availability and the capacity to handle the substrate load is a strong determinant of metabolic health. Left: metabolically healthy people are characterized by a high oxidative capacity, which can be determined by organ-specific 31P-MRS. Examples of 31P spectra of the liver and muscle are shown. Right: people with chronic metabolic disease are generally characterized by increased lipid content and disturbed glycogen dynamics, which can be detected by 1H-MRS and 13C-MRS respectively. Top right: Sequential 13C spectra of glycogen are shown, which enable the determination of net glycogen flux. Bottom right: Examples of 1H spectra of the liver and muscle are shown. Created in BioRender. (Kupriyanova, Y. (2025) https://BioRender.com/dalrhjx).
The aim of the current review is to represent the most recent advances in in vivo MRS for research of metabolic disorders, discuss recent applications of innovative MRS methods and provide ideas for the future directions of MRS in metabolic research.
2 Lipid and glycogen storage in organs
2.1 1H-MRS for assessment of ectopic lipid depots
Most surplus energy is stored in the form of triglycerides in adipose tissue. However, fatty acids can also be stored outside adipose tissue as triglycerides in lipid droplets, in muscle, liver and the myocardium. This especially occurs in overweight and obesity. Adipose tissue around organs (visceral adipose tissue) is also often considered ‘ectopic’, as expansion of these adipose tissue stores were associated with an unhealthy phenotype. The expansion of ectopic lipid stores were strongly associated with insulin resistance (14–16), which is an early hallmark of the type 2 diabetes development.
While MRI can best be used to quantify the volume of various adipose tissue depots on whole body level (eg subcutaneous and various kinds of visceral adipose tissue depots) (17), 1H-MRS is the method of choice for monitoring ectopic fat depots in the muscle, liver and myocardium (18, 19). In skeletal muscle, the differentiation of intramyocelleluar lipids (IMCL), representing lipid droplets in muscle cells and lipids from intramuscular adipose tissue (extramyocellular lipids, EMCL) is possible with 1H-MRS (20, 21). These measurements are mostly performed in the tibialis anterior or vastus intermedius muscle, because the separation of IMCL and EMCL is best achieved in these muscles (22). In the liver and the heart, there is no infiltrating adipose tissue and proton spectra from these organs are simpler to analyse and the separation between lipid signal from parenchymal cells and lipid signal from adipose tissue is therefore not an issue (19). 1H-MRS is considered to be the gold-standard for non-invasive quantification of hepatic lipid content (23). MRS is used for diagnosing of metabolic dysfunction associated steatotic liver disease (MASLD), one of the complications of diabetes mellitus (24) and for monitoring of longitudinal changes in hepatic lipid content due to diabetes development (25).
2.2 Origin of ectopic lipids
Next to simply quantifying the content of ectopic lipids, MRS can provide a more detailed characterisation and importantly, can thereby provide insight into the origin of the stored lipids. Especially in the liver, there are various pathways that contribute to lipid accumulation and it is clinically important to understand what the contribution is from each of the various pathways, such as de novo lipogenesis, adipose tissue lipolysis and direct triglyceride storage from meals.
2.2.1 De novo lipogenesis (DNL)
Regarding DNL, it is interesting to note that in humans, upregulated rates of DNL are expected to result in mainly saturated fatty acids (SFA) and therefore, the quantification of specifically SFA could give information about rates of de novo lipogenesis. By optimizing and applying a sophisticated post-processing routine, it was shown that SFA, monounsaturated fatty acids (MUFA) and polyunsaturated fatty acids (PUFA) could be specifically quantified in the liver (26). Using this method, it could indeed be shown that hepatic SFA is correlated to rates of DNL (26) and that the fraction of SFA reflects DNL.
2.2.2 Meal-derived hepatic lipids
In order to quantify lipid storage from a meal, tracer experiments are needed. Fatty acids, enriched in 13C isotopes are stable (nonradioactive) molecules that can be incorporated into a meal and tracked to their storage site by MRS. Normally, 13C MRS would be the method of choice. Due to the low sensitivity and the very crude localisation of this method, indirect 13C methods are more appropriate. Such 1H-observed, 13C-edited MRS methods are selective for 13C signal, while retaining the sensitivity and localisation possibilities of 1H-MRS (also called POCE for proton-observed, carbon edited). In the liver, the most broadly used POCE approaches rely on subtraction of two consecutively acquired spectra (with/without the 13C editing pulses). In the liver, where respiratory motion is not negligible, such subtraction techniques are not successful due to motion-induced subtraction artifacts. To this end, a single shot POCE technique (based on the seletion of heteronuclear quantum coherences, HMQC) was developed and applied in a 13C fatty acid tracking experiment. The incorporation of 13C labelled fatty acids resulted in increased hepatic 13C enrichment after the meal and it was shown that this meal-derived lipid storage in the liver was similar in lean and obese volunteers (27).
2.2.3 Adipose tissue derived lipids
Regarding the contribution of fatty acids originating from adipose tissue, most results in the literature originate from studies employing other techniques than MR methods, such as PET or stable isotopes in combination with biopsies (28, 29). However, also MRS results support the importance of fatty acids originating from adipose tissue, eg from studies provoking adipose tissue lipolysis and high concentrations of plasma free fatty acid (FFA), and showing that this results in increased hepatic lipid content (30).
Further increase in the sensitivity of the indirect 13C MRS methods are warranted to decrease the amount of tracer needed for the experiments and make the broader application more realistic. Currently, such experiments are very expensive. Another promising approach which has drawn the interest of the scientific community is the in vivo application of deuterium MRS (also called deuterium metabolic imaging, DMI), which can be combined with the consumption or infusion of deuterated substrate to observe storage pathways and metabolic fluxes (6, 9).
2.3 13C-MRS to determine hepatic glycogen
As mentioned above, glycogen has been quantified by 13C-MRS, using the natural abundance signal of 13C (31). In combination with other measurements, the quantification of glycogen storage and utilization has provided insight into different processes of glucose metabolism (glucogenesis, glucogenolysis, gluconeogenesis), and is useful for investigation of disturbed glycogen dynamics in diabetes as well as the effects of antidiabetic therapies (32, 33). The interest in glycogen dynamics is renewed due to the successful action of GLP-1 agonists, which (amongst others) target glycogenolysis (34).
However, the MRS-based quantification of glycogen has some limitations. The measurement time is long, and in many studies, localization was rather crude and typical values from the absolute quantification, based on phantom replacement experiments, vary greatly between sites (35). However, significant improvements have been made to apply more sophisticated localisation in 13C MRS, for example, rat studies show the feasibility of adding outer volume suppression to improve localisation (36).
Increasing 13C enrichment before the start of the measurements by ingestion/infusion of 13C enriched substrate, make the measurement more sensitive, but again, such experiments are very costly, due to the high costs of stable isotope tracers. Proton MRS was positioned as a potential alternative to 13C in glycogen quantification (37), overcoming the sensitivity issues, however, these attempts are not very robust and hindered by saturation transfer phenomena when water suppression is used (38). It was also demonstrated that specialized, multi-element coils increase the signal detection significantly and thereby help to reduce the measurement time (39). The reliability of the 13C-based phantom replacement experiments may be improved by more advanced, imaging-based signal correction, based on coil sensitivity maps that are projected on the actual experimental set-up. Further technical improvements are warranted to make it easier and faster to non-invasively monitor glycogen in the liver and muscle in order to elucidate 24 hour glycogen dynamics in health and disease and to investigate the effect of treatment.
Indirect detection of glycogen using chemical exchange saturation transfer imaging (glycoCEST) methods is a promising alternative to 13 C measurements (40).
3 Energy metabolism; oxidative capacity
While stimulating certain pathways of substrate storage can favour metabolic disease and challenge metabolic health, the capacity to handle substrate, the oxidative capacity, is also a strong determinant of metabolic health. Indeed, it is well known that intervention that improve oxidative capacity, such as endurance training, improve metabolic health. In skeletal muscle, a low oxidative capacity was found in persons with type 2 diabetes (41) and even in individuals who are still healthy but at risk for type 2 diabetes development (42). In the liver, low ATP concentrations were detected in type 2 diabetes (43) and during the progression from liver steatosis of liver inflammation, mitochondrial capacity was shown to be decreased (11, 44).
To investigate energy metabolism and mitochondrial function non-invasively, 31P-MRS is very valuable, as phosphorous containing metabolites, such as ATP, PCr and inorganic phosphate (Pi) can be detected and quantified. An overview of different 31P-MRS based methods for energy metabolism measurements is given in (45).
3.1 Energy metabolism and mitochondrial function
A well-established way of investigating oxidative metabolism in muscle is by investigating PCr recovery kinetics after PCr depletion, typically after exercise performed inside the scanner. It has been shown that PCr resynthesis is fuelled almost purely by aerobic pathways and the half-time (or rate constant) of the monoexponential PCr recovery is reflecting oxidative capacity (46). This method was first applied several decades ago and still considered as a very robust tool to investigate oxidative metabolism (47, 48).
Next to getting information about maximal in vivo oxidative capacity from PCr recovery, monitoring PCr at the onset of exercise is also interesting. During this phase, the prolonged dependence on PCr hydrolyses for energy supply reflects slow mitochondrial activation, also termed mitochondrial inertia (48), which was associated with exercise intolerance and metabolic disease (49). For more detailed discussion of such metabolic inertia, we refer to a review on this topic (50).
Another way to investigate energy metabolism is by applying saturation transfer measurements and quantifying (unidirectional) ATP synthetic fluxes. While this method has been initially positioned as a way to quantify mitochondrial ATP synthesis and thereby mitochondrial function (51), there was also critique on such interpretation (52). It was shown that the rates determined by saturation transfer are complex to interpret (53) and probably contain substantial part of anaerobic metabolism (52). Results relating unidirectional Pi-ATP fluxes, as assessed by saturation transfer measurements and oxidative capacity, as assessed by PCr recovery are mixed with some data showing a positive correlation between the two markers of energy metabolism (54), while a rodent study that manipulated mitochondrial function with injections of a complex I inhibitor, did not find a relationship between Pi-ATP flux and oxidative capacity (55).’
A different method to investigate aerobic metabolism is by using 13C tracer, such as 13C acetate, in combination with 13C-MRS to quantify downstream metabolites, such as glutamate (56) and thereby determine the tricarboxylic acid (TCA) cycle flux.
Another important player in mitochondrial function and especially mitochondrial biogenesis is nicotinamide adenosine dinucleotide (NAD+) (57). NAD+ activates deacetylases, which lead to deacetylation of transcription factors, such as peroxisome proliferator-activated receptor gamma coactivator 1 – alpha (PGC1-α), so that they can enter the nucleus and lead to translation of mitochondrial genes and therefore to mitochondrial biogenesis. In principle, NAD+ and NADH can be detected by 31P-MRS, however, a complicating factor is the overlap with ATP resonances, making it impossible to quantify NAD+ and NADH in muscle by direct 31P-MRS, at least at clinical field strength. Here, the development of a new sequence that selectively suppresses ATP, sparing NAD+ and NADH (58) can be instrumental. Using this sequence, it was shown that the decrease in NAD+, seen during aging is blunted by regular exercise (58).
4 Metabolic intermediates
When the amount of substrate supplied to organs, mainly in the form of plasma glucose and plasma FFA is constantly high, while energy needs and oxidative capacity is low, this can lead to the accumulation of metabolic intermediates, hampering metabolic function (59). Therefore, quantifying metabolic intermediates may be important to monitor metabolic health. Also the capacity to buffer accumulating intermediates may be metabolically beneficial. Such an example of a metabolite is acetylcarnitine, which is formed when acetyl-CoA concentrations are high, counteracting the accumulation of acetyl-CoA.
4.1 Acetylcarnitine
Acetylcarnitine is formed by the conjunction of carnitine and acetyl-CoA. While acetyl-CoA, formed in the mitochondria, cannot leave the organelle, upon conjugation with carnitine, acetylcarnitine can leave the mitochondria, keeping acetyl-CoA low. The enzyme responsible for this, carnitine acetyltransferase (CrAT) was shown to have high impact on metabolic health, as knock-out animals are glucose intolerant (60). Therefore, a high capacity to form acetylcarnitine is a reflection of good metabolic health. In principle, acetylcarnitine can be quantified by 1H-MRS, however the strong lipid signals usually cover this resonance. Suppression the lipid signal by long echo time or T1 editing was shown to uncover the acetylcarnitine resonance, making the quantification possible (61, 62).
In a cross-sectional study, it was shown that acetylcarnitine concentration correlates with insulin sensitivity and that individuals with type 2 diabetes are characterized by lower concentrations of acetylcarnitine (61). The association of low acetylcarnitine with insulin resistance and glucose intolerance and low oxidative capacity was confirmed in various muscle groups at ultra-high field (7T) (63, 64). As acetyl-CoA levels can rapidly change and therefore, also acetylcarnitine concetrations adapt rapidly to the physiological state, strict standardisation is necessary and recommendations are given in the consensus paper on 1H-MRS in muscle (22).
5 Conclusion and outlook: potential of MRS in metabolic research
MRS and MRI yield invaluable metabolic information in a non-invasive way (Figure 2). The further methodological development is necessary to advance the field and to specifically address clinical needs. As shown by the establishment of the quantification of SFA, MUFA and PUFA, it can worth to invest into careful acquisition and post-processing, as the improved spectral quality and more accurate fitting can already uncover new, valuable information. Careful post-processing with image-based correction for coil sensitivity in glycogen measurements can also improve the robustness of 13C-MRS for glycogen detection.
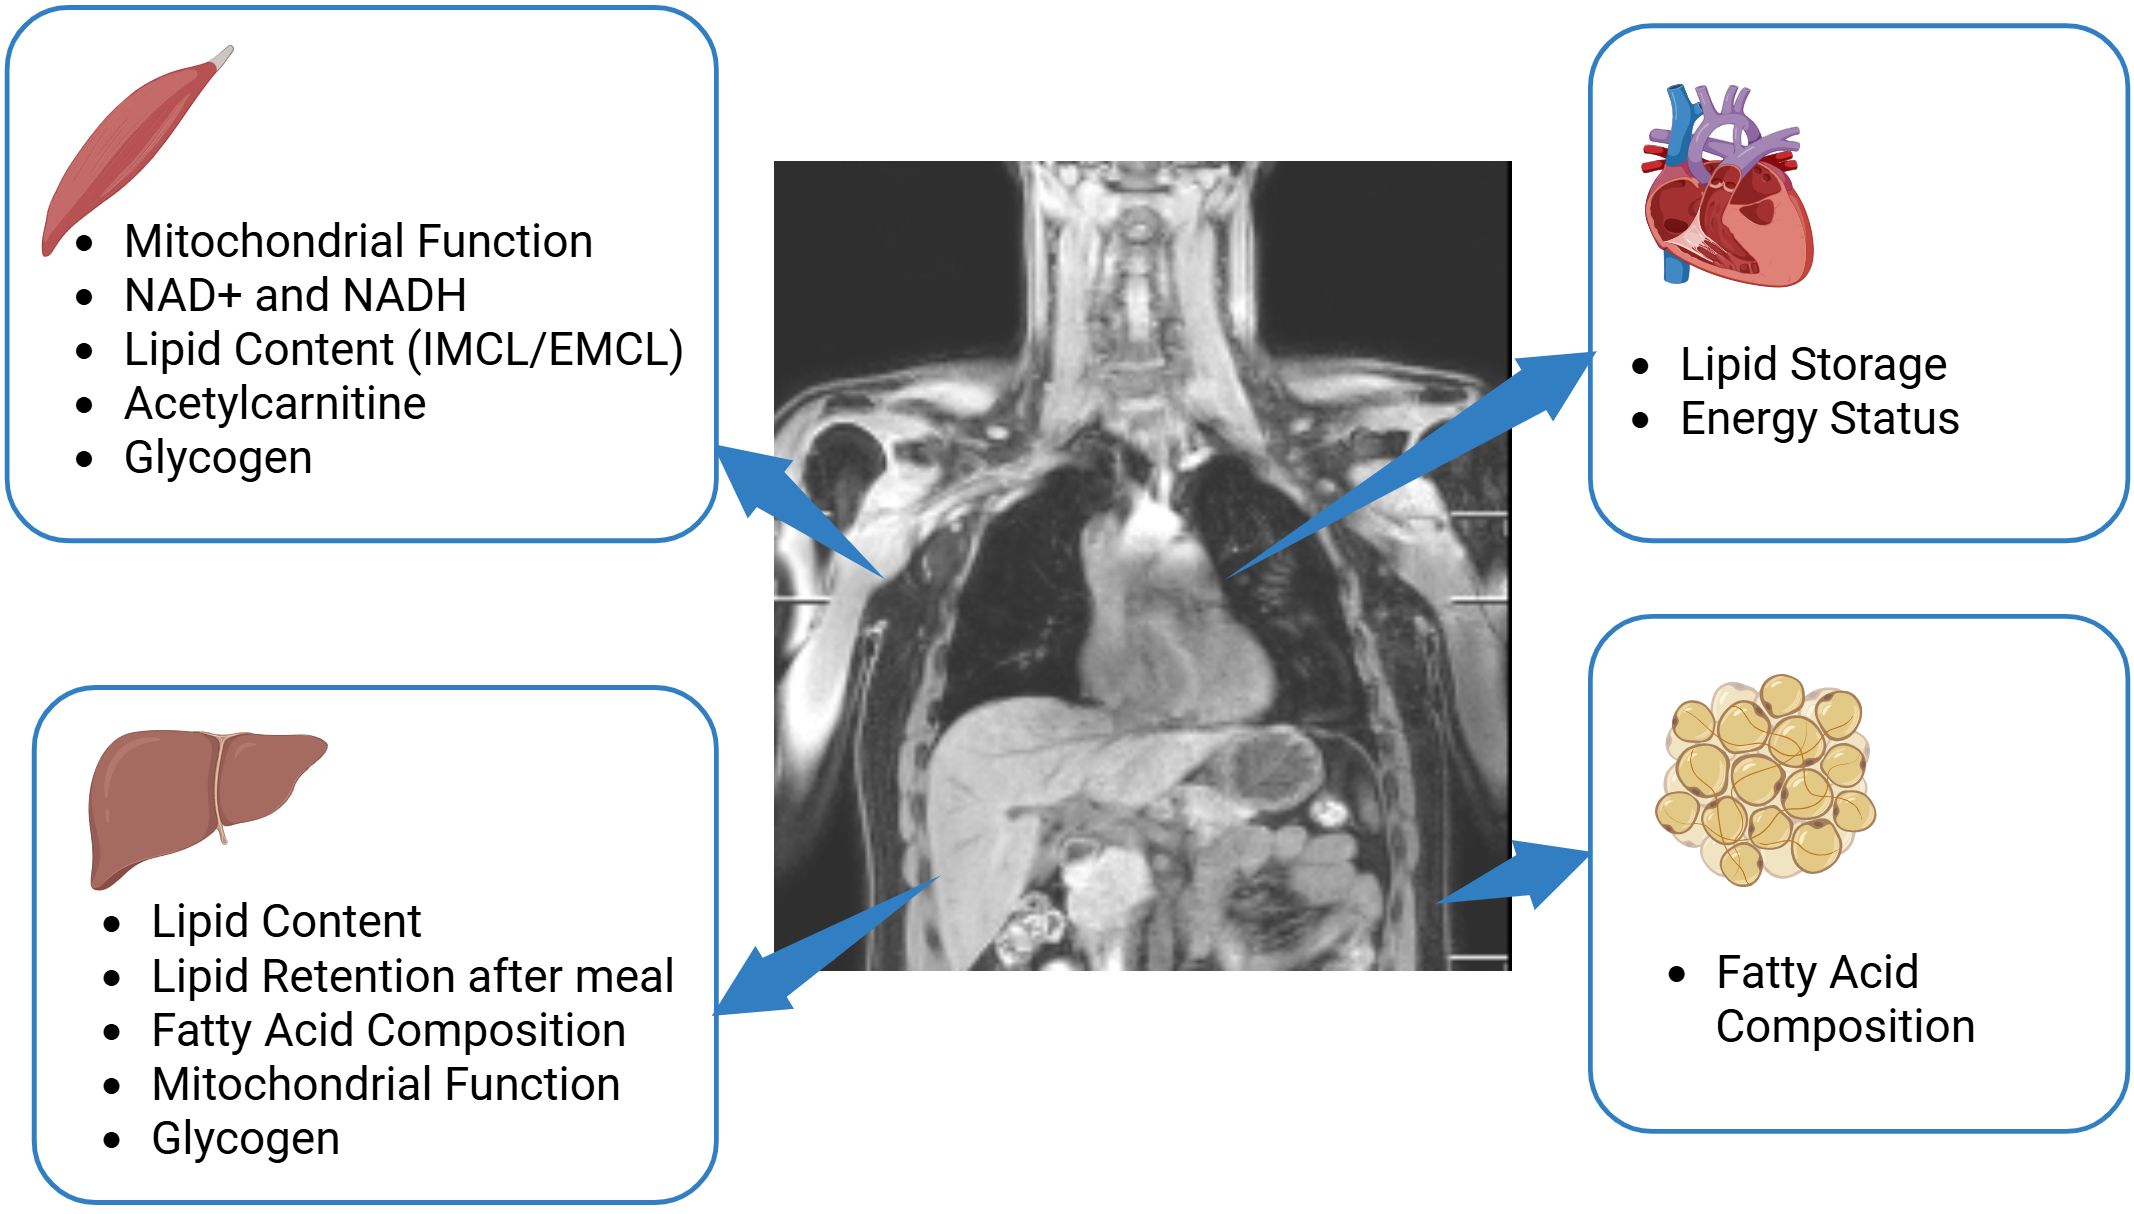
Figure 2. Potential of MRS in metabolic research. The application of multinuclear MRS in skeletal muscle provides valuable information about mitochondrial function, muscle lipid content, glycogen and can detect acetylcarnitine, NAD+, and NADH. The application of such techniques in the liver delivers knowledge on hepatic lipid content and lipid composition, provide information about mitochondrial function and glycogen storage and indirect 13C editing techniques enable monitoring of lipid retention after a meal. In the heart, multinuclear MRS is able to determine lipid storage and the energy status of heart by 1H-MRS and 31P-MRS respectively. In adipose tissue, 1H-MRS and 13C-MRS can provide information about fatty acid composition. Created in BioRender. (Kupriyanova, Y. (2025) https://BioRender.com/b27z305).
Some physiologically relevant metabolites are currently not quantifiable by standard MRS due to spectral overlap with neighbouring resonances. Here, the development of spectral editing techniques to specifically suppress certain resonances, while leaving other resonances undisturbed, can be very helpful. As an example, the suppression of γ-ATP revealed the NAD+ and NADH resonances and thereby enabled the quantification of these metabolites in skeletal muscle (58).
The advantage of MRS is that it gives real-time dynamic information and therefore, metabolism can be investigated during physiological challenges, such as exercise, food intake or immediate drug action. In that respect, the combination of methods by dual, or even triple tuned coils in combination with interleaved MRS (65) opens ways to monitor various facets of metabolism at the same time, which can be very interesting to monitor various aspects of the physiological response to a challenge.
Motion is one of the crucial factors affecting quality of MRS. Experts’ consensus recommendations named and discussed three main approaches for mitigating the effect of motion in MRS (66): volunteer immobilization, retrospective correction and prospective real-time correction using various triggering and/or tracking methods (67, 68). The last can simultaneously update localization and the B0 field, which is essential for abdominal MRS measurements in organs affected by respiratory or cardiac motion, and prospective methods were indicated as being the method of choice in the expert consensus paper (66). A pipeline for rapid prospective motion correction of multinuclear MR Spectroscopy of the target organ using MR image navigators was recently introduced and implemented on 3T and 7T scanners. Its feasibility for reliable in-vivo motion extraction on the myocardium and kidney was shown in (69).
Clearly, the non-invasive nature of MRS is very valuable, as repeated measurements are possible to monitor treatments and interventions and also organs that are not easily accessible for biopsies, such as the liver or the heart can be probed by MRS. Although ultra-high field (7T) has clear advantages for MRS, most studies on metabolic health can be performed at clinical field strength (3T).
Author contributions
YK: Writing – original draft, Writing – review & editing. VS: Writing – original draft, Writing – review & editing.
Funding
The author(s) declare that financial support was received for the research and/or publication of this article. This work was initially exclusively supported by the German Diabetes Center (DDZ), which is funded by the German Federal Ministry of Health (BMG, Berlin, Germany) and the Ministry of Culture and Science of Northrhine-Westphalia (MKW-NRW, Düsseldorf, Germany) and as a multicenter study now receives additional funding by the German Federal Ministry of Education and Research (BMBF, Berlin, Germany) through the German Center for Diabetes Research (DZD e.V.).
Conflict of interest
The authors declare that the research was conducted in the absence of any commercial or financial relationships that could be constructed as a potential conflict of interest.
Generative AI statement
The author(s) declare that no Generative AI was used in the creation of this manuscript.
Publisher’s note
All claims expressed in this article are solely those of the authors and do not necessarily represent those of their affiliated organizations, or those of the publisher, the editors and the reviewers. Any product that may be evaluated in this article, or claim that may be made by its manufacturer, is not guaranteed or endorsed by the publisher.
References
1. Hwang JH and Choi CS. Use of in vivo magnetic resonance spectroscopy for studying metabolic diseases. Exp Mol Med. (2015) 47:e139. doi: 10.1038/emm.2014.101
2. van de Weijer T and Schrauwen-Hinderling VB. Application of Magnetic Resonance Spectroscopy in metabolic research. Biochim Biophys Acta Mol Basis Dis. (2019) 1865:741–8. doi: 10.1016/j.bbadis.2018.09.013
3. de Graaf RA. In vivo NMR spectroscopy principles and techniques. Hoboken, New Jersey, USA: Wiley (2019).
4. Kreis R, Boer V, Choi IY, Cudalbu C, de Graaf RA, Gasparovic C, et al. Terminology and concepts for the characterization of in vivo MR spectroscopy methods and MR spectra: Background and experts’ consensus recommendations. NMR BioMed. (2020) 34:e4347. doi: 10.1002/nbm.4347
5. Lin A, Andronesi O, Bogner W, Choi IY, Coello E, Cudalbu C, et al. Minimum Reporting Standards for in vivo Magnetic Resonance Spectroscopy (MRSinMRS): Experts’ consensus recommendations. NMR BioMed. (2021) 34:e4484. doi: 10.1002/nbm.4484
6. De Feyter HM and de Graaf RA. Deuterium metabolic imaging - Back to the future. J Magn Reson. (2021) 326:106932. doi: 10.1016/j.jmr.2021.106932
7. Polvoy I, Qin H, Flavell RR, Gordon J, Viswanath P, Sriram R, et al. Deuterium metabolic imaging-rediscovery of a spectroscopic tool. Metabolites. (2021) 11 (9), 570. doi: 10.3390/metabo11090570
8. Bitencourt AGV, Bhowmik A, Marcal Filho EFL, Lo Gullo R, Mazaheri Y, Kapetas P, et al. Deuterium MR spectroscopy: potential applications in oncology research. BJR Open. (2024) 6:tzae019. doi: 10.1093/bjro/tzae019
9. Pan F, Liu X, Wan J, Guo Y, Sun P, Zhang X, et al. Advances and prospects in deuterium metabolic imaging (DMI): a systematic review of in vivo studies. Eur Radiol Exp. (2024) 8:65. doi: 10.1186/s41747-024-00464-y
10. Muoio DM. Metabolic inflexibility: when mitochondrial indecision leads to metabolic gridlock. Cell. (2014) 159:1253–62. doi: 10.1016/j.cell.2014.11.034
11. Koliaki C, Szendroedi J, Kaul K, Jelenik T, Nowotny P, Jankowiak F, et al. Adaptation of hepatic mitochondrial function in humans with non-alcoholic fatty liver is lost in steatohepatitis. Cell Metab. (2015) 21:739–46. doi: 10.1016/j.cmet.2015.04.004
12. Muoio DM and Newgard CB. Mechanisms of disease:Molecular and metabolic mechanisms of insulin resistance and beta-cell failure in type 2 diabetes. Nat Rev Mol Cell Biol. (2008) 9:193–205. doi: 10.1038/nrm2327
13. Shulman GI. Cellular mechanisms of insulin resistance. J Clin Invest. (2000) 106:171–6. doi: 10.1172/JCI10583
14. Krssak M, Falk Petersen K, Dresner A, DiPietro L, Vogel SM, Rothman DL, et al. Intramyocellular lipid concentrations are correlated with insulin sensitivity in humans: a 1H NMR spectroscopy study. Diabetologia. (1999) 42:113–6. doi: 10.1007/s001250051123
15. Wagner R, Eckstein SS, Yamazaki H, Gerst F, Machann J, Jaghutriz BA, et al. Metabolic implications of pancreatic fat accumulation. Nat Rev Endocrinol. (2022) 18:43–54. doi: 10.1038/s41574-021-00573-3
16. Nogueira JP and Cusi K. Role of insulin resistance in the development of nonalcoholic fatty liver disease in people with type 2 diabetes: from bench to patient care. Diabetes Spectr. (2024) 37:20–8. doi: 10.2337/dsi23-0013
17. Grune E, Nattenmüller J, Kiefer LS, Machann J, Peters A, Bamberg F, et al. Subphenotypes of body composition and their association with cardiometabolic risk - Magnetic resonance imaging in a population-based sample. Metabolism. (2024) 164:156130. doi: 10.1016/j.metabol.2024.156130
18. Machann J, Stefan N, and Schick F. (1)H MR spectroscopy of skeletal muscle, liver and bone marrow. Eur J Radiol. (2008) 67:275–84. doi: 10.1016/j.ejrad.2008.02.032
19. Buitinga M, Veeraiah P, Haans F, and Schrauwen-Hinderling VB. Ectopic lipid deposition in muscle and liver, quantified by proton magnetic resonance spectroscopy. Obes (Silver Spring). (2023) 31:2447–59. doi: 10.1002/oby.23865
20. Schick F, Eismann B, Jung WI, Bongers H, Bunse M, and Lutz O. Comparison of localized proton NMR signals of skeletal muscle and fat tissue in vivo: two lipid compartments in muscle tissue. Magn Reson Med. (1993) 29:158–67. doi: 10.1002/mrm.1910290203
21. Boesch C, Slotboom J, Hoppeler H, and Kreis R. In vivo determination of intra-myocellular lipids in human muscle by means of localized 1H-MR-spectroscopy. Magnetic Resonance Med. (1997) 37:484–93. doi: 10.1002/mrm.1910370403
22. Krššák M, Lindeboom L, Schrauwen-Hinderling V, Szczepaniak LS, Derave W, Lundbom J, et al. Proton magnetic resonance spectroscopy in skeletal muscle: Experts’ consensus recommendations. NMR BioMed. (2021) 34:e4266. doi: 10.1002/nbm.4266
23. Szczepaniak LS, Nurenberg P, Leonard D, Browning JD, Reingold JS, Grundy S, et al. Magnetic resonance spectroscopy to measure hepatic triglyceride content: prevalence of hepatic steatosis in the general population. Am J Physiol Endocrinol Metab. (2005) 288:E462–468. doi: 10.1152/ajpendo.00064.2004
24. Tilg H, Moschen AR, and Roden M. NAFLD and diabetes mellitus. Nat Rev Gastroenterol Hepatol. (2017) 14:32–42. doi: 10.1038/nrgastro.2016.147
25. Kupriyanova Y, Zaharia OP, Bobrov P, Karusheva Y, Burkart V, Szendroedi J, et al. Early changes in hepatic energy metabolism and lipid content in recent-onset type 1 and 2 diabetes mellitus. J Hepatol. (2021) 74:1028–37. doi: 10.1016/j.jhep.2020.11.030
26. Roumans KHM, Lindeboom L, Veeraiah P, Remie CME, Phielix E, Havekes B, et al. Hepatic saturated fatty acid fraction is associated with de novo lipogenesis and hepatic insulin resistance. Nat Commun. (2020) 11:1891. doi: 10.1038/s41467-020-15684-0
27. Lindeboom L, de Graaf RA, Nabuurs CI, van Ewijk PA, Hesselink MK, Wildberger JE, et al. Quantum coherence spectroscopy to measure dietary fat retention in the liver. JCI Insight. (2016) 1:e84671. doi: 10.1172/jci.insight.84671
28. Iozzo P, Bucci M, Roivainen A, Någren K, Järvisalo MJ, Kiss J, et al. Fatty acid metabolism in the liver, measured by positron emission tomography, is increased in obese individuals. Gastroenterology. (2010) 139:846–56. doi: 10.1053/j.gastro.2010.05.039
29. Cao Y, Gathaiya N, Han Q, Kemp BJ, and Jensen MD. Subcutaneous adipose tissue free fatty acid uptake measured using positron emission tomography and adipose biopsies in humans. Am J Physiol Endocrinol Metab. (2019) 317:E194–e199. doi: 10.1152/ajpendo.00030.2019
30. Bilet L, van de Weijer T, Hesselink MK, Glatz JF, Lamb HJ, Wildberger J, et al. Exercise-induced modulation of cardiac lipid content in healthy lean young men. Basic Res Cardiol. (2011) 106:307–15. doi: 10.1007/s00395-010-0144-x
31. Rothman DL, Magnusson I, Katz LD, Shulman RG, and Shulman GI. Quantitation of hepatic glycogenolysis and gluconeogenesis in fasting humans with 13C NMR. Science. (1991) 254:573–6. doi: 10.1126/science.1948033
32. Roden M, Petersen KF, and Shulman GI. Nuclear magnetic resonance studies of hepatic glucose metabolism in humans. Recent Prog Horm Res. (2001) 56:219–37. doi: 10.1210/rp.56.1.219
33. Parker VER, Robertson D, Erazo-Tapia E, Havekes B, Phielix E, de Ligt M, et al. Cotadutide promotes glycogenolysis in people with overweight or obesity diagnosed with type 2 diabetes. Nat Metab. (2023) 5:2086–93. doi: 10.1038/s42255-023-00938-0
34. Zeigerer A, Sekar R, Kleinert M, Nason S, Habegger KM, and Müller TD. Glucagon’s metabolic action in health and disease. Compr Physiol. (2021) 11:1759–83. doi: 10.1002/j.2040-4603.2021.tb00161.x
35. Buehler T, Bally L, Dokumaci AS, Stettler C, and Boesch C. Methodological and physiological test-retest reliability of (13) C-MRS glycogen measurements in liver and in skeletal muscle of patients with type 1 diabetes and matched healthy controls. NMR BioMed. (2016) 29:796–805. doi: 10.1002/nbm.3531
36. Choi IY, Tkác I, and Gruetter R. Single-shot, three-dimensional “non-echo” localization method for in vivo NMR spectroscopy. Magn Reson Med. (2000) 44:387–94. doi: 10.1002/1522-2594(200009)44:3<387::AID-MRM8>3.0.CO;2-3
37. Weis J, Kullberg J, and Ahlström H. Multiple breath-hold proton spectroscopy of human liver at 3T: Relaxation times and concentrations of glycogen, choline, and lipids. J Magn Reson Imaging. (2018) 47:410–7. doi: 10.1002/jmri.25734
38. Chen W, Avison MJ, Zhu XH, and Shulman RG. NMR studies of 1H NOEs in glycogen. Biochemistry. (1993) 32:11483–7. doi: 10.1021/bi00094a003
39. Stender S, Zaha VG, Malloy CR, Sudderth J, DeBerardinis RJ, and Park JM. Assessment of rapid hepatic glycogen synthesis in humans using dynamic (13)C magnetic resonance spectroscopy. Hepatol Commun. (2020) 4:425–33. doi: 10.1002/hep4.1458
40. van Zijl PC, Jones CK, Ren J, Malloy CR, and Sherry AD. MRI detection of glycogen in vivo by using chemical exchange saturation transfer imaging (glycoCEST). Proc Natl Acad Sci U.S.A. (2007) 104:4359–64. doi: 10.1073/pnas.0700281104
41. Schrauwen-Hinderling VB, Kooi ME, Hesselink MK, Jeneson JA, Backes WH, van Echteld CJ, et al. Impaired in vivo mitochondrial function but similar intramyocellular lipid content in patients with type 2 diabetes mellitus and BMI-matched control subjects. Diabetologia. (2007) 50:113–20. doi: 10.1007/s00125-006-0475-1
42. Phielix E, Schrauwen-Hinderling VB, Mensink M, Lenaers E, Meex R, Hoeks J, et al. Lower intrinsic ADP-stimulated mitochondrial respiration underlies in vivo mitochondrial dysfunction in muscle of male type 2 diabetic patients. Diabetes. (2008) 57:2943–9. doi: 10.2337/db08-0391
43. Szendroedi J, Chmelik M, Schmid AI, Nowotny P, Brehm A, Krssak M, et al. Abnormal hepatic energy homeostasis in type 2 diabetes. Hepatology. (2009) 50:1079–86. doi: 10.1002/hep.23093
44. Fromenty B and Roden M. Mitochondrial alterations in fatty liver diseases. J Hepatol. (2023) 78:415–29. doi: 10.1016/j.jhep.2022.09.020
45. Valkovič L, Chmelík M, and Krššák M. In-vivo(31)P-MRS of skeletal muscle and liver: A way for non-invasive assessment of their metabolism. Anal Biochem. (2017) 529:193–215. doi: 10.1016/j.ab.2017.01.018
46. Sahlin K, Harris RC, and Hultman E. Resynthesis of creatine phosphate in human muscle after exercise in relation to intramuscular pH and availability of oxygen. Scand J Clin Lab Invest. (1979) 39:551–8. doi: 10.3109/00365517909108833
47. Hultman E, Sjöholm H, Sahlin K, and Edström L. Glycolytic and oxidative energy metabolism and contraction characteristics of intact human muscle. Ciba Found Symp. (1981) 82:19–40.
48. Mancilla R, Pava-Mejia D, van Polanen N, de Wit V, Bergman M, Grevendonk L, et al. Invasive and noninvasive markers of human skeletal muscle mitochondrial function. Physiol Rep. (2023) 11:e15734. doi: 10.14814/phy2.15734
49. Seiler SE, Koves TR, Gooding JR, Wong KE, Stevens RD, Ilkayeva OR, et al. Carnitine acetyltransferase mitigates metabolic inertia and muscle fatigue during exercise. Cell Metab. (2015) 22:65–76. doi: 10.1016/j.cmet.2015.06.003
50. Greenhaff PL, Campbell-O’Sullivan SP, Constantin-Teodosiu D, Poucher SM, Roberts PA, and Timmons JA. An acetyl group deficit limits mitochondrial ATP production at the onset of exercise. Biochem Soc Trans. (2002) 30:275–80. doi: 10.1042/bst0300275
51. Petersen KF, Befroy D, Dufour S, Dziura J, Ariyan C, Rothman DL, et al. Mitochondrial dysfunction in the elderly: possible role in insulin resistance. Science. (2003) 300:1140–2. doi: 10.1126/science.1082889
52. Kemp GJ and Brindle KM. What do magnetic resonance-based measurements of Pi→ATP flux tell us about skeletal muscle metabolism? Diabetes. (2012) 61:1927–34. doi: 10.2337/db11-1725
53. From AH and Ugurbil K. Standard magnetic resonance-based measurements of the Pi→ATP rate do not index the rate of oxidative phosphorylation in cardiac and skeletal muscles. Am J Physiol Cell Physiol. (2011) 301:C1–11. doi: 10.1152/ajpcell.00345.2010
54. Schmid AI, Schrauwen-Hinderling VB, Andreas M, Wolzt M, Moser E, and Roden M. Comparison of measuring energy metabolism by different (31) P-magnetic resonance spectroscopy techniques in resting, ischemic, and exercising muscle. Magn Reson Med. (2012) 67:898–905. doi: 10.1002/mrm.23095
55. van den Broek NM, Ciapaite J, Nicolay K, and Prompers JJ. Comparison of in vivo postexercise phosphocreatine recovery and resting ATP synthesis flux for the assessment of skeletal muscle mitochondrial function. Am J Physiol Cell Physiol. (2010) 299:C1136–1143. doi: 10.1152/ajpcell.00200.2010
56. Befroy DE, Perry RJ, Jain N, Dufour S, Cline GW, Trimmer JK, et al. Direct assessment of hepatic mitochondrial oxidative and anaplerotic fluxes in humans using dynamic 13C magnetic resonance spectroscopy. Nat Med. (2014) 20:98–102. doi: 10.1038/nm.3415
57. Cantó C, Menzies KJ, and Auwerx J. NAD(+) metabolism and the control of energy homeostasis: A balancing act between mitochondria and the nucleus. Cell Metab. (2015) 22:31–53. doi: 10.1016/j.cmet.2015.05.023
58. Mevenkamp J, Bruls YMH, Mancilla R, Grevendonk L, Wildberger JE, Brouwers K, et al. Development of a (31)P magnetic resonance spectroscopy technique to quantify NADH and NAD(+) at 3 T. Nat Commun. (2024) 15:9159. doi: 10.1038/s41467-024-53292-4
59. Koves TR, Ussher JR, Noland RC, Slentz D, Mosedale M, Ilkayeva O, et al. Mitochondrial overload and incomplete fatty acid oxidation contribute to skeletal muscle insulin resistance. Cell Metab. (2008) 7:45–56. doi: 10.1016/j.cmet.2007.10.013
60. Muoio DM, Noland RC, Kovalik JP, Seiler SE, Davies MN, DeBalsi KL, et al. Muscle-specific deletion of carnitine acetyltransferase compromises glucose tolerance and metabolic flexibility. Cell Metab. (2012) 15:764–77. doi: 10.1016/j.cmet.2012.04.005
61. Lindeboom L, Nabuurs CI, Hoeks J, Brouwers B, Phielix E, Kooi ME, et al. Long-echo time MR spectroscopy for skeletal muscle acetylcarnitine detection. J Clin Invest. (2014) 124:4915–25. doi: 10.1172/JCI74830
62. Lindeboom L, Bruls YM, van Ewijk PA, Hesselink MK, Wildberger JE, Schrauwen P, et al. Longitudinal relaxation time editing for acetylcarnitine detection with (1) H-MRS. Magn Reson Med. (2017) 77:505–10. doi: 10.1002/mrm.26149
63. Klepochová R, Leutner M, Bastian M, Krebs M, Weber M, Trattnig S, et al. Muscle-specific relation of acetylcarnitine and intramyocellular lipids to chronic hyperglycemia: A pilot 3-T (1)H MRS study. Obes (Silver Spring). (2020) 28:1405–11. doi: 10.1002/oby.22846
64. Klepochová R, Valkovič L, Gajdošík M, Hochwartner T, Tschan H, Krebs M, et al. Detection and alterations of acetylcarnitine in human skeletal muscles by 1H MRS at 7 T. Invest Radiol. (2017) 52:412–8. doi: 10.1097/RLI.0000000000000355
65. Poli S, Emara AF, Lange NF, Ballabani E, Buser A, Schiavon M, et al. Interleaved trinuclear MRS for single-session investigation of carbohydrate and lipid metabolism in human liver at 7T. NMR Biomedicine. (2024) 37:e5123. doi: 10.1002/nbm.5123
66. Andronesi OC, Bhattacharyya PK, Bogner W, Choi IY, Hess AT, Lee P, et al. Motion correction methods for MRS: experts’ consensus recommendations. NMR BioMed. (2021) 34:e4364. doi: 10.1002/nbm.4364
67. Schär M, Kozerke S, and Boesiger P. Navigator gating and volume tracking for double-triggered cardiac proton spectroscopy at 3 Tesla. Magn Reson Med. (2004) 51:1091–5. doi: 10.1002/mrm.20123
68. Gabr RE, Sathyanarayana S, Schär M, Weiss RG, and Bottomley PA. On restoring motion-induced signal loss in single-voxel magnetic resonance spectra. Magn Reson Med. (2006) 56:754–60. doi: 10.1002/mrm.21015
Keywords: magnetic resonance spectroscopy, metabolic health, diabetes, lipid metabolism, glycogen, mitochondrial function
Citation: Kupriyanova Y and Schrauwen-Hinderling V (2025) Advances in in vivo magnetic resonance spectroscopy for metabolic disorders. Front. Endocrinol. 16:1578333. doi: 10.3389/fendo.2025.1578333
Received: 17 February 2025; Accepted: 01 July 2025;
Published: 18 July 2025.
Edited by:
Claire Joanne Stocker, Aston University, United KingdomReviewed by:
Alison Sleigh, University of Cambridge, United KingdomDinesh Kumar Deelchand, University of Minnesota Twin Cities, United States
Copyright © 2025 Kupriyanova and Schrauwen-Hinderling. This is an open-access article distributed under the terms of the Creative Commons Attribution License (CC BY). The use, distribution or reproduction in other forums is permitted, provided the original author(s) and the copyright owner(s) are credited and that the original publication in this journal is cited, in accordance with accepted academic practice. No use, distribution or reproduction is permitted which does not comply with these terms.
*Correspondence: Vera Schrauwen-Hinderling, dmVyYS5zY2hyYXV3ZW4taGluZGVybGluZ0BkZHouZGU=