 Yangang Xue1
 Muhammad Mohsin
 Farhad Taghizadeh-Hesary
 Nadeem Iqbal
- 1School of Electrical Engineering, Lanzhou Institute of Technology, Lanzhou, China
- 2School of Finance and Economics, Jiangsu University, Zhenjiang, China
- 3Social Science Research Institute, Tokai University, Hiratsuka-shi, Japan
- 4Air University School of Management, Air University, Islamabad, Pakistan
This study evaluates the role of information in the environmental performance index (EPI) in different energy-consuming sectors in Pakistan through a novel slack-based data envelopment analysis (DEA). The index combines energy consumption as the primary input and gross domestic product (GDP) as the desirable output and CO2 emissions as the undesirable output. Yale’s EPI measures the efficiency of the sectoral level environmental performance of primary energy consumption in the country. Performance analysis was conducted from 2009 to 2018. The sectors were assigned scores between one and zero, with zero indicating maximum decision-making unit (DMU) inefficiency and one indicating maximum DMU efficiency. Despite being in the top-performing sector, agriculture scored only 0.51 in 2018, and the electricity sector obtained 0.412. Results also show that even the best-performing sector operates below the efficiency level. The mining and quarrying sector ranked second by obtaining 0.623 EPI and 0.035 SBEPI. Results also show that much of the energy supply of Pakistan (60.17%) is focused on fossil fuels, supplemented by hydropower (33%), while nuclear, wind, biogas, and solar power account for 5.15%, 0.47%, 0.32%, and 0.03%, respectively. Nonetheless, the overall results for both measures remained reasonably consistent. According to the literature and the energy crisis and climate instability dilemma, the authors conclude that changes to a diverse green power network are a possibility and an imminent need. Similarly, the government should penalize companies with poor performance. Furthermore, to ensure the capacity development and stability of environmental management and associated actions in the country, providing access to knowledge and training to groom human resources and achieve the highest performance is crucial.
Introduction
In the late 1960s, the Environmental Impact Assessment (EIA) methodology was developed. It has now been widely accepted and enacted in over 100 nations across the globe. According to Mohsin et al. (2019c), the purpose of an EIA is to identify possible environmental effects of activities and evaluate various alternatives before deciding whether to approve or reject a proposed development. The EIA system is based on fundamental environmental protection and development concepts, and it represents common responses to similar problems (Hou et al., 2019). Although EIA is also founded on the same set of principles in developing nations, its implementation often falls short of international standards (Iqbal et al., 2020). The creation of EIA in developing nations has frequently been a consequence of a catastrophe or financial needs from foreign donor organizations, according to previous experience. According to Sun et al. (2020b), many developing nations adopted Western EIA methods without considering local politics and context. Figure 1 represents the crude, gas, and coal production in Pakistan.
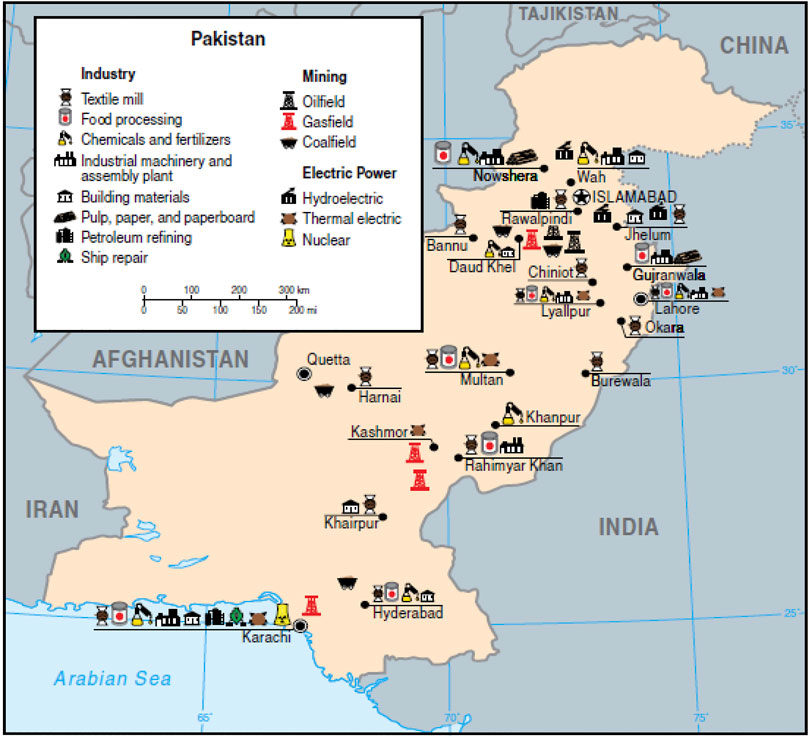
FIGURE 1. Crude, gas, and coal production of Pakistan.
Enablers such as EIA system evaluation, training, and capacity development are among the foundational steps to enhance the performance of the EIA system. The EMA established the Sustainable Advisory Committee in Namibia to offer recommendations on policy changes. In 2018, the government held a series of stakeholder meetings to discuss changes to the EMA and regulations. According to a DEA official, the consultations’ feedback was effectively integrated; nevertheless, cabinet approval is required before the revised law can be gazetted and implemented.
The environmental performance index (EPI) is an approach to quantify and express environmental performance numerically. The pilot EPI introduced this index, which was published in 2002. The EPI was promoted by the environmental sustainability index (ESI) developed by Yale University. Hence, it is known as Yale’s EPI (YEPI). This is used as a benchmark index by policymakers, environmental scientists, advocates, and the general public. YEPI measures the ecological execution depending on 24 pointers, which can be applied to assess natural well-being and biological systems. The low ranking of Pakistan, almost at the base, shows the nation’s weak strategy implementation of decoupling greenhouse gas (GHG) emissions from monetary exercises, thus failing to protect the atmosphere and environment, and improve air quality. The scorecard of YEPI provides a significant check of ecological execution on a national scale. Nonetheless, it did not delve into the sectors. In contrast, a sectoral ecological effectiveness investigation reveals a few aspects that YEPI cannot detect because it is a national-level measure. Hence, YEPI alone is not a sufficient measure for effective natural policymaking. Similarly, an increasingly thorough examination is required, which can help refine ecological arrangements and understand the determinants of sectoral environmental advancements (Mohsin et al., 2018; Mohsin et al., 2020b; Mohsin et al., 2021). This paper examines the responsibility of Pakistan by assessing the ecological yield of the country on six crucial monetary fields: agriculture, manufacturing, fuel, transport, mining and quarrying, and construction. An increase in the population of Pakistan and the development of its economy has increased the environmental pressure on Earth (Zhang et al., 2018). For example, the creation of merchandise and ventures into different financial fields require vitality and materials—water, minerals, metals, food, and fiber—which are all obtained from nature. Figure 2 illustrates the transportation network in Pakistan. In Pakistan, the vast majority of expended vitality is from petroleum derivatives, such as oil and gas (Shah et al., 2018). Subsequently, expanded vitality utilization heightens ozone-depleting substances (i.e., GHGs, mainly CO2). It is evident that an expansion in monetary exercises resembles a “two-edged sword.” The development of the economy can raise the quality of life but can also harm the Earth (Shah et al., 2019a). Nevertheless, financial development and maintainable advancement are predictable, for the most part, through elective vitality utilization, improved mechanical effectiveness, institutional advancement, and changes in population rate (Fankhauser and Jotzo, 2018).
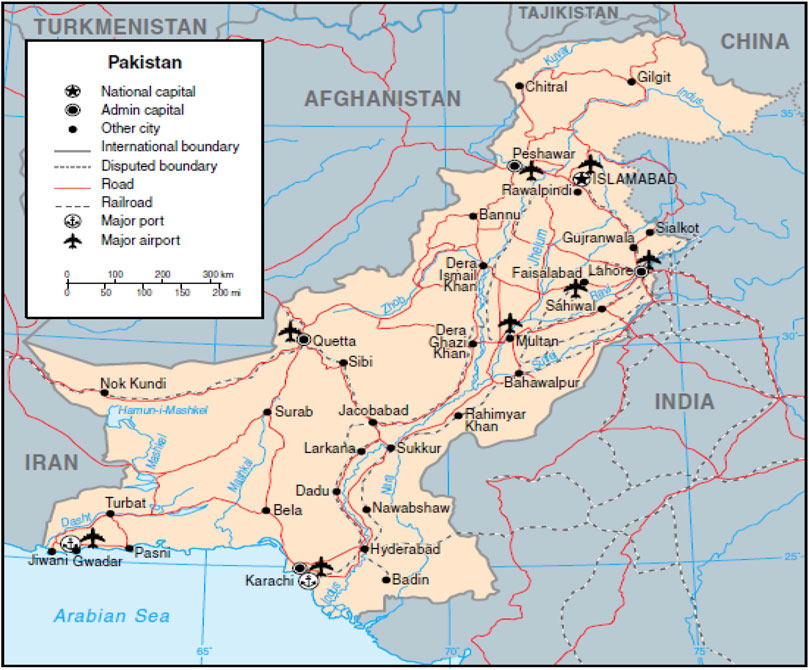
FIGURE 2. Transportation network in Pakistan.
In Pakistan, energy policies and planning are mostly ad hoc, created in reaction to crises and requirements of certain subsectors (Sun et al., 2020a). Plans related to electricity, oil, gas, coal, and renewable and nuclear energy are generally developed separately (Malik et al., 2020). The first energy strategies for the oil, gas, and coal sectors were established in 1991, with the aim to use national fuel resources with an emphasis on exploration, production, and investment (Malik et al., 2020). On the one hand, Pakistan remains reliant on oil imports (He et al., 2020). The government utilizes indigenous natural gas in the electricity and transportation sectors to maintain low prices, resulting in the fast depletion of gas reserves (Raza et al., 2021).
On the other hand, the electricity sector of the country has received the most significant attention, and a range of policies has been adopted over the years. The Pakistan Atomic Energy Commission (PAEC) is responsible for nuclear power plant design, building, and maintenance of nuclear power production. The PAEC provides the Pakistani government with administrative and technical assistance to guarantee the safe use of nuclear energy sources (Yasmin et al., 2020). In recent years, drought, heavy rainfall, floods, pollution, and other climate change indicators have hit Pakistani cities, particularly in Lahore (Tiep, et al., 2021). Floods in the country affected 20 million people in 2010 and 2011.
Consequently, the government adopted the National Climate Change Policy in 2012 and created the Ministry of Climate Change (Iqbal et al., 2021a). The concept of supportable improvement has drawn attention from scientists, experts, and policymakers (Mohsin et al., 2019b; Mohsin et al., 2020a; Mohsin et al., 2021). It has been perceived as the focal answer to offset financial improvement through ecological assurance and environmental change relief (Emas, 2015). The factors crucial for policymaking regarding feasible advancement include careful and suitable assessment of every natural execution of the industry (Mohsin et al., 2020b; He et al., 2020; Yang et al., 2021). Correspondingly, the appraisal of natural execution has received one of the critical issues applicable for the appropriate outcome of events. There is a limited investigation concerning the ecological disorder at the sectoral level in Pakistan. Figure 3 shows authors research design. The absence of such an investigation makes our examination all the more significant, with a special focus on the natural proficiency of the major monetary areas of the country. The motivation for this study is to formulate a methodology that could provide adequate data for cutting-edge investigation into natural execution. The correlation analysis from the existing literature demonstrates various procedures for formulating an EPI, such as a methodology for natural bookkeeping, life cycle examination, and creation hypothesis (Wang et al., 2018). In production theory, the production process is supposed to generate useful outputs as well as pollutants (i.e., wrong outputs) (Faere et al., 1989). In particular, technologies to filter out pollutants are recommended for analyzing useful and harmful outputs in environmental performance evaluation. A directive range factor or Shephard range factor may be used to consider the potential output based on the description of production technology. Further, specific parametric approaches can be used in the distance model, such as stochastic Frontier research (Taghizadeh-Hesary and Yoshino, 2016).
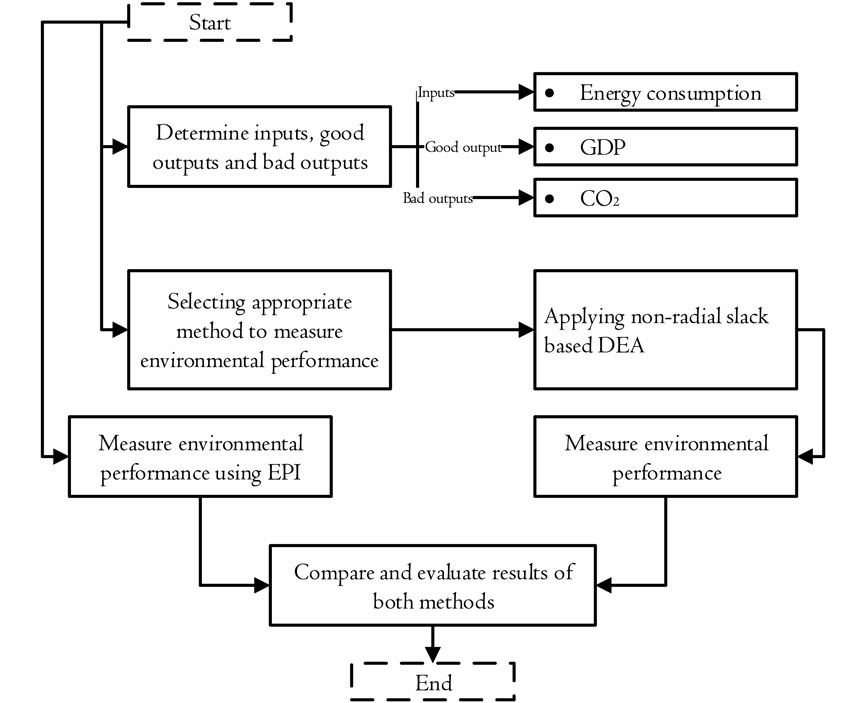
FIGURE 3. Research design (source: authors’ depiction).
Most related studies employed the non-parameter approach, that is, reviewing the data envelopment (Ikram et al., 2019a; Shah et al., 2019b). The data envelopment analysis (DEA) is a model that constructs the processing system as a linear piece-wise mixture of inputs, positive outputs, and weak outputs. In these instances, as linearity is built inside the DEA system, Färe et al. (2004) claimed low disposability reference technology as environmental DEA technology. The DEA is commonly used to measure the relative efficiency of a set of decision-making units (DMUs) with multiple inputs and outputs, as suggested by Charnes et al. (1978). They present numerous guidelines for the DEA and analytical studies. Baležentis et al. (2016) used the DEA to measure Lithuania’s economic sectors in the Hicks–Moorsteen indices’ spirits (Tiep et al., 2021).
Other experiments used the DEA to calculate eco-efficiency. For example, Ikram et al. (2019a) and Shah et al. (2019a) suggested that the DEA approach used over 700 research studies based on environmental performance evaluation. Most DEA based on environmental performance evaluation models predicts relative improvements in positive outputs and declines in negative or weak outputs (or inputs). This indicates that such studies do not account for slack in inputs and outputs while evaluating environmental performance. Although such models have some desirable theoretical properties, the environmental performance scores of many comparable entities can be 1. Hence, making a detailed comparison is challenging. However, according to the DEA, even if a DMU obtains an efficiency score of 1, it may still not be fully efficient due to the misutilization of inputs or the old production system. Therefore, including output shortfalls and input excesses in the objective function of the study is crucial. Figure 4 explains description of ecological data envelopment analysis (DEA) outcomes. The contribution of this study is that the model focuses on the DEA when environmental efficiency is calculated. Accordingly, this study used the slack-based DEA approach, which was suggested by Zhou et al. (2018), to evaluate environmental efficacy for different economic sectors. Additionally, we assess the sector-level EPI.
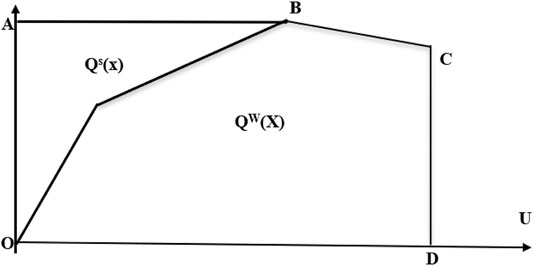
FIGURE 4. Description of ecological data envelopment analysis (DEA) outcomes (source: authors’ depiction).
The remainder of this paper is organized as follows. The Background of the key economic sectors of Pakistan section provides the background of the key economic sectors of Pakistan. The Research design section presents the research methodology developed for sectoral environmental performance analysis. The Results and discussion section presents the results and a discussion of the results. Finally, the Discussion section provides the conclusion.
Background of the key economic sectors of Pakistan
Pakistan is a leading country in southwestern Asia to connect the other states of the region. It is bordered by China on the northwest, India on the east, Iran on the southwest, and Afghanistan on the northwest. The nation has the 6th largest population in the world, which is about 226 million. The economy of Pakistan is the 23rd largest economy on the planet in terms of market proportion. However, it ranks 46th globally in terms of nominal gross domestic product (GDP). Significant sectors that help the economy of the country are farming, production, power, transportation, mining, quarrying, and manufacturing. Farming is the foundation of the economy of Pakistan. The majority of the population of the country depends on this farming and industry, which contributed 22.69% and 17.69%, respectively, to the GDP in 2020 and accounted for 42.3% and 25.79% of the workforce. The farming sector supplies essential raw materials to the modern industries of the nation and supports a rapidly increasing population (Baloch et al., 2020; Sun et al., 2020c). Additionally, it significantly contributes to the trade revenue of the country through exports. The main crops include maize, corn, cotton, sugarcane, grapes, and vegetables. Figure 5 represent gross domestic product (GDP) from 2000 to 2018. According to UNFAO, Pakistan is the World’s 13th largest increasing agricultural products producer among rice, cotton, maize, sugar cane, and fruit producers (Ikram et al., 2019a; Ikram et al., 2019b; Sun et al., 2019). Additionally, approximately one-fourth of the land in Pakistan is arable.
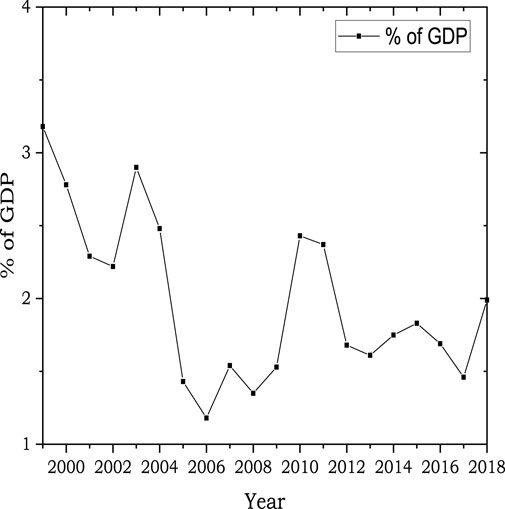
FIGURE 5. Gross domestic product (GDP) from 2000 to 2018.
Despite a large number of obstacles, the economy of Pakistan has steadily improved. Various strategies and policies have resulted in inclusive and sustainable development paths. The country started implementing stabilization policies after the 2017–2018 crisis, which helped its economy recover from macroeconomic imbalances. However, COVID-19 slowed the recovery pace that had been achieved previously. The arrival of the second and third waves brought significant challenges that were addressed by timely cautious policies. Although pandemics such as COVID-19 occur only once in a lifetime, they cause significant devastation worldwide.
The government has formulated several significant policies, taken monetary and fiscal measures, implemented smart lockdowns, and hastened to vaccinate its citizens. The National Command and Operating Centre was tasked with making important decisions with the cooperation of provinces as a unified entity. Due to the prompt decision-making of the government, the situation has stabilized, and the number of COVID-19 cases is now decreasing daily. Before COVID-19 pandemic, the working population was 55.74 million, which fell to 35.04 million due to the pandemic. This indicates that individuals have either lost their employment, or are unable to work due to COVID crises. Because of the wise decisions of the government, the working population in October 2020 increased to 52.56 million, and the economy recovered in a V-shaped pattern. Internal and external stability has not been jeopardized in the present economic recovery. Figure 6 shows slack-based environmental performance index. Manufacturing has shown impressive development, with major large-scale manufacturing (LSM) sectors, such as textiles, foods and beverages, tobacco, non-metallic mineral products, and automobiles, all showing considerable progress. Table 1 states growth rates percentage of descriptive statistics indicators. Since FY2007, the first 9 months of FY2021 showed the greatest period-wise increase of 8.99%.
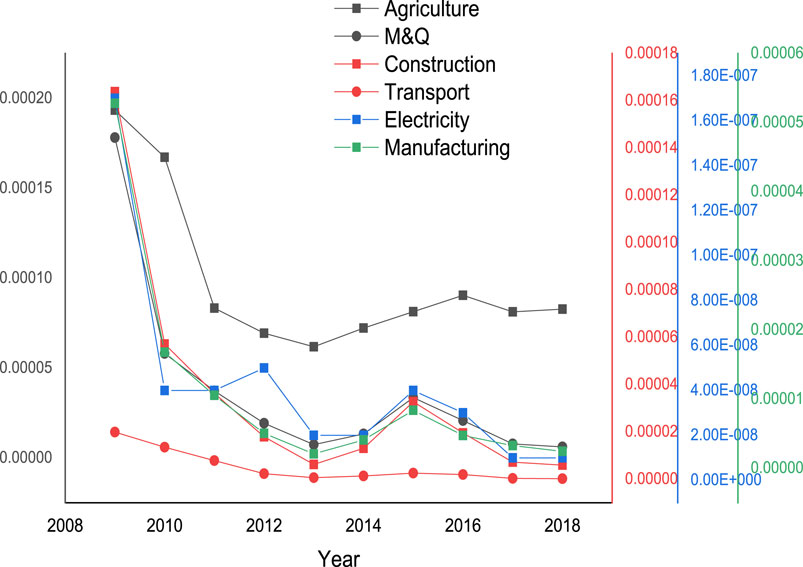
FIGURE 6. Slack-based environmental performance index.
Figure 7 shows the rankings of all sectors under both measures in 2018. The best performing sectors achieved the EPI and SBEPI values of 0.669 and 0.051, respectively. This implies that even the best-performing sector operates below the efficiency level. For the first time in 17 years, the current account of the country recorded a US$ 0.8 billion surpluses from July to April of FY2021. Foreign currency inflows via the Roshan Digital Account surpassed $1 billion. Remittances of workers increased by 29% from July to April of FY2021, reaching $24.2 billion, which is a high record.
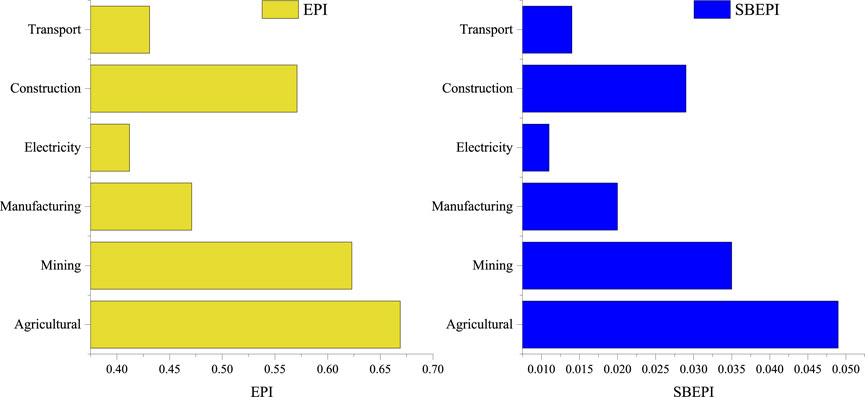
FIGURE 7. Environmental performance index (EPI) and SBEPI ranking of sectors in 2018.
Manufacturing sector
Pakistan, which had practically no large-scale producing units at the time of autonomy in 1947, presently has an appropriate and broad assembling base. The assembling area represented 17% of the total GDP in 2018 and utilized 55.88 million individuals. Figure 8 shows Electricity production of several years. The cotton material creation and apparel industry is by far the biggest assembling industry in the country, representing 66% of all essential goods and almost 40% of the manpower in the assembling segment in 2018 (Wadho et al., 2019; Baloch et al., 2020). Table 3 shows built power production in MW and electrical power in GWh by form.
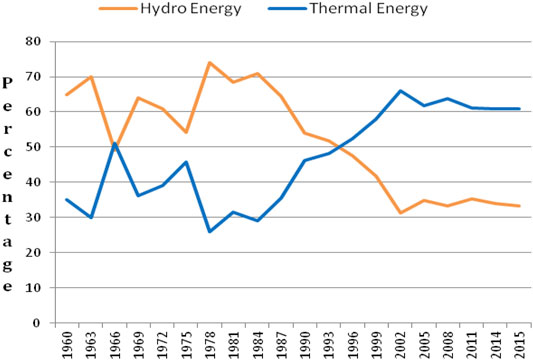
FIGURE 8. Electricity production.
Power sector
The increasing electricity demand is a concern in the power sector of Pakistan. The current demand and supply gap is 3–5 GW, which has resulted in 2.5% GDP loss and unemployment of more than half a million people in industrial sectors as scores of industries have been shut down due to power shortage (Xu et al., 2019). Table 4 explains the display transmission and dispatch (T&D) failures in percentage GWh of overall power generated in Pakistan. The country produces 60.16% of the total electricity from fossil fuels, and 72% are imported. It has been pointed out that heavy reliance on fossil fuels is the primary reason for power supply failure in Pakistan. Imported fuels are costly; therefore, payments to oil and gas suppliers are often delayed, leading to halting supply (Shah et al., 2019b). In addition to reliance on fossil fuels, the other primary reason for the inadequate supply is the transmission and dispatch (T&D) network (Chandio et al., 2020b; Sun et al., 2020b). Due to poor T&D, electricity losses were calculated to be 20% in 2016–2017. The T&D losses have remained consistent, and no improvement can be observed during these years. The electricity demand in 2016–2017 was higher than 25,000 MW. However, only 12,500 MW could be transmitted, resulting in a massive shortage of electricity; thus, the capability of the T&D network was questioned. As a result, electricity breakdowns are frequent during the summers because the grid cannot manage the maximum electricity supply by distribution companies (NEPRA, 2018).
Mining and quarrying sector
In Pakistan, valuable reserves are carbon, precious stones, chromium, zinc, copper, salt stone, mineral ores, acrylic, granite, blast furnace slag, and silica. The country also mines a variety of precious stones, such as ruby, emerald, and topaz. The Khewra salt mine in Punjab province is the most significant salt deposit worldwide. Baluchistan province and parts of Sindh province have enriched oil and gas reserves. However, these deposits are yet to be fully exploited or explored. In 2006, vast deposits of copper and gold were found in the Reko Dig region of Baluchistan. These deposits contain approximately 20 million ounces of gold and 2 billion tons of copper. Reko Dig copper reserves are the seventh-largest in the world (Alemzero et al., 2020b; Sun et al., 2020b; Alemzero et al., 2020a). Pakistan specified its first national mineral policy in 1995, which led to the expansion of mining and quarrying sectors. However, a large quantity of metallic, non-metallic, and industrial rocks has not been explored, and the mineral sector contributed significantly to the GDP of the country until the introduction of the 18th Constitutional Amendment. Under this provision, provinces are extremely autonomous in finding and exploiting their mineral reserves and environmental assets. Consequently, the provinces implemented several projects on their own or cooperated with the federal government or investors to explore and develop these resources.
Transport field
Transportation is one of the leading energy-user sectors of Pakistan. This sector accounted for almost 12% of the overall energy consumption in 2017. In the form of diesel and gasoline, oil is the dominant fuel used in the transport sector, accounting for 78% of the total fuel used in this sector in 2018 (Taghizadeh-Hesary et al., 2021). The remaining 22% fuel requirement was met using compressed natural gas and electricity (HDIP, 2018). In this study, the transport sector included road transport, railways, and aviation. Figure 2 shows the transportation network across the country (Agyekum et al., 2021; Zhang et al., 2021). There is a network of major highways that connect all main cities. The major rail route of the country runs more than a thousand miles north of Karachi to Peshawar. Another primary line runs northwest from Sukkur to Quetta. Road transport is the most important in the economy of the country, accounting for 13% of Pakistan’s GDP (MoF, 2018). Transportation usage has multiplied over the past few decades. The country reported an increased number of vehicles, from 11.77 million vehicles in 2012 to 12.13 million in 2018. Currently, the transportation market is of considerable significance, primarily owing to the introduction of projects on the China Pakistan Economic Corridor (CPEC). These initiatives establish an effective transportation system connecting Pakistan with neighboring countries, including China. Figure 2 indicates that the growth of the transportation system would positively affect demand extension, flexibility of productive resources, stimulation of business, and jobs (Ahmed et al., 2019).
The construction industry performs an essential task in the socio-economic growth of the country. Subsequently, the entire industry has grown tremendously, hiring more than three million citizens. This market expanded to 9.1% in FY2017 of the preceding year and contributed 2.7% to GDP. The construction industry is huge and is closely linked to industries related to oil, accommodation, communications, automotive, public health engineering, water resources, and dam production (Iqbal et al., 2021b; Chien et al., 2021; Li et al., 2021). Furthermore, the construction industry is a major beneficiary of FDI inflows. The most recent numbers of the Pakistan State Bank show that the gross influx of the construction industry in August 2017 amounted to $35.7 million (Iqbal et al., 2021a; Zhang et al., 2021). Additionally, the government expects that the construction sector will continue to gain strength, leading to higher expenditure on civil service growth links alongside the power sector and economic development of CPEC.
Research design
Figure 3 illustrates the research design adopted in this study. The initial process included the selection of indicators (i.e., inputs, useful outputs, and wrong outputs). Indicators were selected based on the significance of indicators and data quality. Then we applied two methods, that is, 1) the Environmental Performance Index (EPI) and 2) the slack-DEA with indexing, to evaluate the difference in the environmental performance of selected economic sectors. Finally, we compared the results obtained from both methods to identify any discrimination in the results.
Methods and materials
Information entropy plays an important role in the slack-based DEA. The DEA is a non-parametric computational tool and, therefore, is used in the data collection to estimate the job or quantify the result or involving different concerns; it is not constrained by any functional form, and is useful for evaluating the DMU performance. A variety of factors have been used extensively for assessment, such as medical benchmark tests (Prior, 2006; Du et al., 2014), company supply chains, and other entities (Chu et al., 1992; Chang et al., 2014). The DEA also offers essential features for assessing ecological performance. As a result, the DEA method is apt to assess the sector-wide environmental performance of Pakistan; however, awareness of environmental DEA technologies is required before introducing the model.
Environmental data envelopment analysis technology
In DEA technology, we find a manufacturing process that produces both good and bad results simultaneously. Suppose that input values, useful outcomes, and bad outcomes are
Development theories imply that P is small and close and ensures that the ultimate input produces limited results. Moreover, P, input, and useful outcomes are easy and effective in production technologies. For example,
To establish a feature of developing technologies that generates good and bad outcomes (Zhang et al., 2021).
1) For example, for slightly reusable outcomes, if
2) There are zero-jointing excellent and bad results; for example, if
In the first statement, the positive and negative outputs are weakly discarded. This implies that, without reducing good outcomes, weak outcomes cannot be minimized. The methodological framework indicates that the manufacturing method can simply avoid removing bad outcomes. To date, P has a low disability, indicating that polluting equipment is frequently referred to as being scientifically well modeled to produce both strong and poor outputs. It is defined as follows based on the collection of outputs:
where
It can be observed that Model 3 substantiates all the properties stated above (e.g., weak disability between positive and negative results and null-jointness). Figure 4 displays the environmental DEA development production package in which three DMUs generate one positive output (y) and one weak output (u) from the same quantities of inputs (x). The three product sets are correspondingly written as A, B, and C. The environmental DEA development is denoted by the Qw (x) performance collection, and OABCD is restricted. When we provide good disposability of low outputs, Qs (x) will become the OECD region, as shown in Figure 4.
Non-radial data envelopment analysis-based climate
Standard DEA methods, such as CCR-DEA, assume that all outcomes for a given input will be maximized (Song et al., 2012). Consequently, the simple manufacturing method generates even poor outcomes as sub-products of positive outcomes, such as many contaminants (Rao et al., 2012). In comparison, better results and fewer bad outcomes should be achieved using minimal inputs (i.e., natural resources). In such situations, conventional DEA methods are not suitable for measuring ecological effectiveness, as poor results need special attention to ensure the more precise outcome of this approach. To date, many DEA methods calculate ecological efficiency by measuring poor performance into the standard DEA system. In addition to these methods, the bad performance method 4) from the DEA proposed by Tyteca (1996) is widely used. In Model 4, the subscript “0” represents the DMU being evaluated in this process. The method offers a systematic and cumulative estimation of ecological sustainability assessment (more than 0 and less than 1). In addition, the environmental factor of this method is the inverse feature of the Shephard distance in (Färe et al., 2004; Zaim, 2004).
Method 4 is beneficial, but slacks in the input and strong outcomes do not exist. That is, while the DMU runs significantly higher, the EPI value will be 1. Only a few of these two DMUs performed well below the maximum effectiveness rate in the DEA technique. Consequently, such deficiencies can be calculated and expressed in EPI (Zhou et al., 2006) using the traditional DEA slack optimization method (Cooper et al., 2007) and presented as follows:
Method 5 places several limitations on poor results. Such limitations ensure the effective use of DMU0 in a strictly ecological manner. It even functions
The slack-based EPI incorporates socio-economic inefficiencies and is also known as an integrated socio-economic performance evaluation index. The slack-based EPI is indeed a structured index because it provides a range of (0,1) and meets the “greater, stronger property.” Moreover, compared with environmental effectiveness, the discriminatory energy of the slack-based EPI is typically more important than that of Method 5. The slack-based EPI may largely represent the views of suppliers and policymakers. Processing companies with reduced socio-economic deficiencies prefer the slack-based EPI, as it penalizes suppliers with high economic deficiencies by
Therefore, we can easily obtain the slack-based EPI of DMU0 by solving 4, 6, and 7 models.
Data sources
This study chooses the six most important economic sectors: agriculture, manufacturing, fuel, transport, mining and quarrying, and construction. Three major indicators of economic and environmental performance were selected. Such input and output indicators include the widespread use of primary energy (TPES) as data, GDP as a positive output, and CO2 as an undesirable output. The units used for the data were TPES, in tons of oil; GDP, in a million Pakistani rupees; and CO2, in kg. The TPES details were managed by the Oil and Gas Regulatory Authority (OGRA), Centre for Agri-Industrial Technology (CAIT) and World’s Resource Institute and Hydrocarbon Development Institute of Pakistan are the sources of CO2 data, and the Ministry of Finance and the State Bank of Pakistan record GDP data. Initially, we also included SO2 as a lousy output in our analysis. However, owing to a lack of authenticated data, we excluded SO2 from our analysis. The data contained in our study are for 10 years, ranging from 2009 to 2019.
Results and discussion
Methods were selected based on the significance of indicators and data quality. Then, we applied two methods, and these are 1) the Environmental Performance Index (EPI) and 2) the slack-DEA with indexing, to evaluate the difference in environmental performance of the selected economic sectors.
Information entropy plays an essential role in the slack-based DEA. The DEA also offers essential features for assessing ecological performance. As a result, the DEA method is apt to assess the sector-wide environmental performance of Pakistan; however, awareness of environmental DEA technologies is required before introducing the model.
In the slack-based DEA literature, a context-dependent DEA is developed to provide finer evaluation results by examining the efficiency of DMUs in specific performance levels based upon DEA efficiency scores. The slack-based EPI may largely represent the views of suppliers and policymakers.
The circular debt of the country is continuously increasing due to the reliance on imported and costly fossil fuel energy usage. Meanwhile, fossil fuel resources are quite limited in the country. Thus, it imports most of the fossil fuels, which are quite costly and, thus, increase the burden on the economy of the country.
Input (I) and output (O) indicators
Table 1 presents illustrative figures for the growth rates of specific factors in different industries between 2009 and 2018. The average use of power in all industries, including transportation, is reduced. The agricultural sector saw the highest decrease in power consumption of 15%, while the energy sector decreased by 5%. Nevertheless, the electric services industry grew by 3% over time. The total GDP for all the industries increased. The largest GDP increase was recorded in the power industry (20%), while the mining and quarrying industry experienced a lower annual GDP increase rate. Carbon dioxide emissions displayed a massive decline in the agricultural industry (i.e., 15%)—additionally, the mining and quarrying industry record reducing CO2 emissions, with a 2% decrease. Table 1 also shows that the rest of the sectors (i.e., construction, transportation, manufacturing, and electricity) have increased the CO2 levels by 1%, 1%, 2%, and 5%, respectively.

TABLE 1. Growth rates (%) of descriptive statistics indicators.
Therefore, despite the challenge of meeting the demand for electricity and combating climate change, Pakistan undoubtedly wants to use its immense renewable energy to generate power. It has a large number of sustainable natural resources, including wind, solar, and water resources, while it is the world’s 5th highest producer of sugarcane.
According to the 2012–2013 economic survey, livestock inventory amounts to 70 million. Both cultivation and animals contain significant amounts of crop residues and animal waste that can be used as contributions to the biogas network. The current demand for electricity in the country is 25,000 MW, which could increase by 2025 to 40,000 MW. Studies indicate that Pakistan can produce 360,000 MW (Alternative Energy Development Board Pakistan) of wind power (Javed et al., 2016; Khokhar et al., 2017). The existing green energy program accounts for only 1% of the power production of the country, and the government intends to raise it by 2030 to 5%. The hostility of the Pakistani government toward the Pakistan Renewable Energy Target (RET) is quite disappointing. In the Pakistani market (MOPDR), these new technologies should grow (Ehsanullah et al., 2021; Hsu et al., 2021).
Environmental efficiency performance
Based on the data from 2009 to 2018, we first computed the environmental performance of the key sectors of Pakistan using an EPI. We obtained an environmental performance efficiency score using the slack-based EPI. Table 2 presents the results obtained using both methods. It can be observed from the table that, in contrast to the environmental efficiency of various sectors, the SBEPI has more inequality than the EPI. For example, the EPI of the agricultural and construction sectors is 1 in 2012, and the EPI of the construction and transportation sectors is 1 in 2014. In addition, the EPI of the agricultural sector in 2016 was 1. However, the non-radial SBEPI shows that no country achieved a score of 1 during the study period. In addition to having higher discriminating power, the SBEPI offers a distinct CO2 efficiency metric relative to the EPI, as it combines economic and environmental inefficiencies into a structured graph. Therefore, SBEPI scores of all sectors are much lower than EPI scores because of sectoral economic inefficiencies. Nonetheless, despite their differences, both measures provide fairly consistent rankings of sectors in terms of CO2 emissions. The Spearman’s rank correlation coefficient between the SBEPI and EPI in the 10 years was more significant than 0.9. This is because the SBEPI is derived from the EPI.

TABLE 2. EPI and SBEPI scores within 2009–2018.
The mining and quarrying sector ranked second by obtaining 0.623 EPI and 0.035 SBEPI. The construction sector had an EPI of 0.571 and SBEPI of 0.029. The manufacturing sector was fourth, with EPI and SBEPI values of 0.471 and 0.02, respectively. The transportation sector received the second last position, achieving 0.431 EPI and 0.014 SBEPI. The least efficient sector in the country was the electricity sector, which obtained 0.412 EPI and 0.011 SBEPI.
The current Pakistani government has mainly emphasized decreasing the electricity shortage and shifting transportation from oil toward renewable energy. Nevertheless, the question is as follows: How can the Pakistani government authorities use the current and conventional policies to overcome electricity shortage? The total electricity mix of Pakistan includes nearly 60% of fossil fuel energy and is part of Kessides (2013a). The circular debt of the country is continuously increasing due to the reliance on imported and costly fossil fuel energy usage. Meanwhile, fossil fuel resources are quite limited in the country. Thus, it imports most of the fossil fuels, which are quite costly and, thus, increase the burden on the economy of the country. As shown in Figure 8, much of the energy supply (60.17%) of Pakistan is focused on fossil fuels, supplemented by hydropower (33%), while nuclear, wind, biogas, and solar power account for 5.15%, 0.47%, 0.32%, and 0.03%, respectively. Approximately 3 decades ago, they controlled the electricity system. Subsequently, as shown in Figure 8, this pattern moved to thermal power generation to satisfy the rising demand (NEPRA, 2016; Zameer and Wang, 2018) and investment in the power sector (Kessides (2013b)). Table 3 shows that only after the institutional reforms did the private sector become active and contribute substantially to the scheme (NEPRA, 2016): Pakistan has decided to exploit its vast local gas reserves. Approximately 175 billion tons of lignite are present in the Thar region. The US$ 8.8 billion will be invested in coal power ventures under the China–Pakistan Economic Corridor. The first step of the project would generate 7,560 MW of gas. Construction on the site is ongoing, and a 650 MW coal-fired power plant has been supplying the national grid station since June 2019.
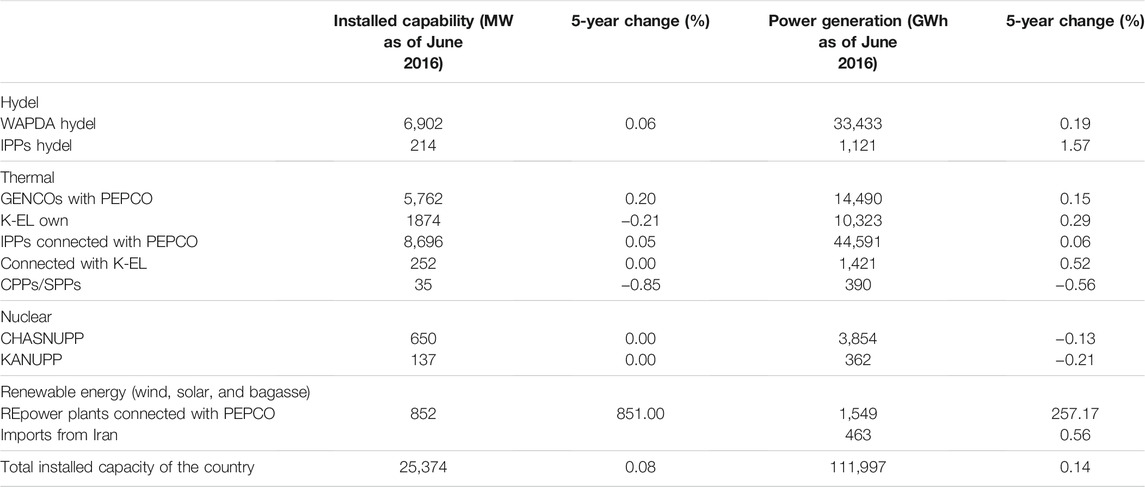
TABLE 3. Built power production in MW and electrical power in GWh by form.
Reliable and safe transmission and distribution of electricity in Pakistan are significant challenges. As shown in Table 2, due to poor infrastructure and severe power theft, transmission and distribution losses (Table 4) accounted for 20.63% in 2015–2016 (NTDC, 2016). However, compared with that in 2014–2015, all DISCO transmission and distribution losses in 2015–2016 were lower. In addition, transmitting ability poses a significant barrier to consumer control. The need for power in 2015–2016 exceeded 25,000 MW, but the transmission and distribution system was only able to provide approximately 12,500 MW (Kato et al., 2013; Shakeel et al., 2016).
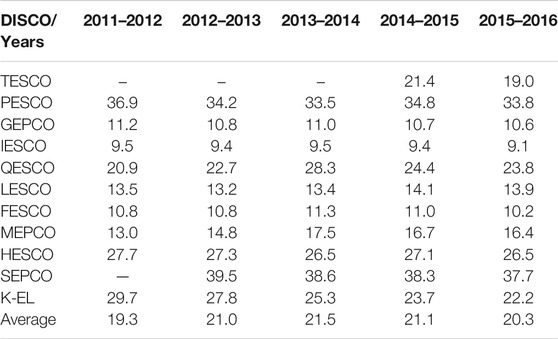
TABLE 4. Display transmission and dispatch (T&D) failures in percentage GWh of overall power generated in Pakistan (source NTDC).
Currently, 5,357 biogas plants are deployed in different sections of the world. However, to exploit this abundant renewable resource, Pakistan needs to increase biomass investment to a significant level. This will help mitigate the energy crisis and create employment opportunities with environmental benefits (Butt et al., 2013; Malik and Maqbool, 2017).
Sensitivity analysis
Sensitivity analysis examines whether the findings are affected by specific shifts in parameter weights. In seven more cases, we used the slack-based environmental efficiency index of various economic sectors in different studies in 10 years (from 2009 to 2018) to explain any effect on the outcome. Table 5 illustrates the various weights used in the seven sectors, while Figure 9 highlights the effects of these sectors. We can observe in Figure 9 that agriculture protection is the highest score of all years of research, affecting the economic system of Pakistan. Hence, it can be assumed that the findings are robust.
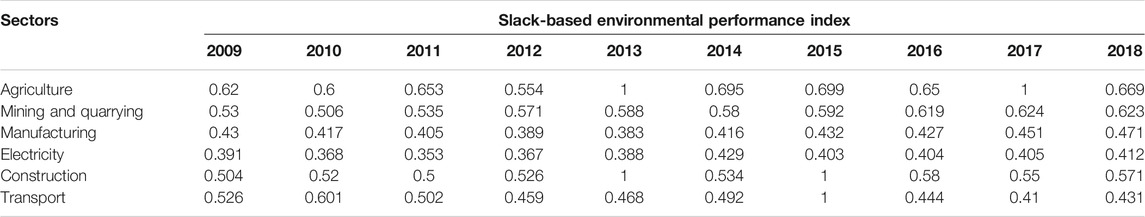
TABLE 5. Slack-based environmental performance index for different sectors in Pakistan.
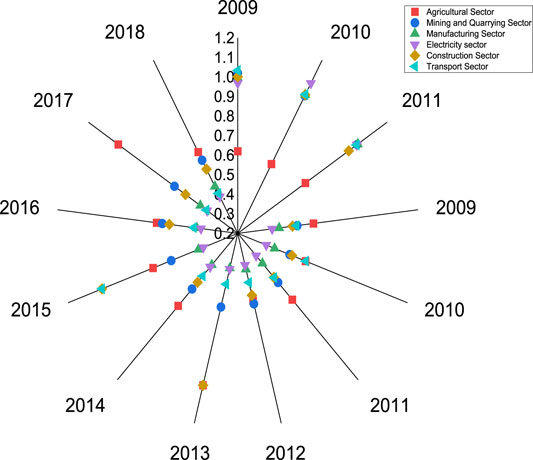
FIGURE 9. Sensitivity analysis.
Discussion
Pakistan has a strategic physical position, and its socio-economic survival is crucial to the total sustainability of its territory (Chandio et al., 2020a; He et al., 2020; Zhang et al., 2020; Yang et al., 2021). In comparison, almost 40% of the country’s population lives in extreme poverty. Thus, the country is under enormous strain to boost its socio-economic growth to enhance the quality of life of its population. However, the promotion of economic development has detrimental environmental effects. In this study, the leading six sectors, which are significant contributors to the economy of the country, are specifically selected. The economy is categorized into the input and output of the sectors. These sectors of the study were selected based on the topic’s scope and relevance in the extant literature. The location of the country indicates the geographical importance of the country worldwide. Hence, geographical location is strategically crucial in the region (Liu et al., 2020; Chien et al., 2021). Thus, financial stability and economic growth are significant concerns for the region. Pointing out that the full ecological DEA modes anticipate that the boom or lower output in ideal and unwanted performance is relative. This indicates that such modes no longer consider the lack of input and production when comparing the overall ecological performances. However, while these modes have many important theoretical features, one key drawback is that few DMUs will acquire one rating of the use of those modes, making it difficult to compare them substantially. This leads to uncertainty and doubts that even DMUs receiving performance rankings may not be working satisfactorily. Thus, featuring input and output slack will become significant to obtain additional practical performance measures. As such, this observation follows the slack-primarily-based DEA version proposed by Zhou et al. (2006) in the direction of modeling the environmental performance of the financial sectors of Pakistan. The version tests slackness and provides a better specific ability, so the performance ranking is more accurate (Mohsin et al., 2019a; Mohsin et al., 2019b; Mohsin et al., 2019c).
This report provides an integrated ecological performance review covering nearly all significant economic industries. In Pakistan, similar research has never been conducted. Consequently, not much has been done to enhance ecological efficiency, which was low, as observed in this paper. This study provides a significant contribution by presenting an environmental analysis of the major sectors, which are the engine of the economy; it ensures that these sectors are efficient, sufficient, and useful as well as being frontiers (Taghizadeh-Hesary and Yoshino, 2019; Taghizadeh-Hesary and Yoshino, 2020). The innovative contribution of the study entails that these environmental laws are well framed, but not appropriately implemented. Studies at the sectoral level are sporadic in Pakistan and express distinctions in contribution to the literature of the topic. Several scholars have endorsed this study. However, Davis and Kahn (2008) mostly preset evidence that macroeconomic vitality is trended in different countries and different periods, which has its own agitation, as in the United States in the poster situation (Asbahi et al., 2019; Anser et al., 2020; Chandio et al., 2020b; Iram et al., 2020).
Conclusion and policy implications
The environmental efficiency of the primary business fields of Pakistan, such as agriculture, production, mining and quarrying, building, electricity, and transport, have been analyzed. The analysis is conducted based on the three most relevant and significant indicators: TPES as input, GDP as sound output, and CO2 as lousy output. Two different models were used to measure the environmental performance. These models included an EPI and a non-radial SBEPI. The reason for using the SBEPI is that the conventional EPI can provide an efficiency score of 1 to many comparable DMUs. Therefore, the validity of the comparison between these DMUs is vague. The SBEPI, on the other hand, has higher discriminating power and provides a more comprehensive measure. A comparison of the results confirms that the results obtained from the SBEPI are more reliable than those obtained from the EPI. Overall, the results reveal that the environmental performance of all sectors remained poor.
This, study makes a significant contribution by analyzing the environment of the main sectors that serve as the economy’s engine, ensuring that these sectors are efficient, adequate, and helpful, as well as being frontiers. The unique contribution of the study is that environmental regulations are well drafted but ineffectively executed. In Pakistan, sectoral research is scarce, although it significantly adds to the literature on the subject. This study has received support from a number of academicians and researchers (Iqbal et al., 2020; Liu et al., 2020; Taghizadeh-Hesary et al., 2020). Meanwhile, Davis and Kahn (2008) mainly provided evidence that macroeconomic vitality has trended in different nations and times, creating an agitating situation, such as in the United States in the poster situation.
Policy implication
To improve the environmental performance, this study has provided some policy implications. First, it suggests that a government’s contribution and role are tangible in strengthening and promoting environmental performance through different means and methods that directly and indirectly positively affect the business and economic system of a country. Furthermore, the government urgently needs to utilize a rating system to incentivize and accelerate environmental performance.
Similarly, the government should punish poorly performing entities. To ensure capacity enhancement and stability of environmental management and related measures, access to information, training of human resources, and infrastructure to enable best performance should be provided. SMEs can undertake such initiatives in a country. Note that progress does not occur overnight but goes through several phases of development to appear as visible progress. Hence, improving environmental performance is a long journey to achievement. However, consistent command and control are required to ensure gradual progress. All necessary steps must be taken, and all required milestones should be followed to avoid procrastination and unnecessary delays in implementation. The approach to measuring ecological quality will play a critical role in determining whether an organization is on the right track to meet the goal. The strategy of using fossil fuels to produce energy in Pakistan has not been successful as a means of resolving power shortages; therefore, it is unlikely that using the same method would yield significant results. The other significant reason not to rely on traditional energy is that Pakistan is ranked among the world’s top 10 climatically endangered countries. Thus, Pakistan should shift to renewable resources that abound in it.
• First, the study indicates that the participation and function of the government in improving and boosting environmental performance are tangible by using various methods and techniques that directly and indirectly impact the business and economic system of the country.
• The government must immediately implement a grading system to encourage and expedite environmental performance.
• Providing access to knowledge and training to groom human resources and allow the highest performance is critical to ensuring environmental management’s capacity development and stability, and associated actions.
• To prevent procrastination and unnecessary delays in execution, all essential measures must be implemented, and all guidelines must be followed.
Data Availability Statement
The original contributions presented in the study are included in the article/Supplementary Material. Further inquiries can be directed to the corresponding authors.
Author Contributions
The conceptualization, methodology, and writing of the original draft were performed by YX and MM. The data curation was performed by MM. The formal analysis and software were handled by MM and NI. NI was in charge of the project administration. FT-H investigated and validated the study. NI and FT-H reviewed, edited, and wrote the manuscript.
Funding
The research was funded by the Sichuan Social Science Foundation of China (Grant No: 21GL223), the National Natural Science Foundation of China (Grant No: 51769012), and the Grant-in-Aid for the Excellent Young Researcher of the Ministry of Education, Culture, Sports, Science and Technology of Japan (MEXT).
Conflict of Interest
The authors declare that the research was conducted in the absence of any commercial or financial relationships that could be construed as a potential conflict of interest.
Publisher’s Note
All claims expressed in this article are solely those of the authors and do not necessarily represent those of their affiliated organizations, or those of the publisher, the editors, and the reviewers. Any product that may be evaluated in this article, or claim that may be made by its manufacturer, is not guaranteed or endorsed by the publisher.
Acknowledgments
The authors appreciate the valuable comments of the reviewers.
References
Agyekum, E. B., Amjad, F., Mohsin, M., and Ansah, M. N. S. (2021). A Bird's Eye View of Ghana's Renewable Energy Sector Environment: A Multi-Criteria Decision-Making Approach. Utilities Policy 70, 101219. doi:10.1016/j.jup.2021.101219
Ahmed, S. u., Ali, A., Kumar, D., Malik, M. Z., and Memon, A. H. (2019). China Pakistan Economic Corridor and Pakistan's Energy Security: A Meta-Analytic Review. Energy Policy 127, 147–154. doi:10.1016/j.enpol.2018.12.003
Alemzero, D. A., Iqbal, N., Iqbal, S., Mohsin, M., Chukwuma, N. J., and Shah, B. A. (2020a). Assessing the Perceived Impact of Exploration and Production of Hydrocarbons on Households Perspective of Environmental Regulation in Ghana. Environ. Sci. Pollut. Res. 28, 5359–5371. doi:10.1007/s11356-020-10880-3
Alemzero, D. A., Sun, H., Mohsin, M., Iqbal, N., Nadeem, M., and Vo, X. V. (2020b). Assessing Energy Security in Africa Based on Multi-Dimensional Approach of Principal Composite Analysis. Environ. Sci. Pollut. Res. 28, 2158–2171. doi:10.1007/s11356-020-10554-0
Anser, M. K., Mohsin, M., Abbas, Q., and Chaudhry, I. S. (2020). Assessing the Integration of Solar Power Projects: SWOT-Based AHP-F-TOPSIS Case Study of Turkey. Environ. Sci. Pollut. Res. 27 (25), 31737–31749. doi:10.1007/s11356-020-09092-6
Asbahi, A. A. M. H. A., Gang, F. Z., Iqbal, W., Abass, Q., Mohsin, M., and Iram, R. (2019). Novel Approach of Principal Component Analysis Method to Assess the National Energy Performance via Energy Trilemma Index. Energ. Rep. 5, 704–713. doi:10.1016/j.egyr.2019.06.009
Baleentis, T., Li, T., Streimikiene, D., and Baleentis, A. (2016). Is the Lithuanian Economy Approaching the Goals of Sustainable Energy and Climate Change Mitigation? Evidence from DEA-Based Environmental Performance Index. J. Clean. Prod. 116, 23–31.
Baloch, Z. A., Tan, Q., Iqbal, N., Mohsin, M., Abbas, Q., Iqbal, W., et al. (2020). Trilemma Assessment of Energy Intensity, Efficiency, and Environmental index: Evidence from BRICS Countries. Environ. Sci. Pollut. Res. 27 (27), 34337–34347. doi:10.1007/s11356-020-09578-3
Butt, S., Hartmann, I., and Lenz, V. (2013). Bioenergy Potential and Consumption in Pakistan. Biomass Bioenergy 58, 379–389. doi:10.1016/j.biombioe.2013.08.009
Chandio, A. A., Jiang, Y., Abbas, Q., Amin, A., and Mohsin, M. (2020a). Does Financial Development Enhance Agricultural Production in the Long‐run? Evidence from China. J. Public Aff., e2342.
Chandio, A. A., Jiang, Y., Rehman, A., Twumasi, M. A., Pathan, A. G., and Mohsin, M. (2020b). Determinants of Demand for Credit by Smallholder Farmers': a Farm Level Analysis Based on Survey in Sindh, Pakistan. J. Asia Bus. Stud.. doi:10.1108/jabes-01-2020-0004
Chang, Y.-T., Park, H.-s., Jeong, J.-b., and Lee, J.-w. (2014). Evaluating Economic and Environmental Efficiency of Global Airlines: A SBM-DEA Approach. Transport. Res. D Transport. Environ. 27, 46–50. doi:10.1016/j.trd.2013.12.013
Charnes, A., Cooper, W. W., and Rhodes, E. (1978). Measuring the Efficiency of Decision Making Units. Eur. J. Oper. Res. 2 (6), 429–444.
Chien, F., Pantamee, A. A., Hussain, M. S., Chupradit, S., Nawaz, M. A., and Mohsin, M. (2021). Nexus between Financial Innovation and Bankruptcy: Evidence from Information, Communication and Technology (Ict) Sector. Singapore Econ. Rev., 1–22. doi:10.1142/S0217590821500181
Chu, X., Fielding, G. J., and Lamar, B. W. (1992). Measuring Transit Performance Using Data Envelopment Analysis. Transport. Res. A: Pol. Pract. 26 (3), 223–230. doi:10.1016/0965-8564(92)90033-4
Cooper, W. W., Seiford, L. M., and Tone, K. (20072000). Data Envelopment Analysis: A Comprehensive Text with Models, Applications, References and DEA-Solver Software. Boston: Kluwer Academic Publishers.
Davis, S. J., and Kahn, J. A. (2008). Interpreting the Great Moderation: Changes in the Volatility of Economic Activity at the Macro and Micro Levels. J. Econ. Perspect. 22 (4), 155–180.
Du, J., Wang, J., Chen, Y., Chou, S.-Y., and Zhu, J. (2014). Incorporating Health Outcomes in Pennsylvania Hospital Efficiency: an Additive Super-efficiency DEA Approach. Ann. Oper. Res. 221 (1), 161–172. doi:10.1007/s10479-011-0838-y
Ehsanullah, S., Tran, Q. H., Sadiq, M., Bashir, S., Mohsin, M., and Iram, R. (2021). How Energy Insecurity Leads to Energy Poverty? Do Environmental Consideration and Climate Change Concerns Matters. Environ. Sci. Pollut. Res. 28, 55041–55052. doi:10.1007/s11356-021-14415-2
Emas, R. (2015). The Concept of Sustainable Development: Definition and Defining Principles. Brief for GSDR 1–3.
Faere, R., Grosskopf, S., Lovell, C. A. K., and Pasurka, C. (1989). Multilateral Productivity Comparisons when Some Outputs Are Undesirable: A Nonparametric Approach. Rev. Econ. Stat. 71 (1), 90. doi:10.2307/1928055
Fankhauser, S., and Jotzo, F. (2018). Economic Growth and Development with Low‐carbon Energy. Wiley Interdiscip. Rev. Clim. Change 9 (1), e495. doi:10.1002/wcc.495
Färe, R., and Primont, D. (2012). Multi-output Production and Duality: Theory and Applications. Springer Science & Business Media.
Färe, R., Grosskopf, S., and Hernandez-Sancho, F. (2004). Environmental Performance: an index Number Approach. Resource Energ. Econ. 26 (4), 343–352.
He, W., Abbas, Q., Alharthi, M., Mohsin, M., Hanif, I., Vinh Vo, X., et al. (2020). Integration of Renewable Hydrogen in Light-Duty Vehicle: Nexus between Energy Security and Low Carbon Emission Resources. Int. J. Hydrogen Energ. 45, 27958–27968. doi:10.1016/j.ijhydene.2020.06.177
Hou, Y., Iqbal, W., Muhammad Shaikh, G., Iqbal, N., Ahmad Solangi, Y., and Fatima, A. (2019). Measuring Energy Efficiency and Environmental Performance: A Case of South Asia. Processes 7, 325. doi:10.3390/pr7060325
Hsu, C.-C., Quang-Thanh, N., Chien, F., Li, L., and Mohsin, M. (2021). Evaluating green Innovation and Performance of Financial Development: Mediating Concerns of Environmental Regulation. Environ. Sci. Pollut. Res. 28, 57386–57397. doi:10.1007/s11356-021-14499-w
Ikram, M., Mahmoudi, A., Shah, S. Z. A., and Mohsin, M. (2019a). Forecasting Number of ISO 14001 Certifications of Selected Countries: Application of Even GM (1,1), DGM, and NDGM Models. Environ. Sci. Pollut. Res. 26, 12505–12521. doi:10.1007/s11356-019-04534-2
Ikram, M., Sroufe, R., Mohsin, M., Solangi, Y. A., Shah, S. Z. A., and Shahzad, F. (2019b). Does CSR Influence Firm Performance? A Longitudinal Study of SME Sectors of Pakistan. JGR 11, 27–53. doi:10.1108/jgr-12-2018-0088
Iqbal, N., Khan, A., Gill, A. S., and Abbas, Q. (2020). Nexus between Sustainable Entrepreneurship and Environmental Pollution: Evidence from Developing Economy. Environ. Sci. Pollut. Res. 27 (29), 36242–36253. doi:10.1007/s11356-020-09642-y
Iqbal, N., Sakhani, M. A., Khan, A. R., Atiq-ur-Rehman, , Ajmal, Z., and Khan, M. Z. (2021a). Socioeconomic Impacts of Domestic Biogas Plants on Rural Households to Strengthen Energy Security. Environ. Sci. Pollut. Res. 28 (21), 27446–27456. doi:10.1007/s11356-021-12633-2
Iqbal, W., Tang, Y. M., Chau, K. Y., Irfan, M., and Mohsin, M. (2021b). Nexus between Air Pollution and NCOV-2019 in China: Application of Negative Binomial Regression Analysis. Process Saf. Environ. Prot. 150, 557–565. doi:10.1016/j.psep.2021.04.039
Iram, R., Zhang, J., Erdogan, S., Abbas, Q., and Mohsin, M. (2020). Economics of Energy and Environmental Efficiency: Evidence from OECD Countries. Environ. Sci. Pollut. Res. 27 (4), 3858–3870. doi:10.1007/s11356-019-07020-x
Javed, M. S., Raza, R., Hassan, I., Saeed, R., Shaheen, N., Iqbal, J., et al. (2016). The Energy Crisis in Pakistan: A Possible Solution via Biomass-Based Waste. J. Renew. Sustain. Energy. 8 (4), 043102.
Kato, Y., Ozawa, S., Miyamoto, C., Maehata, Y., Suzuki, A., Maeda, T., et al. (2013). Acidic Extracellular Microenvironment and Cancer. Cancer Cell. Int. 13 (1), 1–8.
Kessides, I. N. (2013b). Public Capital, Growth and Welfare: Analytical Foundations for Public Policy.
Khokhar, S., Zin, A. A. M., Memon, A. P., and Mokhtar, A. S. (2017). A New Optimal Feature Selection Algorithm for Classification of Power Quality Disturbances Using Discrete Wavelet Transform and Probabilistic Neural Network. Meas. 95, 246–259.
Li, W., Chien, F., Hsu, C.-C., Zhang, Y., Nawaz, M. A., Iqbal, S., et al. (2021). Nexus between Energy Poverty and Energy Efficiency: Estimating the Long-Run Dynamics. Resour. Pol. 72, 102063. doi:10.1016/j.resourpol.2021.102063
Liu, J., Abbas, Q., Alharthi, M., Mohsin, M., Rasul, F., and Iqbal, N. (2020). Managerial Policy and Economic Analysis of Wind-Generated Renewable Hydrogen for Light-Duty Vehicles: Green Solution of Energy Crises. Environ. Sci. Pollut. Res. 28 (9), 10642–10653. doi:10.1007/s11356-020-11018-1
Malik, S. R., and Maqbool, M. A. (2017). Energy Potential of Pakistan. NFC IEFR J. Eng. Scientific Res. 1.
Malik, M. Y., Latif, K., Khan, Z., Butt, H. D., Hussain, M., and Nadeem, M. A. (2020). Symmetric and Asymmetric Impact of Oil price, FDI and Economic Growth on Carbon Emission in Pakistan: Evidence from ARDL and Non-linear ARDL Approach. Sci. Total Environ. 726, 138421. doi:10.1016/j.scitotenv.2020.138421
Mohsin, M., Zhou, P., Iqbal, N., and Shah, S. A. A. (2018). Assessing Oil Supply Security of South Asia. Energy 155, 438–447. doi:10.1016/j.energy.2018.04.116
Mohsin, M., Abbas, Q., Zhang, J., Ikram, M., and Iqbal, N. (2019a). Integrated Effect of Energy Consumption, Economic Development, and Population Growth on CO2 Based Environmental Degradation: a Case of Transport Sector. Environ. Sci. Pollut. Res. 26 (32), 32824–32835. doi:10.1007/s11356-019-06372-8
Mohsin, M., Rasheed, A. K., Sun, H., Zhang, J., Iram, R., Iqbal, N., et al. (2019b). Developing Low Carbon Economies: An Aggregated Composite index Based on Carbon Emissions. Sustain. Energ. Tech. Assessments 35, 365–374. doi:10.1016/j.seta.2019.08.003
Mohsin, M., Zhang, J., Saidur, R., Sun, H., and Sait, S. M. (2019c). Economic Assessment and Ranking of Wind Power Potential Using Fuzzy-TOPSIS Approach. Environ. Sci. Pollut. Res. 26 (22), 22494–22511. doi:10.1007/s11356-019-05564-6
Mohsin, M., Nurunnabi, M., Zhang, J., Sun, H., Iqbal, N., Iram, R., et al. (2020a). The Evaluation of Efficiency and Value Addition of IFRS Endorsement towards Earnings Timeliness Disclosure. Int. J. Fin Econ. 26, 1793–1807. doi:10.1002/ijfe.1878
Mohsin, M., Taghizadeh-Hesary, F., Panthamit, N., Anwar, S., Abbas, Q., and Vo, X. V. (2020b). Developing Low Carbon Finance Index: Evidence from Developed and Developing Economies. Finance Res. Lett. 43, 101520. doi:10.1016/j.frl.2020.101520
Mohsin, M., Hanif, I., Taghizadeh-Hesary, F., Abbas, Q., and Iqbal, W. (2021). Nexus between Energy Efficiency and Electricity Reforms: A DEA-Based Way Forward for Clean Power Development. Energy Policy 149, 112052. doi:10.1016/j.enpol.2020.112052
Prior, D. (2006). Efficiency and Total Quality Management in Health Care Organizations: A Dynamic Frontier Approach. Ann. Oper. Res. 145 (1), 281–299. doi:10.1007/s10479-006-0035-6
Rao, X., Wu, J., Zhang, Z., and Liu, B. (2012). Energy Efficiency and Energy Saving Potential in China: An Analysis Based on Slacks-Based Measure Model. Comput. Ind. Eng. 63, 578–584. doi:10.1016/j.cie.2011.08.023
Raza, M. Y., Lin, B., and Liu, X. (2021). Cleaner Production of Pakistan's Chemical Industry: Perspectives of Energy Conservation and Emissions Reduction. J. Clean. Prod. 278, 123888. doi:10.1016/j.jclepro.2020.123888
Shah, S., Valasai, G., Memon, A., Laghari, A., Jalbani, N., and Strait, J. (2018). Techno-economic Analysis of Solar PV Electricity Supply to Rural Areas of Balochistan, Pakistan. Energies 11 (7), 1777. doi:10.3390/en11071777
Shah, S. A. A., Zhou, P., Walasai, G. D., and Mohsin, M. (2019a). Energy Security and Environmental Sustainability index of South Asian Countries: A Composite index Approach. Ecol. Indicators 106 (66), 105507. doi:10.1016/j.ecolind.2019.105507
Shah, S. A. A., Solangi, Y. A., and Ikram, M. (2019b). Analysis of Barriers to the Adoption of Cleaner Energy Technologies in Pakistan Using Modified Delphi and Fuzzy Analytical Hierarchy Process. J. Clean. Prod. 235, 1037–1050. doi:10.1016/j.jclepro.2019.07.020
Shakeel, S. R., Takala, J., and Shakeel, W. (2016). Renewable Energy Sources in Power Generation in Pakistan. Renew. Sust. Energ. Rev. 64, 421–434.
Song, M., An, Q., Zhang, W., Wang, Z., and Wu, J. (2012). Environmental Efficiency Evaluation Based on Data Envelopment Analysis: A Review. Renew. Sustain. Energ. Rev. 16 (7), 4465–4469. doi:10.1016/j.rser.2012.04.052
Sun, H.-p., Tariq, G., Haris, M., and Mohsin, M. (2019). Evaluating the Environmental Effects of Economic Openness: Evidence from SAARC Countries. Environ. Sci. Pollut. Res. 26 (24), 24542–24551. doi:10.1007/s11356-019-05750-6
Sun, H., Mohsin, M., Alharthi, M., and Abbas, Q. (2020a). Measuring Environmental Sustainability Performance of South Asia. J. Clean. Prod. 251, 119519. doi:10.1016/j.jclepro.2019.119519
Sun, H., Pofoura, A. K., Adjei Mensah, I., Li, L., and Mohsin, M. (2020b). The Role of Environmental Entrepreneurship for Sustainable Development: Evidence from 35 Countries in Sub-saharan Africa. Sci. Total Environ. 741, 140132. doi:10.1016/j.scitotenv.2020.140132
Sun, L., Cao, X., Alharthi, M., Zhang, J., Taghizadeh-Hesary, F., and Mohsin, M. (2020c). Carbon Emission Transfer Strategies in Supply Chain with Lag Time of Emission Reduction Technologies and Low-Carbon Preference of Consumers. J. Clean. Prod. 264, 121664. doi:10.1016/j.jclepro.2020.121664
Taghizadeh-Hesary, F., and Yoshino, N. (2016). Macroeconomic Effects of Oil price Fluctuations on Emerging and Developed Economies in a Model Incorporating Monetary Variables, 51–75. doi:10.3280/EFE2015-002005
Taghizadeh-Hesary, F., and Yoshino, N. (2019). The Way to Induce Private Participation in green Finance and Investment. Finance Res. Lett. 31, 98–103. doi:10.1016/j.frl.2019.04.016
Taghizadeh-Hesary, F., and Yoshino, N. (2020). Sustainable Solutions for Green Financing and Investment in Renewable Energy Projects. Energies 13 (4), 788. doi:10.3390/en13040788
Taghizadeh-Hesary, F., Mortha, A., Farabi-Asl, H., Sarker, T., Chapman, A., Shigetomi, Y., et al. (2020). Role of Energy Finance in Geothermal Power Development in Japan. Int. Rev. Econ. Finance 70, 398–412. doi:10.1016/j.iref.2020.06.011
Taghizadeh-Hesary, F., Rasoulinezhad, E., Yoshino, N., Chang, Y., Taghizadeh-Hesary, F., and Morgan, P. J. (2021). The Energy-Pollution-Health Nexus: a Panel Data Analysis of Low- and Middle-Income Asian Countries. Singapore Econ. Rev. 66, 435–455. doi:10.1142/S0217590820430043
Tiep, N. C., Wang, M., Mohsin, M., Kamran, H. W., and Yazdi, F. A. (2021). An Assessment of Power Sector Reforms and Utility Performance to Strengthen Consumer Self-Confidence towards Private Investment. Econ. Anal. Pol. 69, 676–689. doi:10.1016/j.eap.2021.01.005
Tyteca, D. (1996). On the Measurement of the Environmental Performance of Firms- A Literature Review and a Productive Efficiency Perspective. J. Environ. Manage. 46 (3), 281–308. doi:10.1006/JEMA.1996.0022
Wadho, W., Goedhuys, M., and Chaudhry, A. (2019). Young Innovative Companies and Employment Creation, Evidence from the Pakistani Textiles Sector. World Develop. 117, 139–152. doi:10.1016/j.worlddev.2019.01.002
Wang, Y., Shah, S. A. A., and Zhou, P. (2018). City-level Environmental Performance in China. Energ. Ecol. Environ. 3 (3), 149–161. doi:10.1007/s40974-018-0088-9
Xu, L., Wang, Y., Solangi, Y., Zameer, H., and Shah, S. (2019). Off-Grid Solar PV Power Generation System in Sindh, Pakistan: A Techno-Economic Feasibility Analysis. Processes 7 (5), 308. doi:10.3390/pr7050308
Yang, Z., Abbas, Q., Hanif, I., Alharthi, M., Taghizadeh-Hesary, F., Aziz, B., et al. (2021). Short- and Long-Run Influence of Energy Utilization and Economic Growth on Carbon Discharge in Emerging SREB Economies. Renew. Energ. 165, 43–51. doi:10.1016/j.renene.2020.10.141
Yasmin, T., El Refae, G. A., and Eletter, S. (2020). Oil price and Urgency towards Economic Diversification through Effective Reforms and Policies in Caspian Basin. Jeecar 7, 305–315. doi:10.15549/jeecar.v7i3.326
Zaim, O. (2004). Measuring Environmental Performance of State Manufacturing through Changes in Pollution Intensities: A DEA Framework. Ecol. Econ. 48, 37–47. doi:10.1016/j.ecolecon.2003.08.003
Zameer, H., and Wang, Y. (2018). Energy Production System Optimization: Evidence from Pakistan. Renew. Sust. Energ. Rev. 82, 886–893.
Zhang, B., Wang, Z., and Wang, B. (2018). Energy Production, Economic Growth and CO 2 Emission: Evidence from Pakistan. Nat. Hazards 90 (1), 27–50. doi:10.1007/s11069-017-3031-z
Zhang, J., Alharthi, M., Abbas, Q., Li, W., Mohsin, M., Jamal, K., et al. (2020). Reassessing the Environmental Kuznets Curve in Relation to Energy Efficiency and Economic Growth. Sustainability 12, 8346. doi:10.3390/su12208346
Zhang, D., Mohsin, M., Rasheed, A. K., Chang, Y., and Taghizadeh-Hesary, F. (2021). Public Spending and green Economic Growth in BRI Region: Mediating Role of green Finance. Energy Policy 153, 112256. doi:10.1016/j.enpol.2021.112256
Zhou, P., Ang, B. W., and Poh, K. L. (2006). Slacks-based Efficiency Measures for Modeling Environmental Performance. Ecol. Econ. 60 (1), 111–118. doi:10.1016/j.ecolecon.2005.12.001
Keywords: CO2 emission, green energy, electricity, energy consuming, environmental performance index
Citation: Xue Y, Mohsin M, Taghizadeh-Hesary F and Iqbal N (2022) Environmental Performance Assessment of Energy-Consuming Sectors Through Novel Data Envelopment Analysis. Front. Energy Res. 9:713546. doi: 10.3389/fenrg.2021.713546
Received: 23 May 2021; Accepted: 23 November 2021;
Published: 14 January 2022.
Edited by:
Quande Qin, Shenzhen University, ChinaCopyright © 2022 Xue, Mohsin, Taghizadeh-Hesary and Iqbal. This is an open-access article distributed under the terms of the Creative Commons Attribution License (CC BY). The use, distribution or reproduction in other forums is permitted, provided the original author(s) and the copyright owner(s) are credited and that the original publication in this journal is cited, in accordance with accepted academic practice. No use, distribution or reproduction is permitted which does not comply with these terms.
*Correspondence: Muhammad Mohsin, m.mohsin3801@yahoo.com; Farhad Taghizadeh-Hesary, farhad@tsc.u-tokai.ac.jp