 Chenying Li1
 Ziheng Pu
- 1Electric Power Research Institute of State Grid Jiangsu Electric Power Co., Ltd., Jiangsu Nanjing, China
- 2College of Electrical Engineering and New Energy, China Three Gorges University, Hubei Yichang, China
The proportion of cable lines in the urban distribution network is increasing. The fire hazard of important cable channels is prominent, which has a serious effect on the safety and stable operation of the power system. In recent years, intelligent mobile inspection and fire extinguishing devices have been applied in tunnels. The determination of firepower and location is conducive to the rapid and effective fire suppression of intelligent devices. Therefore, this study proposes a fire early warning method of a high-voltage power cable tunnel based on abnormal characteristic quantity monitoring. Based on the modified model of complex pyrolysis and combustion chemical reaction, the fire development of different fire source powers and fire locations is simulated. The temperature distribution and characteristic gas concentration under different simulation conditions are analyzed. The results show that the monitoring data of temperature, flue gas concentration, and CO and CO2 concentration need comprehensive analysis to effectively reflect different fire conditions. The characteristic data set is selected and processed to form a total sample. The fire prediction model is trained and tested. The accuracy of the proposed prediction model is 92%.
Introduction
With the growth of power demand, more and more power cables are laid intensively in cable tunnels. The cable insulation is aging with the increase of operation time, which may lead to insulation breakdown and further fire. Power cable tunnel is located underground, with a long and narrow structure, complex environment, and inconvenient communication. In case of fire, a large amount of toxic smoke accumulates in the tunnel, making it difficult for personnel to enter and extinguish the fire through the outside. The existing high-voltage cable tunnel monitoring system is imperfect, and the information means are insufficient. Monitoring alarm and fire extinguishing devices are only set in key areas such as intermediate joints of power cable, which is still impossible to fully monitor the situation of the whole tunnel (Fang et al., 2019; An et al., 2020b; Wu et al., 2020). With the development of artificial intelligence and information communication technology, intelligent mobile monitoring and fire extinguishing devices are developed and applied in tunnels. However, in practical application, due to the failure to accurately judge the fire source, the patrol fire extinguishing device did not arrive at the fire point in time. The fire source is too large, and the fire develops rapidly. It did not extinguish the fire and caused damage to the intelligent patrol inspection and fire extinguishing device. It is necessary to predict the fire location and fire source power in combination with the monitored abnormal data.
In order to predict the fire situation combined with the monitoring data, it is necessary to analyze the development characteristics of a cable tunnel fire. Fire test is destructive and dangerous and has the disadvantages of high cost and being uncontrollable. In recent years, fire simulation research has developed rapidly, and a variety of fire conditions have been simulated and analyzed. Song et al. (2020) simulated the combustion of horizontal and triangular cables in the tunnel, respectively. The results show that the cable layout has little effect on the smoke concentration distribution and diffusion in a tunnel fire. However, horizontal cables can reduce the content of CO. Niu and Li (2012) simulated the fire process of the cable tunnel and obtained the smoke spread and section temperature change. The best fire extinguishing time is put forward, which provides a reference for formulating fire extinguishing measures and selecting a fire extinguishing system. An et al. (2020a) analyzed the influence of cable layout on fire through a cable combustion test. It shows that the fire risk and flame characteristics of the cable tunnel are affected by the distance between layers of cable support and the distance between cables on the same layer. The greater the distance between layers, the higher the flame height. The flame width decreases with increasing the distance between cables on the same layer. The influence of fire separation on the fire development of a power cable tunnel is simulated and analyzed in Zhang et al. (2018). When there is no fire separation, the smoke spreads rapidly, and the temperature of the whole tunnel increases significantly. The fire separation can effectively limit the fire smoke in the fire compartment. Different combination modes of the ventilation system, fire door, and sprinkler are compared in Mi et al. (2020). The optimal mode can effectively control the smoke propagation in the tunnel. The above studies aim mainly at medium- and low-voltage cables, and simple pyrolysis is mostly used in the simulation. A high-voltage power cable has a multi-layer structure, and its combustion effect is quite different. Appropriate simulation methods need to be proposed.
In order to deal with the fire hazards during cable tunnel operation and maintenance, a tunnel fire monitoring system is developed based on Internet of things technology (Wang et al., 2021). The test shows that the system can realize the automatic fire alarm of the power cable tunnel. Jing et al. (2019) proposed a multi-sensor network cable tunnel monitoring system, which integrates temperature, environment, security, and video monitoring. The system realizes information sharing and equipment intelligent linkage by considering the abnormal operation and maintenance requirements of a power cable tunnel. A fire early warning method based on camera monitoring image recognition is proposed by Li et al. (2021). This method first detects the flame and then analyzes the flame image based on the depth neural network of the convolutional neural network. In order to monitor the temperature state of cables in the whole tunnel, an intelligent inspection robot was developed by Qiu et al. (2018). The intelligent inspection robot can be linked with the fire-fighting equipment to improve the intelligent prevention and control level of the whole cable tunnel. The research of the cable tunnel monitoring systems continues to make breakthroughs and still has great development potential. Therefore, the key to the problem lies in how to make full use of the characteristic information contained in the monitoring data and use mathematical models and intelligent algorithms to analyze the relationship between various parameters (Shen et al., 2020; Shen et al., 2021; Shen and Raksincharoensak, 2021), through the information obtained to monitor and locate the fire in the cable tunnel, confirm the fire source information, and provide relevant information for the emergency dispatch of electric power (Yang et al., 2021a), to improve the level of fire prevention and control in cable tunnels. Emerging technologies such as artificial intelligence algorithms, especially deep learning, computer vision, and other related technologies, have developed rapidly (Yang et al., 2021b; Yang et al., 2021c; Yang et al., 2022). The above research mostly depends on image recognition. The intelligent inspection device may be far away from the fire source. Data such as temperature and flue gas are monitored first. It is necessary to analyze these data for prediction.
In this article, considering the complex structure of the high-voltage power cable, the cable combustion simulation method is proposed based on the definition of complex pyrolysis and combustion chemical reaction. According to the typical 110 kV cable tunnel structure, cable layout, and material properties, the fire development is simulated under different fire locations and fire source power. The data of temperature distribution, flue gas concentration, and generated gas content under different simulation conditions are obtained. Then, a variety of data in case of fire are analyzed based on the simulation results, and the characteristic data set is selected. The multi-dimensional nonlinear relationship between the size of the fire source, the location of the fire point, and the collected characteristic data set is analyzed. Finally, the fire early warning model based on support vector machine (SVM) is established. The data sets obtained under different simulation conditions are selected as the total samples. Some of them are used as training samples to train the early warning model and then use the test samples to test and verify the accuracy of the early warning model.
Analysis on Fire Development Law of Cable Tunnel
Simulation Method of Power Cable Combustion
The structure of a 110 kV high-voltage XLPE cable is quite different from that of the ordinary low-voltage communication cable. It mainly includes conductor, inner semi-conductive shielding layer, insulating layer, outer semi-conductive shielding layer, metal shielding, metal armor, outer sheath, and filler in relevant layers. The outer sheath is generally flame retardant, but it will still burn under open fire. The insulating material XLPE is flammable and easy to melt and drip, which is easy to cause fire spread. High-voltage cable tunnel fire is generally caused by insulation breakdown and short circuits. In this case, both the internal insulating material and the outer sheath will be ignited by the arc. Studying the simulation method of different materials burning together in a cable multi-layer structure is necessary.
Cable combustion simulation is mainly divided into two processes: solid-phase reaction and gas-phase reaction. Firstly, the solid surface of the material is thermally pyrolyzed and gasified. Then, the pyrolyzed and gasified material reacts with oxygen to form combustion and release heat, which will further promote pyrolysis and ignition. The gas-phase reaction interacts with the solid-phase reaction. The pyrolysis reaction of each layer of the high-voltage XLPE cable is also different due to different materials of the multi-layer structure. If only simple pyrolysis is set, it does not involve the internal pyrolysis process of the solid, which may cause large errors. Herein, the complex pyrolysis method is used to simulate the combustion spread of the multi-layer cable structure. Set the pyrolysis kinetic parameters of the material and calculate the reaction rate using the following formula:
where Wi is the ith pyrolysis reaction rate; Ai is the ith pre-exponential factor; Ei is the activation energy of the ith reaction; R is the general gas constant, with a value of 8.314 kJ/kmol•K; Ts is the reaction temperature (K); N is the reaction order; ρi is the mass concentration of the current solid-phase type; ρo is the initial density of the solid surface at the boundary; and XO2 is a simulated reaction rate, which is affected by local oxygen concentration.
The pyrolysis of power cables produces a variety of combustible gases, which undergo multiple chemical reactions with oxygen. If each gas reaction is simulated, the amount of calculation will be greatly increased. It will lead to non-convergence in the case of turbulent combustion. Therefore, the final material generated is considered in the simulation. The main material of the outer sheath is C2H3Cl. According to the corresponding generated substances measured by the combustion test, determine the substances and coefficients of the chemical reaction equation, as shown in formula (2). The insulating layer material is cross-linked polyethylene (XLPE), and the corresponding chemical equation is shown in formula (3). During the combustion process of the power cable, the combustion of the outer sheath and insulating layer needs to be determined according to the test. Combined with the combustion calorific value of solid materials obtained from the test, the mass of gas fuel required for the corresponding gas-phase reaction is converted. In other words, the dynamic process of pyrolysis gas is balanced by adjusting the generation rate of final gas fuel mass so that the combustion simulated by the gas-phase reaction is closer to the actual test value. According to the ratio of the outer sheath and insulating layer, the molecular formula of gas-phase fuel burned by the power cable is C2H3.6Cl0.4, and the gas-phase reaction equation is shown in formula (4):
In order to verify the effectiveness of the improved simulation model, a comparative analysis is carried out combined with the combustion test of the high-voltage cable. Generally, CH4 is used to simulate the gas-phase reaction. Pyrolysis reaction can be divided into simple pyrolysis and complex pyrolysis. The three combined simulation conditions are as follows: chemical reaction correction and complex pyrolysis, CH4 gas-phase reaction and simple pyrolysis, and CH4 gas-phase reaction and complex pyrolysis. The test measurement data are total combustion power. The comparison between simulation results and test data is shown in Figure 1. The results show that CH4 in the gas-phase reaction will increase the total combustion power by about 50%. The rising rate of total combustion power of simple pyrolysis is slower than that of complex pyrolysis. It will also lead to the difference between the simulation results and the test data. The simulation results of the improved model proposed in this study are closest to the experimental results. The simulation is close to the rising stage of the test, and the error is about 2.3%. In the attenuation stage, the error between simulated combustion power and test power increases, and the maximum error is about 14%. The effectiveness of the improved model is verified.
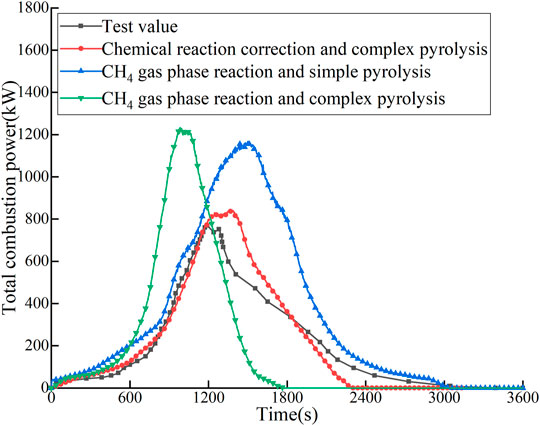
FIGURE 1. The comparison between simulation results and test data of total combustion power.
Simulation Parameter Setting
The simulation model is established according to the typical 110 kV power cable tunnel layout. The length of each ventilation zone in the tunnel is 100 m. Three layers of 110 kV cables are arranged on the cable brackets. The height between layers is 60 cm, and the spacing between three cables on each layer is 10 cm. A cable tunnel model is established with a length of 100 m and a cross section of 2.3 × 2.3 m, as shown in Figure 2. The calculation boundary is set to concrete properties. Probes of temperature, smoke concentration, and characteristic gas are set every 0.1 m at different model heights. Because the copper conductor cannot burn, the cable body is equivalent to the internal insulating layer and the external outer sheath. The insulating layer material is XLPE. The outer sheath material is PVC. The thermal performance parameters of the material are listed in Table 1.
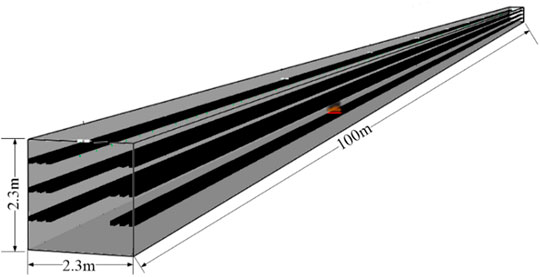
FIGURE 2. The whole simulation model.

TABLE 1. Thermal performance parameters of cable materials.
The thermogravimetric analysis of PVC outer sheath material is carried out. The change law of temperature and weight of PVC during heating is obtained through the test. The research shows that a small amount of organic gas is produced when the cable is heated to 240°C. HCl gas begins to precipitate at 328°C. The reaction becomes an exothermic reaction at 385°C, and carbon oxides begin to precipitate in addition to HCl gas. The cable ignition temperature is set to the temperature at which the exothermic reaction occurs. The pyrolysis combustion parameters of corresponding cables are listed in Table 2.
TABLE 2. Pyrolytic combustion parameters of cable materials.
The power of the fire source causing cable combustion needs to be analyzed and set in combination with the actual situation. When the outer sheath of the cable is damaged, the induced potential on the armor and metal shield can be grounded through the damaged point to form a circulating current. At this time, the current is small and the heating power is small. However, it will last for a long time to form smoldering. When the insulation layer of the power cable is aged and broken down, a short-circuit fault is formed. According to the capacity of the power cable system, there will be different short-circuit currents. The short-circuit current value is large, and the heating power is large, which can quickly ignite the cable insulation layer and outer protective layer. When the system suffers from overvoltage breakdown due to large short-time energy, the most serious joint explosion and fire may occur. At present, there is no clear fire classification of the power cable tunnel. Combined with the division regulations of urban fire alarm, the fire conditions are divided into smoldering fire, developing fire, and open fire. The fire caused by cable fire in different layers is different, so it is necessary to set simulation conditions for simulation research. Nine different simulation conditions are set in Table 3.
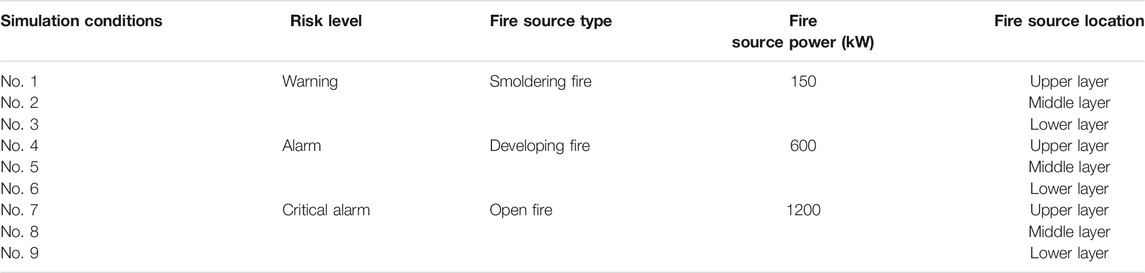
TABLE 3. Fire simulation conditions of power cable tunnel.
Analysis of Simulation Results
Analysis of Temperature Distribution in Cable Tunnel
The simulation results show that when the fire source power is 150 kW, it is difficult to spread the fire due to the small power. Combustion occurs only near the ground point where the outer sheath is damaged. When the fire source power is 600 and 1200 kW, the fire will spread along the cable. After the cable body is completely burned, the overall fire develops rapidly. For instance, the temperature distribution in the tunnel under the development fire of 600 kW is analyzed, as shown in Figure 3. In the process of cable combustion, the heat diffuses around with the flue gas flow, and the high-temperature airflow mainly spreads to the upper layer. Under the action of continuous high temperature, the cable material is rapidly pyrolyzed and then burned, and the upper cable is ignited. It shows that the high-temperature area in the early stage of development is mainly above the fire source. AS high-temperature gas accumulates in the upper cable and tunnel ceiling, the upper layer is easier to burn and develop. With the increase in combustion time, the upper cable gradually spreads and expands the combustion area. When the fire source is in the middle cable, it can still ignite the upper cable upward to achieve a certain combustion spread effect. When the fire source is located in the lower layer or middle layer, the tunnel temperature can reach 1000°C. When the fire source is located in the upper layer, as the temperature is mainly concentrated in the tunnel ceiling, the temperature rise on both sides of the fire source of the cable body is not obvious, and the combustion is not easy to spread. The maximum temperature in the tunnel is about 420°C.
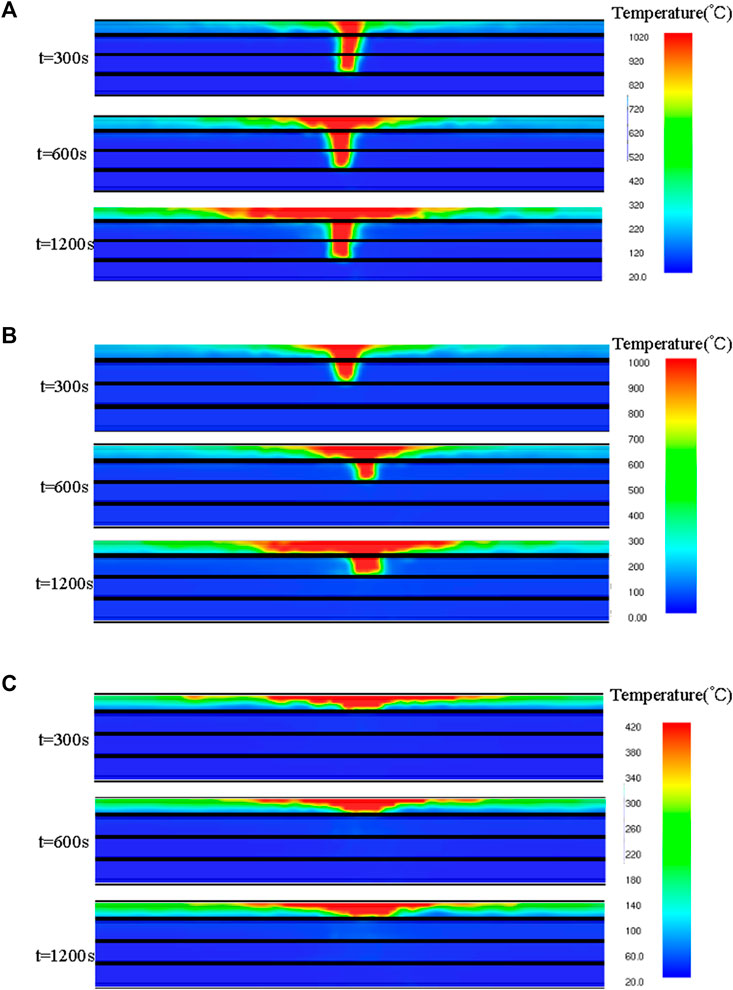
FIGURE 3. Temperature distribution of cable tunnel when the ignition point is located in different layers. (A) At the lower layer. (B) At the middle layer. (C) At the upper layer.
Analysis of Fire Smoke Spread
When the fire source power is 150 kW, the combustion range is small and the amount of smoke is less. When the fire source power is 600 kW, it can ignite the upper cable and spread continuously. With the expansion of the combustion spread range, the flue gas concentration increases gradually, as shown in Figure 4. With the expansion of the combustion spread range, the flue gas concentration increases gradually. The flue gas first reaches the top and then gradually diffuses to both sides. At 300 s, the flue gas has not completely diffused to the other end. At 1200 s, the flue gas has completely diffused to both sides and has sufficient concentration. When the ignition point of the cable is at the lowest layer, the total firepower is the largest. When the fire source power is 600 kW, the maximum total combustion power of the cable is about 5700 kW. When the fire source power is 1200 kW, the maximum total combustion power of the cable can exceed 16 MW. When the ignition point of the cable is at the lowest layer, it is easier to ignite the upper cable and is conducive to the flame extension of the middle layer cable. The overall combustion area is the largest, and the fire development is the most serious, as shown in Figure 5. When the flame develops close to the tunnel roof, the gas heat flow accumulates above. After reaching a certain degree, a fire flashover will occur. The cables on the top layer spread rapidly, and the burning rate is much higher than that of the lower two layers. When the ignition point of the cable is in the upper layer, the total firepower is the smallest. Because it cannot be fully ignited in this case, the total combustion power is much less than that in the lower two layers.
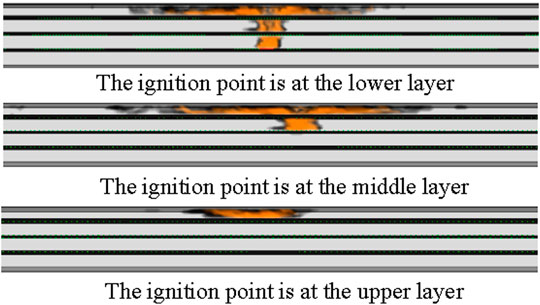
FIGURE 4. Fire smoke spread at different ignition positions (fire source power 600 kW, t = 600 s).
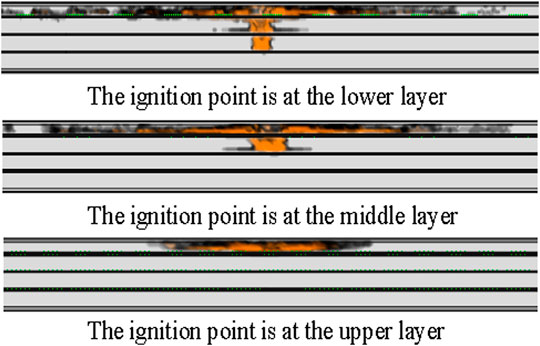
FIGURE 5. Fire smoke spread at different ignition positions (fire source power 1200 kW, t = 600 s).
Characteristic Gas Analysis of Power Cable Combustion
Different fire source powers or locations will lead to the difference in combustion characteristic gas. Whether the combustion is sufficient directly affects the proportion of CO2 and CO produced. Taking the fire source power of 600 kW for instance, the measured concentrations of CO2 and CO with time and fire point distance are shown in Figures 6, 7. The concentration distribution trend of the two gases in the tunnel is approximately the same. The concentration of CO2 produced by fire is much higher than that of CO. At the beginning of the fire, the characteristic gas produced by combustion first accumulates and settles at the top. When the fire source is at the lower layer, the combustion rate is the highest. The concentrations of CO and CO2 in the tunnel are generally high. The maximum concentration within 20 m from the fire source is 190 and 1050 ppm, respectively. When the fire source is located at the upper layer, the heat generated by combustion is mainly concentrated at the top of the tunnel. The cable body cannot be ignited, and the combustion is not easy to form and diffuse. The overall characteristic gas concentration in the tunnel is at a very low value.
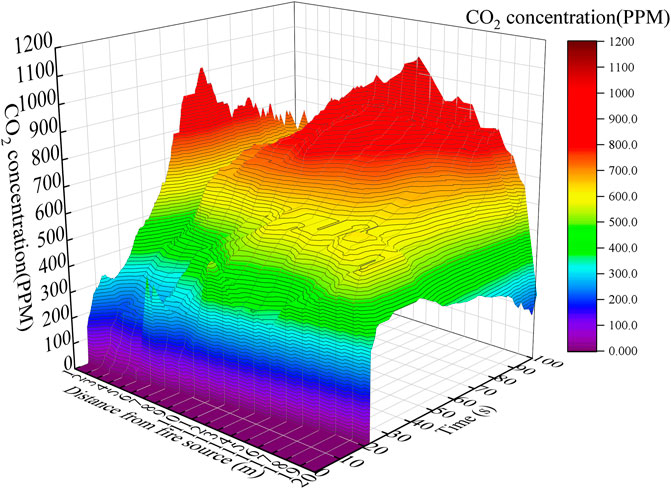
FIGURE 6. Variation curve of CO2 concentration (fire source power 600 kW).
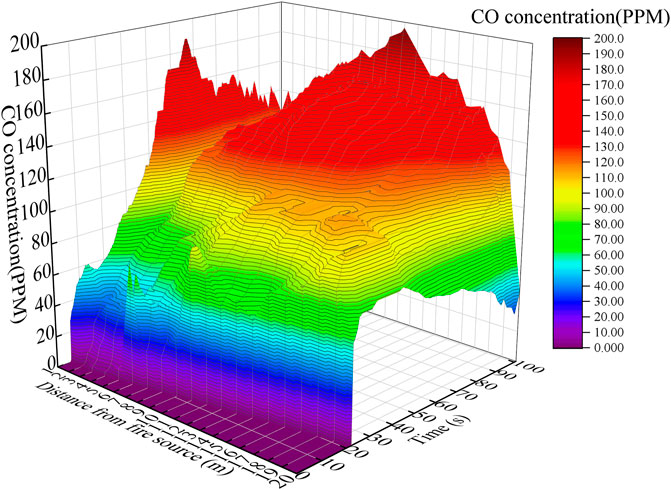
FIGURE 7. Variation curve of CO concentration (fire source power 600 kW).
Characteristic Data Analysis and Early Warning Method of Cable Tunnel Fire
Basic Principle of Early Warning Method Based on Feature Anomaly Monitoring
The early warning of cable tunnel fire is based on real-time monitoring data such as temperature, smoke concentration, CO, and CO2. However, considering the cost of installation, operation, and maintenance, it is impossible to arrange a variety of existing monitoring sensors in the whole line of the power cable. There is a blind area in the monitoring of tunnel fire. However, it is impossible to judge the power and relative position of the fire source. The simulation results show some differences in temperature change, smoke, and characteristic gas propagation of fires with different fire source sizes and relative positions. In case of a smoldering fire, the fire point temperature is low, the flue gas is large, and the characteristic gas concentration is easier to be monitored first. In case of insulation breakdown, short circuit, or even intermediate joint explosion, a large amount of heat will be generated rapidly, and high-temperature gas may spread faster. It is necessary to analyze a variety of abnormal monitoring data in case of fire in the cable tunnel. The fire source level and relative position are predicted through the characteristic analysis of the collected data set.
The distance between the cable ignition point and the monitoring device is different, and the various characteristics of the combustion heat, smoke, and characteristic gas transmitted to the monitoring device are also different. It is necessary to select reasonable characteristic data for comparative analysis. Whether it is a fixed monitoring device or a mobile intelligent monitoring device, the measurement sensor has a minimum measurement threshold. When the threshold is triggered, the subsequent measured values can be continuously collected as a data set. The relationship between the size and relative position of the ignition source and the collected characteristic data set is a multi-dimensional nonlinear relationship. This multi-dimensional nonlinear relationship needs many data sets to be analyzed. Due to the high cost, low efficiency, and difficulty in controlling the actual tunnel test, it is not feasible to obtain a large amount of data through the test. The characteristic data can be obtained by simulating a variety of different situations. Under each condition, the amount of feature data is limited, and an appropriate intelligent algorithm needs to be used for prediction. It is difficult to directly predict the power value and accurate position of the fire source. In this article, the classification of fire source power and relative position is transformed into a classification problem. The SVM algorithm has certain advantages in solving small sample, nonlinear, and high-dimensional pattern classification problems. The kernel function is an important part of the support vector machine. Herein, the radial basis function kernel function is selected as follows:
where γ is the kernel function parameters. The penalty coefficient C and kernel function parameters γ in SVM determine its recognition performance. The above parameters are optimized based on the genetic algorithm, which can avoid falling into a local minimum in the process of parameter optimization and quickly locate near the optimal solution.
Analysis and Selection of Fire Characteristic Parameters of Cable Tunnel
The temperature, flue gas concentration, and CO2 and CO content under different fire source powers and fire locations are simulated. The intelligent mobile monitoring and fire extinguishing device is installed on the track in the middle of the top of the tunnel. The installation height of various sampling sensors is about 1.9 m. In order to simulate the actual sampling situation, the simulated sampling data points are also selected at the middle height of 1.9 m at the top of the tunnel. The data sets of characteristic parameters at monitoring points at different locations from the fire source are simulated and obtained. When the power is 150, 300, and 600 kW, the variation and comparison of sampling parameters at different ignition positions are shown in Figure 8. Figure 8A shows a little difference in change trend and amplitude between the temperature curve of 150 KW ignition point at the lower layer and that of the 300 kW ignition point at the middle layer. A similar situation exists in the comparison curve of flue gas concentration, CO, and CO2. It shows that it is difficult to distinguish fire source power and fire location only by a single acquisition parameter.
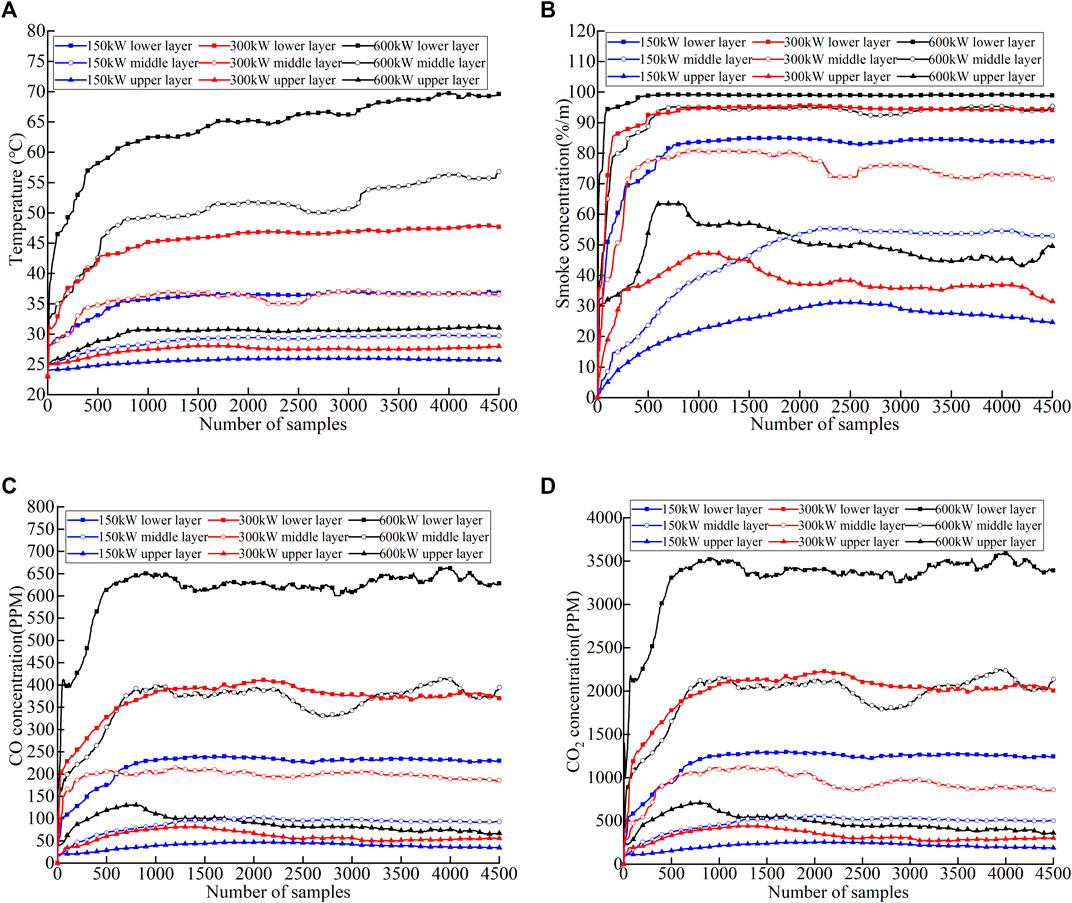
FIGURE 8. The variation and comparison of sampling parameters. (A) Temperature, (B) smoke concentration, (C) CO, (D) CO2.
Figures 8B,D show obvious differences in the changes of flue gas concentration and CO2 content in the lower layer of 150 KW and the middle layer of 300 kW. Figure 8B shows that when the power is 300 kW and the ignition position is in the lower layer, the change law of flue gas is basically the same as that when the power is 600 kW and the ignition position is in the middle layer. However, the temperature curves in these two conditions are significantly different, as shown in Figure 8A. The above analysis shows that different fire source power and fire location can be distinguished using various characteristic parameters. Regardless of the distance from the ignition point, the same fire source power and ignition position have a similar change trend. Therefore, the data set of the above characteristic parameters can be used as the input sample for fire determination.
Prediction Method and Test Results of Fire Classification
For instance, when the power is 300 kW and the ignition position is in the lower layer, some sampling data sets are shown in Table 4. There are two main problems in using these sampling data sets directly as a sample unit. The numerical amplitudes of different physical quantities vary greatly, so the data need to be normalized first. Another problem is too much sampling data in the data set. If all of them are used for model training, there will be too many sample dimensions. It may lead to overfitting of the model and reduce the prediction accuracy. In order to simplify the redundancy of samples and reduce the data dimension, the sampling points in the stationary section are reduced in each physical quantity series in each group of samples. At the same time, the range, modulus, maximum value, and average value of each sequence value are added to ensure the overall characteristics.
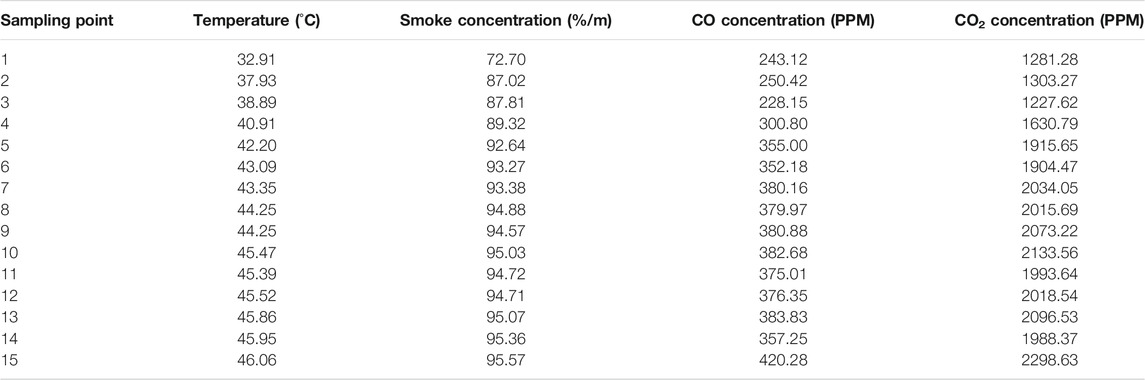
TABLE 4. Partial sampling data (300 kW, lower layer).
If the regression prediction is carried out directly, it is difficult to predict the power value accurately. The classification prediction is carried out according to the fire grade. The fire source power is divided into five values on the basis of Table 3 by classification: 150, 300, 600, 900, and 1200 kW. It is respectively set in three different layers of cables under different fire source powers. Fire sources are divided into 15 classifications according to the fire source power and fire location. In each classification, the monitoring sensors with different distances from the fire source are simulated to obtain data. Analog sampling of monitoring points is set every 2 m as a group of sample data, and a total of 40 groups of sample data are selected. A total of 600 samples were obtained. For each classification, 35 groups were randomly selected as training samples and the other five groups as test samples. A total of 525 groups of training samples and 75 groups of test samples were obtained. The training samples are used to train the fire classification and prediction model based on SVM, and then the test samples are input for prediction. The prediction accuracy of test samples is 92% (69/75), which verifies the effectiveness of the proposed detection method. The analysis of the samples with wrong prediction is mainly because the flue gas concentration, temperature, and CO and CO2 concentration collected by some analog sensors at different distances in the two classification situations are relatively close. The samples with prediction errors are analyzed. This is mainly because after reducing the sampling data points for dimensionality reduction, the flue gas concentration, temperature, and CO and CO2 concentration collected by some analog sensors with different distances in the two classification cases are relatively close. It is necessary to further analyze the correlation between characteristic parameters and study more appropriate dimensionality reduction methods to improve the accuracy of prediction.
Conclusion
This study presents an improved combustion model according to the structural characteristics of the high-voltage cable. The variation characteristics of characteristic data in a cable tunnel under different fire conditions are analyzed, and a fire prediction model is proposed. The main conclusions are set as follows:
1) Through the comparison between simulation and experimental data, the cable model is established by defining chemical reactions and setting up complex pyrolysis. The total firepower obtained can be well consistent with the actual combustion.
2) The fire development under different fire source powers and fire locations is simulated. The results show that it is difficult to distinguish fire source power and fire location only by a single acquisition parameter. The different fire source powers and fire locations can be distinguished using a variety of characteristic parameters.
3) The accuracy of the fire classification and prediction model based on SVM is 92%. The effectiveness of the prediction model is verified. Fire can be put out more pertinently according to the prediction results of fire source power and fire location.
Data Availability Statement
The original contributions presented in the study are included in the article/Supplementary Material. Further inquiries can be directed to the corresponding author.
Author Contributions
CL put forward research ideas. JC guided the research methods. ZP wrote the original draft and is the corresponding author. FT reviewed the manuscript. JL provided relevant structural and material data. XT edited figures and tables. LH did the simulation. JCa did the data analysis. All authors have read and approved the submitted version of the manuscript.
Conflict of Interest
CL, JC, FT, JL, XT, LH, and JCa were employed by Electric Power Research Institute of State Grid Jiangsu Electric Power Co., Ltd.
The authors declare that the research was conducted in the absence of any commercial or financial relationships that could be construed as a potential conflict of interest.
Publisher’s Note
All claims expressed in this article are solely those of the authors and do not necessarily represent those of their affiliated organizations, or those of the publisher, the editors, and the reviewers. Any product that may be evaluated in this article, or claim that may be made by its manufacturer, is not guaranteed or endorsed by the publisher.
References
An, W., Tang, Y., Liang, K., Cai, M., Wang, T., and Wang, Z. (2020b). Study on Temperature Distribution and CO Diffusion Induced by cable Fire in L-Shaped Utility Tunnel. Sust. Cities Soc. 62, 102407. doi:10.1016/j.scs.2020.102407
An, W., Wang, T., Liang, K., Tang, Y., and Wang, Z. (2020a). Effects of Interlayer Distance and cable Spacing on Flame Characteristics and Fire hazard of Multilayer Cables in Utility Tunnel. Case Stud. Therm. Eng. 22, 100784. doi:10.1016/j.csite.2020.100784
Fang, H., Zhang, J., Huang, D., Lu, S., and Lo, S. M. (2019). “October)Simulation-Based Quantitative Risk Assessment of Fire in Urban Electrical Cable Tunnels,” in 2019 9th International Conference on Fire Science and Fire Protection Engineering (ICFSFPE) (IEEE), 1–9.
Jing, Z., Li, C., Ren, G., Chi, Y., and Tian, F. (2019). October)Multi-Sensor Network Cable Tunnel Monitoring System Based on GISIOP Conference Series: Materials Science and Engineering. IOP Conf. Ser. Mater. Sci. Eng. 612 (3), 032178. doi:10.1088/1757-899X/612/3/032178
Li, C., Chen, J., Hu, L., Zhang, W., Cao, J., Tan, X., et al. (2021). Research on Cable Fire Detection and Early Warning Based on Deep Learning in 2021 IEEE International Conference on Electronic Technology, Communication and Information (ICETCI) (IEEE), 176–179. doi:10.1109/icetci53161.2021.9563399
Mi, H., Liu, Y., Jiao, Z., Wang, W., and Wang, Q. (2020). A Numerical Study on the Optimization of Ventilation Mode during Emergency of cable Fire in Utility Tunnel. Tunnelling Underground Space Tech. 100, 103403. doi:10.1016/j.tust.2020.103403
Niu, Y., and Li, W. (2012). Simulation Study on Value of cable Fire in the cable Tunnel. Proced. Eng. 43, 569–573. doi:10.1016/j.proeng.2012.08.100
Qiu, W., Huang, S., Pei, X., Cui, J., Ye, Y., and Meng, A. (2018). “November). Temperature Anomaly Location and Cable Equipment Recognition with an Improved Convolutional Neural Network Method and Transfer Learning,” in 2018 International Conference on Power System Technology (POWERCON) (IEEE), 4555–4560.
Shen, X., Ouyang, T., Yang, N., and Zhuang, J. (2021). Sample-Based Neural Approximation Approach for Probabilistic Constrained Programs. IEEE Trans. Neural Netw. Learn. Syst., 1–8. doi:10.1109/TNNLS.2021.3102323
Shen, X., and Raksincharoensak, P. (2021). “Pedestrian-Aware Statistical Risk Assessment,” in IEEE Transactions on Intelligent Transportation Systems. doi:10.1109/tits.2021.3074522
Shen, X., Zhang, Y., Sata, K., and Shen, T. (2020). Gaussian Mixture Model Clustering-Based Knock Threshold Learning in Automotive Engines. Ieee/asme Trans. Mechatron. 25 (6), 2981–2991. doi:10.1109/TMECH.2020.3000732
Song, Z., Wang, X., Tan, Z., Miao, X., and Zou, L. (2020). “September)Analysis of Distribution Law of Fire Gas Concentration in Underground Cable Tunnel of Substation,” in 2020 IEEE International Conference on High Voltage Engineering and Application (ICHVE) (IEEE), 1–4.
Wang, Y., Zheng, J., and Ding, B. (2021). “October)Fire Protection Monitoring System for Power Cabin in Utility Tunnel Based on IOT Technology,” in 2021 IEEE 5th Information Technology, Networking, Electronic and Automation Control Conference (ITNEC) (IEEE), 5, 1366–1371.
Wu, J., Sun, H., Gao, J., Song, Z., Wang, X., and Zou, L. (2020). “September)Simulation of Fire Spread in Underground Cable Tunnel of Substation under Different Ventilation Conditions,” in 2020 IEEE International Conference on High Voltage Engineering and Application (ICHVE) (IEEE), 1–4.
Yang, N., Liu, S., Deng, Y., and Xing, C. (2021b). An Improved Robust SCUC Approach Considering Multiple Uncertainty and Correlation. IEEJ Trans. Elec Electron. Eng. 16 (1), 21–34. doi:10.1002/tee.23265
Yang, N., Qin, T., Wu, L., Huang, Y., Huang, Y., Xing, C., et al. (2022). A Multi-Agent Game Based Joint Planning Approach for Electricity-Gas Integrated Energy Systems Considering Wind Power Uncertainty. Electric Power Syst. Res. 204, 107673. doi:10.1016/j.epsr.2021.107673
Yang, N., Yang, C., Wu, L., Shen, X., Jia, J., Li, Z., et al. (2021c). Intelligent Data-Driven Decision-Making Method for Dynamic Multi-Sequence: An E-Seq2Seq Based SCUC Expert System. IEEE Trans. Ind. Inf., 1. doi:10.1109/TII.2021.3107406
Yang, N., Yang, C., Xing, C., Ye, D., Jia, J., Chen, D., et al. (2021a). Deep Learning‐based SCUC Decision‐making: An Intelligent Data‐driven Approach with Self‐learning Capabilities. IET Gener. Transm. Distrib. Transmission & Distribution. doi:10.1049/gtd2.12315
Keywords: power cable tunnel, combustion simulation, complex pyrolysis, characteristic gas data, anomaly detection, fire early warning
Citation: Li C, Chen J, Pu Z, Tao F, Liu J, Tan X, Hu L and Cao J (2022) Research on Fire Prediction Method of High-Voltage Power Cable Tunnel Based on Abnormal Characteristic Quantity Monitoring. Front. Energy Res. 10:836588. doi: 10.3389/fenrg.2022.836588
Received: 15 December 2021; Accepted: 10 January 2022;
Published: 04 February 2022.
Edited by:
Xun Shen, Tokyo Institute of Technology, JapanCopyright © 2022 Li, Chen, Pu, Tao, Liu, Tan, Hu and Cao. This is an open-access article distributed under the terms of the Creative Commons Attribution License (CC BY). The use, distribution or reproduction in other forums is permitted, provided the original author(s) and the copyright owner(s) are credited and that the original publication in this journal is cited, in accordance with accepted academic practice. No use, distribution or reproduction is permitted which does not comply with these terms.
*Correspondence: Ziheng Pu, pzhdq@ctgu.edu.cn