 Bo Zhou
 Peng Shi*
 Yunyang Xu
- Electric Power Research Institute, State Grid Sichuan Electric Power Company, Chengdu, China
The grid connection of photovoltaic (PV) farms may cause power system oscillations under the condition of open-loop modal resonance (OLMR). This study elucidated the origin of the induced low-frequency oscillations and examined the impact of the electrical distance between grid-connected PV farms on OLMR intensity by using a simplified real power network. A linearized state-space model of the real power system comprising grid-connected PV farms was derived. Based on this, an OLMR analysis was performed to examine the impact of the electrical distance between the grid-connected PV farms as well as between each grid-connected PV farm and the main grid. The OLMR analysis results indicate that the strength of the OLMR increases with the electrical distance between the PV farms, thereby leading to growing power oscillations. Moreover, the increase of electrical distance between each of the grid-connected PV farms and the main grid has a greater effect on OLMR intensity. Additionally, the non-linear simulations were performed to confirm the correctness of the OLMR analysis. Finally, by re-tuning the parameters of the control system of the grid-connected PV farms to reduce the phase-locked loop bandwidth, the OLMR can be effectively eliminated to avoid power oscillations.
1 Introduction
In recent years, as environmental pollution and energy crisis problems have become increasingly severe, several countries are actively transforming to green and sustainable energy systems. The proposal of the “carbon peak and neutrality” goal implies that the development of new alternative and clean energy is an inevitable trend in the current era (Wang et al., 2021). Among various alternative energy sources, solar energy has recently received remarkable attention, and its application technology has developed considerably (Donaldson et al., 2021). At present, solar power generation technologies mainly include concentrated solar power (CSP) and photovoltaic (PV) power generation (Abubakr et al., 2022). Owing to the high costs of the CSP technology, the PV power generation technology is widely worldwide. The fast-paced development in PV power generation technology has led to a notable increase in its installed capacity. Nonetheless, the PV power generation principle and control methods are considerably different from those of conventional power generation (Kou et al., 2020; Quan et al., 2020). In 2017, a regional power network in the western areas of China experienced power oscillations of approximately 1 Hz caused by PV grid connections, which led to the disassembly of some power stations and affected the safety and stable operation of the power systems.
At present, researchers worldwide have been focusing on inverter structure and control, maximum power point tracking (MPPT) strategy, operation optimization, and stability analysis aspects of PV power generation. Khasim (Khasim et al., 2021) proposed a novel asymmetric multilevel inverter topology, which uses an asymmetric DC power supply to achieve a 21-level output voltage without an H-bridge. Mahmoud (Mahmoud and Lehtonen, 2020) proposed a three-level control strategy with different time resolutions to minimize voltage deviation and voltage flicker in high PV penetrated distribution systems. Further, an adaptive discrete proportional–integral–differential controller was used to control the dynamic microgrid inverter voltage (Kumar and Tyagi, 2021), and DC–DC and DC–AC converters were coordinated and controlled (Emara et al., 2021), both of which improved voltage stability. Based on the adaptive neural fuzzy reasoning system (ANFIS), Priyadarshi and Ibrahim (Priyadarshi et al., 2020; Ibrahim et al., 2021) studied the MPPT algorithm to quickly achieve the maximum power. In addition, ANFIS has been applied to the areas of detection, identification, and defect/fault elimination in PV systems (Bendary et al., 2021; Mansouri et al., 2021). Further, on the premise of ensuring the reliability of photovoltaic microgrids and renewable energy source integration system, the corresponding highest penetration was determined (Ali et al., 2021; Harasis et al., 2021). Mahmoud (Mahmoud and Lehtonen, 2021) proposed comprehensive analytical expressions to solve the problem of optimal allocation of multiple PV units in distribution systems, which has high performance in accuracy, flexibility and computational speed.
The influence of the power grid strength and control loop interactions on the system stability were previously demonstrated (Huang et al., 2015; Xia et al., 2018; Malik et al., 2019) by using the state-space model and eigenvalue method. The stability of the system degrades whenever the power grid strength lowers or the interactions intensify. Moreover, Eftekharnejad (Eftekharnejad et al., 2013) reported that a high penetration of PV generation would reduce the damping of certain critical modes, which in turn causes the system to oscillate, compromising the system’s stability. Furthermore, it was shown that a high penetration of the PV generation can affect the voltage stability of the system (Yan and Saha, 2012). Moradi-Shahrbabak (Moradi-Shahrbabak and Tabesh, 2018) conducted stability analysis based on the state-space model and suggested that the damping of the oscillation mode would change with the change of parameters (i.e., capacitance and reactance) corresponding to the DC-link and front-end converter. They also showed that the increase of capacitance and reactance can lead to the risk of instability. Using a theoretical analysis, Du (Du et al., 2020) proposed an index to assess the impact of an increase in the number of PV power generation units on the stability of the system. Based on the aforementioned studies, it is evident that the connection of PV power systems to a grid would affect the stability of the system in many aspects.
Previously (Du et al., 2017; Du et al., 2018; Chen et al., 2019), a new concept of open-loop modal resonance (OLMR) for the grid-connected wind power generation was proposed to induce power system oscillations. The novel OLMR theory provides an alternative perspective to understand the mechanism of the oscillatory instability caused by a grid-connected wind power generation system. It also constitutes a tool to examine the risk of oscillations caused by the grid-connected wind power generation system in practical power systems. The OLMR theory was based on the state-space model of the open-loop subsystem, and evaluated the instability risk of the system with the OMLR condition, which makes up for the deficiency of the traditional modal analysis method in revealing the stability mechanism. In this study, the OLMR theory was applied to investigate the occurrence of low-frequency oscillations caused by a grid-connected PV power generation in the regional power system in western China. The investigation aimed to understand why the grid-connected PV power generation system induces low-frequency oscillations in the regional power system. This is the first aspect of the contributions made by the present study.
According to relevant prior studies (Du et al., 2017; Du et al., 2018; Chen et al., 2019), the stronger the OLMR, the more at risk would be the grid-connected wind power generation system. However, the key elements, which may affect the intensity of the OLMR were not studied. Therefore, in the present study, the electrical distance between multiple grid-connected PV farms (under OLMR) and that between each of the grid-connected PV farms and main grid are examined. This study sought to understand why the low-frequency oscillations caused by the grid-connected PV power generation system occurred in a particular regional power system in western China. Subsequently, this examination could serve as a practical guidance for the planning of grid connections of PV generators in the future to avoid the aforementioned challenges. This forms the second potential contribution of this study.
Herein, the theory of OLMR is introduced first in Section 2. In Section 3, the mathematical model of a PV farm is built using the model (Tan et al., 2004; Du et al., 2020). In Section 4, a linearized state-space model of the simplified regional power system in western China with two grid-connected PV farms (where the low-frequency oscillations were observed) is established. Section 5 details the application of the theory of OLMR to examine the impact of the electrical distance between the two grid-connected PV farms and the intensity of the OLMR between each of the grid-connected PV farms. Furthermore, the results of the non-linear simulation are presented to demonstrate the correctness of the OLMR analysis. Finally, conclusions and future work are presented in Section 6.
This study made several notable contributions. First, based on the OLMR theory, the origin of the induced low-frequency oscillations in the regional power system was elucidated. Second, the influence of the electrical distance on the OLMR was examined using several numerical examples. This paper showed that re-tuning parameters is beneficial in eliminating OLMR and improving the closed-loop mode damping (−0.015→0.119). In addition, we revealed that a constant electrical distance between each of the grid-connected PV farms and the main grid would not affect the oscillation stability of the PV power generation system. This feature is applicable in the design and planning of large-scale grid-connected PV farms.
2 Open-Loop Modal Analysis
A closed-loop interconnection model can be divided into two open-loop subsystems interconnected by current and voltage, as shown in Figure 1.
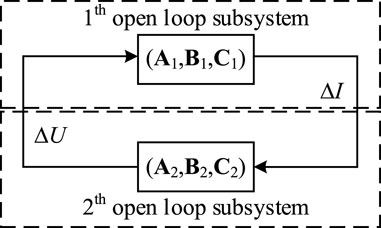
FIGURE 1. Closed-loop interconnection model.
the prefix
The two open-loop subsystems are represented by two transfer functions,
where
The characteristic equation of the closed-loop interconnected system can be obtained as follows:
Substituting Eq. 3 in Eq. 4, replacing s by
where R1i and R2i are the residues corresponding to
Similarly, replacing s by
According to (8), when the OLMR condition is satisfied, the corresponding closed-loop mode (
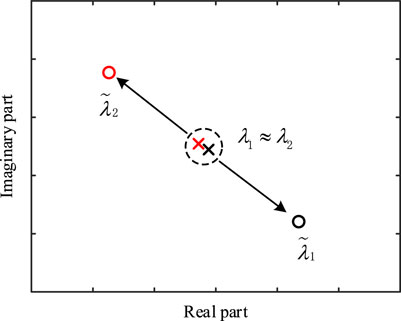
FIGURE 2. The phenomenon of OLMR.
3 Mathematical Model OF PV Farm
PV power generation is a technology that converts solar energy into electrical energy via the photovoltaic effect. A PV farm mainly comprises a PV array, an inverter and its control system, and filter reactance. Its basic structure is shown in Figure 3, where
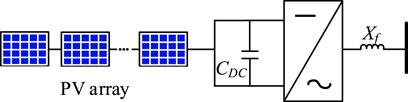
FIGURE 3. Schematic of a PV farm.
3.1 PV Array Model
Tan (Tan et al., 2004) proposed a mathematical model for PV arrays, assuming that its operation is under standard temperature (25 °C) and illumination (1000 W/m2) conditions.
where
3.2 Model of the Inverter Inner and Outer Loop Control System
The dynamic model of the capacitor voltage is given as
where
The control system of the inverter is divided into outer loop control and inner loop control. The block diagram of the inverter control system is shown in Figure 4.

FIGURE 4. Block diagram of the inverter control system.
The outer loop control model is designed using Eq. 11 as:
where
The current inner loop control model is shown in Eq. 12 as:
where
3.3 Filter Model
The mathematical model of the filter is shown in Eq. 13 as follows:
where
3.4 Phase-Locked Loop Model
The control structure of the phase-locked loop (PLL) model is shown in Figure 5.
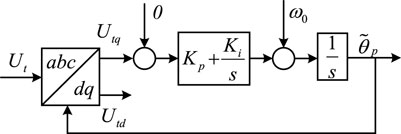
FIGURE 5. Control structure of the PLL model.
The dynamic model of the PLL can be obtained using Eq. 14.
where,
Thus, Eqs. 9–14 constitute the mathematical model of the PV farm.
4 Linearized State-Space Model of the Photovoltaic Power Generation System
A PV power generation system with two PV farms is illustrated in Figure 6. The system’s structure is simplified based on a regional power network in the western area of China, and the main grid is replaced by an infinite system. To study the impact of the electrical distance between grid-connected PV farms on the stability of the system oscillation, a linearized state-space model of the PV power generation system is established. The linearized model of the PV farm is based on the mathematical model proposed in Section 3.
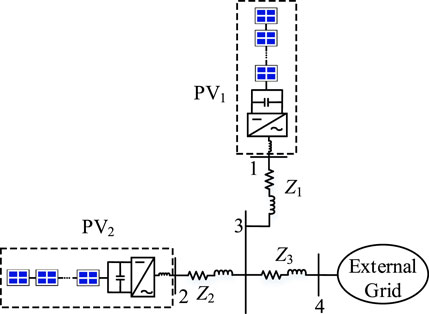
FIGURE 6. Schematic of the PV power generation system.
Assuming that the mathematical model, operating state and control parameters of PV1 and PV2 are consistent, the linearized state-space model of the kth (k = 1,2) PV farm can be expressed as follows:
where
The node admittance matrix of the power system can be written as
where
where
According to Eqs. 15, 17, the following full-order linearized model of the PV power generation system depicted in Figure 6 is obtained by
where
5 Sample Analysis
This section presents an analysis of the impact of the electrical distance between grid-connected PV farms and the control parameters on the OLMR by using the results of the calculation examples. The electrical distance between nodes represents the closeness of the connection between them, which is jointly determined by the physical distance and the connection mode between nodes. The system structure is shown in Figure 6. The system parameters and PV farm parameters are provided in the Appendix. In this study, the model building and non-linear simulation are completed by code programming in M-file of MATLAB, and the non-linear simulation is obtained using the improved Euler method.
5.1 Influence of OLMR on Oscillation Stability
The open-loop modes of the subsystems of the two PV farms can be calculated using Eq. 15. As their mathematical models, control parameters, and operating states are essentially the same, the oscillation modes of the open-loop subsystems are also the same. Under the current situation, two groups of oscillation modes were mainly examined. The specific values and damping are shown in Table 1, which shows that the damping of the oscillation mode dominated by the PLL is smaller than that dominated by the DC voltage outer loop and the real part is closer to the virtual axis. As this study was focused on the stability of grid-connected PV farms, only the oscillation mode dominated by the PLL with weaker damping was considered.
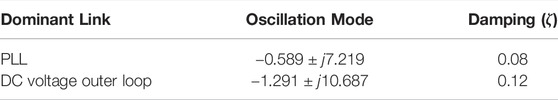
TABLE 1. Open-loop oscillation modes of the PV farm.
Considering the main grid as an infinite system, the PV power generation system shown in Figure 6 can be regarded as a closed-loop interconnected system composed of two PV farm subsystems. The dominant modes

FIGURE 7. OLMR phenomenon of
As can be observed in Figure 7, when OLMR occurs, a closed-loop mode would appear on the right side of the open-loop mode, and the damping decreases, that is, the oscillation stability of the closed-loop system decreases as compared with that in the open-loop system.
In order to study the influence of PV power generation variation on the OLMR, low-power generation (PPV1 = PPV2 = 0.39 p. u.) and high-power generation (PPV1 = PPV2 = 0.61 p. u.) are considered. The PLL dominant modes
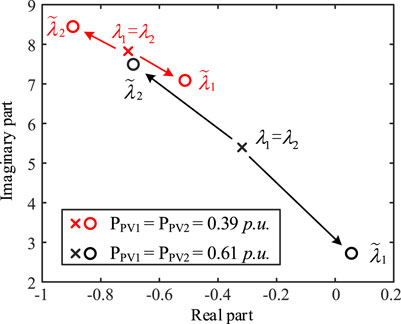
FIGURE 8. OLMR phenomenon of
5.2 Impact of Electrical Distance Between Grid-Connected PV Farms on System Stability
For a PV power generation system with two PV farms, the electrical distance between the grid-connected PV farms is an important factor affecting the system’s oscillation stability.
To study the impact of different electrical distances on the system stability, the distance between two PV farms is gradually increased, that is, the values of
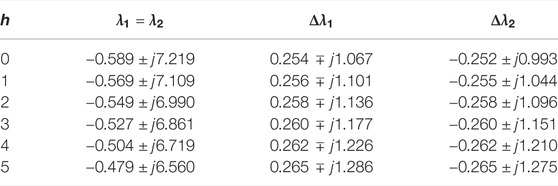
TABLE 2. Calculation results for increasing electrical distance between PV farms.
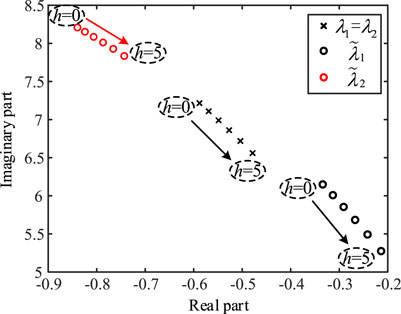
FIGURE 9. Trajectories of open and closed-loop mode with increasing electrical distance between the PV farms.
According to the results shown in Table 2 and Figure 9, as the electrical distance between grid-connected PV farms increases, the open-loop oscillation mode damping, dominated by the PLL, decreases. The offset (
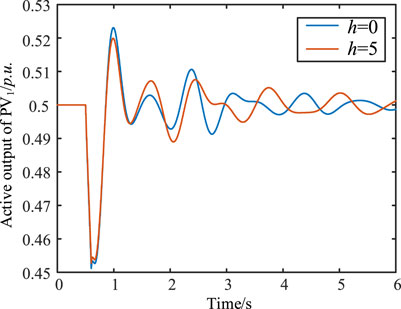
FIGURE 10. Non-linear simulation results of the active power output of PV1 when the electrical distance between PV farms increases.
5.3 Impact of Electrical Distance Between Each PV Farm and Main Grid on System Stability
The electrical distance between each of the PV farms and the main grid was adjusted, without changing the electrical distance between the PV farms, and its stability was then studied.
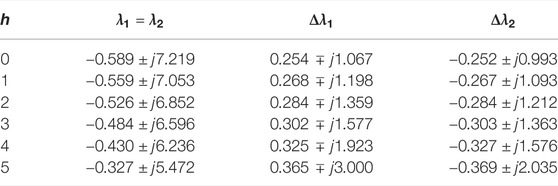
TABLE 3. Calculation results when
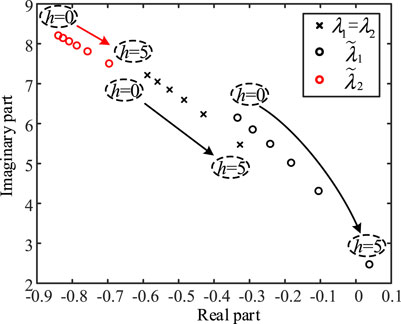
FIGURE 11. Trajectories of the open and closed-loop mode when
As indicated by the results shown in Table 3 and Figure 11, when
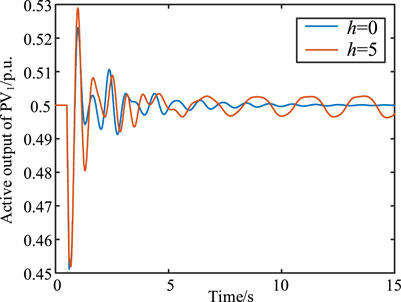
FIGURE 12. Non-linear simulation results of the active power output of PV1 when
The obtained results indicate that the increasing electrical distance between the PV farms and
5.4 Impact of Re-Tuning Parameters Using Participation Factor
To improve the phenomenon of system instability caused by an increase in
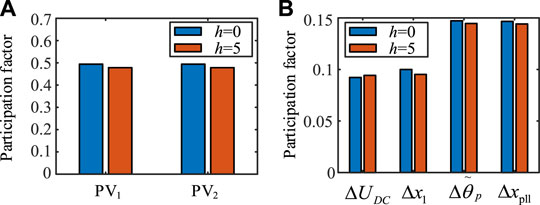
FIGURE 13. (A) Participation factor of
Control parameters are also important factors that affect the resonant intensity of the open-loop mode. To improve the stability of the system when h = 5, the OLMR intensity needs to be reduced. As shown in Figure 13, the
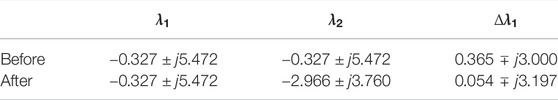
TABLE 4. Calculation results before and after parameter adjustments.
The same system disturbance was set for the nonlinear simulation of the system. Figure 14 shows the simulation result of the PV1 active power output. Thus, after parameter adjustment, the system can remain stable after a disturbance, and the system stability is improved; this is consistent with the model analysis result. Evidently, the reduction of the PLL bandwidth can compensate for greater electrical distance.
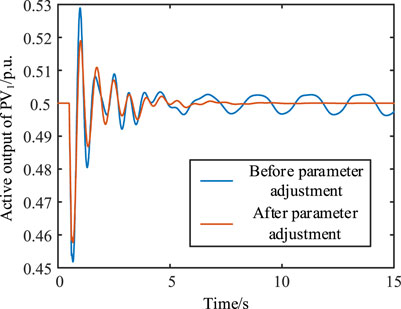
FIGURE 14. Non-linear simulation results of the active power output of PV1 before and after parameter adjustments.
5.5 Electrical Distance between Each PV Farm and Main Grid Kept Unchanged
To further determine the impact of the electrical distance between grid-connected PV farms, as well as between each of the PV farms and the main grid, the electrical distance between each PV farm and the main grid was kept unchanged while increasing the electrical distance between PV farms. The specific adjustment scheme is as follows. The PV power generation system in this example can be considered as composed of two PV farms in parallel. According to the relevant knowledge of circuit principles,
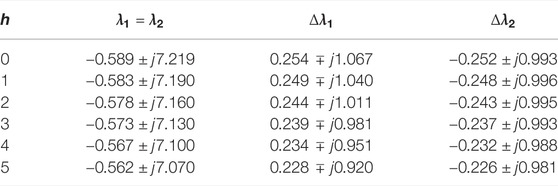
TABLE 5. Calculation results when the electrical distance between each of PV farms and the main grid remains unchanged.
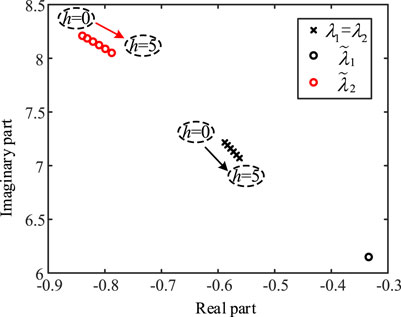
FIGURE 15. Trajectories of the open and closed-loop mode when the electrical distance between each of the PV farms and the main grid remains unchanged.
Table 5 and Figure 15 indicate that the damping of the open-loop oscillation mode dominated by the PLL changes slightly, and the resonant intensity is weakened when the electrical distance between each of the PV farms and the main grid is constant with increasing electrical distance between the PV farms. Additionally, increasing the electrical distance between each of the grid-connected PV farms and the main grid has a greater effect on the OLMR intensity as compared with that between individual grid-connected PV farms. In addition, the closed-loop oscillation mode near the virtual axis led by the PLL is essentially stationary in the complex plane when the electrical distance between each of PV farms and the main grid is constant; this implies that the risk of instability of PV power generation system would not increase.
A non-linear simulation of the system was performed with the fault setting such that the active power output of PV1 decreases by 15% at 0.5 s and returns to normal after 0.1 s. Figure 16 shows the non-linear simulation results of the PV1 active power output. When h = 0 and 5, its response characteristics are essentially consistent. This is in agreement with the results of the eigenvalue analysis.
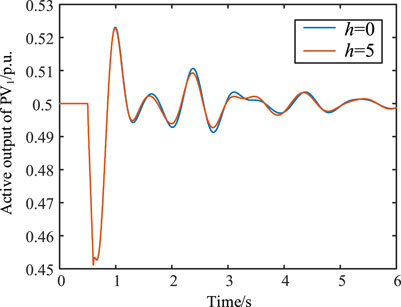
FIGURE 16. Non-linear simulation results of the active power output of PV1 when the electrical distance between each of the PV farms and the main grid remains unchanged.
To verify that the oscillation stability of the system is affected when the electrical distance between each of the PV farms and the main grid is constant, the PV power generation system shown in Figure 6 was adjusted. The number of PV farms was increased to 9 in parallel, and a centralized external transmission was also adopted. The active power output of each PV farm was adjusted to 0.1 p. u. In the new system, the electrical distance between each PV farm and the main grid remained unchanged, that is,
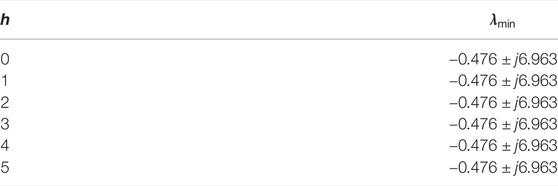
TABLE 6. Calculation results of.
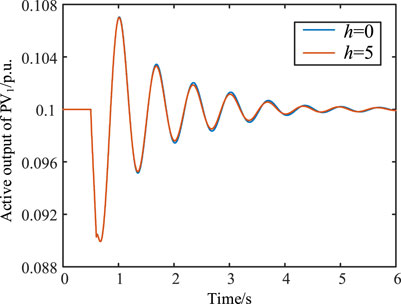
FIGURE 17. Non-linear simulation results of the active power output of PV1 in the new system.
The results shown in Table 6 and Figure 17 verify that under the conditions of changing the number and operating level of grid-connected PV farms, as long as the electrical distance between each of PV farms and the main grid remains unchanged, the PV power generation system would not increase the risk of instability. This finding can be applied to the planning and design of PV farms. In the practical situation, the number and location of PV farms planned according to the PV power generation system are combined with the electrical distance to design the location of the connection point, thus potentially improving the oscillation stability of the system.
5.6 Discussion
As indicated by the afore described results, when OLMR occurs in the PV power generation system, there is a corresponding closed-loop mode with reduced damping, which reduces the system stability. It is determined that increasing PV power generation reduces system stability, which is consistent with the conclusion of Eftekharnejad (Eftekharnejad et al., 2013). Increasing the electrical distance between grid-connected PV farms and between each of grid-connected PV farms and the main grid reduces the strength of the power grid, which will increase the OLMR intensity and thus reduces the stability of the PV generation system. Evidently, the findings herein confirm the relevant conclusions by prior studies (Huang et al., 2015; Xia et al., 2018; Malik et al., 2019). It has been proposed that increased PLL bandwidth would decrease stability (Céspedes and Sun, 2011; Liu et al., 2021). In this study, PLL parameters were re-tuned to reduce PLL bandwidth and improve system stability. The electrical distance between each of the PV farms and the main grid remained unchanged by adjusting the external transmission distance of the PV system when the distance between PV farms increases, so that the stability of the system will not be affected.
6 Conclusion
On the basis of the OLMR theory of the mode analysis method, this study examined the impact of the electrical distance between grid-connected PV farms in an actual PV power generation system. The main conclusions of this study are summarized as follows.
When the OLMR occurs in a PV power generation system, there may be a weakly damped or negatively damped closed-loop mode, which implies that the stability of the system would decrease.
With the increase in the electrical distance between the grid-connected PV farms as well as between each of the grid-connected PV farms and the main grid, the intensity of the OLMR would increase, which may lead to the appearance of negative damping mode
By re-tuning the control parameters (Kp: 0.005→0.03, Ki: 0.2→0.1) of the PLL, the open-loop modal resonant condition is not satisfied; this can effectively improve the closed-loop mode damping (−0.015→0.119). A constant electrical distance between each of the grid-connected PV farms and the main grid would not affect the oscillation stability of the PV power generation system.
The aforedescribed research findings can guide the grid-connected planning of large-scale PV power generation. In practice, the number and location of PV farms planned according to the PV power generation system can be combined with the consideration of electrical distance to design the location of the connection point, thus improving the oscillation stability of the system.
This study focused only on the influence of electrical distance on the OLMR when the PV power generation system adopts a parallel structure. There is no systematic study on the more complex chain structure; however, it is evidently a greater challenge because the electrical distance between each of PV farms and the main grid in the chain case is different.
Data Availability Statement
The original contributions presented in the study are included in the article/Supplementary Material, further inquiries can be directed to the corresponding author.
Author Contributions
BZ proposed this research direction and assigned the work. PS determined the research method and completed the main work. The rest of the work is done by YX and ZZ.
Funding
“This work is supported by the Science and Technology Project of State Grid Sichuan Electric Power Company (No.52199720002S)”.
Conflict of Interest
BZ, PS, YX and ZZ were employed by State Grid Sichuan Electric Power Company.
Publisher’s Note
All claims expressed in this article are solely those of the authors and do not necessarily represent those of their affiliated organizations, or those of the publisher, the editors and the reviewers. Any product that may be evaluated in this article, or claim that may be made by its manufacturer, is not guaranteed or endorsed by the publisher.
Appendix
The system parameters shown in Figure 6 were as follows. The system base value was Sb = 100 MW. The power generation of PV1 and PV2 were 0.5 p. u. and 0.5 p. u., respectively. The transmission line impedances were Z1,2 = 0.01 + j0.1 p. u. and Z3 = 0.04 + j0.4 p. u., respectively.
The filter reactance of PV farms was
In order to relate PI controller parameters to physical implementation, the bandwidth of each controller is given. The corresponding controller bandwidths for DC-link voltage, current control and PLL were 0.758, 45.212 and 0.696 Hz. The results obtained are calculated on the basis of a prior study (Teodorescu et al., 2011).
References
Abubakr, H., Vasquez, J. C., Mahmoud, K., Darwish, M. M. F., and Guerrero, J. M. (2022). Comprehensive Review on Renewable Energy Sources in Egypt-Current Status, Grid Codes and Future Vision. IEEE Access 10, 4081–4101. doi:10.1109/ACCESS.2022.3140385
Ali, E. S., El-Sehiemy, R. A., Abou El-Ela, A. A., Mahmoud, K., Lehtonen, M., Darwish, M. M. F., et al. (2021). An Effective Bi-stage Method for Renewable Energy Sources Integration into Unbalanced Distribution Systems Considering Uncertainty. Processes 9, 471. doi:10.3390/pr9030471
Bendary, A. F., Abdelaziz, A. Y., Ismail, M. M., Mahmoud, K., Lehtonen, M., and Darwish, M. M. F. (2021). Proposed ANFIS Based Approach for Fault Tracking, Detection, Clearing and Rearrangement for Photovoltaic System. Sensors 21, 2269. doi:10.3390/s21072269
Céspedes, M., and Sun, J. (2011). “Modeling and Mitigation of Harmonic Resonance between Wind Turbines and the Grid,” in 2011 IEEE Energy Conversion Congress and Exposition, Phoenix, AZ, USA, 17-22 Sept. 2011, 2109–2116. doi:10.1109/ECCE.2011.6064047
Chen, C., Du, W., Wang, L. A., and Wang, H. (2019). Mechanism Investigation of Sub-synchronous Oscillations in Power Systems as Caused by Multi-Modal Resonance within DFIG-Based Wind Farm. Proc. CSEE 39, 642–651. doi:10.13334/j.0258-8013.pcsee.181319
Donaldson, D. L., Piper, D. M., and Jayaweera, D. (2021). Temporal Solar Photovoltaic Generation Capacity Reduction from Wildfire Smoke. IEEE Access 9, 79841–79852. doi:10.1109/ACCESS.2021.3084528
Du, W., Bi, J., and Wang, H. (2018). Damping Degradation of Power System Low-Frequency Electromechanical Oscillations Caused by Open-Loop Modal Resonance. IEEE Trans. Power Syst. 33, 5072–5081. doi:10.1109/TPWRS.2018.2805187
Du, W., Chen, X., and Wang, H. F. (2017). Power System Electromechanical Oscillation Modes as Affected by Dynamic Interactions from Grid-Connected PMSGs for Wind Power Generation. IEEE Trans. Sustain. Energy 8, 1301–1312. doi:10.1109/TSTE.2017.2677094
Du, W., Ma, Z., Wang, Y., and Wang, H. F. (2020). Harmonic Oscillations in a Grid-Connected PV Generation Farm Caused by Increased Number of Parallel-Connected PV Generating Units and Damping Control. CSEE JPES. doi:10.17775/CSEEJPES.2020.02790
Eftekharnejad, S., Vittal, V., Heydt, G. T., Keel, B., and Loehr, J. (2013). Small Signal Stability Assessment of Power Systems with Increased Penetration of Photovoltaic Generation: A Case Study. IEEE Trans. Sustain. Energy 4, 960–967. doi:10.1109/TSTE.2013.2259602
Emara, D., Ezzat, M., Abdelaziz, A. Y., Mahmoud, K., Lehtonen, M., and Darwish, M. M. F. (2021). Novel Control Strategy for Enhancing Microgrid Operation Connected to Photovoltaic Generation and Energy Storage Systems. Electronics 10, 1261. doi:10.3390/electronics10111261
Harasis, S., Sozer, Y., and Elbuluk, M. (2021). Reliable Islanded Microgrid Operation Using Dynamic Optimal Power Management. IEEE Trans. Ind. Appl. 57, 1755–1766. doi:10.1109/TIA.2020.3047587
Huang, Y., Yuan, X., Hu, J., and Zhou, P. (2015). Modeling of VSC Connected to Weak Grid for Stability Analysis of DC-Link Voltage Control. IEEE J. Emerg. Sel. Top. Power Electron. 3, 1193–1204. doi:10.1109/JESTPE.2015.2423494
Ibrahim, S. A., Nasr, A., and Enany, M. A. (2021). Maximum Power Point Tracking Using ANFIS for a Reconfigurable PV-Based Battery Charger under Non-uniform Operating Conditions. IEEE Access 9, 114457–114467. doi:10.1109/ACCESS.2021.3103039
Khasim, S. R., C, D., Padmanaban, S., Holm-Nielsen, J. B., and Mitolo, M. (2021). A Novel Asymmetrical 21-Level Inverter for Solar PV Energy System with Reduced Switch Count. IEEE Access 9, 11761–11775. doi:10.1109/ACCESS.2021.3051039
Kou, G., Chen, L., VanSant, P., Velez-Cedeno, F., and Liu, Y. (2020). Fault Characteristics of Distributed Solar Generation. IEEE Trans. Power Deliv. 35, 1062–1064. doi:10.1109/TPWRD.2019.2907462
Kumar, M., and Tyagi, B. (2021). A Robust Adaptive Decentralized Inverter Voltage Control Approach for Solar PV and Storage-Based Islanded Microgrid. IEEE Trans. Ind. Appl. 57, 5356–5371. doi:10.1109/TIA.2021.3094453
Liu, J., Du, X., Liu, Y., Li, D., Zhang, B., and Tong, C. (2021). “A New Control Strategy Based on PLL to Enhance System Stability under Varying Output Power in Weak Grids,” in 2021 IEEE Energy Conversion Congress and Exposition (ECCE), Vancouver, BC, Canada, 10-14 Oct. 2021, 335–339. doi:10.1109/ECCE47101.2021.9595914
Mahmoud, K., and Lehtonen, M. (2021). Comprehensive Analytical Expressions for Assessing and Maximizing Technical Benefits of Photovoltaics to Distribution Systems. IEEE Trans. Smart Grid 12, 4938–4949. doi:10.1109/TSG.2021.3097508
Mahmoud, K., and Lehtonen, M. (2020). Three-Level Control Strategy for Minimizing Voltage Deviation and Flicker in PV-Rich Distribution Systems. Int. J. Electr. Power & Energy Syst. 120, 105997. doi:10.1016/j.ijepes.2020.105997
Malik, S. M., Sun, Y., Ai, X., Chen, Z., and Wang, K. (2019). Small-Signal Analysis of a Hybrid Microgrid with High PV Penetration. IEEE Access 7, 119631–119643. doi:10.1109/ACCESS.2019.2937123
Mansouri, M. M., Hadjeri, S., and Brahami, M. (2021). New Method of Detection, Identification, and Elimination of Photovoltaic System Faults in Real Time Based on the Adaptive Neuro-Fuzzy System. IEEE J. Photovoltaics 11, 797–805. doi:10.1109/JPHOTOV.2021.3051145
Moradi-Shahrbabak, Z., and Tabesh, A. (2018). Effects of Front-End Converter and DC-Link of a Utility-Scale PV Energy System on Dynamic Stability of a Power System. IEEE Trans. Ind. Electron. 65, 403–411. doi:10.1109/TIE.2017.2721902
Priyadarshi, N., Padmanaban, S., Holm-Nielsen, J. B., Blaabjerg, F., and Bhaskar, M. S. (2020). An Experimental Estimation of Hybrid ANFIS-PSO-Based MPPT for PV Grid Integration under Fluctuating Sun Irradiance. IEEE Syst. J. 14, 1218–1229. doi:10.1109/JSYST.2019.2949083
Quan, X., Yu, R., Zhao, X., Lei, Y., Chen, T., Li, C., et al. (2020). Photovoltaic Synchronous Generator: Architecture and Control Strategy for a Grid-Forming PV Energy System. IEEE J. Emerg. Sel. Top. Power Electron. 8, 936–948. doi:10.1109/JESTPE.2019.2953178
Tan, Y. T., Kirschen, D. S., and Jenkins, N. (2004). A Model of PV Generation Suitable for Stability Analysis. IEEE Trans. Energy Convers. 19, 748–755. doi:10.1109/TEC.2004.827707
Teodorescu, R., Liserre, M., and Rodriguez, P. (2011). Grid Converters for Photovoltaic and Wind Power Systems. Hoboken, NJ, United States: John Wiley & Sons.
Wang, B., Xie, X., Ding, W., Yang, D., Ying, L., and Zhu, G. (2021). “Optimization of Retail Packages Adapted to the Electricity Spot Market with the Goal of Carbon Peak and Carbon Neutrality,” in 2021 IEEE 4th International Conference on Renewable Energy and Power Engineering (REPE), Beijing, China, 9-11 Oct. 2021, 311–317. doi:10.1109/REPE52765.2021.9617090
Xia, Y., Yu, M., Wang, X., and Wei, W. (2019). Describing Function Method Based Power Oscillation Analysis of LCL-Filtered Single-Stage PV Generators Connected to Weak Grid. IEEE Trans. Power Electron. 34, 8724–8738. doi:10.1109/TPEL.2018.2887295
Keywords: photovoltaic (PV), open-loop modal resonance, low-frequency oscillation, PV farms, electrical distance
Citation: Zhou B, Shi P, Xu Y and Zeng Z (2022) Impact of Electrical Connection Distance on the Open Loop Modal Resonance of Grid Connected Photovoltaic Farms. Front. Energy Res. 10:872143. doi: 10.3389/fenrg.2022.872143
Received: 09 February 2022; Accepted: 22 April 2022;
Published: 17 May 2022.
Edited by:
K. Sudhakar, Universiti Malaysia Pahang, MalaysiaReviewed by:
Mohamed M. F. Darwish, Aalto University, FinlandMinh Quan Duong, University of Science and Technology, The University of Danang, Vietnam
Terence O’Donnell, University College Dublin, Ireland
Karar Mahmoud, Aswan University, Egypt
Copyright © 2022 Zhou, Shi, Xu and Zeng. This is an open-access article distributed under the terms of the Creative Commons Attribution License (CC BY). The use, distribution or reproduction in other forums is permitted, provided the original author(s) and the copyright owner(s) are credited and that the original publication in this journal is cited, in accordance with accepted academic practice. No use, distribution or reproduction is permitted which does not comply with these terms.
*Correspondence: Peng Shi, 810165147@qq.com