 Pawat Wattanachareekul1
 Montri Choowong
- 1Department of Geology, Center of Excellence for the Morphology of Earth Surface and Advanced Geohazards in Southeast Asia (MESA CE), Faculty of Science, Chulalongkorn University, Bangkok, Thailand
- 2Department of Geography, Faculty of Arts, Chulalongkorn University, Bangkok, Thailand
In Southeast Asian countries, flooding is common and occurs a few weeks after tropical storms. In Thailand, the government’s approach to dealing with flooding is focused on the construction of anthropogenic megastructures. The loss of life, property, and ecosystem from flooding still occurs and will likely become increasingly more severe soon due to global climate variation. Here, in this brief report, we show a case study analyzing the cause of unusual flooding that occurred from September to November 2021 during the tropical depression “Dianmu” and the tropical cyclone “Kompasu” that hit the Khorat Plateau, northeastern Thailand. These two tropical storms left behind vast flooded urban and agricultural areas in the upstream part of the Chi River on this, the largest plateau in mainland Southeast Asia. The flood water stagnated for a month and unusually drained downslope in the upstream zone. In this work, a series of free online access satellite images taken by the Sentinel-1 C band GRD and Sentinel-2 available in the Google Earth engine platform was analyzed. As a result, we confirmed that the normal nature of water flow was problematic due to the presence of anthropogenic structures, especially roads. The installation of different design and dimensions of culverts are urgently recommended, particularly in the floodplain zone. The quick responsible idea provided in this paper highlights and simplifies the resilience to future extreme weather events of the rural community and ecosystem.
1. Introduction
Floods were counted as the most frequent type of disaster with 43% of all recorded events from 1998 to 2017 (United Nations Office for Disaster Risk Reduction, 2018). From early September to November 2021, the tropical depression “Dianmu,” which originated from the South China Sea, made landfall on the Vietnamese coast, then struck westwards to Laos PDR and ended at the Khorat Plateau, northeastern Thailand. Dianmu left behind a water volume (average of 27 mm/day in early September) that was slightly higher than the average rate (about 17 mm/day) of monsoon rain in Thailand (Rain Water, 2021). The subsequent flooding devastated agricultural areas, ecosystems, transportation routes, and properties in the western part of the Khorat Plateau, especially the upstream part of the Chi River catchment basin on the dip slope of the cuesta. This massive volume of water slowly flowed downstream with a longer flooding period (4–6 weeks) than in a normal year (basically 1–2 weeks), even though the topographical slope of the western part of the basin is high (10–15 degrees). Later in November, the tropical cyclone “Kompasu,” generated in the Pacific Ocean, moved westwards to the South China Sea and made landfall in northern Vietnam (Figure 1A). The water level in the Chi River once again increased and led to an unusual expansion of the floodplain boundary. Two provinces (Chaiyaphum and Khon Kaen) inside the Chi River’s floodplain were severely flooded (Arunyanart et al., 2017; Vanichsan and Taesombat, 2022). We hypothesized that there were either natural or anthropogenic factors that caused this unusual water flow behavior.
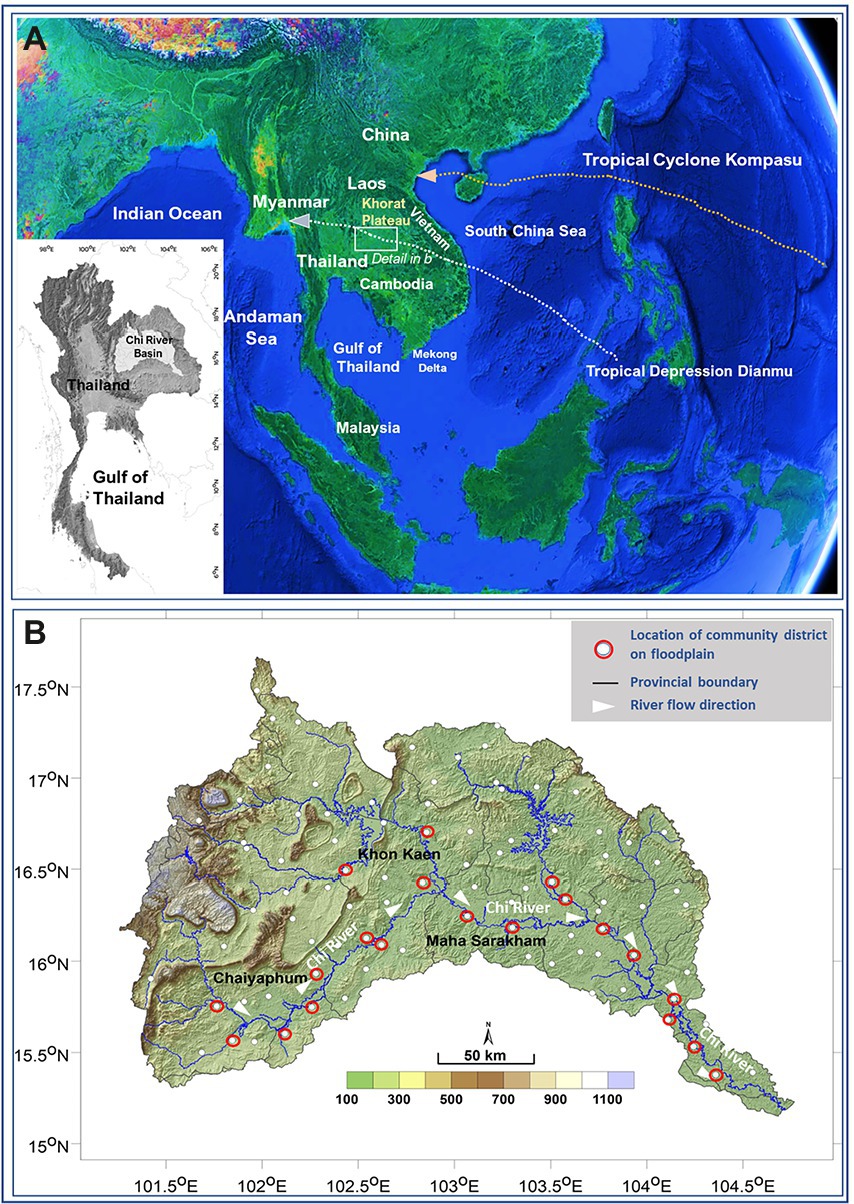
Figure 1. Maps showing the location of the Khorat Plateau in mainland Southeast Asia and the geographical names referred to in this brief report. (A) The Chi River catchment basin is found in northeast Thailand (grey shaded area in left corner index map), storm tracts of Dianmu and Kompasu (dashed lines with triangle direction of the storm). (B) Digital Elevation Model (DEM) of the Chi River catchment basin showing the upstream part from the highlands in the western part. The river flows in a northeastern direction (white arrow) covering the southern part of Chaiyaphum, extending to Khon Kaen, and then flows in a southeast direction.
This brief report emphasized the application of satellite images on the Google Earth platform, and analysis of the free, online-access Sentinel-1 and Sentinel-2 images. The optical remote sensing received image data from a spectral sensor in the range of short-wave infrared through to ultraviolet. It can be applied for flood monitoring because the infrared band reflectance on the water is low, while the reflectance of the green and red bands on the water is high. However, optical remote sensing has the limitation that it is unable to detect flooded areas in severe weather, such as a high percentage of cloud cover (Arusha and Bharathi, 2019). In contrast, the image from radar remote sensing is generated from a spectral sensor in the microwave range that can penetrate in every condition (Refice et al., 2018).
Recently, optical and radar remote sensing was found suitable for flood management and mapping (Refice et al., 2018). Synthetic aperture radar (SAR) is the most used technology for imaging radars in every weather zone and has been used for flood monitoring since the 1990s (Curlander and McDonough, 1991). This method has been employed to detect river floods in many countries of the world, including Bangladesh (Uddin et al., 2019), Canada (Brisco et al., 2019), China (Dong et al., 2021), Eastern Europe (Gan et al., 2012), Germany (Martinis and Rieke, 2015), and the United Kingdom (Martinis et al., 2009). Moreover, SAR can be assessed using many free online datasets, such as Sentinel-1, TerraSAR-X, RADARSAT-2, and COSMO-SkyMed (Pulvirenti et al., 2016).
Several methods of SAR-based analyses have been employed for flood monitoring, such as statistical active contouring (Horritt et al., 2001), the application of neural networks in a grid system (Kussul et al., 2008), pixel-based segmentation (Martinis et al., 2009), fractal dimensioning of multi-temporal images (Huang et al., 2011), texture analysis (Senthilnath et al., 2013; Pradhan et al., 2014; Sghaier et al., 2018), thresholding (Long et al., 2014), changes detection (Long et al., 2014), and clustering and classification (Twele et al., 2016; Martinis et al., 2018). All these methods use only one image to classify flooded areas. The change detection aims to compare the flood scene to an earlier dry image to classify the flooded area (Giustarini et al., 2015; Schlaffer et al., 2015). In addition, the change detection methods can be combined with other methods for classifying a flooded area that has an unusually low backscatter value (Clement et al., 2018). Thus, the aims of this work are set up to analyze the cause of unusual and long flood periods and to provide a simple way how to return the water flow to the normal rate.
2. Materials and methods
2.1. Study area
In this brief report, the case study area is focused on the Chi River catchment basin, in northeastern Thailand. The Chi River is one of the two main rivers on the Khorat Plateau. The study is bound in the upstream part of the Chi River catchment. The Chi River is 765 km long with the upstream position on the back slope of a cuesta, where the slope is gentle, being about 150 km in length and situated in the Phetchabun mountain range, flowing eastwards through the center of northeastern Thailand (via Chaiyaphum, Khon Kaen, and Maha Sarakham provinces; Figure 1A). After that, the Chi River turns south in Roi Et, runs through Yasothon, and joins the Mun River in the Kanthararom district of Srisaket province. With such a long length, flooding often occurs within the Chi River floodplain. Several flood analyses of the Chi River have been reported from Chaiyaphum and Khon Kaen provinces (Kuntiyawichai et al., 2008; Arunyanart et al., 2017; Waiyasusri and Chotpantarat, 2020; Sakmongkoljit et al., 2021); however, none of the SAR data for this river catchment basin has been analyzed so far. Moreover, we also analyzed the satellite dataset from the middle and downstream parts of the river to help synthesize the behavior of the September 2021 flood throughout the entire catchment. We separated the catchment basins into five sub-areas: A1 (Chaiyaphum), A2 (Chonnabot and Ban Phai District), A3 (Khon Kaen), A4 (Downstream area of Ubol Rattana dam), and A5 (Maha Sarakham; Figure 1B). The upstream part includes sub-areas A1 to A3.
2.2. Satellite dataset
The SAR from the Sentinel-1 dataset taken between September and November 2021 that covers Chaiyaphum, Khon Kaen, and Maha Sarakham provinces were selected. The change detection and thresholding (CDAT) method was based on Long et al. (2014). This study used the Sentinel-1 data available from the European Space Agency Copernicus program, which consists of two satellites: Sentinel 1-A (Operated in April 2014) and Sentinel 1-B (Operated in April 2016). The satellites are in opposite polar sun-synchronous orbits at an altitude of 693 km, with a repeat cycle of 12 days, having 175 orbits. This results in a repeat frequency of 24 h at high latitudes and 3 days at the equator. The SAR system runs within C-band (5.407 GHz) in four modes: strip map (SM), interferometric wide swath (IW), extra-wide swath (EW), and wave (WV). For land surface, the IW swath mode is the most suitable model that acquires data with a 250 km swath at a 5 m by 20 m spatial resolution. It consists of four bands: vertical transmit and vertical receive (VV), vertical transmit and horizontal receive (VH), horizontal transmit and vertical receive (HV), and horizontal transmit and horizontal receive (HH). Each band can be used for flood detection. The cross-polarized band (VH or VV) has more noise and is less efficient for detecting floods than the co-polarized band (HH or VV; Manjusree et al., 2012). However, since the HH and HV bands were not available in our study area, we used the VV band for detecting floods.
The combination of satellite datasets used in this study included the flood extension from remote sensing and hydrology data. For the remote sensing data, we used the Sentinel-1 C band GRD collection provided by the Google Earth Engine (GEE) cloud computing platform. All scenes in this dataset have been pre-processed with the Sentinel-1 toolbox that consists of thermal noise removal, radiometric calibration, terrain correction, and converting backscatter coefficient to decibels (dB). In this study, we employed VV polarize band images that were taken on August 28, 2021; September 9, 2021; September 21, 2021; September 27, 2021; October 3, 2021; October 15, 2021; October 21, 2021; October 27, 2021; November 2, 2021; November 8, 2021; November 20, 2021; and November 26, 2021.
The analysis of the flood extent was divided into six steps. First was the selection of the VV band and then the next step was to speckle filter it using the focal method. The third step was to create a different image between the reference image (pre-flooded image taken on August 28, 2021) and the flooded image that was taken from September 9 to December 8, 2021. The fourth step was to identify any potentially flooded area from the different images. The fifth step was to perform model validation. In this study, we used the sentinel-2 image that was taken on October 25, 2021, to validate the flooded area on October 27, 2021, that was generated from the Sentinel-1 C band GRD collection. Finally, the last step was to interpret any potentially flooded area with the daily rainfall data.
2.3. Rainfall data
The daily rainfall (mm/day) was collected from the Department of Royal Rainmaking and Agricultural Aviation of Thailand from September 1, 2021, to December 1, 2021, from five stations (Rain Water, 2021). However, we mainly analyzed the data from three stations in the upstream part of the Chi catchment basin where the flow rate of water was problematic (Figure 2). As seen in the graphs of Figure 2, the daily rainfall in the upstream station (Chaiyaphum) peaked for only 3 days with a 108 mm maximum. Whereas, the frequency of rainfall at the downstream stations (Khon Kaen and Maha Sarakham) was higher.
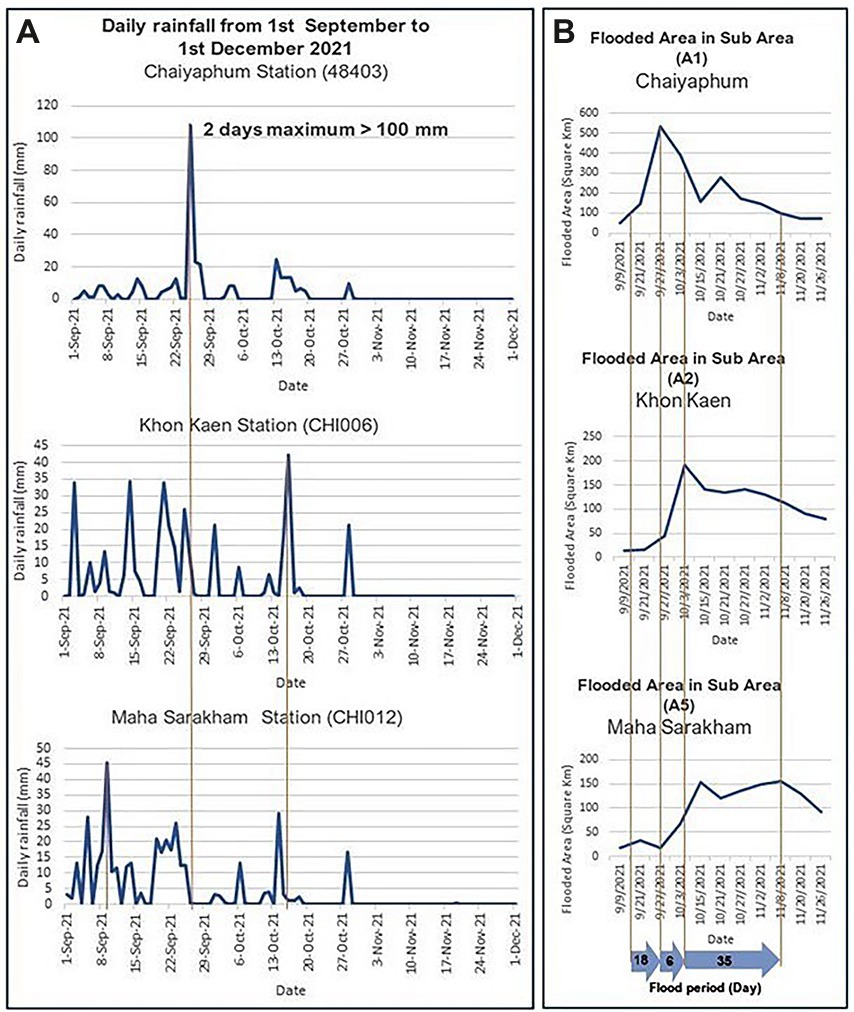
Figure 2. (A) Records of daily rainfall on September 1 to December 1, 2021, from the Chaiyaphum, Khon Kaen, and Maha Sarakham weather stations. Only one dominant peak was recorded at 108 mm (top graph) during September 23–25, 2021 at Chaiyaphum, the upstream part of the catchment. The other two stations, situated downstream from Chaiyaphum, showed several peaks in the range of 25–40 mm/day (Khon Kaen station, middle graph) and an average of 25 mm/day at the Maha Sarakham station (bottom graph). (B) Flood area and periodical records from the three weather stations. Two days of heavy rain with a maximum daily rainfall of 108 mm made a vast flooded area for a few weeks at Chaiyaphum before the water moved to Khon Kaen and reached Maha Sarakham over the next 35 days.
The upstream station (CHI003) is close to Chaiyaphum town. The daily rainfall at this station fluctuated between 1 and 24 September 2021 and then dramatically rose to 108 mm on September 25, which was caused by the Dianmu tropical depression. The tropical rainfall then decreased after September 25, 2021, but increased again on October 13, 2021, due to tropical cyclone Kompasu.
At the Khan Kaen station (CHI006), the daily rainfall (mm) averaged about 7.595 mm/day from 1 September to 16 October 2021. The highest daily rainfall was 42 mm on October 16, 2021, which was caused by tropical depression Dianmu and tropical cyclone Kompasu.
The last station was at Maha Sarakham irrigation dam (CHI007). The daily rainfall in this station averaged about 8.25 mm/day in the period of 1–23 September 2021. The highest daily rainfall in this period was 22.8 mm, which was caused by tropical depression Dianmu. It then sharply decreased but increased rapidly from 0 mm on October 12 to 32.8 mm on October 13, 2021, due to Tropical cyclone Kompasu. Thereafter, the daily rainfall decreased.
2.4. Drainage network and existing roads
The upstream part of the Chi catchment basin is dominated by cuesta with an eastward dipping downslope. The drainage network is mainly concentrated in the western highland. Some networks originate from the mountain in the north with a longer drainage length than the western upstream origin (Pakoksung and Torsakul, 2022).
3. Results and discussion
3.1. Accuracy and advantage of SAR
This case study assessed the accuracy of the model for detecting flooded areas in two periods: October 27 and November 20, 2021. As of October 27, 2021, the Sentinel-2 images taken on October 25 in sub-areas A2, A3, and A5 were analyzed for assessment accuracy. The overall accuracy, producer accuracy of the flooded area, user accuracy of the flooded area, and kappa coefficient were 99.264, 86.992, 93.274% and 0.8964, respectively. The kappa coefficient (0.8964) is extremely high (maximum of 1). Therefore, this model of classifying the flooded area in October 2021 was deemed to be dependable. Moreover, many non-flooded pixels were classified as non-flooded pixels.
As of November 20, 2021, this study used the Sentinel-2 image taken on November 22, 2021, in sub-area A3 for analysis of the accuracy. The overall accuracy, producer accuracy of the flooded area, and user accuracy of the flooded area were 90.909, 44.62, and 44.84%, respectively. The kappa coefficient was only 0.407% and many flooded pixels were classified as non-flooded pixels. The potentially flooded area and the Sentinel-2 image taken on November 22, 2021, showed many non-flooded pixels were classified as flooded pixels (Figure 3A), which may be due to moist soil and surface water in agriculture zones. Areas close to non-flooded areas were also classified as flooded areas (Figure 3B). In addition, non-flooded pixels that were classified as flood pixels first appeared in November 2021.
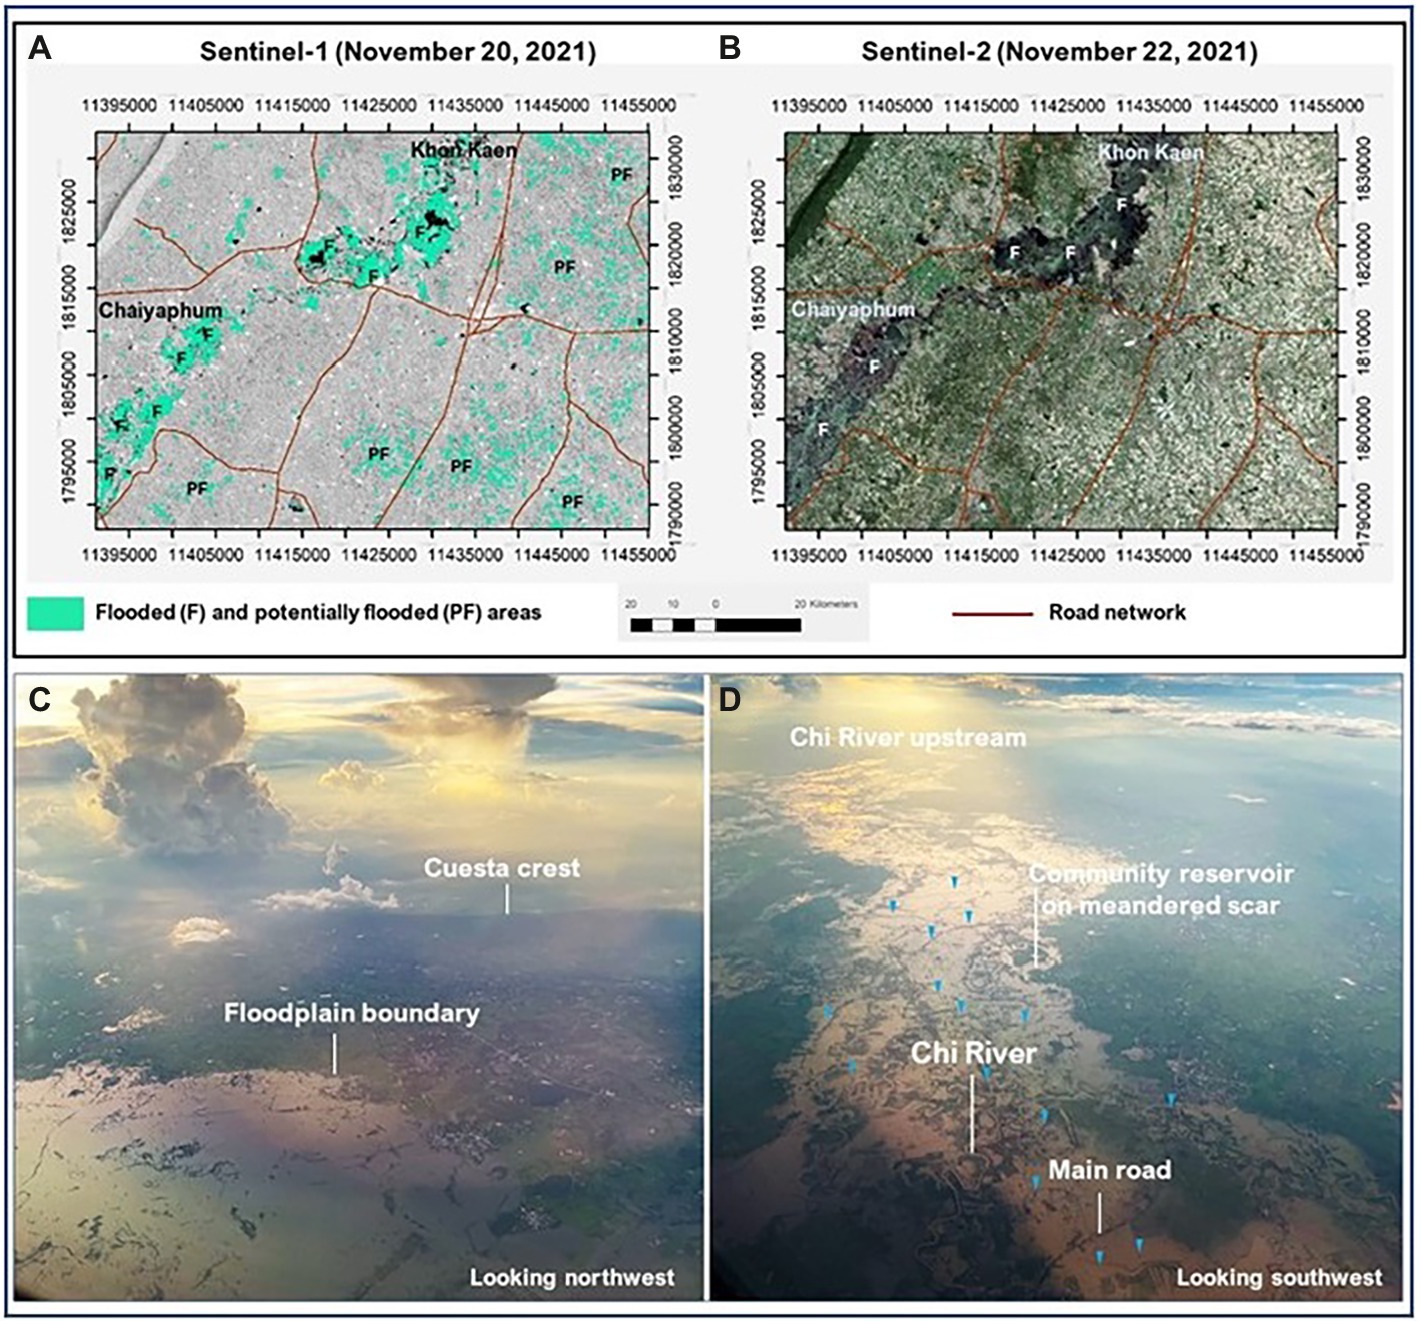
Figure 3. (A) Flooded (F) and potentially flooded (PF) areas interpreted from Sentinel-1 taken on November 20, 2021. (B) The potentially flooded area was not only interpreted along the floodplain of the Chi River (green shade) but also extends to the terrace and the other highlands. Sentinel-2 taken on November 22, 2021, was applied to this study coupled with Sentinel-1 to correct the flooded area. (C) Photos were taken on October 3, 2021, showing aerial views of the 2021 flooding along the upstream part of the Chi River. (D) Mass of flood water on November 22, 2021, originally from cuesta crest. Flooding drowned the towns, and agricultural and industrial areas and stayed for 3 weeks (see also Figure 2B) at Chaiyaphum and then flowed slowly to Khon Kaen.
The classification of flooded pixels from this case study has some advantages. First, this method does not classify usual surface water areas, such as lakes, to be potentially flooded areas because the reference images were taken shortly before the flooding event. Second, the flooded pixels were classified using thresholding. Thus, it holds no bias from visual interpretation. Third, this SAR image-based method can classify potentially flooded areas in every weather situation because SAR can penetrate in all weathers, even under a high percentage of cloud cover.
3.2. Unusual water flow
The water mass had extended from sub-areas A1 and A2 of the upstream area to downstream of the Chi River area and joined with massive rainwater from sub-area A3. The accumulation of water from the upstream area started on September 21, 2021, while sub-areas A2 and A3 accumulated water from the tropical depression Dianmu from September 27 to October 3, 2021, respectively (Figures 3C,D). The water level at A1 went down and the flooded area decreased since October 3, 2021. However, the flooded area in sub-areas A2 and A3 did not decrease in this period. After that, the potentially flooded area in sub-area A1 dramatically rose on October 21, 2021, which was caused by tropical cyclone Kompasu, while the potentially flooded area in sub-areas A2 and A3 in late-October 2021 did not change much from the beginning of October 2021.
As mentioned earlier, the erroneous allocation of non-flooded pixels to flooded pixels in November 2021 may be due to soil moisture and surface water in agriculture zones. However, many flooded pixels in October 2021 were classified as a non-flooded areas. Perhaps, the sum area of the potentially flooded area in September and October 2021 generated from the CDAT method was less than the flooded area.
3.3. Simplified way for reducing the flood period
We recognized that highways and local roads are constructed without proper planning. Although the purpose was to form a transportation network among communities, some roads were built across the stream in such a position as to obstruct the waterway, not only in the floodplain but also in the upstream part (Figure 4A). Undoubtedly, the failure of the anthropogenic construction led to the road becoming a dam or barrier and resulted in a change in the direction of the water flow. This issue has become clear as being important but unfortunately has elicited little concern from responsible decision-makers in different government departments, due to a lack of government agency integration. However, the way to solve this is simple. In places where the water flow is problematic or obstructed by roads, the proper design of culverts underneath the road is recommended (Figure 4B). This recommendation for reducing the flood period is likely simple, on the other hand, it is very significant and can be applied to other areas that have similar landforms. We also suggest that the government and local governors should be concerned about this case study and take into account the mitigation of not only the economic losses but also the reduce the cost of a non-necessary budget for constructing some structures.
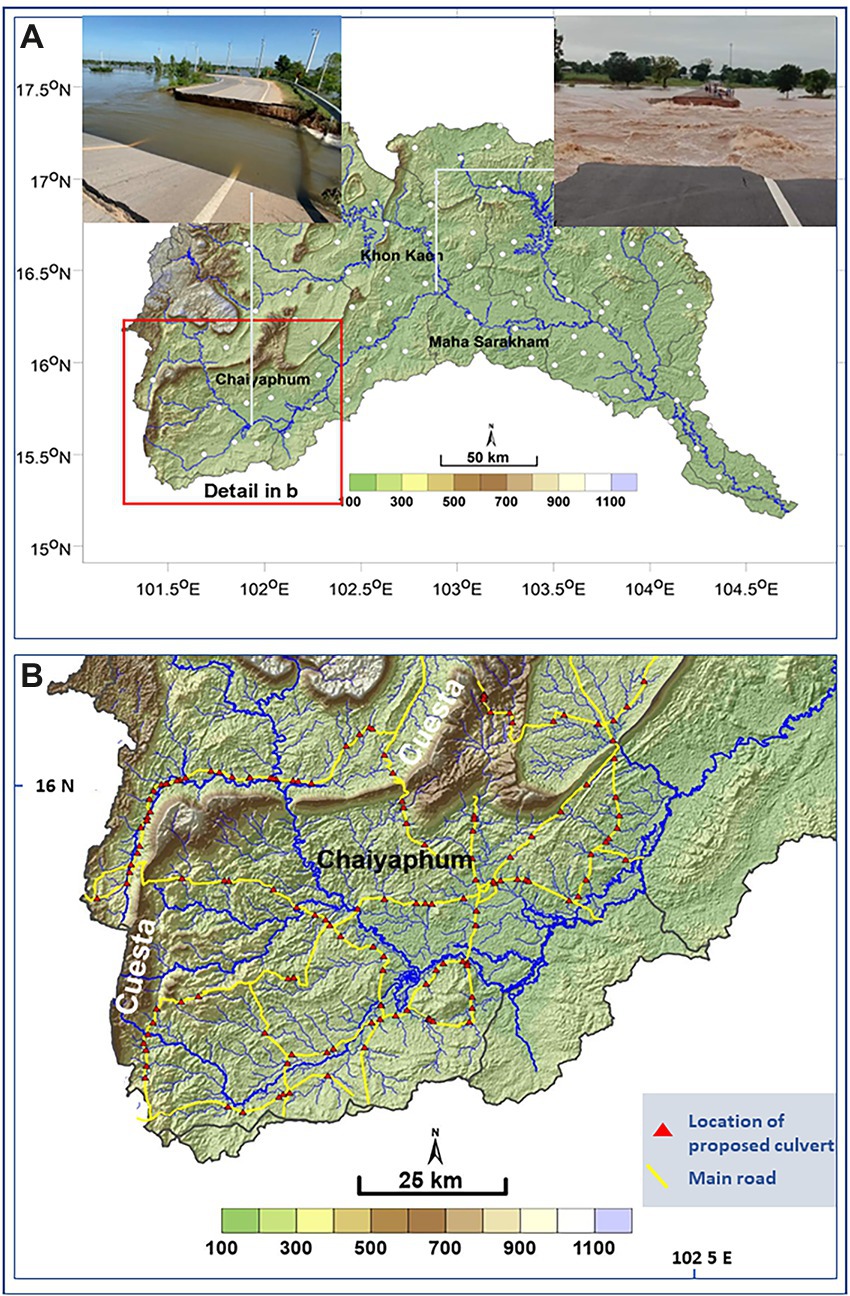
Figure 4. Maps showing anthropogenic structures (roads) constructed across the water flow (A) with aerial pictures showing drowned main roads from Chaiyaphum (left; www.dailynews.co.th) and Khon Kaen (right picture; www.prachachat.net). (B) A close-up of the upstream part of the Chi River catchment basin shows the place where culverts are recommended (red triangle) to return a natural water flow during flooding.
4. Conclusion
The tropical depression and cyclones are the result of global climate variation and commonly produce a direct effect on the Khorat Plateau in mainland Southeast Asia. In the case of the 2021 flooding event at the Chi River floodplain, the water flow on the floodway was problematic. We recognized the disturbance from anthropogenic factors made it clear that the channel planform of the Chi River has a high risk and was, more or less, modified after the November 2021 mega-flooding. After the overall terrain analysis using SAR satellites, we recommend a post-flooding investigation soon after the event, especially in places where infrastructures disturb the water floodway. We found that one of the causes of the unnatural flow of water in this upstream area of the Chi River catchment basin was anthropogenic constructions, especially the inappropriate design of local roads without culverts. Therefore, we provide the specific locations where culverts can be installed to alleviate future flooding in the coming years.
Data availability statement
The original contributions presented in the study are included in the article/supplementary material, further inquiries can be directed to the corresponding author.
Author contributions
PW prepared GIS and conducted satellite analysis. NC edited and drafted the manuscript. SP prepared GIS materials and contributed to discussion. MC wrote and edited the manuscript, provided the figures, and contributed to discussion. All authors contributed to the article and approved the submitted version.
Funding
This Research was funded by Thailand Science Research and Innovation Fund Chulalongkorn University (CU_FRB65_ dis(1)_089_23_19).
Acknowledgments
We would like to thank the Center of Excellence for the Morphology of Earth Surface and Advanced Geohazards in Southeast Asia (MESA CE) for the logistic works and field support.
Conflict of interest
The authors declare that the research was conducted in the absence of any commercial or financial relationships that could be construed as a potential conflict of interest.
Publisher’s note
All claims expressed in this article are solely those of the authors and do not necessarily represent those of their affiliated organizations, or those of the publisher, the editors and the reviewers. Any product that may be evaluated in this article, or claim that may be made by its manufacturer, is not guaranteed or endorsed by the publisher.
References
Arunyanart, N., Limsiri, C., and Uchaipichat, A. (2017). Flood hazards in the Chi River basin, Thailand: impact management of climate change. Appl. Ecol. Environ. Res. 15, 841–861. doi: 10.15666/aeer/1504_841861
Arusha, N., and Bharathi, B. (2019). Flood detection and flood mapping using multi-temporal synthetic aperture radar and optical data. Egyptian J. Rem. Sens. Space Sci. 35, 1–56. doi: 10.1016/j.ejrs.2019.01.001
Brisco, B., Shelat, Y., Murnaghan, K., Montgomery, J., Fuss, C., Olthof, I., et al. (2019). Evaluation of C-band SAR for identification of flooded vegetation in emergency response products. Canadian J. Rem. Sens. 45, 73–87. doi: 10.1080/07038992.2019.1612236
Clement, M. A., Kilsby, C., and Moore, P. (2018). Multi-temporal synthetic aperture radar flood mapping using change detection. J. Flood Risk Manage. 11, 152–168. doi: 10.1111/jfr3.12303
Dong, Z., Wang, G., Amankwah, S. O. Y., Wei, X., Hu, Y., and Feng, A. (2021). Monitoring the summer flooding in the Poyang Lake area of China in 2020 based on Sentinel-1 data and multiple convolutional neural networks. Int. J. Appl. Earth Obs. Geoinf. 102:102400. doi: 10.1016/j.jag.2021.102400
Gan, T. Y., Zunic, F., Kuo, C.-C., and Strobl, T. (2012). Flood mapping of Danube River in Romania using single and multi-date ERS2-SAR images. Int. J. Appl. Earth Obs. Geoinf. 18, 69–81. doi: 10.1016/j.jag.2012.01.012
Giustarini, L., Vernieuwe, H., Verwaeren, J., Chini, M., Hostache, R., Matgen, P., et al. (2015). Accounting for image uncertainty in SAR-based flood mapping. Int. J. Appl. Earth Obs. Geoinf. 34, 70–77. doi: 10.1016/j.jag.2014.06.017
Horritt, M., Mason, D., and Luckman, A. (2001). Flood boundary delineation from synthetic aperture radar imagery using a statistical active contour model. Int. J. Remote Sens. 22, 2489–2507. doi: 10.1080/01431160116902
Huang, S., Cai, X., Chen, S., and Liu, D. (2011). Change detection method based on fractal model and wavelet transform for multitemporal SAR images. Int. J. Appl. Earth Obs. Geoinf. 13, 863–872. doi: 10.1016/j.jag.2011.05.018
Kuntiyawichai, K., Schultz, B., Uhlenbrook, S., and Suryadi, F. (2008). Delineation of flood hazards and risk mapping in the Chi River Basin, Thailand. 10th Inter. Drainage Workshop. 6–11.
Kussul, N., Shelestov, A., and Skakun, S. (2008). Grid system for flood extent extraction from satellite images. J. Earth Sci. Info. 1:105. doi: 10.1007/s12145-008-0014-3
Long, S., Fatoyinbo, T. E., and Policelli, F. (2014). Flood extent mapping for Namibia using change detection and thresholding with SAR. J. Environ. Res. Lett. 9:035002. doi: 10.1088/1748-9326/9/3/035002
Manjusree, P., Kumar, L. P., Bhatt, C. M., Rao, G. S., and Bhanumurthy, V. (2012). Optimization of threshold ranges for rapid flood inundation mapping by evaluating backscatter profiles of high incidence angle SAR images. Inter. J. Dis. Risk Sci. 3, 113–122. doi: 10.1007/s13753-012-0011-5
Martinis, S., Plank, S., and Ćwik, K. (2018). The use of Sentinel-1 time-series data to improve flood monitoring in arid areas. Remote Sens. 10:583. doi: 10.3390/rs10040583
Martinis, S., and Rieke, C. (2015). Backscatter analysis using multi-temporal and multi-frequency SAR data in the context of flood mapping at river Saale, Germany. Remote Sens. 7, 7732–7752. doi: 10.3390/rs70607732
Martinis, S., Twele, A., and Voigt, S. (2009). Towards operational near real-time flood detection using a split-based automatic thresholding procedure on high resolution TerraSAR-X data. Nat. Hazards Earth Syst. Sci. 9, 303–314. doi: 10.5194/nhess-9-303-2009
Pakoksung, K., and Torsakul, C. (2022). Flood simulation of the 2021 Thailand flood in the upstream area of Chi River basin multi resolution flood modeling for a specific area in Chaiyaphum City, Chaiyaphum Province in Thailand. THA 2022 International Conference on Moving Towards Sustainable Water and Climate Change Management After COVID-19. 26–28 January 2022.
Pradhan, B., Hagemann, U., Tehrany, M. S., and Prechtel, N. (2014). An easy to use ArcMap based texture analysis program for extraction of flooded areas from TerraSAR-X satellite image. Comput. Geosci. 63, 34–43. doi: 10.1016/j.cageo.2013.10.011
Pulvirenti, L., Pierdicca, N., Squicciarino, G., Boni, G., Chini, M., and Benedetto, C. (2016). Polarimetric SAR data for improving flood mapping: an investigation over rice flooded fields. IEEE. 7589–7592.
Rain Water (2021). [Online]. Available at: http://rainmaking.royalrain.go.th/Data/Rain_water/report (Accessed December 10, 2021).
Refice, A., D’Addabbo, A., Lovergine, F. P., Tijani, K., Morea, A., Nutricato, R., et al. (2018). “Monitoring flood extent and area through multisensor, multi-temporal remote sensing: the strymonas (Greece) river flood,” in Flood Monitoring Through Remote Sensing. eds. A. Refice, A. D’Addabbo, and D. Capolongo (Springer), 101–113.
Sakmongkoljit, K., Homtong, N., Surakotra, N., and Silaratana, N. (2021). Multi-criteria Flood Susceptibility Assessment Using Remote Sensing and GIS-based Approaches in Chi River Basin, Thailand. IOP Publishing, 012025.
Schlaffer, S., Matgen, P., Hollaus, M., and Wagner, W. J. (2015). Flood detection from multi-temporal SAR data using harmonic analysis and change detection. Int. J. Appl. Earth Obs. Geoinf. 38, 15–24. doi: 10.1016/j.jag.2014.12.001
Senthilnath, J., Shenoy, H. V., Rajendra, R., Omkar, S., Mani, V., and Diwakar, P. J. (2013). Integration of speckle de-noising and image segmentation using synthetic aperture radar image for flood extent extraction. J. Earth Syst. Sci. 122, 559–572. doi: 10.1007/s12040-013-0305-z
Sghaier, O. M., Hammami, I., Foucher, S., and Lepage, R. (2018). Flood extent mapping from time-series SAR images based on texture analysis and data fusion. Remote Sens. 10:237. doi: 10.3390/rs10020237
Twele, A., Cao, W., Plank, S., and Martinis, S. (2016). Sentinel-1-based flood mapping: a fully automated processing chain. Inter. J. Rem. Sens. 37, 2990–3004. doi: 10.1080/01431161.2016.1192304
Uddin, K., Matin, M. A., and Meyer, F. J. (2019). Operational flood mapping using multi-temporal Sentinel-1 SAR images: a case study from Bangladesh. Remote Sens. 11:1581. doi: 10.3390/rs11131581
United Nations Office for Disaster Risk Reduction (2018). Economic Losses, Poverty and Disasters 1889–2017 Centre for Research on the Epidemiology of Disasters, 30.
Vanichsan, D., and Taesombat, W. (2022). A study of potential flood retention areas for storing water use in the dry period in upper Chi River basin. Life Sci. Environ. J. 23, 157–169. doi: 10.14456/lsej.2022.12
Keywords: anthropogenic structures, Chi River, resilience weather events, floodplain, Khorat Plateau
Citation: Wattanachareekul P, Choowong N, Pailoplee S and Choowong M (2023) Resilience to unusual flooding after 2021 tropical storms in part of mainland Southeast Asia. Front. Ecol. Evol. 10:1072993. doi: 10.3389/fevo.2022.1072993
Edited by:
Xiong Zhou, Beijing Normal University, ChinaReviewed by:
Ionut Cristi Nicu, Norwegian Institute for Cultural Heritage Research, NorwaySubhadip Dey, Indian Institute of Technology Kharagpur, India
Copyright © 2023 Wattanachareekul, Choowong, Pailoplee and Choowong. This is an open-access article distributed under the terms of the Creative Commons Attribution License (CC BY). The use, distribution or reproduction in other forums is permitted, provided the original author(s) and the copyright owner(s) are credited and that the original publication in this journal is cited, in accordance with accepted academic practice. No use, distribution or reproduction is permitted which does not comply with these terms.
*Correspondence: Montri Choowong, ✉ montri.c@chula.ac.th