 Megan C. Milligan
 Lance B. McNew
- Department of Animal and Range Sciences, Montana State University, Bozeman, MT, United States
Livestock grazing can shape temperate grassland ecosystems, with both positive and negative effects on wildlife documented depending on a variety of grazing and site factors. Historically, research investigating the impacts of livestock grazing on wildlife has been limited by a narrow focus on simple “grazed” vs. “ungrazed” treatments or examining how grazing affects only a single vital rate in isolation. To overcome these limitations, we used a two-stage class, female-based integrated population model (IPM) to examine whether three grazing management regimes (season-long, rest-rotation, and summer rotation) differentially impacted population growth rates of sharp-tailed grouse (Tympanachus phasianellus) in eastern Montana and western North Dakota. We estimated 14 vital rates related to survival and fecundity and examined whether subtle cumulative effects of livestock grazing were present but not detected in prior analyses focused on single vital rates. While the management regimes did not differentially impact survival or fecundity of female grouse in our study system, we found evidence for significant cumulative impacts of grazing regime on population growth rates that were only apparent when all vital rates were evaluated concurrently. Population growth rates were higher in areas managed with season-long livestock grazing. The IPM framework encourages comprehensive investigations into the influence of covariates on critical components of species life histories and can assist in guiding management decisions in a world of limited resources. This integrated approach allowed us to more efficiently use multiple data types to provide a more complete picture of the effects of management on an important indicator species.
Introduction
Livestock grazing is the primary anthropogenic land use (Alkemade et al., 2013) and occurs on more than 60% of the world’s agricultural lands (Alexandratos and Bruinsma, 2012). Given that temperate grasslands in the United States provide habitat for more than 290 species of vertebrates, livestock grazing management has a critical influence on native wildlife communities. Domesticated grazers can alter the structure and composition of vegetation, ecosystem function, soil productivity, and therefore wildlife habitat (Adler et al., 2001; Krausman et al., 2009; Boyd et al., 2014; Kraft, 2016). Excessive grazing has been frequently cited as one of the main causes contributing to temperate grassland ecosystem changes such as decreased native plant diversity, woody encroachment, the spread of invasive species, and wildlife population declines (Smith, 1940; Kaiser et al., 1979; Brennan and Kuvlesky, 2005; Smith et al., 2018). In contrast, appropriately managed livestock grazing has also been deemed beneficial for some wildlife species (Frisina, 1991; Douglass and Frisina, 1993; Fuhlendorf and Engle, 2001; Ricketts and Sandercock, 2016; Lagendijk et al., 2019). The effects of livestock grazing management can depend on multiple factors, including the timing and intensity of stocking, species of grazer, environmental conditions, and specific site conditions (e.g., soil type, precipitation, topography) that interact at multiple scales to influence a variety of population parameters (Van Poollen and Lacey, 1979; Adler et al., 2001; Derner et al., 2009; Krausman et al., 2009; Dettenmaier et al., 2017).
Historically, evaluations of the impacts of livestock grazing on wildlife have suffered two major limitations. First, early studies were constrained to simple designs with “grazed” and “ungrazed” treatments, without regard for specific grazing parameters (Busack and Bury, 1974; Reynolds and Trost, 1980; Medin, 1989; Dettenmaier et al., 2017). To address this limitation, recent work has highlighted the effects of specific grazing factors that directly correspond to producer decisions (e.g., stocking rates, grazing systems, grazer species) on species functional groups or species of particular conservation concern, particularly grassland birds (e.g., Fuhlendorf et al., 2006; McNew et al., 2015). For example, recent evidence suggests that a patch-burn grazing regime can improve the quantity and quality of nesting sites and improve annual survival of female greater prairie-chickens (Tympanuchus cupido) over other grazing management regimes (McNew et al., 2015; Winder et al., 2018). These studies add another layer of understanding regarding grazing management impacts on wildlife, but they all still suffer from another significant limitation if we wish to draw inferences about how grazing management influences population dynamics.
The second significant limitation is that effects of livestock grazing management and, to our knowledge, habitat management in general, are often evaluated independently for state variables (e.g., population size), individual components of life history (e.g., vital rates, habitat use), or broader community metrics, like diversity indices or relative density (Schaub and Abadi, 2011; Robinson et al., 2014; Arnold et al., 2018). Specific evaluations of the effects of managed grazing parameters like stocking density on nest survival, for example, may provide useful information for specific management questions related to one component of fecundity (e.g., Milligan et al., 2020a), but do not yield inference regarding the broader effects on overall population dynamics and viability. A comprehensive and integrated examination of population processes can illuminate knowledge gaps and aid in the investigation of which factors affect population growth rates, while also identifying cumulative treatment effects on populations that studies of individual life history components cannot reveal.
Recent advancements in analytical approaches now allow for integrated, rather than piecemeal, evaluations of habitat management on multiple population processes and directly link observable parameters to latent population states. Integrated population models (hereafter, IPMs) within a Bayesian hierarchical framework are particularly useful for combining multiple, often dissimilar data types, and estimating parameters of interest including latent variables which are difficult to directly measure or observe in isolation (Kéry and Schaub, 2011). Generally, an integrated analysis is a joint investigation of several datasets, with inferences made based on the joint likelihood, which for independent datasets is the product of the individual dataset likelihoods. Shared parameters across multiple components of the likelihood are key elements in integrated analyses (Schaub and Abadi, 2011). Specifically, IPMs jointly analyze independent datasets relating to population size and demographic rates and the results are often more precise estimates of population parameters on which data are collected (Besbeas et al., 2002), as well as estimates of demographic components that were not directly studied (Schaub and Abadi, 2011). Not only does the estimation of derived parameters and latent variables provide a more thorough understanding of population dynamics between and within stage classes, years, and sites, but it allows for the examination of links between environmental factors and their impact on demography (Abadi et al., 2010). In this framework, the precision of estimated parameters improves (Besbeas et al., 2002; Gauthier et al., 2007; Abadi et al., 2010), allowing for a more robust evaluation of the variation among vital rates and environmental covariates. Importantly, IPMs offer the opportunity to examine variables, such as grazing management parameters, which may affect population processes subtly but chronically, effects that may not be detected by the analyses of individual demographic rates widely used in the field of ecology. The ability to detect more subtle influencing factors is a direct result of a more efficient use of all the available information about a population incorporating both survey and demographic data and should result in more appropriate interpretation of management effects on a population.
We developed an IPM to evaluate the effects of livestock grazing systems on multiple vital rates and cumulative annual population growth rates of sharp-tailed grouse (Tympanuchus phasianellus), an indicator species of mixed-grass prairie habitats of the northern Great Plains (Poiani et al., 2001; Roersma, 2001). Declines of prairie grouse (Tympanuchus spp.) have been linked to poor grazing or rangeland management but a direct investigation of grazing system on complete prairie grouse demography has not been conducted (Crawford et al., 2004; Dettenmaier et al., 2017). Our specific objectives were to: (1) estimate 14 individual population vital rates using data collected from a 3-year field study of sharp-tailed grouse in joint analysis, (2) develop an IPM that links these demographic processes to population counts based on a common survey protocol, (3) evaluate whether livestock grazing systems affected vital rates and annual population growth rates, and (4) assess the utility of an IPM approach for better identifying previously difficult to measure combined effects of grazing on a wildlife population. We were particularly interested in evaluating whether subtle, “non-significant” differences in vital rates among grazing system resulted in biologically meaningful differences in population growth rates.
Materials and Methods
Study Area
Our study used data collected in southern Richland County in eastern Montana and McKenzie County in western North Dakota during 2016–2018 (Figure 1). The study area was primarily managed for cattle production and composed of Great Plains mixed-grass prairie with some areas of badlands and woody draws and ravines. Dominant native graminoids included western wheatgrass (Pascopyrum smithii), little bluestem (Schizachyrium scoparium), needle-and-thread (Hesperostipa comata), and blue grama (Bouteloua gracilis) typical of mixed and shortgrass temperate prairies in North America. Kentucky bluegrass (Poa pratensis) and crested wheatgrass (Agropyron cristatum) were common non-native graminoids. The study area included a ∼3,300-ha Upland Gamebird Enhancement Program (UGBEP) project established by the Montana Department of Fish, Wildlife, and Parks (MDFWP) in 1993 that includes four separate three-pasture Hormay rest-rotation systems (average pasture size was 292 ± 116 ha; Hormay and Evanko, 1958). Within each three-pasture rest-rotation management unit, cattle were stocked in one pasture from May–July in the first year (growing season), moved to the second pasture during August–October (post-growing season), while the third pasture was rested from grazing. The order of rotation was then changed the next year so no pasture was grazed during the same season in consecutive years and pastures rested in the year prior were expected to have more vegetative cover. Surrounding ranches included private land and four pastures located on United States. Forest Service National Grasslands, managed with more commonly used livestock grazing systems, including season-long (19 pastures, ∼4,800 ha, grazed: May–November) averaging 242 ± 312 ha in size and two- and three-pasture summer rotation systems (25 pastures, ∼5,200 ha). Summer rotation systems (average pasture size was 238 ± 335 ha) stocked cattle in the same pastures each year for the same 6–8 week period (approximately April–June, June–July, or August–November). Stocking rates were controlled by landowners and lessees and averaged rates were 0.93 AUM ha-1, 1.46 AUM ha-1, and 0.76 AUM ha-1 for rest-rotation, season-long, and summer rotation pastures, respectively. Topography, average vegetation productivity, soil type, and vegetation canopy greenness as measured by the Normalized Difference Vegetation Index (NDVI) in June 2018, were similar among grazing systems and are described in more detail in Milligan et al. (2020a).
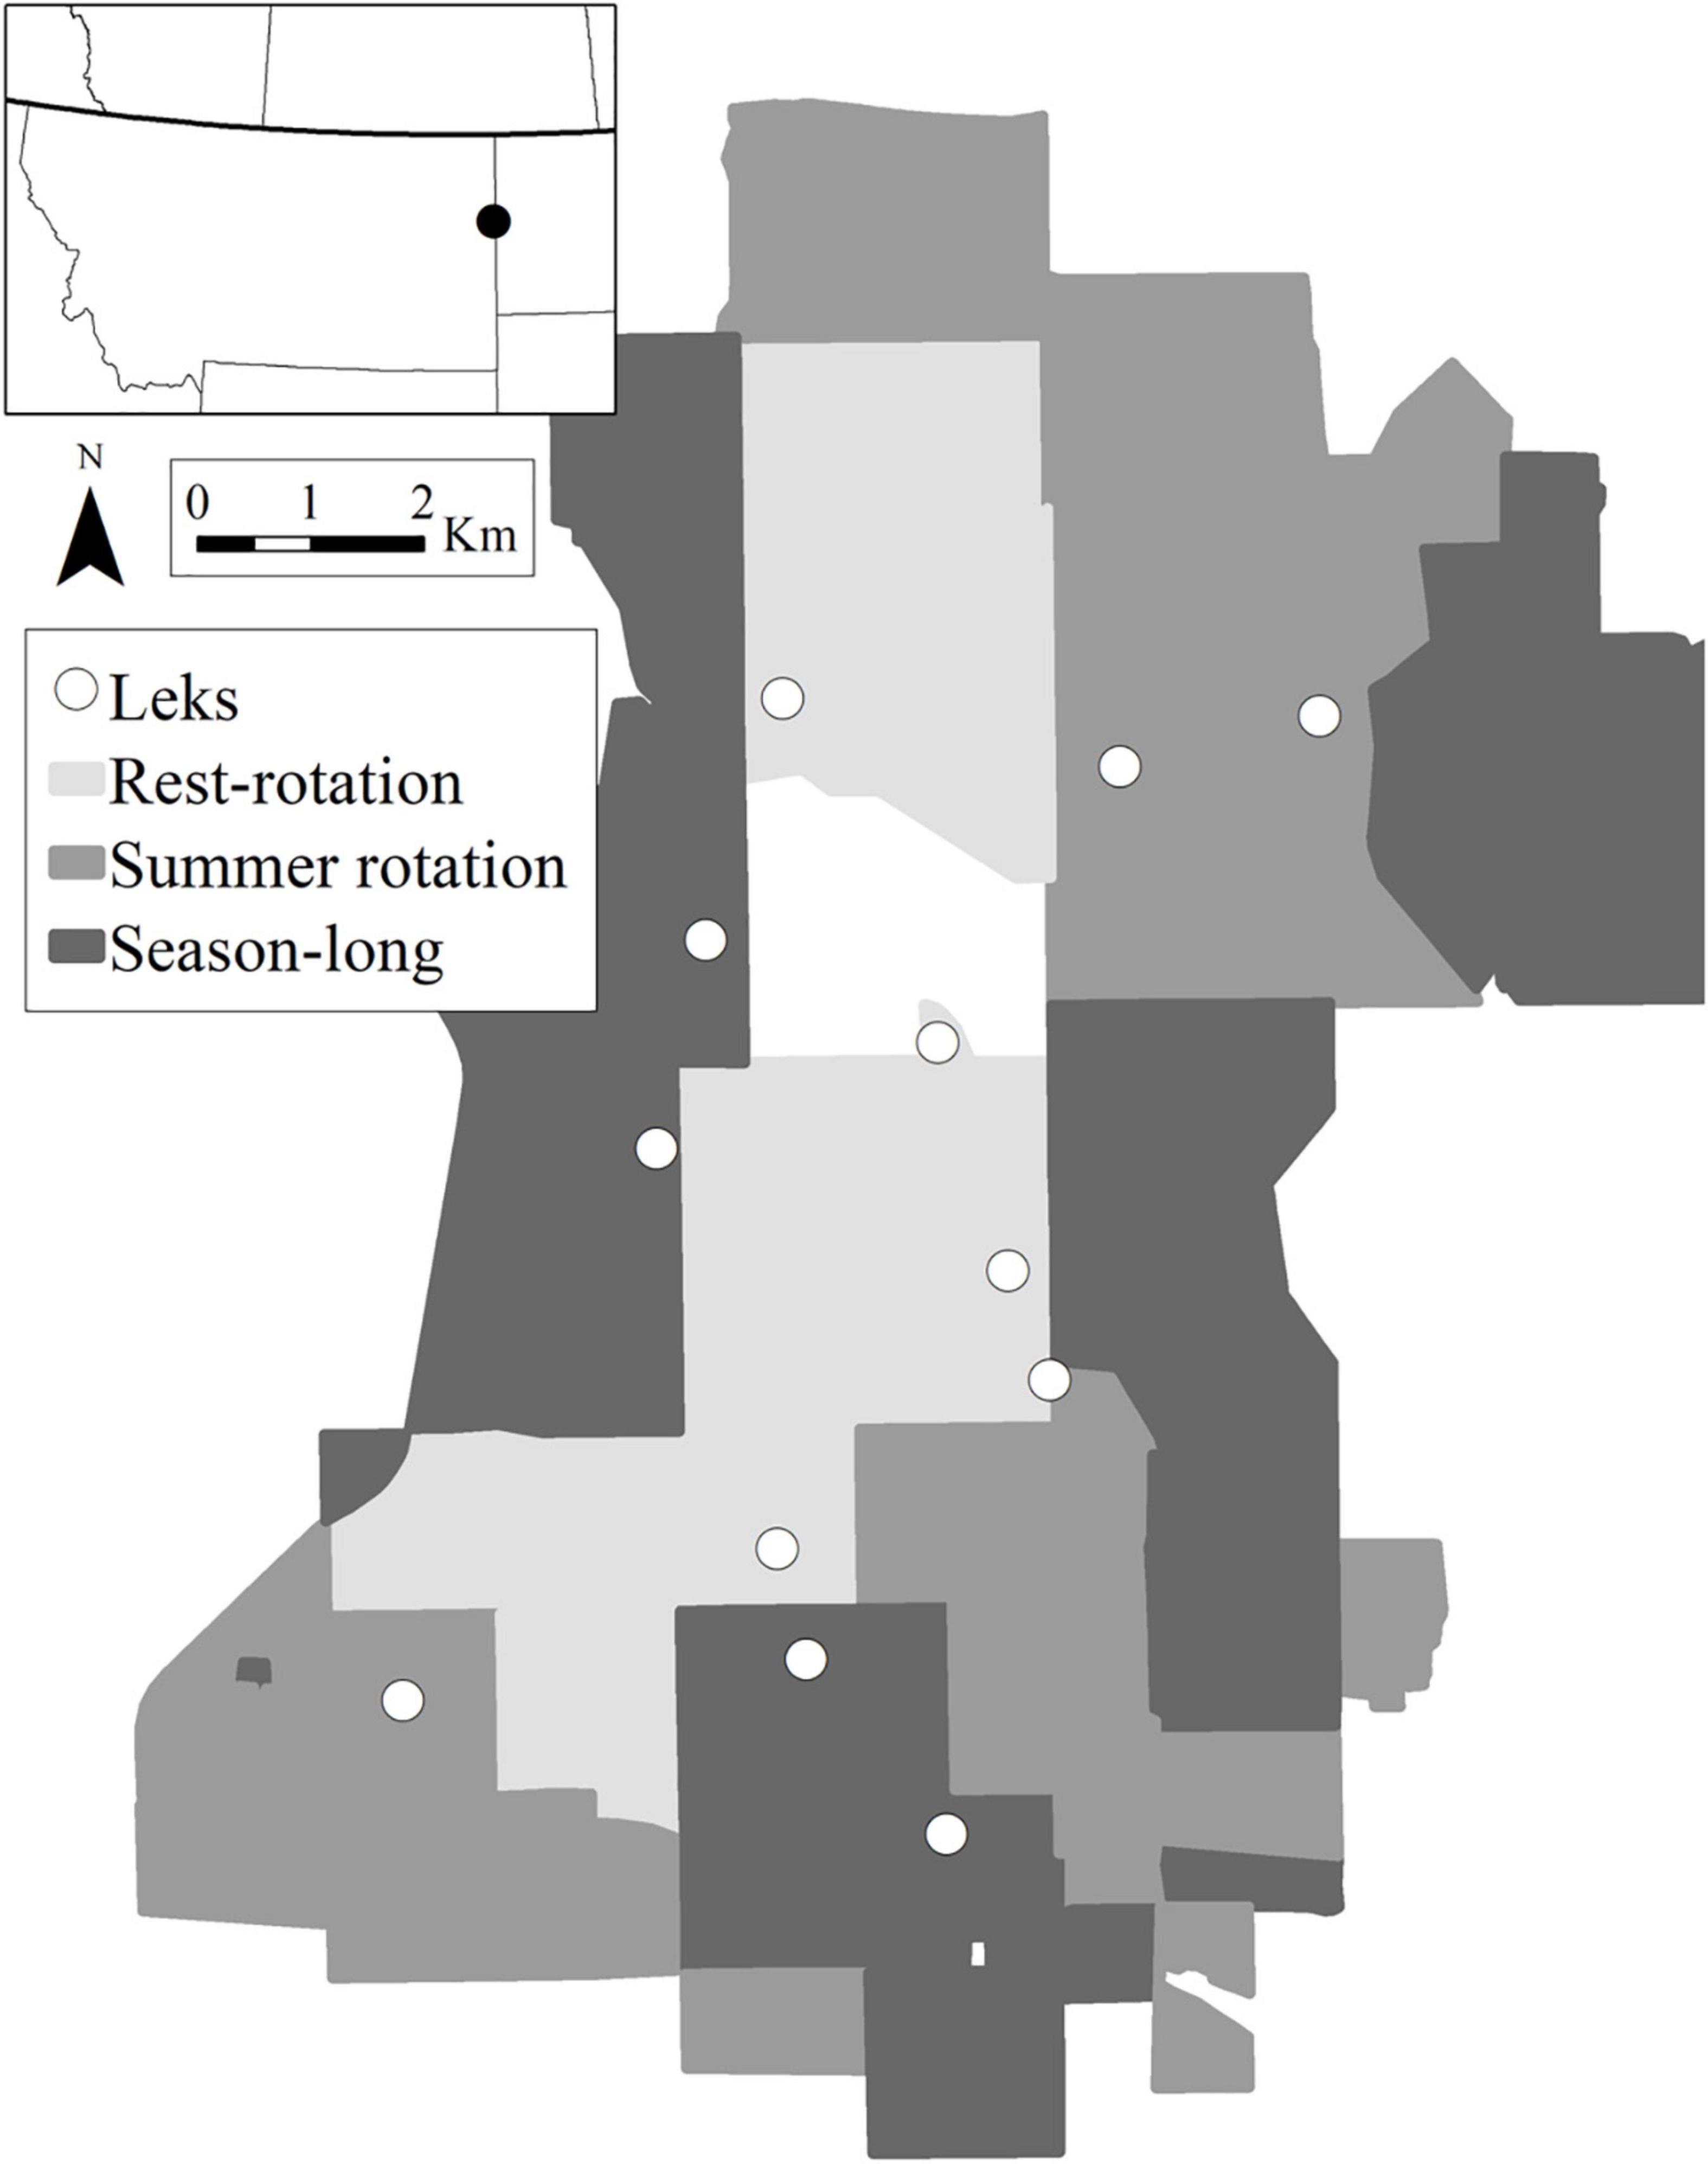
Figure 1. Study area in eastern Montana and western North Dakota. Monitored leks where birds were captured are shown as white circles, with the three grazing systems shown for each pasture in gray.
Field Methods
Each year (2016–2018) during the early breeding season (March–May), we conducted repeated surveys at active leks within the study area. Observers recorded the number of males, females, and maximum number of birds sighted. Lek surveys were conducted during the capture period and each lek was surveyed a minimum of five times.
We captured grouse during March–May at 12 leks (five in rest-rotation pastures, three in summer rotation pastures and four in season-long pastures) using walk-in funnel traps. Females were fitted with necklace-style very high frequency (VHF) radio-transmitters (model A4050; Advanced Telemetry Systems, Isanti, MN, United States). Radio-marked females were located by triangulation or homing at least three times per week during the nesting period (April–July). We used portable radio receivers and handheld Yagi antennas to locate and flush nesting females so we could count eggs and record the nest location with a handheld Global Position System (GPS) unit. Nests were monitored after the expected hatch date and approached after the female was located away from the nest for at least 2 days during incubation or 1 day after the expected hatch date (Milligan et al., 2020a). We classified nest fate as successful (at least one chick produced), depredated, or abandoned, based on eggshell remains, predator sign, and/or female behavior. All animal handling was approved under Montana State University’s Institutional Animal Care and Use Committee (Protocol #2016-01).
Grazing management in the study area was defined by interviewing landowners to determine the number and class of animals stocked and the timing of stocking.
Integrated Population Model
We used a Bayesian hierarchical framework to develop an IPM that combines multiple independent sources of population data including spring lek counts and a female-based stochastic population model with two stage classes (yearlings and adults). Our methodology is similar to IPMs developed previously for greater sage-grouse (Coates et al., 2018) and informed by procedures described in Kéry and Schaub (2011) and Halstead et al. (2012). We did not have sufficient sample sizes to estimate grazing effects in each year and so we estimated separate models with either fixed effects of grazing system or a random effect of year to evaluate population growth rates across grazing systems and years, respectively. Below we describe the model with grazing effects.
Population Count Data
For the 12 leks surveyed from 2016 through 2018, we compiled three repeated lek counts during a short 5-day window each year (to address the assumption of population closure). Repeated counts were entered into a single season N-mixture model to adjust for systematic downward bias in the observation data (Royle, 2004). The N-mixture model was specified as:
where subscripts l, y, and r denote the specified lek, year, and repeated counts respectively. The state process models the latent unobservable number of males associated with each lek (local abundance), and the observation process models the variation among repeated counts within a year at each lek and estimates the average probability (py,r) of detecting a grouse. Although most birds counted on the leks are males, we assume a 1:1 sex-ratio and therefore used the male counts as a proxy for the number of females in the population, which are much more difficult to detect via lek surveys. The assumption of an equal sex ratio was supported by the sample of captured adult birds (211 females and 220 males).
Survival
We modeled annual survival for each stage class of female grouse monitored via radio-telemetry, survival of first and second nests, and survival of chicks from hatch until 35 days of age as continuous processes observed at discrete intervals. For each discrete monthly interval, adult birds were classified as dead, alive, or censored. We constructed histories of nests and chicks using days as time intervals (Halstead et al., 2012). Using a constant hazard model, we assumed the probability of mortality was equal across the length of the study and assumed that risk of mortality was independent among individuals, with the exception of chicks within broods. Left censoring occurred prior to individuals entering the study (time of capture for adult grouse, initiation of laying for nests, and hatch date for chicks) allowing for staggered entry common to radio-telemetry and reproductive ecology studies. Right censoring occurred after mortality, loss of radio, and for birds still alive at the end of the study period (after year 2018), meaning that all individuals had a recorded mortality event or were eventually right censored. The survival function for the constant hazard model was estimated as:
Subscript i references individual grouse, nests, or chicks and subscripts j and y reference units of time and survival year respectively. T is the last time interval in the monitoring period. Symbol g0 is the mean baseline hazard and models for adult survival, first and second nest survival, and chick survival included random effects for individual female age (bage,ij) where the indicator was equal to one for adults (i.e., xage = 1 for adults) to account for individual variation. Parameters bgrz1 and bgrz2 are the magnitude of the expected change in the ln(hazard ratio) depending on grazing management system, where season-long is the reference category and indicator variables specify rest-rotation (xgrz1 = 1) and summer rotation (xgrz2 = 1) systems. Hazard ratios measure an effect on an outcome of interest over time, in this case the effect of grazing system on grouse survival and is interpreted as the relative likelihood a particular group will experience the event of interest compared to the reference group. For example, a hazard ratio of 0.5 would mean that a female grouse in that grazing system is half as likely to experience mortality at a particular point in time compared to a grouse in the reference grazing system, season-long. A hazard ratio equal to one implies no difference in treatment from the reference group, and therefore, if the 95% credible interval includes one, there is no evidence of a difference in probability of survival between the treatment group and the reference group.
To classify grazing system for models of adult and chick survival, we simply used the system with the most locations during the time period of interest. For first and second nests, we used the grazing system in which each nest was located to specify the grazing management system. We used uninformative priors for all parameters.
Fecundity
Fecundity was defined by several sub-models, each of which specifically estimated important reproductive vital rates for sharp-tailed grouse. Parameters estimated by individual stochastic sub-models included nest propensity (np; first nest = np1 and second nest = np2), nest survival (ns; described above), clutch size (cl), egg hatchability (h), chick survival (cs; described above), and juvenile survival (js). We did not monitor juvenile grouse after they gained independence at 35 days of age. One of the advantages of IPMs is the estimation of vital rates for which no data were collected (Kéry and Schaub, 2011). Information on juvenile survival rates specifically for sharp-tailed grouse is lacking. Therefore, we used an informative prior [beta(100, 150)] in our sub-model of juvenile survival (js) based on published rates in the literature for prairie-chickens (Pitman et al., 2006; McNew et al., 2012) for survival of juvenile birds from independence at 35 days of age to recruitment the following spring (March 1). We also used an informative prior for first nest propensity for each stage class, using more conservative values than rates reported in the literature [beta(97, 5) for adults and beta(90,12) for yearlings] due to concerns about the potential for missing first nests that failed early during the laying period (Taylor et al., 2012; Mathews et al., 2018). We assumed nest propensity was constant among years. Thus, fecundity was estimated as:
Subscripts reference grazing system (g) and stage class (a). We divided the value of F by two because our model is female-based and we assumed an equal sex ratio.
Second nest propensity (np) was modeled as:
where ynp2,y represents the number of renests, nnp2,y is the number of unsuccessful first nests in each year (y) and logit(pnp2,y) is a function of female stage class (bage,y) and parameters with indicators for grazing system (bgrz1 and bgrz2).
The expected mean clutch size (μcl) at clutch c in year y is a linear function of the change in the expected count of magnitude βage, nesting female stage class. Clutch sizes of first and second nests were modeled as being drawn from a Poisson distribution and estimated as:
Egg hatchability (h) was compiled from nests that were successful (one or more eggs hatched) and estimated as arising from a binomial distribution following the same equation for second nest propensity, where the initial clutch size represented the number of trials with a binary outcome (hatch or not hatch) and the number of hatched eggs represented the number of successes. We included the same random effect for female stage class.
Chick survival (cs) was modeled as described above based on flush counts of chicks at approximately 35 days post-hatch arising from a binomial distribution (logit-link function). The initial brood size represented the number of trials and chicks that survived to day 35 were the successes. The estimated model included random effects for female stage class (bage) as well as parameters with indicators for grazing system (as described above; bgrz1 and bgrz2). We assumed a constant hazard function and the model followed the form used for adult and nest survival and was estimated as:
Joint Likelihood
After defining the sub-models, we specified the joint likelihood which is the product of the component likelihoods of the population count data (from the N-mixture model), stage class survival data, and fecundity data. In concert, the subcomponents of the IPM were used to derive posterior distributions for grouse vital rates and enabled us to estimate the total female population across the study area in each year. The mean expected number of recruits into the yearling stage class (μ1yi) was estimated as:
where subscripts a, y, and l correspond to stage class (a = 1 for yearlings and 2 for adults), year, and lek site respectively. Na represents the initial number of each stage class in each year at each lek site l. Symbols F and S8 represent fecundity and eight-month survival derived from individual sub-models described above. The number of yearling recruits (N1yl) is:
We represent the number of yearlings surviving into adulthood (Nnew(2yl)) as being drawn from a Binomial distribution given the annual survival of yearlings from the previous year and the number yearlings from that lek the year before.
Similarly, the number of surviving adults from the prior year (Nold(2yl)) is estimated as being drawn from a Binomial distribution with a mean of the annual adult survival from the year before and the number of adults from the lek the prior year, represented as:
Given the information in the constructed Lefkovitch matrix and abundance estimates for both stage classes, we estimated abundance at each lek in each year, where total adults (N2yl) is the sum of new adults (Nnew(2yl)) and returning adults (Nold(2yl)) and total abundance (Ntot) is the sum of total adults (N2yl) and yearlings (N1yl):
Population totals across the study area are estimated by summing lek site totals for all leks in each year. From the derived abundance estimates, we calculated the finite rate of population change (Caswell, 2001; Gotelli and Ellison, 2004) by dividing total abundance in year y + 1 by the total abundance in the previous year y. Thus,
where subscript y represents year. Posterior distributions of estimated parameters were summarized by mean and 95% credible intervals (CrI).
We used the packages rjags (Plummer, 2018) in Program R (version 3.6.2; R Core Team, 2018) with Markov chain Monte Carlo methods to obtain posterior samples of the parameters of interest, running three independent chains of 50,000 iterations, thinned by a factor of five, after a burn-in of 100,000. Mixing was sufficient and convergence was achieved as confirmed by examining trace plots and R-hat values (< 1.01; Gelman and Rubin, 1992) after estimation.
Sensitivity Analysis
To evaluate the relative contributions of individual demographic rates to population dynamics, we calculated the posterior distributions of correlation coefficients between annual population growth rates and each of the demographic rates. The strength of the correlation reflects the strength of the contribution of one demographic rate with the temporal variation in population growth rates (Kéry and Schaub, 2011; Schaub et al., 2012). We described the posterior distributions using the median because they were skewed and we calculated the probability that the correlation coefficients were positive.
Results
During the study period, we located 188 grouse nests laid by 128 individual females, of which 147 were first nests and 41 renesting attempts. We evaluated chick survival for 93 broods (2016; n = 25, 2017; n = 36, 2018; n = 32). To estimate adult survival, we used data from 153 female sharp-tailed grouse, some of which were monitored in multiple years resulting in 172 bird years (2016; n = 55, 2017; n = 64, 2018; n = 61). Of the total bird years, 66 primarily used rest-rotation, 46 primarily used season-long, and 60 used summer rotation.
Estimated vital rates (Table 1 and Figure 2) from the IPM generally agreed with those estimated from previous independent analyses (Milligan et al., 2020a,b). For example, first nest survival was 0.47 ± 0.09, 0.39 ± 0.09, and 0.40 ± 0.09 for season-long, summer rotation, and rest-rotation pastures, which corresponded with previous independent estimates (season-long: 0.48 ± 0.07; summer rotation: 0.38 ± 0.06; rest-rotation: 0.32 ± 0.06; Milligan et al., 2020a). Credible intervals of all fecundity parameters and overall recruitment within each stage class overlapped across the three grazing systems (Figures 2A–E), although chick survival trended higher in summer rotation pastures.
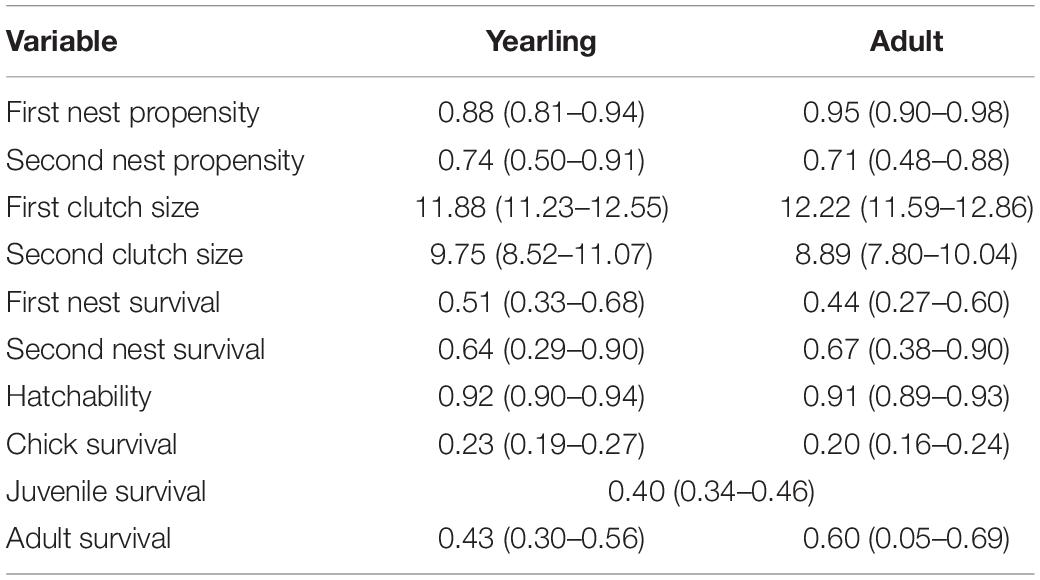
Table 1. Estimated vital rates (with 95% credible intervals) for each stage class (yearling and adult) of sharp-tailed grouse in eastern Montana using a female-based integrated population model.
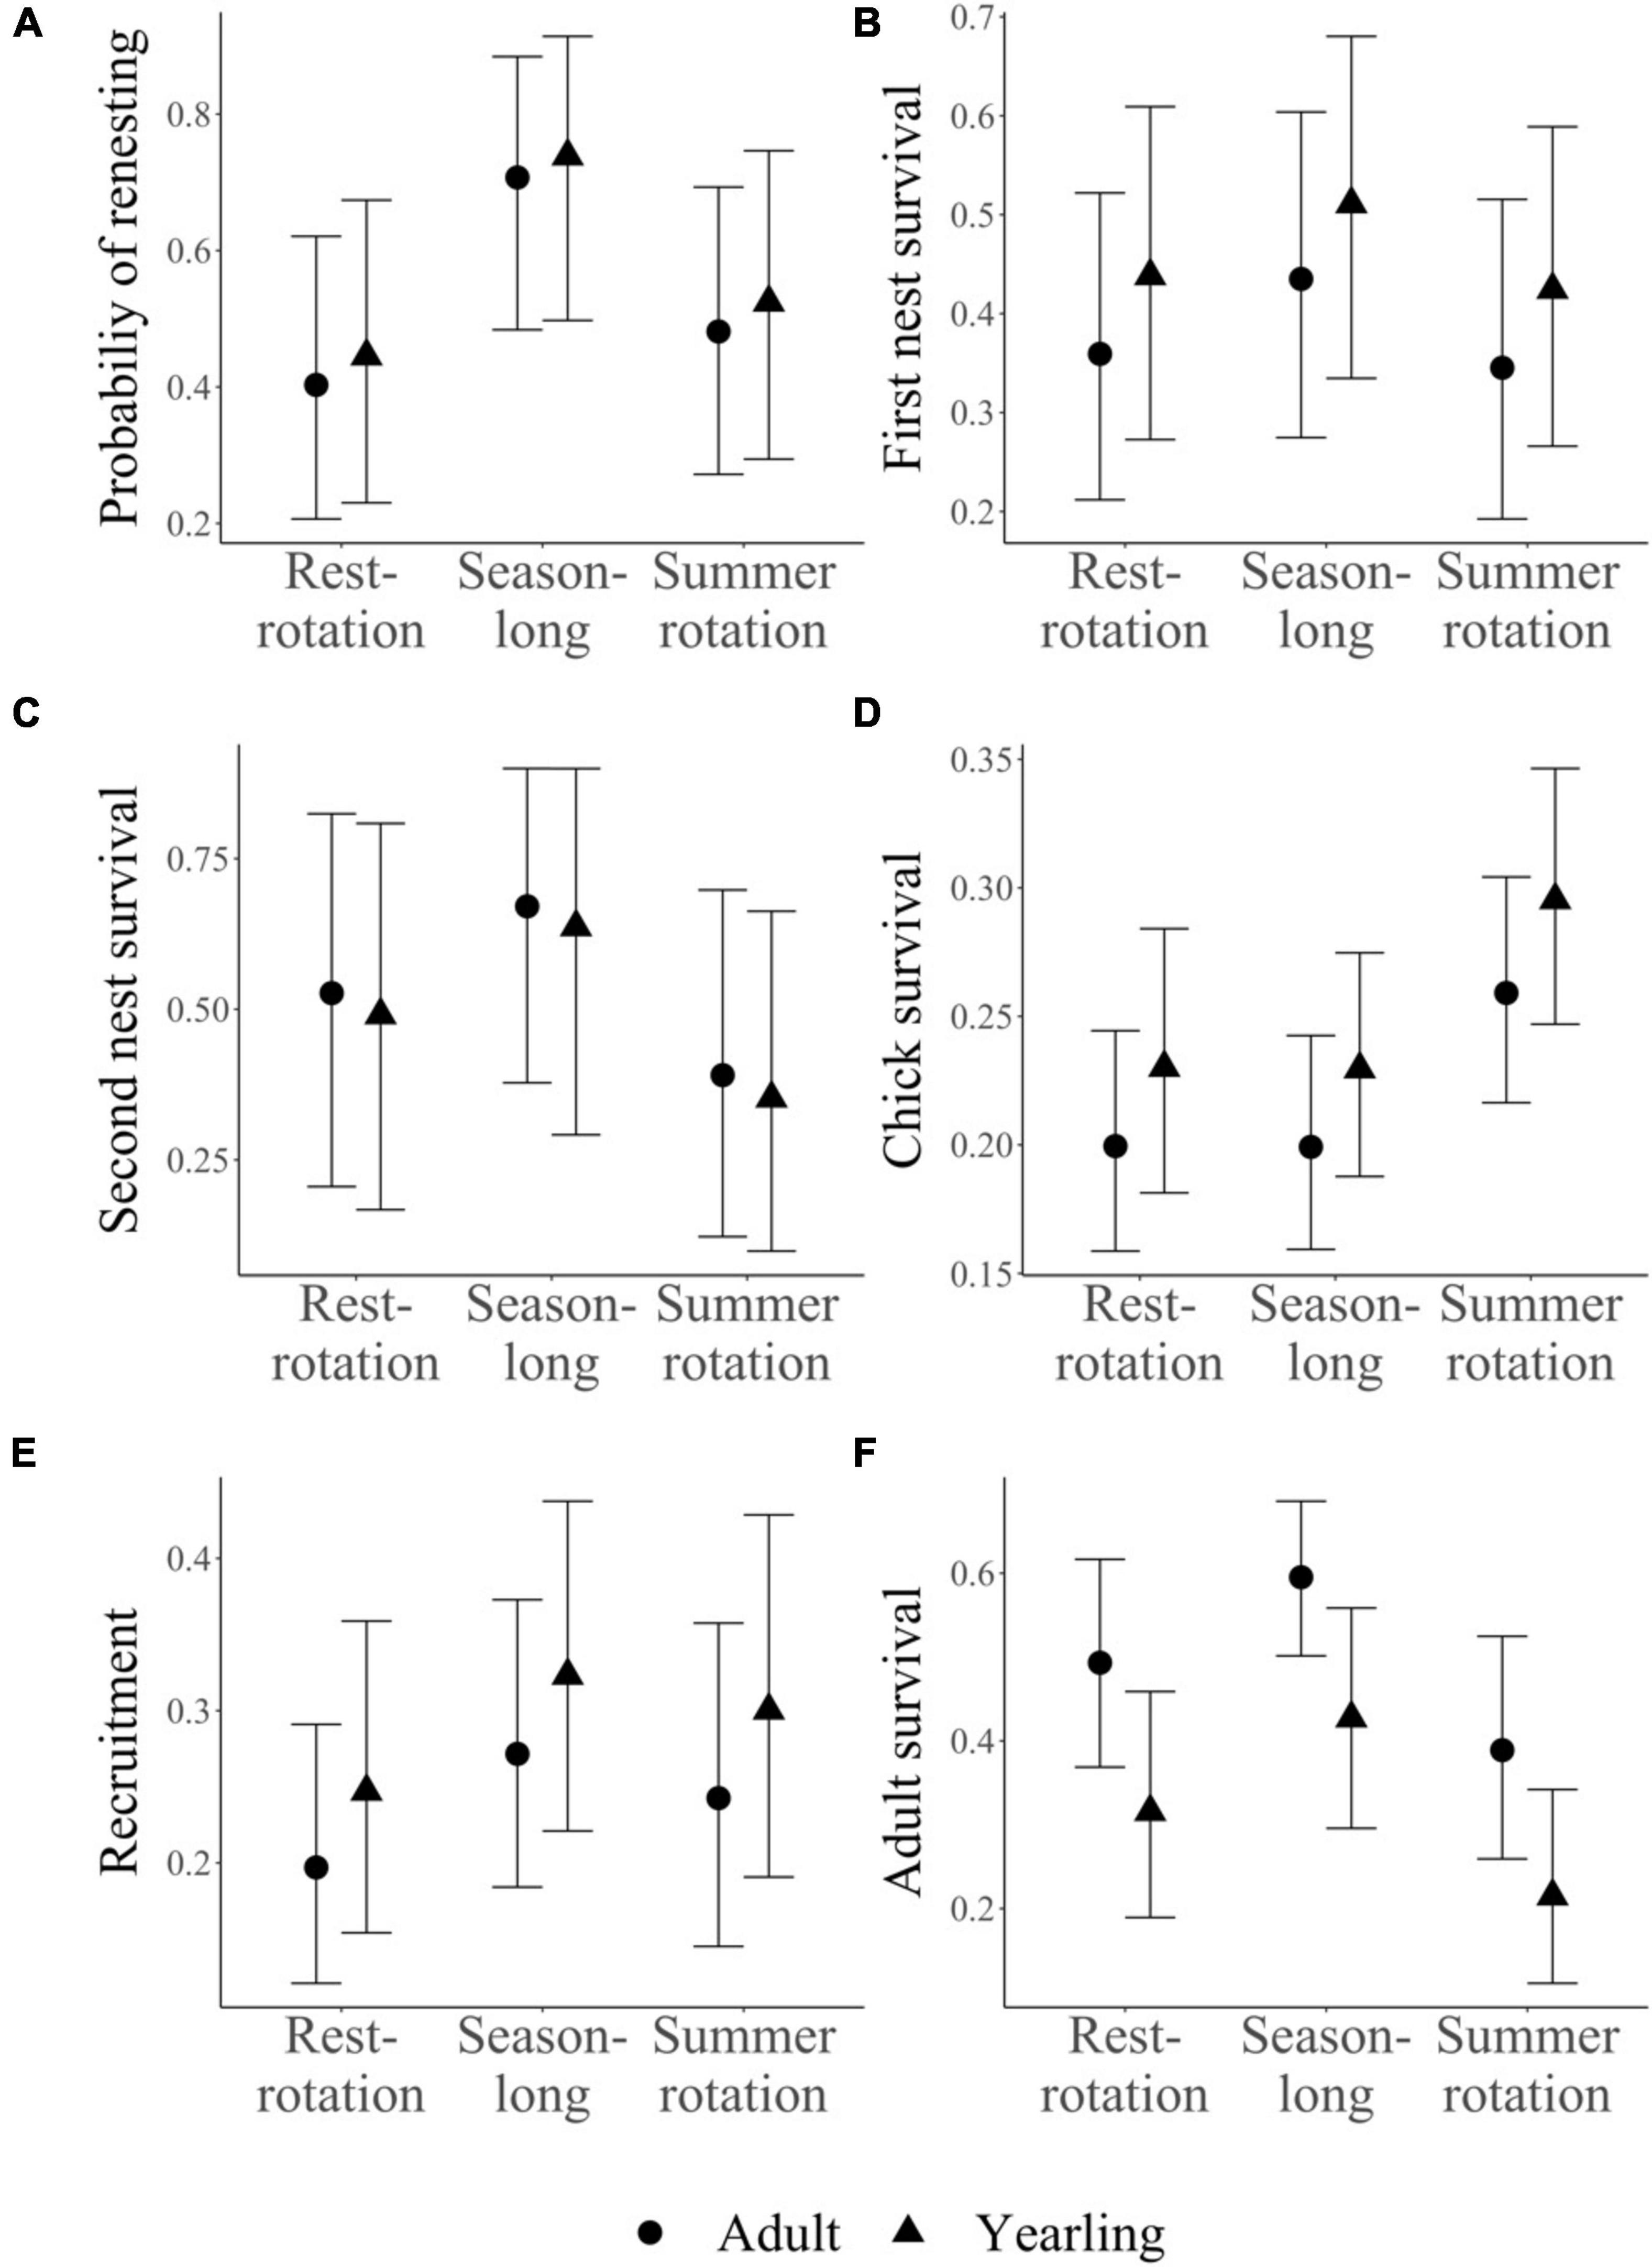
Figure 2. Estimated vital rates (± 95% credible intervals) for each grazing system and stage class (yearling and adult) using a female-based integrated population model for sharp-tailed grouse in western Montana. Four vital rates (A–D; renesting propensity, first and second nest survival, chick survival) that varied by grazing system and additional parameters which were either assumed to be constant across grazing system (clutch size, egg hatchability) or for which we did not have data to estimate grazing effects (first nest propensity, juvenile survival) were combined to estimate recruitment (E). Recruitment (E) and adult survival (F) were then used to calculate population growth rates for each grazing system.
Credible intervals for adult survival within each stage class overlapped for all three grazing systems, but adult survival trended higher in season-long pastures, particularly compared to summer rotation pastures (Figure 2F). Annual survival estimates were within the range previously reported for sharp-tailed grouse (Robel et al., 1972; Connelly et al., 1998) and averaged 0.41 ± 0.14 across stage classes and grazing systems (range: 0.21–0.60). Previously reported annual survival rates and standard errors for the same population were 0.50 ± 0.05 in 2016, 0.28 ± 0.04 in 2017, and 0.46 ± 0.05 in 2018 (Milligan et al., 2020b).
Estimated population growth rates (λ) were 0.75 ± 0.08 for season-long, 0.48 ± 0.09 for summer rotation, and 0.58 ± 0.09 for rest-rotation pastures (Figure 3A). This translated to a significant difference in growth rates between season-long and summer rotation with 95% credible intervals that did not overlap zero (Figure 3B). Differences were also potentially biologically meaningful, with season-long grazing representing a 57 and 30% increase in population growth rates over summer rotation and rest-rotation, respectively. Collectively, estimated rates of population growth indicated a declining population from 2016 to 2017 (λ = 0.68, 95% CrI: 0.53–0.81), but the largest decrease was between 2017 and 2018 (λ = 0.59, 95% CrI: 0.44–0.74) which corresponded to significant drought.
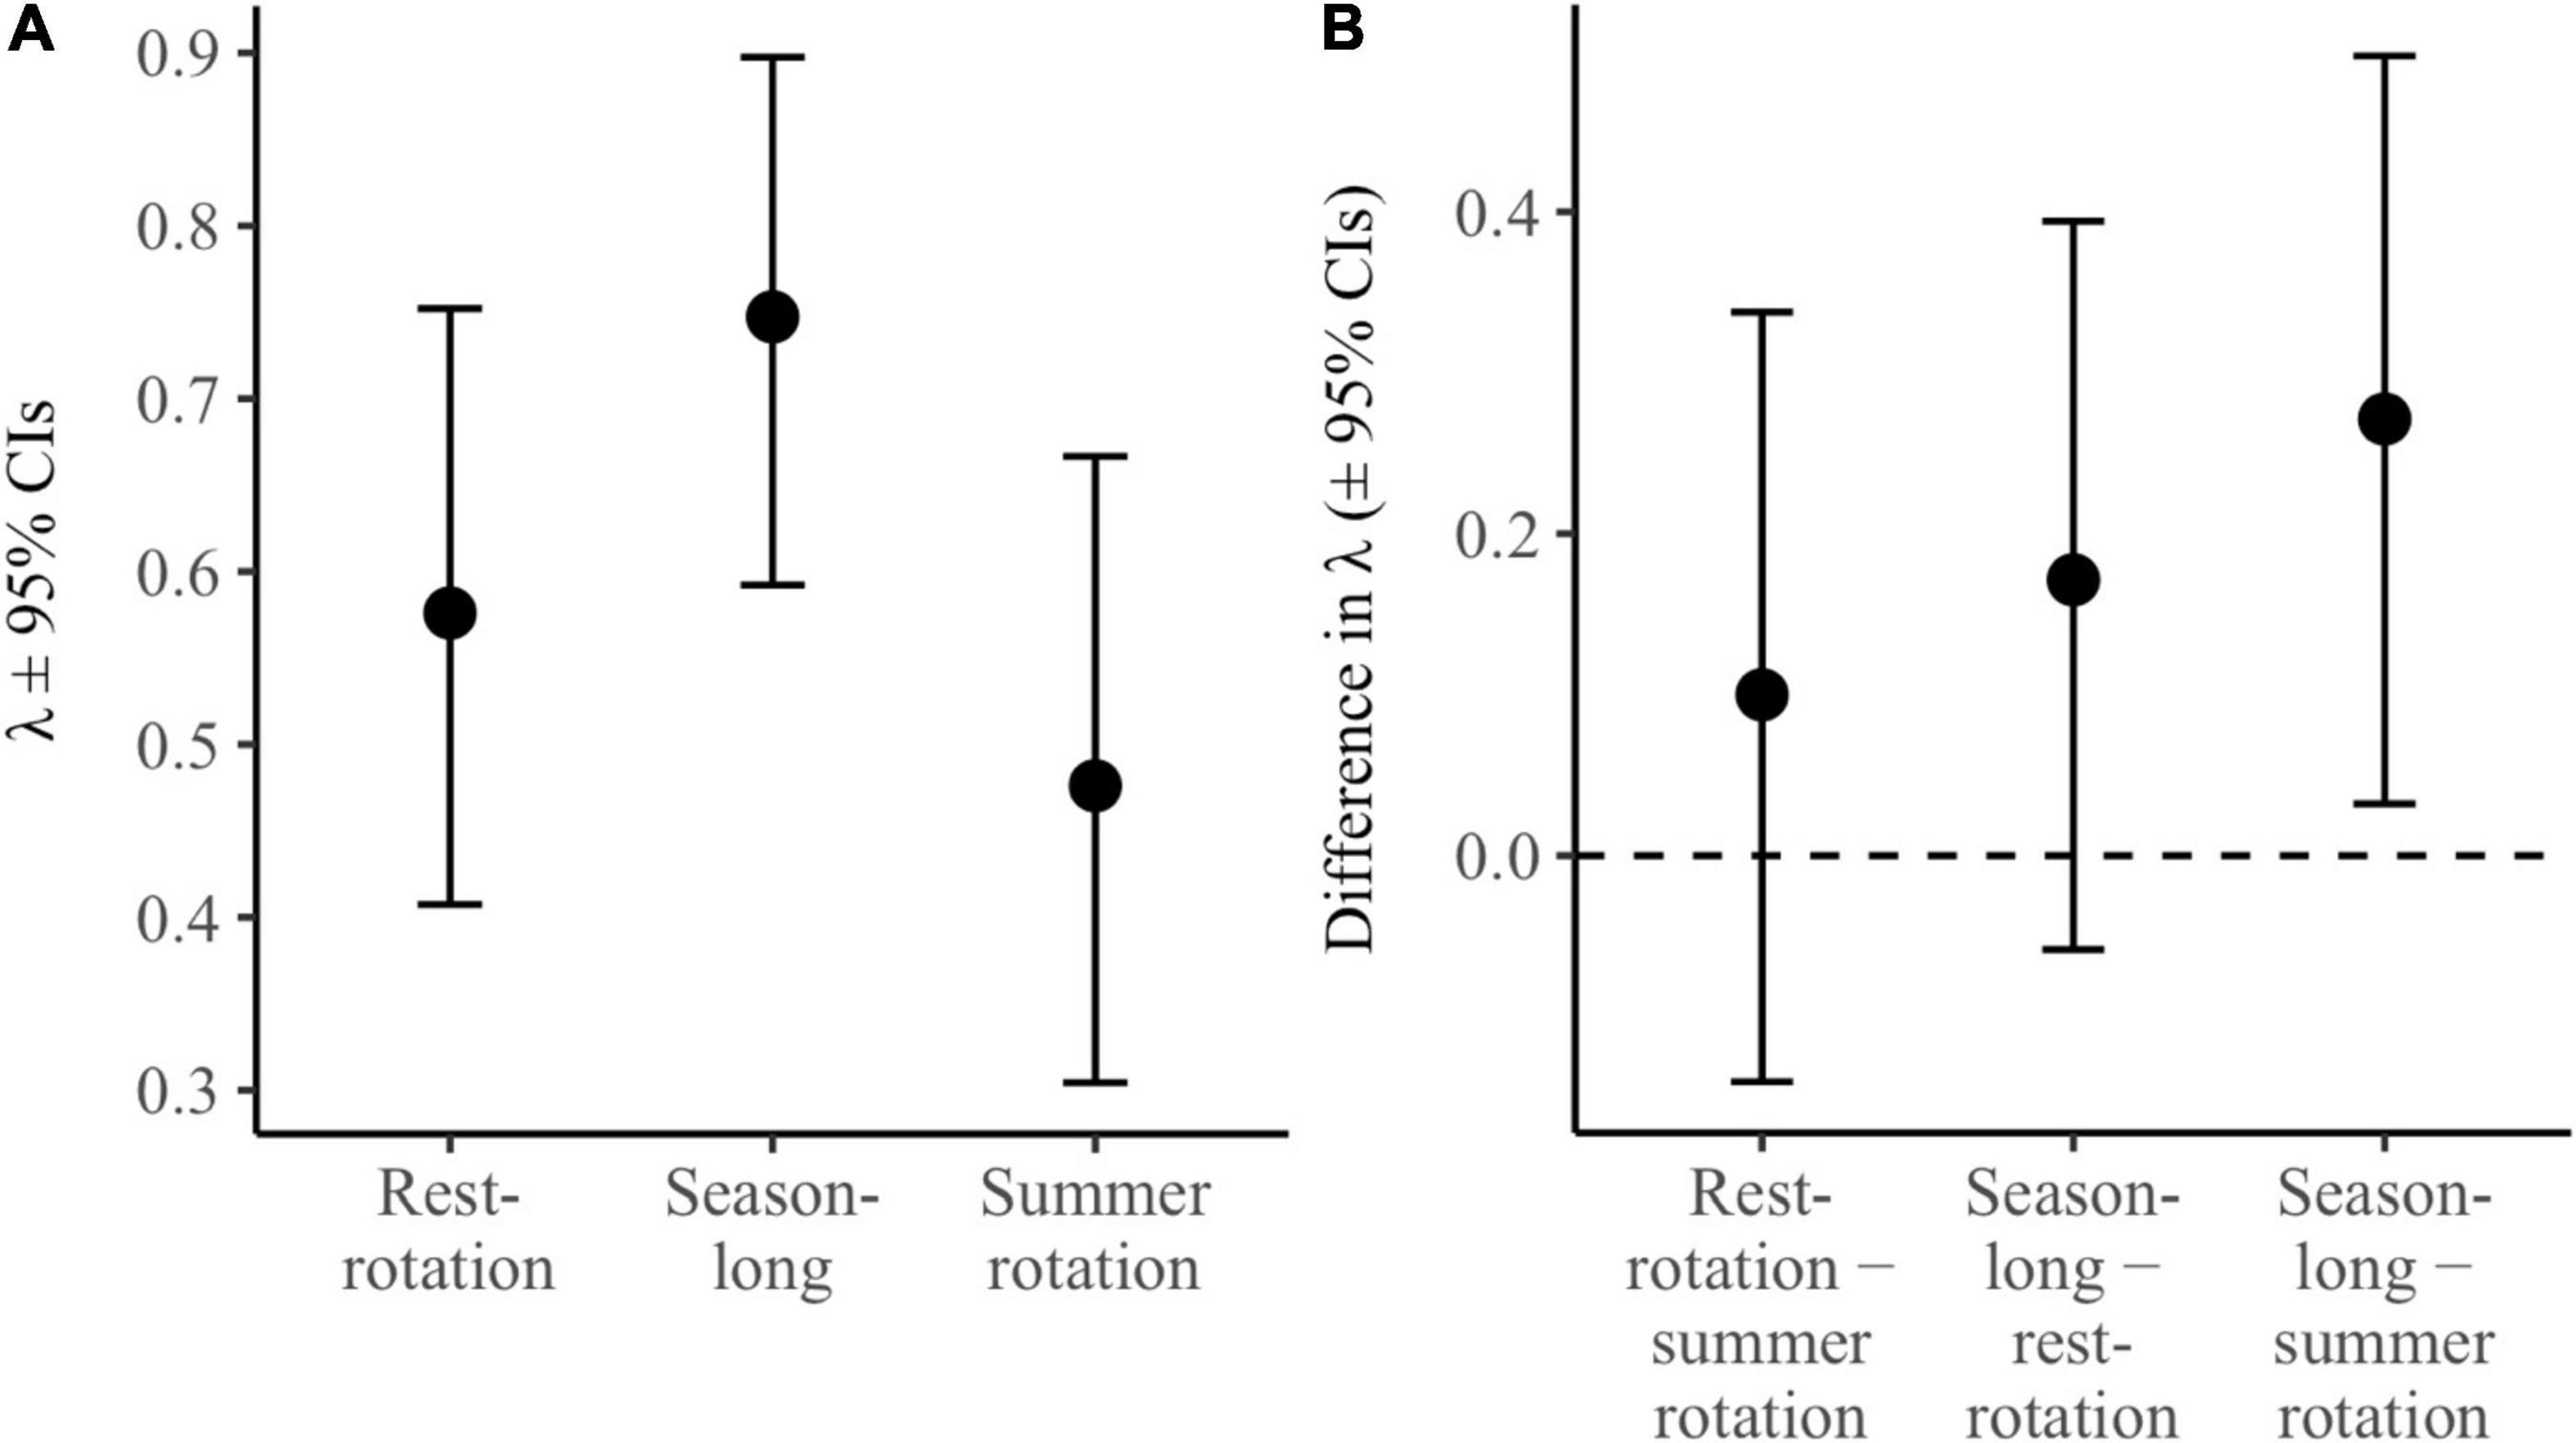
Figure 3. Estimated population growth rates (A; λ ± 95% credible intervals) for each grazing system using a female-based integrated population model for sharp-tailed grouse in western Montana. Panel B depicts the relative difference between estimated growth rates (± 95% credible intervals) between each pair of grazing systems, with credible intervals that do not overlap zero suggesting a significant difference between the two grazing systems.
Adult survival (0.67, 95% CrI: 0.29–0.88) and yearling survival (0.45, 95% CrI: -0.10–0.78) had the highest correlation coefficients with population growth rates, with 0.99 and 0.95 probabilities, respectively, that they were greater than zero, suggesting that there was a positive association with population growth. The relative contributions of first nest survival (0.11, 95% CrI: -0.42–0.61), second nest survival (0.07, 95% CrI: -0.47–0.57), and chick survival (0.11, 95% CrI: -0.43–0.59) were much lower but were still predicted to be positively associated with population growth (first nest survival: 0.66, second nest survival: 0.60, chick survival: 0.66).
Discussion
We evaluated the cumulative effects of livestock grazing management on sharp-tailed grouse with an IPM, which allowed us to overcome the two most significant limitations of previous research investigating the effects of grazing management on wildlife. Namely, we moved beyond the simplicity of “grazed” vs. “ungrazed” treatments and the limited inference of focal examinations of a single vital rate. The IPM allowed us to take a holistic approach and examine grazing management’s cumulative influence on multiple vital rates within the same hierarchical model, providing more power to detect subtle impacts of the grazing treatments on sharp-tailed grouse population dynamics (Kéry and Schaub, 2011; Schaub and Abadi, 2011). Although previous independent analyses suggested no difference in multiple vital rates between three grazing systems, our combined approach suggested that there were cumulative differences in overall population growth rates. Population growth rates were significantly higher in areas managed with season-long livestock grazing than in areas managed with within-season rotational grazing.
Viewed collectively, grazing management did influence the population dynamics and growth rates of our study population, with potentially biologically meaningful differences among all three systems, despite the fact that vital rates for both fecundity and survival were not significantly different across the three grazing regimes and this result was consistent across female stage classes (yearling and adult). While we did not evaluate the effect of grazing management on all estimated vital rates, we would not expect some vital rates, such as egg hatchability, to be affected by management factors and we included management effects on all key survival and reproduction rates (e.g., nest survival) that have been shown to influence grouse population dynamics (Hagen et al., 2009; McNew et al., 2012). The lack of an effect on individual vital rates contrasts with previous research that found effects of another grazing system, patch-burn grazing, on multiple vital rates of greater prairie-chickens (McNew et al., 2015; Winder et al., 2018). However, unlike patch-burn grazing, grazing regimes in our study area did not have a meaningful impact on vegetation and pasture-level heterogeneity (Milligan et al., 2020a), which could explain why we only detected subtle cumulative impacts on population growth when all vital rates were examined concurrently.
The IPM we constructed can also be used to investigate more aspects of grazing management, such as stocking rates, and evaluate their influence on population dynamics to inform management decisions. Unfortunately, differences in average stocking rates among grazing systems prevent us from making causal inferences regarding the mechanisms of improved population growth rates in areas managed with season-long grazing. Previous studies suggest that stocking rate can be of greater importance than grazing system in terms of the cascading effects on wildlife habitat and therefore wildlife populations (Briske et al., 2008, 2011). Stocking rates in our study were below levels recommended as moderate by the U.S. Department of Agriculture Natural Resources Conservation Service under normal precipitation, so further investigation with more varied stocking rates over variable levels of precipitation would be beneficial in understanding the effects of livestock management on wildlife populations. Testing the effects of other grazing management components on demography would further enhance our knowledge about the importance of livestock in shaping grassland ecosystems and would help to determine whether other components of grazing management have meaningful direct or cumulative effects on survival and fecundity (Dettenmaier et al., 2017). In addition, a spatially explicit approach could further evaluate fine-scale effects of both management and environmental variables on population dynamics (Chandler and Clark, 2014). We only categorized females based on the grazing system in which they were located most often, but it is possible that using multiple systems may be an important strategy or that only a small amount of a particular resource is required to support survival or reproduction, which would be better captured with a spatially explicit approach.
While some studies have found population growth rates in prairie grouse are more sensitive to changes in nest or chick survival (Hagen et al., 2009; Gillette, 2014), our sensitivity analysis indicated that adult survival was primarily responsible for changes in population dynamics. This concurs with a study of greater prairie-chickens that found that adult and juvenile survival were more important than reproduction for declining populations (McNew et al., 2012). Our estimates of nest survival were also within the range previously reported for sharp-tailed grouse (McNew et al., 2017), suggesting less room for improvement, whereas estimates of adult survival during the non-breeding season were severely depressed during the drought in 2017–2018 (Milligan et al., 2020b). Overall, our estimates of population growth rates depict a declining population, which was substantiated by field observations. The most significant declines occurred between 2017 and 2018, which coincided with a severe drought, suggesting that precipitation may have a large impact on population trends, as seen in other grouse species (Blomberg et al., 2012; Coates et al., 2018). While our estimates suggest significant population declines, grouse populations are cyclical and our study almost certainly did not capture an entire cycle, suggesting caution should be exercised when extrapolating our estimates to longer time periods.
Integrated population models provide a path for researchers and managers to squeeze the most information out of the data they collect (Kéry and Schaub, 2011; Schaub and Abadi, 2011). Due to their hierarchical nature and the borrowing strength provided by IPMs, even limited data sets can yield valuable information and robust results. When faced with a lack of empirical information (“data poor” parameters), whether due to species life history or the realities of research and management funding, IPMs can be used to great effect to shed light on critical life history components for wildlife (Abadi et al., 2010). A powerful strength of IPMs is allowing researchers to evaluate the effects of management or environmental variables across multiple vital rates within a single framework to allow more subtle, cumulative effects to be detected if present (Kéry and Schaub, 2011; Schaub and Abadi, 2011). The importance of cumulative or sub-lethal effects on organisms was initially noticed in the field of biological toxicology (e.g., Duquesne et al., 2004) but has been increasingly noted in other disciplines within the field of ecology as affecting survival, fecundity, space use, physiology, and behavior (Strauss, 1991; Nellemann et al., 2000; Sheppard et al., 2009; Williams et al., 2016; Heim et al., 2017; Messinger et al., 2019). Incidental cumulative impacts related to human activity or deliberate management actions have the potential to be significant and can sometimes explain the difference between observed and predicted population demographics. IPMs are useful for highlighting these differences, as shown by our results suggesting that cumulative effects of grazing regimes were only detected when all vital rates were evaluated concurrently, even though there were no significant impacts on individual vital rates. An integrated approach to modeling facilitates analysis of complex ecological data sets, uses all available information, and enables us to tease apart drivers of observed population dynamics we may otherwise have difficulty explaining (Arnold et al., 2018). The field of ecology and natural resource management would benefit greatly from adopting a more integrated approach whenever possible.
Data Availability Statement
Publicly available datasets were analyzed in this study. This data can be found here: https://www.wildlifehabitatecologylab.com/data.html.
Ethics Statement
The animal study was reviewed and approved by the Montana State University IACUC.
Author Contributions
MM collected data, conducted analysis, and wrote manuscript. LM designed the study, secured funding and permits, conducted analyses, and wrote manuscript. All authors contributed to the article and approved the submitted version.
Funding
This project was funded by the general sale of hunting licenses in Montana and matching funds under Federal Aid in Wildlife Restoration grant W-161-R1 to MT FWP as well as the Montana Agricultural Experiment Station.
Conflict of Interest
The authors declare that the research was conducted in the absence of any commercial or financial relationships that could be construed as a potential conflict of interest.
Publisher’s Note
All claims expressed in this article are solely those of the authors and do not necessarily represent those of their affiliated organizations, or those of the publisher, the editors and the reviewers. Any product that may be evaluated in this article, or claim that may be made by its manufacturer, is not guaranteed or endorsed by the publisher.
Acknowledgments
Our study was made possible by the generous cooperation of private landowners who allowed us access to their land and the help of many field technicians who collected data.
References
Abadi, F., Gimenez, O., Arlettaz, R., and Schaub, M. (2010). An assessment of integrated population models: bias, accuracy, and violation of the assumption of independence. Ecology 91, 7–14. doi: 10.1890/08-2235.1
Adler, P., Raff, D., and Lauenroth, W. (2001). The effect of grazing on the spatial heterogeneity of vegetation. Oecologia 128, 465–479. doi: 10.1007/s004420100737
Alexandratos, N., and Bruinsma, J. (2012). World Agriculture Twoards 2030/2050: The 2012 Revision. Rome, Italy: UN Food and Agricultural Organization (FAO).
Alkemade, R., Reid, R. S., Van Den Berg, M., De Leeuw, J., and Jeuken, M. (2013). Assessing the impacts of livestock production on biodiversity in rangeland ecosystems. Proc. Natl. Acad. Sci. 110, 20900–20905. doi: 10.1073/pnas.1011013108
Arnold, T. W., Clark, R. G., Koons, D. N., and Schaub, M. (2018). Integrated population models facilitate ecological understanding and improved management decisions. J. Wildl. Manage. 82, 266–274. doi: 10.1890/09-0446.1
Besbeas, P., Freeman, S. N., Morgan, B. J., and Catchpole, E. A. (2002). Integrating mark–recapture–recovery and census data to estimate animal abundance and demographic parameters. Biometrics 58, 540–547. doi: 10.1111/j.0006-341x.2002.00540.x
Blomberg, E. J., Sedinger, J. S., Atamian, M. T., and Nonne, D. V. (2012). Characteristics of climate and landscape disturbance influence the dynamics of greater sage-grouse populations. Ecosphere 3, 1–20. doi: 10.1525/9780520948686-004
Boyd, C. S., Beck, J. L., and Tanaka, J. A. (2014). Livestock grazing and sage-grouse habitat: impacts and opportunities. J. Rangel. Appl. 1, 58–77.
Brennan, L. A., and Kuvlesky, W. P. (2005). North American grassland birds: an unfolding conservation crisis? J. Wildl. Manage. 69, 1–13. doi: 10.2193/0022-541x(2005)069<0001:nagbau>2.0.co;2
Briske, D. D., Derner, J., Brown, J., Fuhlendorf, S. D., Teague, W., Havstad, K., et al. (2008). Rotational grazing on rangelands: reconciliation of perception and experimental evidence. Rangel. Ecol. Manage. 61, 3–17. doi: 10.2111/06-159r.1
Briske, D. D., Derner, J. D., Milchunas, D. G., and Tate, K. W. (2011). “An evidence-based assessment of prescribed grazing practices,” in Conservation Benefits of Rangeland Practices: Assessment, Recommendations, and Knowledge Gaps, ed. D. D. Briske (Lawrence: Allen Press), 21–74.
Busack, S. D., and Bury, R. B. (1974). Some effects of off-road vehicles and sheep grazing on lizard populations in the Mojave Desert. Biol. Cons. 6, 179–183. doi: 10.1016/0006-3207(74)90064-0
Caswell, H. (2001). Matrix Population Models: Construction, Analysis, and Interpretation. Sunderland, MA: Sinauer Associates.
Chandler, R. B., and Clark, J. D. (2014). Spatially explicit integrated population models. Methods Ecol. Evol. 5, 1351–1360. doi: 10.1111/2041-210x.12153
Coates, P. S., Prochazka, B. G., Ricca, M. A., Halstead, B. J., Casazza, M. L., Blomberg, E. J., et al. (2018). The relative importance of intrinsic and extrinsic drivers to population growth vary among local populations of greater sage-grouse: An integrated population modeling approach. Auk 135, 240–261. doi: 10.1642/auk-17-137.1
Connelly, J. W., Gratson, M. W., and Reese, K. P. (1998). “Sharp-tailed grouse (Tympanuchus phasianellus), version 2.0,” in The Birds of North America, eds A. F. Poole and F. B. Gill (Ithaca, NY: Cornell Lab of Ornithology).
Crawford, J. A., Olson, R. A., West, N. E., Mosley, J. C., Schroeder, M. A., Whitson, T. D., et al. (2004). Ecology and management of sage-grouse and sage-grouse habitat. J. Range Manage. 57, 2–19. doi: 10.2111/1551-5028(2004)057[0002:eamosa]2.0.co;2
Derner, J. D., Lauenroth, W. K., Stapp, P., and Augustine, D. J. (2009). Livestock as ecosystem engineers for grassland bird habitat in the western Great Plains of North America. Rangel. Ecol. Manage. 62, 111–118. doi: 10.2111/08-008.1
Dettenmaier, S. J., Messmer, T. A., Hovick, T. J., and Dahlgren, D. K. (2017). Effects of livestock grazing on rangeland biodiversity: A meta-analysis of grouse populations. Ecol. Evol. 7, 7620–7627. doi: 10.1002/ece3.3287
Douglass, R. J., and Frisina, M. R. (1993). Mice and management on the Mount Haggin Wildlife Management Area. Rangelands 15, 8–12.
Duquesne, S., Liess, M., and Bird, D. J. (2004). Sub-lethal effects of metal exposure: physiological and behavioural responses of the estuarine bivalve Macoma balthica. Marine Environ. Res. 58, 245–250. doi: 10.1016/j.marenvres.2004.03.066
Frisina, M. R. (1991). Grazing private and public land to improve the Fleecer Elk Winter Range. Rangelands 13, 291–294.
Fuhlendorf, S. D., and Engle, D. M. (2001). Restoring heterogeneity on rangelands: Ecosystem management based on evolutionary grazing patterns. BioScience 51, 625–632. doi: 10.1641/0006-3568(2001)051[0625:rhorem]2.0.co;2
Fuhlendorf, S. D., Harrell, W. C., Engle, D. M., Hamilton, R. G., Davis, C. A., and Leslie, D. M. Jr. (2006). Should heterogeneity be the basis for conservation? Grassland bird response to fire and grazing. Ecol. Appl. 16, 1706–1716. doi: 10.1890/1051-0761(2006)016[1706:shbtbf]2.0.co;2
Gauthier, G., Besbeas, P., Lebreton, J.-D., and Morgan, B. J. (2007). Population growth in snow geese: a modeling approach integrating demographic and survey information. Ecology 88, 1420–1429. doi: 10.1890/06-0953
Gelman, A., and Rubin, D. B. (1992). Inference from iterative simulation using multiple sequences. Statist. Sci. 7, 457–472.
Gillette, G. L. (2014). Ecology and Management of Columbian Sharp-Tailed Grouse in Southern Idaho: Evaluating Infrared Technology, the Conservation Reserve Program, Statistical Population Reconstruction, and the Olfactory Concealment Theory. Ph.D.thesis, Moscow, ID: University of Idaho.
Gotelli, N., and Ellison, A. (2004). Primer of Ecological Statistics. Sunderland, MA, USA: Sinauer Associates.
Hagen, C. A., Sandercock, B. K., Pitman, J. C., Robel, R. J., and Applegate, R. D. (2009). Spatial variation in lesser prairie-chicken demography: a sensitivity analysis of population dynamics and management alternatives. J. Wildl. Manage. 73, 1325–1332. doi: 10.2193/2008-225
Halstead, B., Wylie, G., Coates, P., Valcarcel, P., and Casazza, M. (2012). Bayesian shared frailty models for regional inference about wildlife survival. Anim. Cons. 15, 117–124. doi: 10.1111/j.1469-1795.2011.00495.x
Heim, N., Fisher, J. T., Clevenger, A., Paczkowski, J., and Volpe, J. (2017). Cumulative effects of climate and landscape change drive spatial distribution of Rocky Mountain wolverine (Gulo gulo L.). Ecol. Evol. 7, 8903–8914. doi: 10.1002/ece3.3337
Hormay, A. L., and Evanko, A. B. (1958). Rest-Rotation Grazing: A Management System for Bunchgrass Ranges. Berkeley: California Forest and Range Experiment Station.
Kaiser, P. H., Berlinger, S. S., and Fredrickson, L. H. (1979). Response of blue-winged teal to range management on waterfowl production areas in southeastern south Dakota. Rangel. Ecol. Manage. 32, 295–298. doi: 10.2307/3897835
Kéry, M., and Schaub, M. (2011). Bayesian Population Analysis using WinBUGS: A Hierarchical Perspective. Amsterdam: Academic Press.
Kraft, J. D. (2016). Vegetation Characteristics and Lesser Prairie Chicken Responses to Land Cover Types and Grazing Management in Western Kansas. Ph.D.thesis, Manhattan: Kansas State University.
Krausman, P. R., Naugle, D. E., Frisina, M. R., Northrup, R., Bleich, V. C., Block, W. M., et al. (2009). Livestock grazing, wildlife habitat, and rangeland values. Rangelands 31, 15–19. doi: 10.2111/1551-501x-31.5.15
Lagendijk, D., Howison, R. A., Esselink, P., and Smit, C. (2019). Grazing as a conservation management tool: responses of voles to grazer species and densities. Basic Appl. Ecol. 34, 36–45. doi: 10.1016/j.baae.2018.10.007
Mathews, S. R., Coates, P. S., Prochazka, B. G., Ricca, M. A., Meyerpeter, M. B., Espinosa, S. P., et al. (2018). An Integrated Population Model for Greater Sage-Grouse (Centrocercus Urophasianus) in the Bi-State Distinct Population Segment, California and Nevada, 2003–17. Reston, VA: US Geological Survey.
McNew, L., Cascaddan, B., Hicks-Lynch, A., Milligan, M., Netter, A., Otto, S., et al. (2017). Restoration Plan for Sharp-Tailed Grouse Recovery in Western Montana. Bozeman, MT, USA: Montana Fish and Wildlife and Parks and Montana State University.
McNew, L. B., Gregory, A. J., Wisely, S. M., and Sandercock, B. K. (2012). Demography of greater prairie-chickens: Regional variation in vital rates, sensitivity values, and population dynamics. J. Wildl. Manage. 76, 987–1000. doi: 10.1002/jwmg.369
McNew, L. B., Winder, V. L., Pitman, J. C., and Sandercock, B. K. (2015). Alternative rangeland management strategies and the nesting ecology of greater prairie-chickens. Rangel. Ecol. Manage. 68, 298–304. doi: 10.1016/j.rama.2015.03.009
Medin, D. E. (1989). Small Mammal Populations in a Grazed and Ungrazed Riparian Habitat in Nevada. Ogden, Utah: U.S. Dept. of Agriculture, Forest Service, Intermountain Forest and Range Experiment Station.
Messinger, L. N., Stuber, E. F., Chizinski, C. J., and Fontaine, J. J. (2019). Mortality, perception, and scale: Understanding how predation shapes space use in a wild prey population. PLoS One 14:e0222272. doi: 10.1371/journal.pone.0222272
Milligan, M. C., Berkeley, L., and McNew, L. B. (2020a). Effects of rangeland management on the nesting ecology of sharp-tailed grouse. Rangel. Ecol. Manage. 73, 128–137. doi: 10.1016/j.rama.2019.08.009
Milligan, M. C., Berkeley, L. I., and McNew, L. B. (2020b). Effects of rangeland management on the survival of adult sharp-tailed grouse. J. Wildl. Manage. 84, 1296–1305. doi: 10.1002/jwmg.21909
Nellemann, C., Jordhøy, P., Støen, O.-G., and Strand, O. (2000). Cumulative impacts of tourist resorts on wild reindeer (Rangifer tarandus tarandus) during winter. Arctic 53, 9–17.
Pitman, J. C., Hagen, C. A., Jamison, B. E., Robel, R. J., Loughin, T. M., and Applegate, R. D. (2006). Survival of juvenile lesser prairie-chickens in Kansas. Wildl. Soc. Bull. 34, 675–681. doi: 10.2193/0091-7648(2006)34[675:sojlpi]2.0.co;2
Plummer, M. (2018). rjags: Bayesian Graphical Models using MCMC. R package version 4-8. Available online at: https://CRAN.R-project.org/package=rjags (accessed on May 16, 2019).
Poiani, K. A., Merrill, M. D., and Chapman, K. A. (2001). Identifying conservation-priority areas in a fragmented Minnesota landscape based on the umbrella species concept and selection of large patches of natural vegetation. Conserv. Biol. 15, 513–522. doi: 10.1046/j.1523-1739.2001.015002513.x
R Core Team (2018). R: A Language and Environment for Statistical Computing. Vienna: R Foundation for Statistical Computing. Available online at: https://www.R-project.org/.
Reynolds, T. D., and Trost, C. H. (1980). The response of native vertebrate populations to crested wheatgrass planting and grazing by sheep. J. Range Manage. 33, 122–125. doi: 10.2307/3898425
Ricketts, A. M., and Sandercock, B. K. (2016). Patch-burn grazing increases habitat heterogeneity and biodiversity of small mammals in managed rangelands. Ecosphere 7:e01431.
Robel, R. J., Henderson, F. R., and Jackson, W. (1972). Some sharp-tailed grouse population statistics from South Dakota. J. Wildl. Manage. 36, 87–98. doi: 10.2307/3799191
Robinson, R. A., Morrison, C. A., and Baillie, S. R. (2014). Integrating demographic data: towards a framework for monitoring wildlife populations at large spatial scales. Methods Ecol. Evol. 5, 1361–1372. doi: 10.1111/2041-210x.12204
Roersma, S. J. (2001). Nesting and Brood Rearing Ecology of Plains Sharp-Tailed Grouse (Tympanuchus Phasianellus Jarnesi) in a Mixed-Grass/Fescue Ecoregion of Southem Alberta. Ph.D.thesis, Winnipeg: University of Manitoba.
Royle, J. A. (2004). N-mixture models for estimating population size from spatially replicated counts. Biometrics 60, 108–115. doi: 10.1111/j.0006-341X.2004.00142.x
Schaub, M., and Abadi, F. (2011). Integrated population models: a novel analysis framework for deeper insights into population dynamics. J. Ornithol. 152, 227–237. doi: 10.1007/s10336-010-0632-7
Schaub, M., Reichlin, T. S., Abadi, F., Kéry, M., Jenni, L., and Arlettaz, R. (2012). The demographic drivers of local population dynamics in two rare migratory birds. Oecologia 168, 97–108. doi: 10.1007/s00442-011-2070-5
Sheppard, N., Pitt, K. A., and Schlacher, T. A. (2009). Sub-lethal effects of off-road vehicles (ORVs) on surf clams on sandy beaches. J. Exp. Marin. Biol. Ecol. 380, 113–118. doi: 10.1016/j.jembe.2009.09.009
Smith, C. C. (1940). The effect of overgrazing and erosion upon the biota of the mixed-grass prairie of Oklahoma. Ecology 21, 381–397. doi: 10.2307/1930847
Smith, J. T., Tack, J. D., Berkeley, L. I., Szczypinski, M., and Naugle, D. E. (2018). Effects of livestock grazing on nesting sage-grouse in central Montana. J. Wildl. Manage. 82, 1503–1515. doi: 10.1002/jwmg.21500
Strauss, S. Y. (1991). Direct, indirect, and cumulative effects of three native herbivores on a shared host plant. Ecology 72, 543–558. doi: 10.2307/2937195
Taylor, R. L., Walker, B. L., Naugle, D. E., and Mills, L. S. (2012). Managing multiple vital rates to maximize greater sage-grouse population growth. J. Wildl. Manage. 76, 336–347. doi: 10.1002/jwmg.267
Van Poollen, H. W., and Lacey, J. R. (1979). Herbage response to grazing systems and stocking intensities. J. Range Manage. 32, 250–253. doi: 10.2307/3897824
Williams, R., Thomas, L., Ashe, E., Clark, C. W., and Hammond, P. S. (2016). Gauging allowable harm limits to cumulative, sub-lethal effects of human activities on wildlife: A case-study approach using two whale populations. Marin. Policy 70, 58–64. doi: 10.1016/j.marpol.2016.04.023
Keywords: grazing, grouse, integrated population model, rangeland management, rest-rotation
Citation: Milligan MC and McNew LB (2022) Evaluating the Cumulative Effects of Livestock Grazing on Wildlife With an Integrated Population Model. Front. Ecol. Evol. 10:818050. doi: 10.3389/fevo.2022.818050
Received: 18 November 2021; Accepted: 03 May 2022;
Published: 20 May 2022.
Edited by:
Peter Leimgruber, Smithsonian Institution, United StatesReviewed by:
Lynn Huntsinger, University of California, Berkeley, United StatesJames Mouton, Smithsonian Migratory Bird Center, United States
Copyright © 2022 Milligan and McNew. This is an open-access article distributed under the terms of the Creative Commons Attribution License (CC BY). The use, distribution or reproduction in other forums is permitted, provided the original author(s) and the copyright owner(s) are credited and that the original publication in this journal is cited, in accordance with accepted academic practice. No use, distribution or reproduction is permitted which does not comply with these terms.
*Correspondence: Lance B. McNew, lance.mcnew@montana.edu
†Present address: Megan C. Milligan, U.S. Geological Survey, Western Ecological Research Center, Reno, NV, United States