 Haoxi Ding1,2
 Hongfen Zhu
- 1College of Resources and Environment, Shanxi Agricultural University, Taigu, China
- 2National Experimental Teaching Demonstration Center for Agricultural Resources and Environment, Shanxi Agricultural University, Taigu, China
- 3The New Zealand Institute for Plant & Food Research Limited, Christchurch, New Zealand
Soil nitrogen density (SND), which is influenced by environmental factors operating at different spatial scales and intensities, is critical for agricultural production and soil quality. Although the spatiotemporal distribution of top-layer SND has been well explored, the scale effects of environmental factors on the temporal changes of SND (SNDT) are poorly studied, which might promote the predictive accuracy of SNDT. Thus, SNDT during a certain period was calculated to explore the multiscale effects of environmental factors on it. In the study, three sampling transects under the basins of warm-temperate, mid-temperate, and warm-temperate zones were established with 200 km long and 1 km intervals to explore the spatial variation of SNDT, examine the multiscale effect of environmental factors on it, construct the predicting models based on its scale-specific relations with environmental factors, and validate the models in each basin or in other climate-zone basins. The results indicated that the increment of SND during a certain period was the greatest in the mid-temperate basin, and the variation of SNDT was ranked as cool-temperate > mid-temperate > warm-temperate basins. Under different soil types, the spatial characteristics of SNDT were different in different climate-zone basins, but the average SNDT under cropland was the greatest in each basin. Considering the influencing factors (climatic, topographic, and vegetation factors), they had controls on SNDT operating at different spatial scales. In regard to the prediction of SNDT, the method of partial least square regression (PLSR) combined with a multiscale analysis was found to be more preferable for dependent SNDT prediction than the traditional method of stepwise multiple linear regression but could not be validated for the independent validation data in other basins. Thus, the spatial multiscale relations of SNDT with environmental factors could provide more information for each basin, and the integration of the extra information decomposed by wavelet transform into the method of PLSR could enhance the SNDT prediction for dependent datasets. These findings are of great significance for future studies in the spatial modeling of SND temporal dynamics under the influence of environmental changes.
Introduction
Soil N (SN) is closely linked to the soil carbon stock because the input of additional N could support the accumulation of soil carbon as a result of regulating terrestrial carbon sequestration (Ngaba et al., 2020), and it is the largest contributor to atmospheric N2O emissions, which is a relatively stable greenhouse gas contributing to stratospheric ozone destruction (Chapuis-Lardv et al., 2007). Thus, soil nitrogen stock (SNS) is critical to soil quality and environmental changes. However, the temporal and spatial heterogeneity of topsoil N varied greatly, accompanied by spatiotemporal changes of environmental characteristics, and SNS requires a timely updated look at what is happening. Therefore, the spatial distribution of temporal changes in soil nitrogen density (SNDT), which is the prerequisite for the assessment of SNS spatiotemporal variability, should be predicted for agricultural management and climatic changes.
The spatial variation of SN under different environmental conditions (Gao et al., 2019) and its temporal variability after land-use conversion (Ngaba et al., 2020) have been extensively explored. For example, temperature and precipitation were the key factors affecting the variations of SN in a previous study (Ngaba et al., 2020); the elevation and slope significantly influenced SN distribution due to regional natural environment and soil erosion, but SN did not demonstrate any significant variations under different land-use types in the hilly region of subtropical China (Zhang et al., 2020); the concentration of SN was greater under farmland, followed by grassland and shrubland on the Chinese Loess Plateau (Wang et al., 2009); elevated N input could improve net primary production (NPP) (Adamek, 2009). In other words, climatic and topographic factors control the spatial variation of SN, while SN regulates above-aground NPP.
Previous studies indicated that environmental variables control soil properties at different spatial scales with different intensities (Si, 2008; Hu et al., 2017), and the scale of influence on soil properties may not always be at the original sampling scales (Biswas and Si, 2011). Many studies have been conducted to clarify the spatial scaling effects of soil organic carbon (SOC) and to identify its controls based on the multiscale analyzing methods, such as wavelet transform (WT), empirical model decomposition (EMD), and Fourier transform. For example, Zhou et al. (2021) examined the spatial variations of SOC at different scales, and the effects of environmental factors on SOC were explained in Chinese Tibet using the two-dimensional empirical mode decomposition (2DEMD). The scale- and location-specific correlations between temperature and SOC was analyzed across the globe by a spherical wavelet analysis (Huang et al., 2018). The scale-specific dominant factors affecting SOC spatial distributions were identified by the multivariate empirical model decomposition (MEMD) (She et al., 2016).
The prediction model of SOC was established based on their scale-dependent relationships with environmental factors by discrete wavelet transform (Zhu et al., 2018), and the SOC prediction was also performed based on the location- and scale-effects of environmental factors by the combination of 2DEMD, geographical weighted regression, and stepwise multiple linear regression (SMLR) (Zhu et al., 2020b), but the validation of the predicting models was not carried out in previous studies. Although the multiscale characteristics of SN were presented based on MEMD (Zhu et al., 2019), less research has been done to not only address the spatial scaling effects of environmental variables on SNDT but also establish the predicting models based on their spatially scaling relations. Thus, there is still uncertainty about the spatial scaling effects of environmental factors on SNDT in the typical landscape of the basin. We assume that the multiscale analysis of SNDT could provide more information for understanding and predicting its spatial distributions.
Under diverse environmental conditions in Shanxi Province, the variation characteristic of SNDT and the soil–environmental relationships vary greatly, resulting from the effect of different dominant environmental variables on the soil formation. From north to south of the Shanxi Province, the widely distributed landform of the basin, where high-quality arable land is distributed, should be considered. Whether the predicting model of SNDT in each basin is effective based on its spatial scaling relations with influencing factors should be explored extensively for obtaining the spatial and temporal distributions of SND accurately for its better management in the future. In two basins located in different climate zones, whether the prediction model of SNDT is validated should also be studied for the model's validation in different basins. Therefore, the aims of this study were to (1) analyze the scale-specific variations of SNDT, (2) examine the scale-specific relationships between SNDT and environmental factors, (3) establish the predicting model of SNDT based on its scale-dependent relations with environmental factors, and (4) validate the predicting model in each basin or in the other basins.
Materials and Methods
Site Description
The study area is located in Shanxi Province (110°14′-114°33′ E, 34°35′-40°45′ N), Central China (Figure 1A). This region is in the semi-arid continental monsoon climate zone, which is divided into three climate zones, namely, cool-temperate, mid-temperate, and warm-temperate zones based on the latitudinal extent. The mean annual temperature varies from 8°C in the north to 12°C in the south, and the accumulated temperature (≥10°C) ranges from 1,850 to 5,480°C. The accumulated precipitation varies from 410 to 690 mm. The major soil types in Shanxi Province are cinnamon soil, fluvo-aquic soil, castanozem soil, and castano-cinnamon soil according to Chinese Soil Taxonomy (Figure 1B), with the pH level as “alkaline.” The elevation ranges from 245 m to 3,058 m, and more than 70% of the total area is covered with mountains (Figure 1C). High-quality farmland is mainly located in the six basins of Shanxi Province, which are the Datong basin, Xinding basin, Taiyuan basin, Changzhi basin, Linfen basin, and Yuncheng basin (Figure 1C).
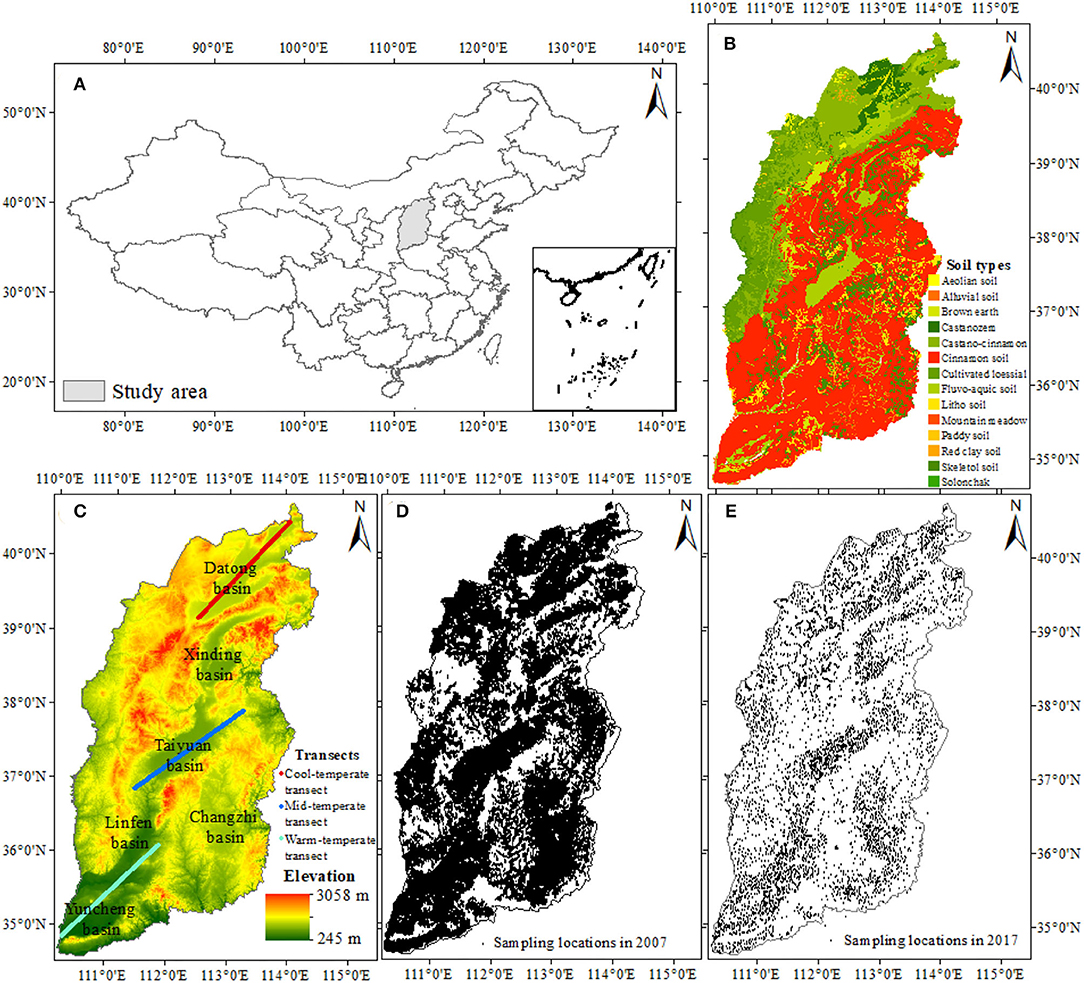
Figure 1. (A) Geographic location of study area, (B) soil types, (C) digital elevation model (DEM) and sampling transects across the basins of Datong (cool-temperate transect), Taiyuan (mid-temperate transect), and Yuncheng (warm-temperate transect), (D) soil sampling locations in 2007, and (E) soil sampling locations in 2017.
Data Acquisitions
A total of 302,045 points of soil samples were sampled during 2006–2008 (Figure 1D), and the temporal change during the period of sampling was ignored in the study. At each location, a composite sample of 0–20 cm soil layer from three sampling points was collected within 1 m, and an undisturbed surface soil was collected using a metallic core cylinder of 100 cm3 volume. Soil total nitrogen (SN) was measured using the Kjeldahl method, standing for the SN content of around 2007. Soil bulk density (SBD) was measured using the oven-dry method. Additionally, a total of 6,128 points of topsoil samples (0–20 cm) sampled during 2017 were collected (Figure 1E). The SN and SBD were also measured using the Kjeldahl method and the oven-dry method, respectively. The SND (kg m−2) of 2007 and 2017 were calculated as follows (Tian et al., 2006):
where L is soil thickness (cm), SN is soil total nitrogen concentration (g kg−1), SBD is soil bulk density (g cm−3), and F is gravel (>2 mm) percentage. In this study, F was taken as 0 because large gravel rarely appeared in homogeneous loess (Liu et al., 2011). Subsequently, the temporal changes of SND during 2007–2017 (SNDT, kg m−2 10a−1) could be calculated by the difference between SND of 2017 and SND of 2007. Finally, the spatial distribution of SNDT with 30 m resolution in Shanxi Province was calculated using the ordinary kriging without anisotropy in ArcGIS.
In the study, three soil sampling transects, which were mainly under the Datong basin located in the cool-temperate zone, the Taiyuan basin located in the mid-temperate zone, and the Linfen basin located in the warm-temperate zone, were established to 200 km long and with 1 km intervals. The SNDT content along the three transects was extracted from the spatial distribution of SNDT.
A total of 179 meteorological stations in and around Shanxi Province from 2007 to 2017 were collected from Climatic Data Center, National Meteorological Information Center. The average temperature (AAT), accumulated precipitation (AAP), averaged sunshine during (SSD), and relative humidity (RH) during each year were obtained, and averaged annual values of the four factors during 2007–2017 were calculated. The spatial distributions of AAT, AAP, SSD, and RH in Shanxi Province were predicted by the ANUSPLIN Meteorological Interpolation Model with 30 m resolution, and the four climatic factors at the three sampling transects were extracted. Altitude was obtained from the digital elevation model (DEM) with 30 m resolution, and slope was calculated from the altitude. The topographic factors, including altitude and slope along the three transects, were also extracted. Net primary productivity (NPP) during 2007–2017 from a moderate resolution imaging spectrometer (MODIS) was downloaded from the website (https://modis.gsfc.nasa.gov/), and the averaged NPP during 2007–2017 was calculated to represent the vegetation conditions.
Continuous Wavelet Transform and Partial Wavelet Coherence
Continuous Wavelet Transform
Wavelet transform was used to analyze the multiscale effects of spatial or time series, which arise from the finite spatial or temporal domain (Biswas et al., 2013). For the spatial series SNDT (represented by Y) measured along a location series X, the WT function is expressed as follows:
where ψ(Xi) is the basic wavelet function, and i is the spatial location from 0 to 200 km. The parameter a is the dilation (a > 1) or contraction (0 < a < 1) factor, and b is the translation or shift of the function (Kumar and Foufoula-Georgiou, 1993). The inverse WT is defined as follows:
where A and B are upper and lower bounds, respectively. There are two types of WT, namely, CWT and DWT. If the wavelet coefficients are calculated at continuous scales and locations, the method is defined as CWT.
Partial Wavelet Coherence
Based on bivariate wavelet coherence (BWC), the PWC between the response variable SNDT is represented by Y, the predictor variable of each environmental factor is represented by X (e.g., AAT), and excluding variables of the other environmental factors is represented by Z (Z = [Z1, Z2, …, Zm], e.g., Z = [AAP, SSD, RH, altitude, slope, and NPP]) at the scale-location domain (s, τ) is expressed as follows:
where , , and can be calculated as follows:
where is the smoothed auto-wavelet power spectra, and is the cross-wavelet power spectra at scale s and location τ. A more detailed description of the PWC can be found in other publications (Hu and Si, 2021).
Data Analysis
The land cover types in both 2007 and 2017 were obtained from a moderate resolution imaging spectrometer (MODIS), and the changed and unchanged regions of land-cover types could be acquired. The land cover types and soil types under the three sampling transects were obtained to analyze the SNDT content under different land types and soil types. The traditional statistics of SNDT and its partial correlation coefficients with environmental factors were calculated.
The PWC between SNDT and environmental variables was performed, and the parameter of percentage area of significant PWC (PASPWC) was calculated to evaluate the strength of their relations. According to previous studies (Si and Zeleke, 2005; Si, 2008; Zhu et al., 2016), their relationships were recognized as statistically significant, if PASPWC is >5%. The influencing factors were decomposed into multiple-scale components by CWT, and the correlation coefficients between SNDT and the environmental factors or their decomposed-scale components were calculated.
Along each transect, the odd points from north to south were selected as the calibration datasets, and all even points were selected as the validation dataset. First, the calibration data of SNDT and environmental factors at the sampling scale were used to develop the model of SMLR to estimate SNDT for validation. Second, the models of partial least square regression (PLSR) were developed from the environmental factors at the sampling and multiple scales, and leave-one-out cross-validation was used to determine the optimal number of latent variables (ONLV) during the calibration procedure. During the validation procedure, the PLSR model was used to predict SNDT for the validation dataset with the ONLV value determined in the calibration. In addition, the predicting models established by each transect from one basin were also validated by the transect from the other basins.
The performance of the SMLR and PLSR models for the calibration and validation data were evaluated using the parameters of R2, root mean square error (RMSE), and the ratio of performance to deviation (RPD). R2 was calculated as follows:
where n is the number of samples and p is the number of the variables in the regression equation.
where Yi, , and are the measured, predicted, and averaged values of SNDT, respectively. SD is the standard deviation of the measured SNDT. Based on the previous studies (Rossel et al., 2006; Kassim et al., 2021), the performance of the predicting models could be classified into six classes: very poor model, which is not recommended (RPD < 1.0), poor model, in which only high and low values can be distinguishable (RPD = 1.0–1.4), fair model, which may be used for prediction (RPD = 1.4–1.8), good model, which can be used for quantitative predictions (RPD = 1.8–2.0), very good model (RPD = 2.0–2.5), and excellent model (RPD > 2.5).
Results
Descriptive Statistics of SNDT and Its Local Variation
Descriptive statistics of SNDT under different soil types along three transects are given in Table 1. From north to south, the mean SNDT values were positive and were 0.04, 0.09, and 0.04 kg m−2 10a−1, respectively, for cool-temperate, mid-temperate, and warm-temperate transects. Thus, the increment of SND during the period of 10 years along the mid-temperate transect was the greatest among the three transects. The variability of SNDT along cool-temperate and mid-temperate transects were classified as strong because the coefficients of variation (CVs) values were >90%; the variability along the warm-temperate transect was classified as moderate because CV values were between 10 and 90%. Meanwhile, CVs for the three transects were ranked as cool-temperate > mid-temperate > warm-temperate transect. Therefore, the spatial variation of SNDT decreased greatly from cool-temperate to warm-temperate basins.
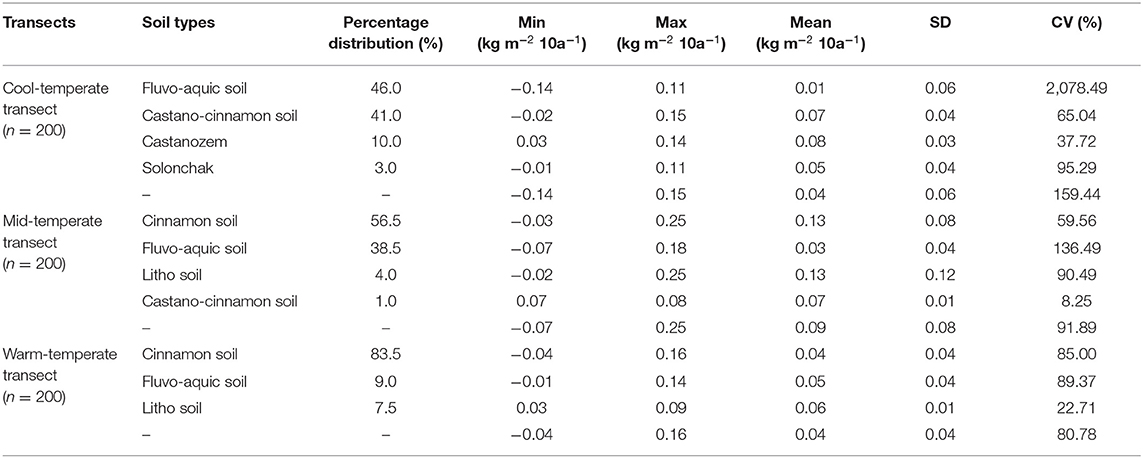
Table 1. Comparison of temporal changes of soil nitrogen density (SNDT) under different soil types along the three transects.
For fluvo-aquic soil, the mean SNDT values were 0.01, 0.03, and 0.05 kg m−2 10a−1 for cool-temperate, mid-temperate, and warm-temperate transects, respectively, which gradually increased from north to south. For castano-cinnamon soil, the mean SNDT values in both cool-temperate and mid-temperate transects were 0.07 kg m−2 10a−1. For cinnamon soil, the mean SNDT values were 0.13 and 0.04 kg m−2 10a−1 for mid-temperate and warm-temperate transects, respectively. For cinnamon soil and litho soil, the increment of SND during the period of 10 years was the greatest along the mid-temperate transect.
Descriptive statistics of SNDT under different land types along the transects are shown in Table 2. The land type was dominant in grassland along the cool-temperate transect and in cropland along the mid-temperate and warm-temperate transects. For cropland, the mean SNDT values were 0.05, 0.09, and 0.05 kg m−2 10a−1 for cool-temperate, mid-temperate, and warm-temperate transects, respectively, and their CV values were around 80%. The results indicated that the spatial variation of SNDT was identical under cropland, even in different climate zones. For grassland and the changed land types, the CVs of SNDT varied greatly under different climate zones.
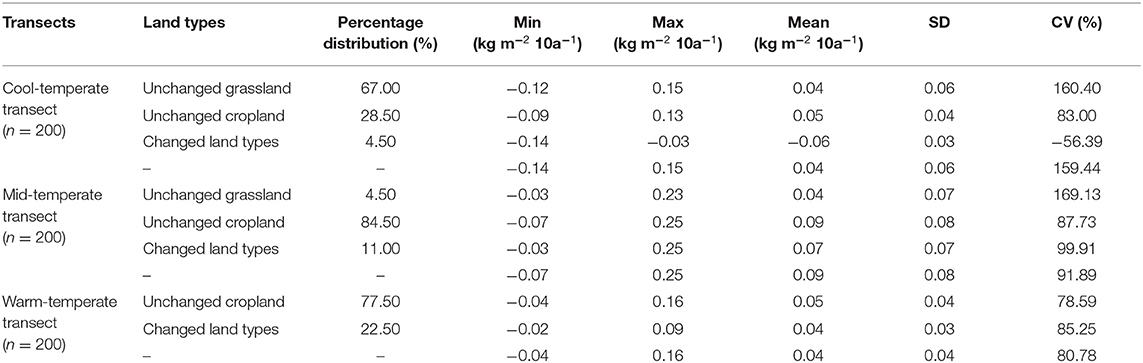
Table 2. Significant spatial variations of temporal changes of soil nitrogen density (SNDT) under different land types along the three transects.
The spatial distribution of SNDT and their local variance are presented in Figure 2. The spatial distribution of SNDT under different climate zones varied greatly, and the significant variation in the scale-location domain was locally distributed. The areas of significant variation were 36, 31, and 21% for the three basins, respectively. Therefore, the significant variations of SNDT were climate-zone dependent.
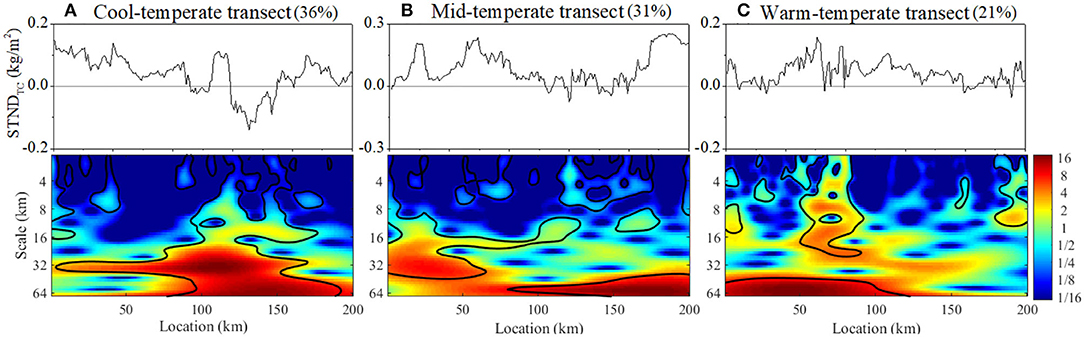
Figure 2. The spatial distribution of temporal change of soil nitrogen density (SNDT) and the local wavelet spectra of SNDT along the (A) cool-temperate, (B) mid-temperate, and (C) warm-temperate transects. The solid black lines in the local wavelet spectra show SNDT variation with >1 standard deviation, and the numbers in the bracket represent the area of significant variations.
Relationships Between Environmental Factors and SNDT at the Sampling and Decomposed Scales
The correlation coefficients between SNDT and the influencing factors at the sampling or decomposed scales are given in Figure 3. If the correlation coefficients were >0.18, their relationships were significant at the 99% confidence level. The correlation types between SNDT and environmental factors were different at different scales, and the influencing intensities of environmental variables on SNDT were also different. For cool-temperate transect, the significant correlation was mainly located at scales of 13–40 km. For mid-temperate transect, the significant relationships was mainly located at scales of 18–68 km. However, for warm-temperate transect, the significant correlations were shown at different scales.
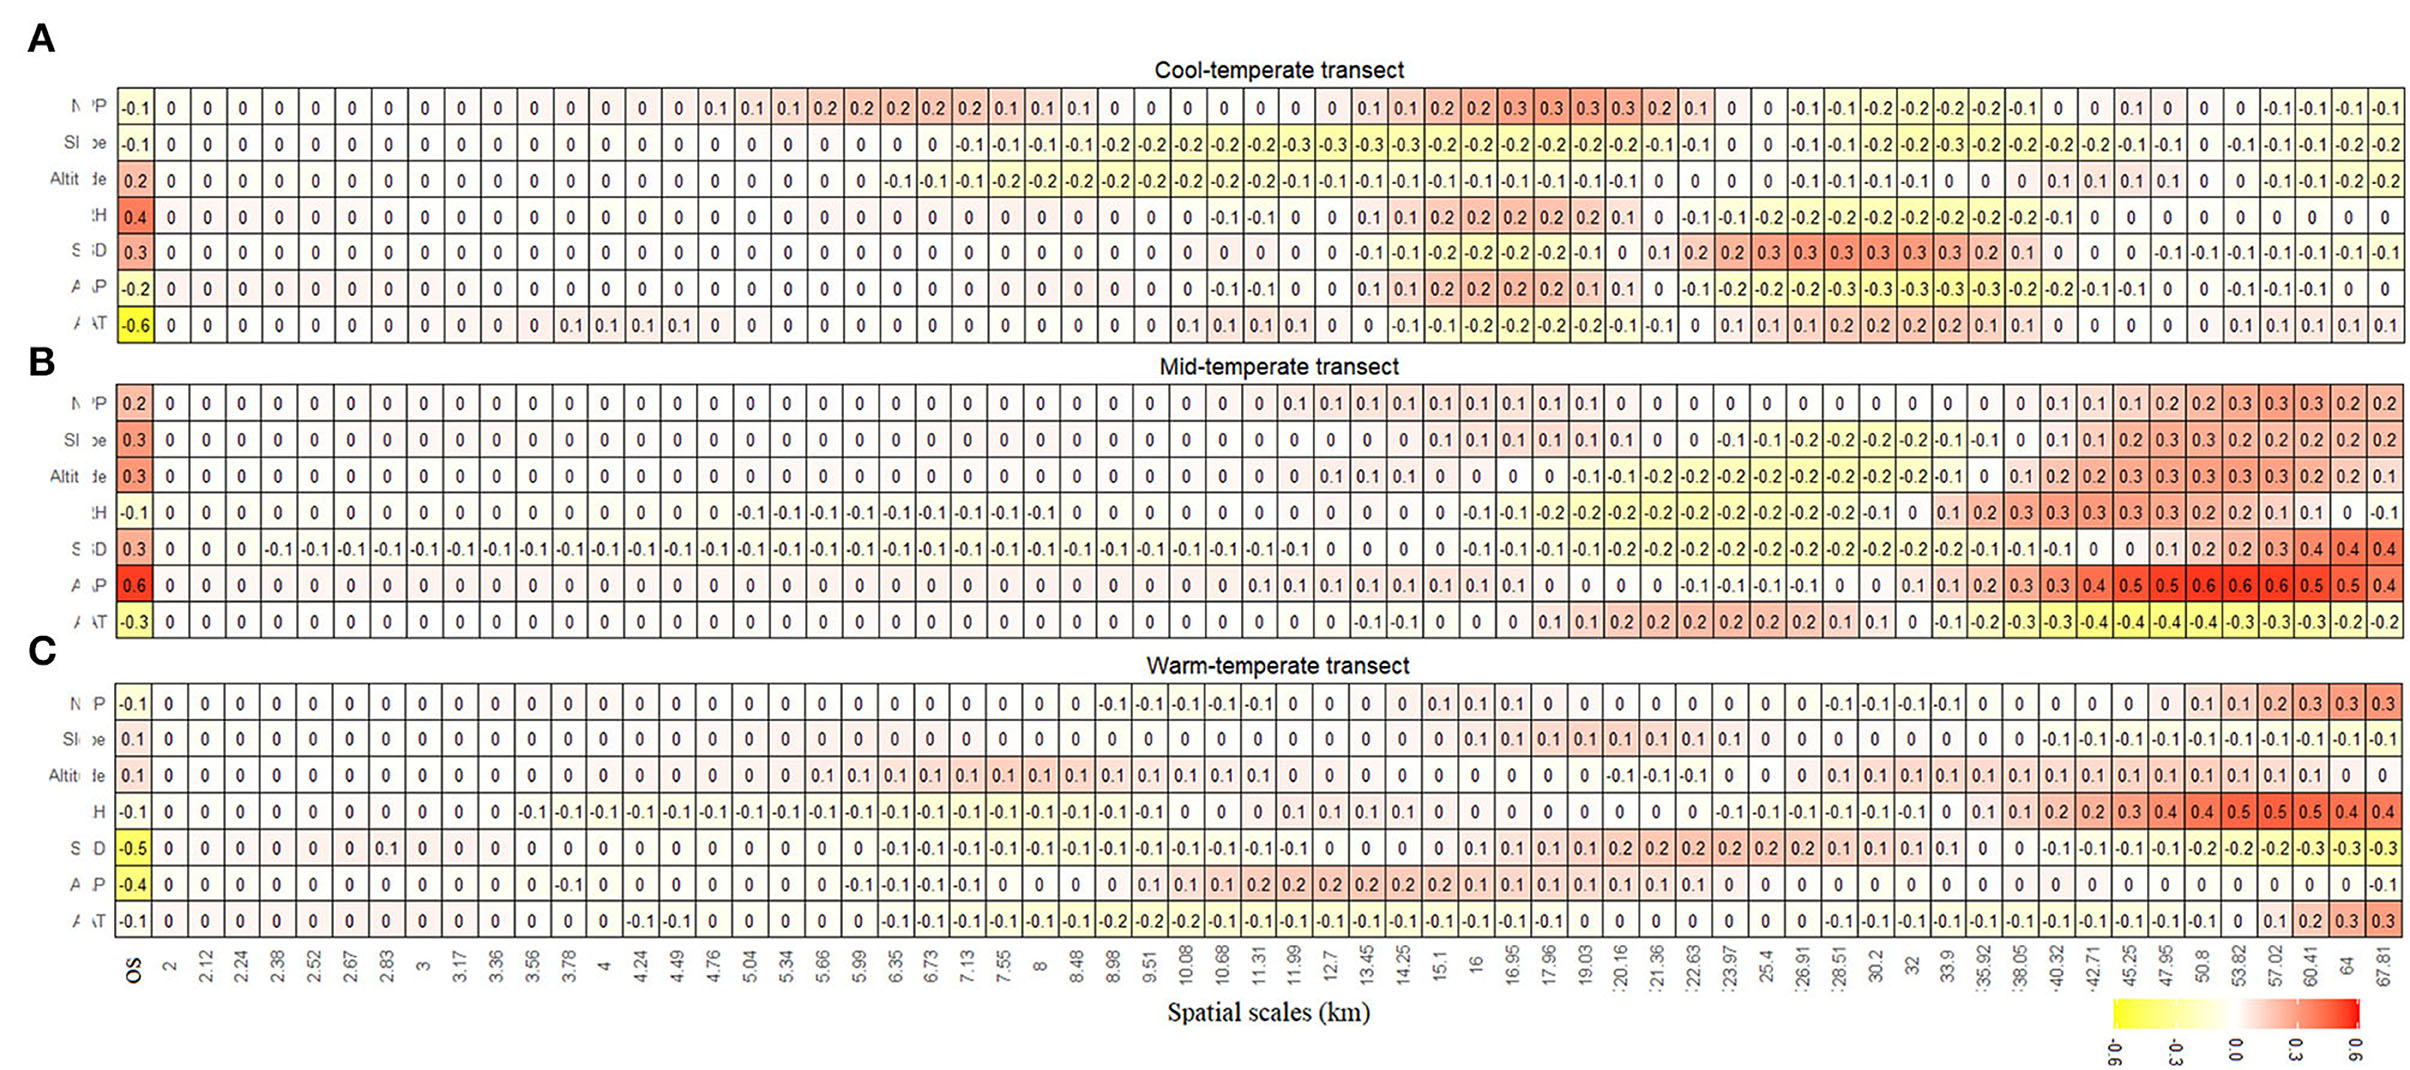
Figure 3. Correlation coefficients between the temporal change of soil nitrogen density (SNDT) and its controlling factors or their decomposed scale components by continuous wavelet transform (CWT) along the (A) cool-temperate, (B) mid-temperate, and (C) warm-temperate transects. The x-axis indicates the original scale or the decomposed scales of the environmental factors.
Partial Correlations Between Environmental Factors and SNDT at the Sampling or Decomposed Scales
The PWCs between SNDT and environmental factors (slope for cool-temperate transect and SSD for mid-temperate and warm-temperate transects were selected; others are not shown) are shown in Figure 4, which indicates the partial correlations between scale components of SNDT and environmental factors at the corresponding scale. Along cool-temperate transect, the scale- and location-specific relationships of SNDT with environmental factors were greater at scales around 60 km, and their significant relations were local at scales <32 km. Along the mid-temperate transect, the scale- and location-specific relationships of SNDT with environmental factors demonstrated that their relations were generally greater than those along the other two transects. Along warm-temperate transect, the correlation of SSD with SNDT was dominant among these influencing factors.
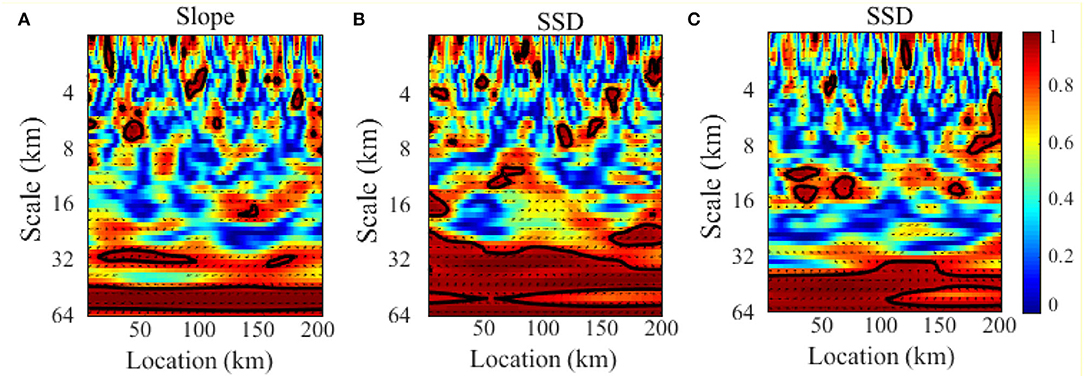
Figure 4. Partial wavelet coherency (PWC) between the temporal change of soil nitrogen density (SNDT) and single predictor variable after excluding the effect of the other variables along the (A) cool-temperate (slope), (B) mid-temperate (SSD), and (C) warm-temperate (SSD) transects. The direction of the arrow shows the type of correlation (the right direction is positive and the left direction is negative), and the solid black lines show significant bivariate wavelet coherence (BWC) at a 95% confidence level.
At the original scale, the partial correlation coefficients between SNDT and influencing factors indicated that AAT, AAP, SSD, and NNP were significantly correlated with SNDT along the cool-temperate transect; AAP, SSD, and RH were significantly correlated with SNDT along the mid-temperate transect; and AAP, SSD, RH, and altitude were significantly correlated with SNDT along the warm-temperate transect (Table 3). Therefore, AAP and SSD significantly controlled the spatial distribution of SNDT at the sampling scale of 1 km at different climatic basins.
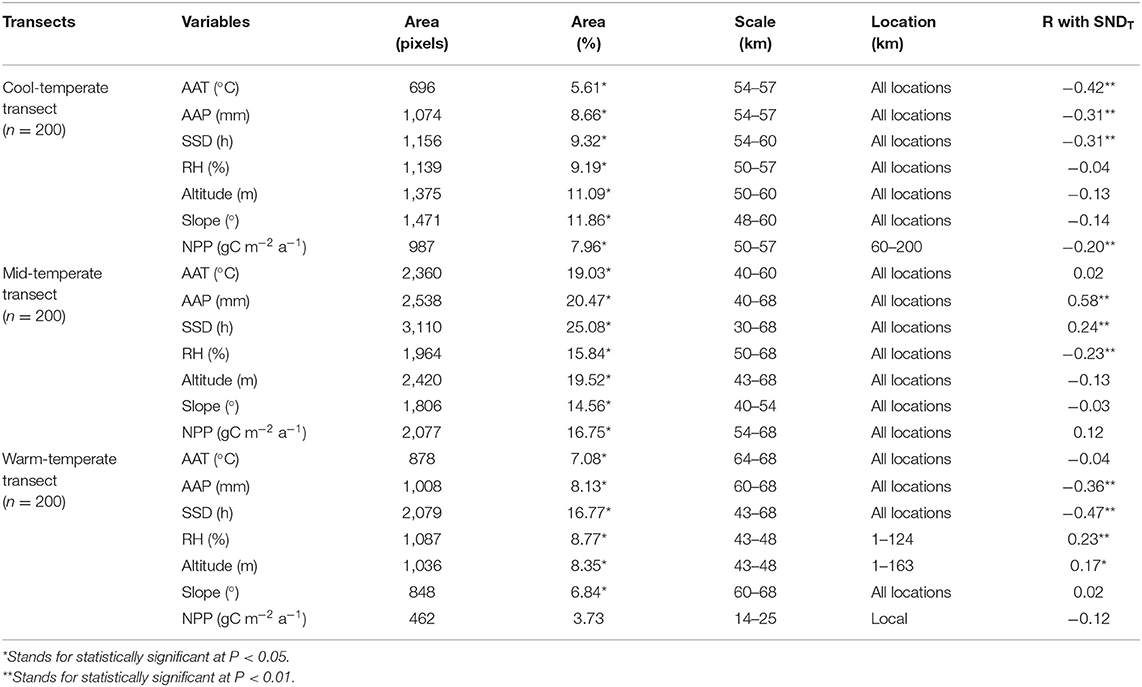
Table 3. The percentage area of significant partial wavelet coherence (PASPWC) between temporal changes of soil nitrogen density (SNDT) and influencing factors and the partial correlation coefficients (R) between SNDT and influencing factors.
The evaluation parameters of PWC between SNDT and influencing factors are also given in Table 3. Along the cool-temperate transect, their significant relationships were mainly located at scales of 50–60 km, and the significant areas were more stable at different locations except for NPP. Along the mid-temperate transect, their significant relationships were mainly located at scales of 30–68 km, while the significant areas were local at some locations and scales, which were the greatest among the three transects. Along the warm-temperate transect, the relationships of SNDT with environmental factors were not prominent except for SSD. In brief, the partial correlations between SNDT and influencing factors at the sampling and decomposed scales were different, which indicated that the information contained in SNDT at the sampling and decomposed scales should be complementary.
Prediction of SNDT at the Sampling Scale
The SNDT values at the sampling scale were predicted by PLSR, and the evaluating parameters at different numbers of latent variables (NLV) are presented in Figure 5. During the calibration procedure, the RMSE gradually decreased and the R2 gradually increased when the NLV ranged from 0 to 50. This indicated that the ONLV in the calibration procedure should be 50. However, the RMSE gradually decreased and then increased, and R2 gradually increased and then decreased with the NLV increasing in the validation procedure. This demonstrated that the predicting performance for the validation data was not always improved with the NLV increasing, and the ONLV in the validation procedure was not 50. In the study, the ONLV for the PLSR model was determined by the leave-one-out cross-validation in the validation procedure, which is presented in Figure 5. Although the NLV with the best predicting performance in the validation model was not always in line with the ONLV determined in the calibration procedure, both NLVs were close to each other. Thus, the ONLV determined in the calibration procedure was suitable for predicting the purpose of the environmental factors at the decomposed scales.
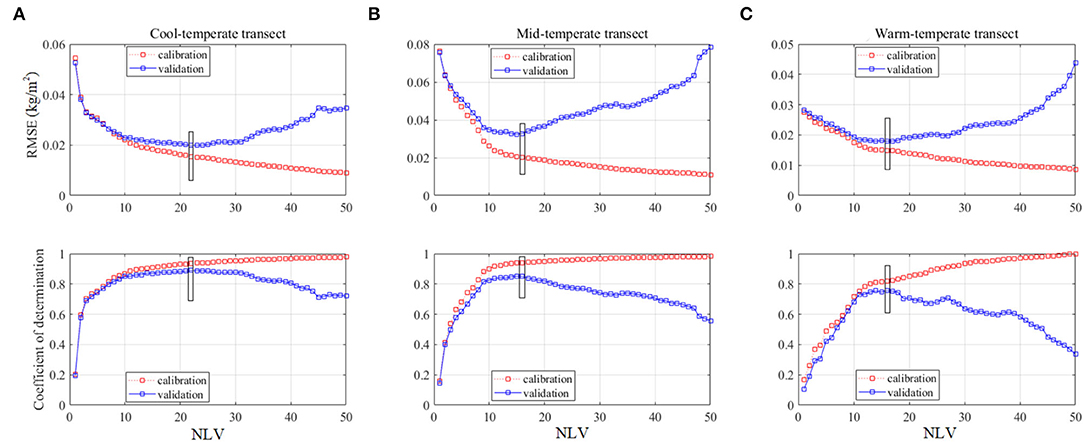
Figure 5. Root mean square error (RMSE) and coefficient of determination (R2) at a different number of latent variables (NLV) in the calibration and validation procedures for (A) cool-temperate, (B) mid-temperate, and (C) warm-temperate transects. The black frames stand for the optimum number of a latent variable (ONLV) determined by the leave-one-out cross-validation in the calibration procedure.
The scatterplots observed by predicted SNDT are shown in Figure 6, and evaluating parameters of the predicting models established by both methods of SMLR and PLSR are presented in Table 4. By SMLR from environmental factors, although the included factors were different along different transects, both the factors of AAP and SSD were included for SNDT prediction in the basins. The calibration model could be classified as a fair model because RPD values ranged from 1.4 to 1.8. However, during the validation procedure, only the model for the mid-temperate transect could be considered a fair model, and the other two models were only poor (RPD ranged from 1.0 to 1.4).
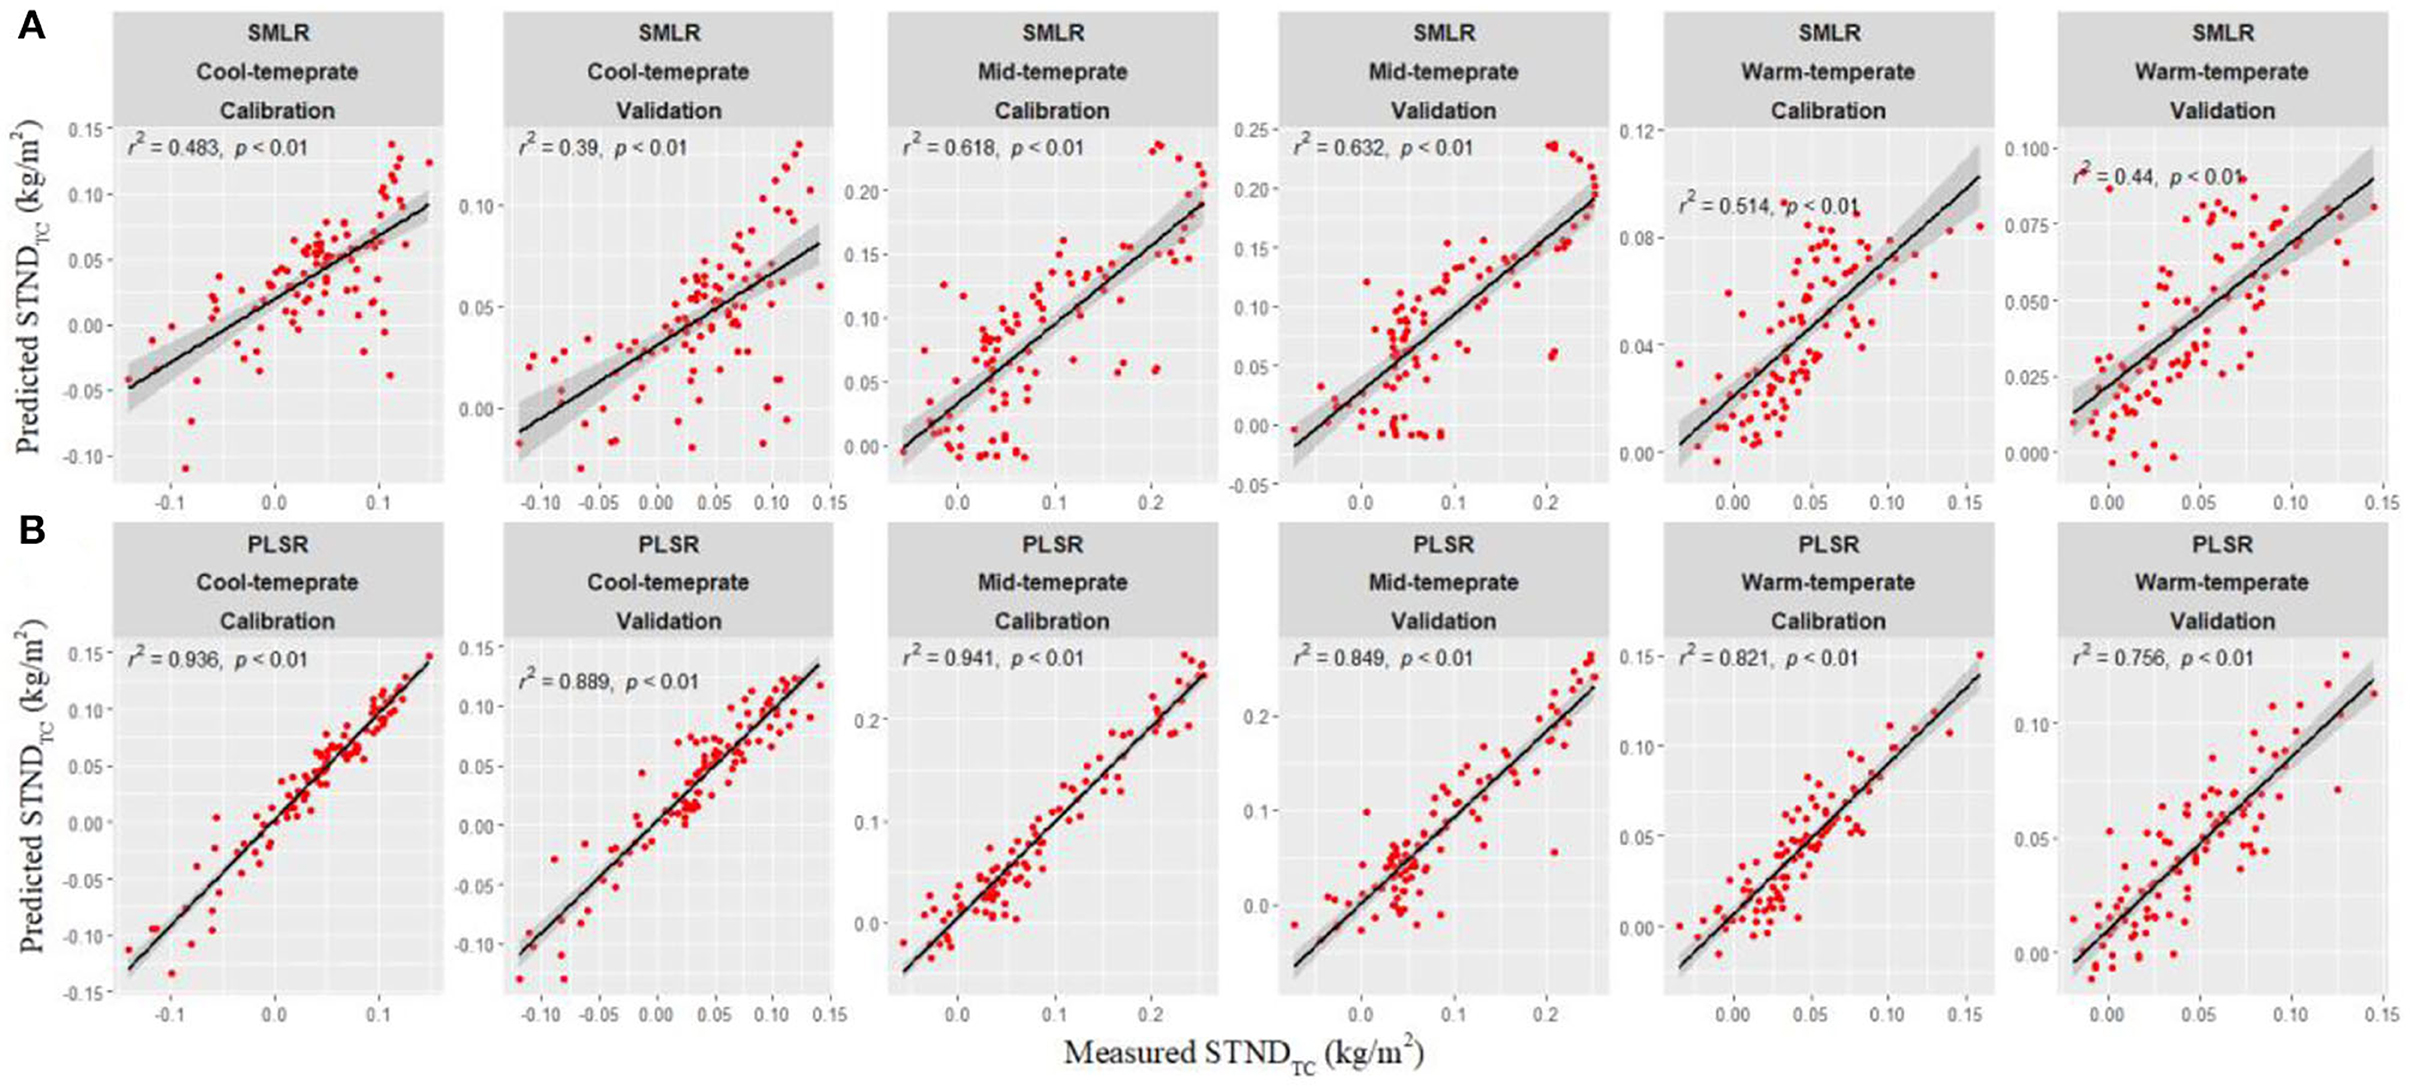
Figure 6. Scatterplots between the measured and predicted temporal change of soil nitrogen density (SNDT) by (A) the stepwise multiple linear regression (SMLR) from the influencing factors and (B) the partial least squares regression (PLSR).
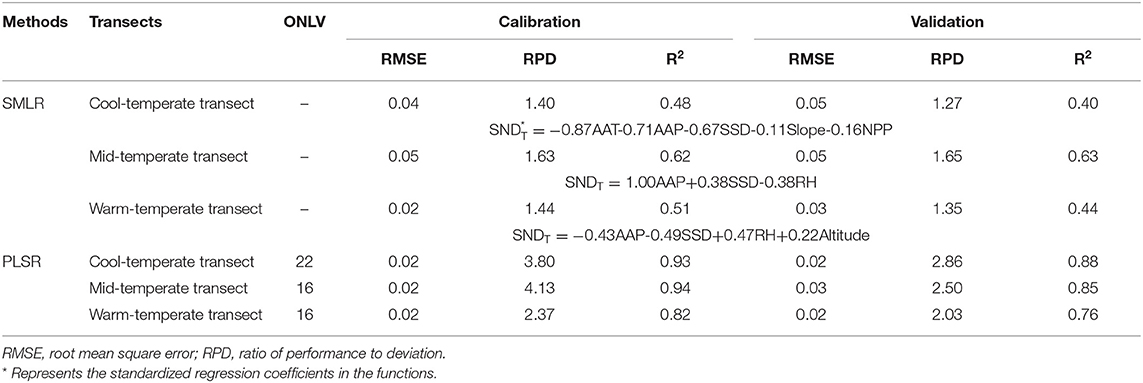
Table 4. Parameters used to assess the temporal changes of soil nitrogen density (SNDT) prediction accuracy, the stepwise multiple linear regression (SMLR) models at the original scale, and the optimal number of latent variables (ONLV) for the partial least square regression (PLSR).
The method of PLSR from the environmental factors at the sampling and decomposed scales could significantly improve the predicting accuracy of SNDT, especially for the cool-temperate transect, which had the worst predicting performance by SMLR, and the best performance by PLSR among the three transects. Along the cool-temperate and mid-temperate transects, the predicting performance for the calibration and validation data was excellent, because RPD was >2.5. However, the predicting accuracy along the warm-temperate transect was good, because the RPD values in the calibration and validation procedures ranged from 2.0 to 2.5. The good performance in the cool-temperate and mid-temperate transects could also be proved by their significant PWC between environmental factors and SNDT at different scales (Figure 4). The study also indicated that the predicting models built in each basin were not reliable in the other basins because of the different effects of environmental factors on SNDT in different climate zones (data not shown).
Discussion
Spatial Characteristics of SNDT
In the spatiotemporal domain, the surface SND varied greatly due to the environmental conditions and human activities. In the study, the indicator of SNDT was established to assess the spatial dependence of temporal changes in SND. Three typical basins located in different climate zones were selected as the study area because of the high-quality arable land dominantly distributed. The mean value of SNDT was positive in all three basins and had the greatest increase in the mid-temperate basin. The result was in line with a previous study (Yang et al., 2015), which proved that the temporal changes of SN presented an increasing trend with time. Previous studies indicated that the rate of denitrification (conversion to N gas) generally increased with the increasing temperature from cool temperature to warm temperature due to the biological activity (Veraart et al., 2011). Meanwhile, the SN input was great in the mid-temperate and warm-temperate basins from fertilizer application or crop straw return because cropland dominated in the two basins. Thus, the high N input and low rate of denitrification in the mid-temperate basin led to a high level of SNDT.
The SNDT demonstrated different statistical characteristics under different soil types, because the predominant N forms were different, resulting in different N cycle processes, including fixation, mineralization, ammonification, nitrification, denitrification, plant assimilation, and so on (Powlson, 1993). The mean SNDT gradually increased from north to south under fluvo-aquic soil, which is developed from river alluvium and widely distributed in these basins. The result might be due to the reason that organic matter decomposes releasing N more quickly in warm humid climates and slower in cool dry climates (Parton et al., 2007). However, the mean SNDT was similar under castano cinnamon soils that resided in different climatic basins. Additionally, a previous study indicated that SNS was influenced by the vegetation type (Marty et al., 2017). In the study, the variability of SNDT was similar under cropland of different climatic basins (around 80%), and also similar under grassland of different climatic basins (around 165%). However, its variability under the changed land types varied greatly resulted from the different land transformations by human. In each basin, the mean SNDT was greater under cropland than that under grassland, and the extract of more SNDT might come from N input from tillage management. For example, the extract of 0.01 kg m−2 10a−1 in the cool-temperate basin (0.05 kg m−2 10a−1 in cropland compared with 0.04 kg m−2 10a−1 in grassland) and the extract of 0.05 in cool-temperate basin (0.09 kg m−2 10a−1 in cropland compared with 0.04 kg m−2 10a−1 in grassland) might come from tillage practices, such as fertilizer or crop straw return.
In the scale-location domain, the significant variations of SNDT were local and different among different transects. This indicated that the dominant pedogenic processes were different under different climatic basins. The area of significant variation was ranked as cool-temperate > mid-temperate > warm-temperate transects, which is identical to the order of CV values (Table 1). The greatest variation of SNDT in the cool-temperate basin (160%) might be attributed to the various rates of denitrification resulting from temperature differences across the basin and the low human impact resulting from dominant grassland. Therefore, the spatial variation of SND temporal changes decreased greatly with decreasing latitude. However, many errors ignored in the study should be considered in the future, such as the discrepancy in the number of samples between 2007 and 2017, the longer period of sampling time around 2007, and the like.
Effects of Environmental Factors on SNDT
Some studies hypothesized that each scale of soil properties was controlled by one or more environmental variables at the original sampling scale. For example, the controls of SOC variation at different scales were unraveled by the environmental variables at the original scale by Zhou et al. (2021). However, SNDT may be controlled by the environmental factors at the other scales that differ from the sampling scale. Some studies identified the controlling factors by separating variations in soil properties as well as in environmental factors at similar scales (Hu and Si, 2013; Zhu et al., 2020a). However, the bivariate relationships might be misleading when both variables are dependent on other variables (Hu and Si, 2021).
In the study, partial correlation at the sampling scale and PWC at the decomposed multiscale were used to unravel the controls of environmental factors on SNDT because of the interdependence between predictor and other variables. The partial correlations between environmental factors and SNDT at the sampling scale differed from their partial relations at the decomposed scales. For example, altitude and slope had an insignificant effect on SNDT at the sampling scale along the cool-temperate transect but had a significant effect at the scales > 1 km. The results indicated that the controls of environmental variables on SNDT cannot be captured only at the sampling scales, which was in line with the characteristics of other soil indicators (Si, 2008; Hu and Si, 2013; She et al., 2016; Liu et al., 2018). In the study, the selected environmental factors had all significant influences on SNDT in the three basins except the factor of NPP in the warm-temperate transect (PASPWC = 3.73). The insignificant relationships between NPP and SNDT in the warm-temperate basin might be attributed to the double-cropping that resulted in intensive human activities.
The significant relationship between SNDT and temperature might result from the fact that temperature was related to N mineralization rate, nitrification, and denitrification (Guntiñas et al., 2012). The study indicated that the correlation type between SNDT and precipitation was unstable at different scales and locations, which might be due to the reason that precipitation could add N inputs from the atmospheric N and may also remove N by leaching and surface runoff of soluble forms (Jarvis et al., 1996). The duration of sunshine was related to crop photosynthesis, which resulted in vegetation N absorption from the soil, and the rate of straw decomposition, which resulted in soil N input (Tian et al., 2019). Relative humidity, which might be linked with gaseous transfer such as N gas and N oxides during nitrification and denitrification processes (Weitz et al., 2001; Abdelaziz and Kim, 2020), could also influence soil N content. The topographic factors of altitude and slope could lead to N loss and deposition, resulting from the surface runoff of soluble N (He et al., 2016; Madrigal Reyes et al., 2019). Vegetation conditions could promote N storage or N absorption or dry deposition from vegetation. In the study, the results indicated that the types of relationships between environmental variables and N greatly differed at different locations or scales.
Prediction of SNDT
To predict SNDT at the sampling scale, the environmental factors were decomposed into multiscale components for covariates. The study revealed that some multiscale components of factors were significantly correlated with SNDT at the sampling scale. Thus, more covariates, which might be beneficial for SNDT prediction, could be generated by the CWT. Because the number of covariates is great and the variables might be cross-correlated, PLSR might be suitable for SNDT prediction (Abdi and Williams, 2013). The performance of PLSR is associated with the ONLV, which is usually determined by the leave-one-out cross-validation with calibration data (Hu et al., 2015). Whether ONLV obtained from the calibration procedure is suitable for prediction in each basin or in other basins should be explored. In the study, the results demonstrated that the ONLV determined in the calibration procedure may not be the best but it is very close to the best one, and the prediction model of PLSR could be validated for the dependent data in each basin rather than in other basins of different climatic basins.
The study revealed that the combined method of a multiscale analysis and PLSR could enhance the prediction accuracy of the SMLR method from environmental factors. In the cool-temperate basin, the predicting performance for the calibration and validation samples was excellent, which might be attributed to the reason that the significant PWC between SNDT and environmental variables was stable at scales of around 50–60 km. In the mid-temperate basin, although the prediction of SNDT was excellent, there was a large discrepancy in prediction accuracy between the calibration and validation procedures. This might be due to the local significant PWC between SNDT and environmental variables. In the warm-temperate basin, the prediction accuracy in the calibration and validation procedures was only good, which could be proved by their poor relationships with PWC. This resulted from intensive human activities during double cropping.
Based on the temporal changes of SND, the highlight of the study was to establish the predictive models of its spatial distribution. If the relationships between SNDT and environmental factors were stable as time goes by, the temporal changes of SND across the spatial areas or temporal changes of SNS could be predicted based on the results of the study, and also the content of SND and SNS could be obtained based on their background. However, the correlations between SNDT and climatic factors or vegetation would change with climatic changes. Therefore, the climatic changes should be considered for predicting temporal changes of SND with time in the future.
Conclusion
In this study, SNDT was established to assess the temporal changes of SND across a spatial area in three basins located in different climate zones. The objective was to evaluate the spatial variation of SNDT, reveal its relationships with environmental variables at different scales, develop its predictive models based on the spatial-scaling effects, and validate the model for the dependent data in the same basin or for the independent data in the other basins. As for the SNDT under different climatic basins, the increment of SND was the greatest in the mid-temperate basin, and its variation during the period of 10 years decreased greatly with the latitude decreasing. Considering the soil types, the increment of SND gradually increased with the latitude decreasing. As for land types, the spatial variability of SND temporal changes was similar under cropland or grassland among different climatic basins. In each basin, the increment of SND under cropland was the greatest result of agricultural management, but its variation was ranked as grassland > changed land types > cropland.
To explore the multiscale effects of influencing factors on SNDT, the combination of CWT and PWC was performed in this study. The partial relationships between SNDT and environmental factors at the sampling or decomposed larger scales indicated that variables had more or less effects on SNDT, and PWC indicated that the correlation types of influencing factors on SNDT were generally unstable at different scales or locations. Meanwhile, environmental factors at multiple scales could provide extract information for SNDT prediction. As for the prediction, the ONLV determined in the calibration procedure could be preferable for dependent SNDT prediction in each basin but was not preferable for independent datasets in other basins. Thus, the combined method of wavelet and PLSR could promote the prediction accuracy of SNDT in each basin. The conclusions obtained in this study can be used for the spatial prediction of SNDT with environmental factors in the basins and other similar areas.
Data Availability Statement
The raw data supporting the conclusions of this article will be made available by the authors.
Author Contributions
HZ and HD conceived and designed the research. HD wrote the paper, while WH, HZ, and RB supported writing the paper. All authors have read and agreed to the published version of the manuscript.
Funding
This study was supported financially by the Natural Science Foundation of Shanxi Province, China (201801D221103) and the Innovation Grant of Shanxi Agricultural University, China (2017ZZ07).
Conflict of Interest
The authors declare that the research was conducted in the absence of any commercial or financial relationships that could be construed as a potential conflict of interest.
Publisher's Note
All claims expressed in this article are solely those of the authors and do not necessarily represent those of their affiliated organizations, or those of the publisher, the editors and the reviewers. Any product that may be evaluated in this article, or claim that may be made by its manufacturer, is not guaranteed or endorsed by the publisher.
Acknowledgments
Many thanks for the insightful comments and suggestions from the reviewers.
References
Abdelaziz, A. A., and Kim, H.-H. (2020). Temperature-dependent behavior of nitrogen fixation in nanopulsed dielectric barrier discharge operated at different humidity levels and oxygen contents. J. Phys. D Appl. Phys. 53, 114001. doi: 10.1088/1361-6463/ab5c78
Abdi, H., and Williams, L. J. (2013). “Partial least squares methods: partial least squares correlation and partial least square regression,” in Computational Toxicology: Volume II, eds B. Reisfeld and A. N. Mayeno (Totowa, NJ: Humana Press), 549–579.
Adamek, M. (2009). Effects of Increased Nitrogen Input on the Net Primary Production of a Tropical Lower Montane Rain Forest. Panama: Citeseer.
Biswas, A., Cresswell, H. P., Chau, H. W., Rossel, R. A. V., and Si, B. C. (2013). Separating scale-specific soil spatial variability: a comparison of multi-resolution analysis and empirical mode decomposition. Geoderma 209–210, 57–64. doi: 10.1016/j.geoderma.2013.06.003
Biswas, A., and Si, B. C. (2011). Identifying scale specific controls of soil water storage in a hummocky landscape using wavelet coherency. Geoderma 165, 50–59. doi: 10.1016/j.geoderma.2011.07.002
Chapuis-Lardv, L., Wrage, N., Metay, A., Chotie, J.-L., and Bernoux, M. (2007). Soils, a sink for N2O? A review. Global Change Biol. 13, 1–17. doi: 10.1111/j.1365-2486.2006.01280.x
Gao, X.-S., Xiao, Y., Deng, L.-J., Li, Q.-Q., Wang, C.-Q., Li, B., et al. (2019). Spatial variability of soil total nitrogen, phosphorus and potassium in Renshou County of Sichuan Basin, China. J. Integr. Agric. 18, 279–289. doi: 10.1016/S2095-3119(18)62069-6
Guntiñas, M. E., Leirós, M. C., Trasar-Cepeda, C., and Gil-Sotres, F. (2012). Effects of moisture and temperature on net soil nitrogen mineralization: a laboratory study. Eur. J. Soil Biol. 48, 73–80. doi: 10.1016/j.ejsobi.2011.07.015
He, X., Hou, E., Liu, Y., and Wen, D. (2016). Altitudinal patterns and controls of plant and soil nutrient concentrations and stoichiometry in subtropical China. Sci. Rep. 6, 24261. doi: 10.1038/srep24261
Hu, W., Chau, H. W., and Si, B. C. (2015). Vis-near IR spectroscopy for soil organic carbon content measurement in the Canadian prairies. Clean Soil Air Water 43, 1215–1223. doi: 10.1002/clen.201400400
Hu, W., and Si, B. C. (2013). Soil water prediction based on its scale-specific control using multivariate empirical mode decomposition. Geoderma 193, 180–188. doi: 10.1016/j.geoderma.2012.10.021
Hu, W., and Si, B. C. (2021). Technical Note: Improved partial wavelet coherency for understanding scale-specific and localized bivariate relationships in geosciences. Hydrol. Earth Syst. Sci. 25, 321–331. doi: 10.5194/hess-25-321-2021
Hu, W., Si, B. C., Biswas, A., and Chau, H. W. (2017). Temporally stable patterns but seasonal dependent controls of soil water content: evidence from wavelet analyses. Hydrol. Process. 31, 3697–3707. doi: 10.1002/hyp.11289
Huang, J., Minasny, B., McBratney, A. B., Padarian, J., and Triantafilis, J. (2018). The location- and scale- specific correlation between temperature and soil carbon sequestration across the globe. Sci. Total Environ. 615, 540–548. doi: 10.1016/j.scitotenv.2017.09.136
Jarvis, S. C., Stockdale, E. A., Shepherd, M. A., and Powlson, D. S. (1996). “Nitrogen mineralization in temperate agricultural soils: processes and measurement,” in Advances in Agronomy, ed D.L. Sparks (New York, NY: Academic Press), 187–235.
Kassim, A. M., Nawar, S., and Mouazen, A. M. (2021). Potential of on-the-go gamma-ray spectrometry for estimation and management of soil potassium site specifically. Sustainability 13, 661. doi: 10.3390/su13020661
Kumar, P., and Foufoula-Georgiou, E. (1993). A multicomponent decomposition of spatial rainfall fields: 1. Segregation of large- and small-scale features using wavelet transforms. Water Resources Res. 29, 2515–2532. doi: 10.1029/93WR00548
Liu, Z., Ma, D., Hu, W., and Li, X. (2018). Land use dependent variation of soil water infiltration characteristics and their scale-specific controls. Soil Tillage Res. 178, 139–149. doi: 10.1016/j.still.2018.01.001
Liu, Z., Shao, M. a., and Wang, Y. (2011). Effect of environmental factors on regional soil organic carbon stocks across the Loess Plateau region, China. Agric. Ecosyst. Environ. 142, 184–194. doi: 10.1016/j.agee.2011.05.002
Madrigal Reyes, S., Acevedo, D., Hernández Acosta, E., and Romo Lozano, J. L. (2019). Influence of cover, slope and depth, on soil carbon and nitrogen. Revista mexicana de ciencias forestales 10, 201–223. doi: 10.29298/rmcf.v10i51.113
Marty, C., Houle, D., Gagnon, C., and Courchesne, F. (2017). The relationships of soil total nitrogen concentrations, pools and C:N ratios with climate, vegetation types and nitrate deposition in temperate and boreal forests of eastern Canada. Catena 152, 163–172. doi: 10.1016/j.catena.2017.01.014
Ngaba, M. J. Y., Ma, X.-Q., and Hu, Y.-L. (2020). Variability of soil carbon and nitrogen stocks after conversion of natural forest to plantations in Eastern China. PeerJ 8, e8377. doi: 10.7717/peerj.8377
Parton, W., Silver, W. L., Burke, I. C., Grassens, L., Harmon, M. E., Currie, W. S., et al. (2007). Global-scale similarities in nitrogen release patterns during long-term decomposition. Science 315, 361–364. doi: 10.1126/science.1134853
Powlson, D. (1993). Understanding the soil nitrogen cycle. Soil Use Manage. 9, 86–93. doi: 10.1111/j.1475-2743.1993.tb00935.x
Rossel, R. V., McGlynn, R., and McBratney, A. (2006). Determining the composition of mineral-organic mixes using UV–vis–NIR diffuse reflectance spectroscopy. Geoderma 137, 70–82. doi: 10.1016/j.geoderma.2006.07.004
She, D., Cao, Y., Chen, Q., and Yu, S. e. (2016). Characterizing scale-specific environmental factors affecting soil organic carbon along two landscape transects. Environ. Sci. Pollut. Res. 23, 1–12. doi: 10.1007/s11356-016-6883-y
Si, B. C. (2008). Spatial scaling analyses of soil physical properties: a review of spectral and wavelet methods. Vadose Zone J. 7, 547–562. doi: 10.2136/vzj2007.0040
Si, B. C., and Zeleke, T. B. (2005). Wavelet coherency analysis to relate saturated hydraulic properties to soil physical properties. Water Resour. Res. 41, 303–306. doi: 10.1029/2005WR004118
Tian, H., Wang, S., Liu, J., Pan, S., Chen, H., Zhang, C., et al. (2006). Patterns of soil nitrogen storage in China. Global Biogeochem. Cycles 20:GB1001. doi: 10.1029/2005GB002464
Tian, P., Sui, P., Lian, H., Wang, Z., Meng, G., Sun, Y., et al. (2019). Maize straw returning approaches affected straw decomposition and soil carbon and nitrogen storage in Northeast China. Agronomy 9, 818. doi: 10.3390/agronomy9120818
Veraart, A. J., de Klein, J. J. M., and Scheffer, M. (2011). Warming can boost denitrification disproportionately due to altered oxygen dynamics. PLoS ONE 6, e18508. doi: 10.1371/journal.pone.0018508
Wang, Y., Zhang, X., and Chuanqin, H. (2009). Spatial variability of soil total nitrogen and soil total phosphorus under different land uses in a small watershed on the Loess Plateau, China. Geoderma 150, 141–149. doi: 10.1016/j.geoderma.2009.01.021
Weitz, A. M., Linder, E., Frolking, S., Crill, P., and Keller, M. (2001). N2O emissions from humid tropical agricultural soils: effects of soil moisture, texture and nitrogen availability. Soil Biol. Biochem. 33, 1077–1093. doi: 10.1016/S0038-0717(01)00013-X
Yang, J., Gao, W., and Ren, S. (2015). Long-term effects of combined application of chemical nitrogen with organic materials on crop yields, soil organic carbon and total nitrogen in fluvo-aquic soil. Soil Tillage Res. 151, 67–74. doi: 10.1016/j.still.2015.03.008
Zhang, J., Zhang, M., Huang, S., and Zha, X. (2020). Assessing spatial variability of soil organic carbon and total nitrogen in eroded hilly region of subtropical China. PLoS ONE 15, e0244322. doi: 10.1371/journal.pone.0244322
Zhou, Y., Chen, S., Zhu, A. X., Hu, B., Shi, Z., and Li, Y. (2021). Revealing the scale- and location-specific controlling factors of soil organic carbon in Tibet. Geoderma 382, 114713. doi: 10.1016/j.geoderma.2020.114713
Zhu, H., Bi, R., Sun, R., Xu, Z., Lv, C., and Yang, J. (2020a). Revealing the 2D–scale, location–specific variations of soil properties in the coal mining area of Changhe watershed, China. Land Degrad. Dev. 31, 2775–2788. doi: 10.1002/ldr.3639
Zhu, H., Cao, Y., Jing, Y., Liu, G., Bi, R., and Yang, W. (2019). Multi-scale spatial relationships between soil total nitrogen and influencing factors in a basin landscape based on multivariate empirical mode decomposition. J. Arid Land 11, 385–399. doi: 10.1007/s40333-019-0054-1
Zhu, H., Hu, W., Bi, R., Peak, D., and Si, B. (2016). Scale- and location-specific relationships between soil available micronutrients and environmental factors in the Fen River basin on the Chinese Loess Plateau. Catena 147, 764–772. doi: 10.1016/j.catena.2016.08.038
Zhu, H., Sun, R., Xu, Z., Lv, C., and Bi, R. (2020b). Prediction of soil nutrients based on topographic factors and remote sensing index in a coal mining area, China. Sustainability 12, 1626. doi: 10.3390/su12041626
Keywords: temporal changes of soil total nitrogen density (SNDT), scale-dependent prediction, partial wavelet transform (PWT), partial least square regression (PLSR), basin
Citation: Ding H, Hu W, Zhu H and Bi R (2022) Spatial Scaling Effects to Enhance the Prediction for the Temporal Changes of Soil Nitrogen Density From 2007 to 2017 in Different Climatic Basins. Front. Ecol. Evol. 10:848865. doi: 10.3389/fevo.2022.848865
Received: 05 January 2022; Accepted: 11 April 2022;
Published: 20 May 2022.
Edited by:
Giulia Maisto, University of Naples Federico II, ItalyReviewed by:
Luca Vitale, National Research Council of Italy (CNR), ItalyXuyang Wang, Northwest Institute of Eco-Environment and Resources (CAS), China
Copyright © 2022 Ding, Hu, Zhu and Bi. This is an open-access article distributed under the terms of the Creative Commons Attribution License (CC BY). The use, distribution or reproduction in other forums is permitted, provided the original author(s) and the copyright owner(s) are credited and that the original publication in this journal is cited, in accordance with accepted academic practice. No use, distribution or reproduction is permitted which does not comply with these terms.
*Correspondence: Hongfen Zhu, hongfzh@163.com