 Jens Balasus
 Felix Wirth
 Tran Quoc Khanh
- Laboratory of Adaptive Lighting Systems and Visual Processing, Department of Electrical Engineering and Information Technology, Technical University of Darmstadt, Darmstadt, Germany
Accurate and continuous monitoring of plant development is crucial for managing closed cultivation systems effectively. Optical reflectance-based sensors offer a non-destructive, scalable, and cost-efficient method to track plant growth, physiological status and stress responses. However, existing vegetation indices predominantly utilize wavelengths in the near-infrared (> 800nm) range, a spectral range typically absent in horticultural LED lighting systems, limiting their applicability in horticultural LED-lit environments. This study investigates spectral metrics within the visible spectrum (440nm - 740nm) that robustly correlate with leaf order, a proxy for leaf age, in cucumber (Cucumis sativus) plants grown under controlled artificial lighting conditions. We systematically compared adaxial and abaxial leaf surfaces, identifying significant spectral variations associated with leaf order. Results demonstrate that abaxial leaf reflectance strongly correlates with leaf order, especially in the blue and red spectral regions. While adaxial reflectance showed weaker correlations, specific reflectance ratios (e.g., ρ720/ρ700) enhanced this relationship, providing metrics suitable for sensor integration. These findings supply metrics for the development of simple optical sensors optimized for growth monitoring in greenhouse or indoor farming systems.
1 Introduction
Accurate and continuous monitoring of plant development is crucial for the management of closed cultivation systems such as greenhouses and indoor farming. Optical sensors offer non-invasive, cost-effective, and scalable methods to monitor key plant traits such as growth, physiology, and stress responses.
During leaf development, spectral reflectance changes as a result of structural and biochemical modifications within the leaf tissue. Classical studies, such as those by Woolley (1971), demonstrated that leaves act as effective diffusers due to their irregular internal structure, which causes multiple scattering of incident light. The reflectance and transmittance spectra therefore result from the interplay between surface reflection, internal scattering, and pigment absorption. Pigments such as chlorophyll and carotenoids strongly absorb light in the blue and red regions, whereas internal scattering within mesophyll tissues dominates in the green and near-infrared regions. Consequently, variations in pigment concentration and tissue water content directly influence spectral reflectance. Consequently, monitoring reflectance dynamics enables non-invasive inference of the plant’s physiological state (Sims and Gamon (2002); Gitelson and Merzlyak (1994)).
Reflectance-based optical sensing has a long history in quantifying plant status non-destructively. Typically, these methods measure reflected light from leaves at specific wavelengths to calculate vegetation indices associated with physiological parameters. The most widely utilized metric, the Normalized Difference Vegetation Index (NDVI), relies primarily on red and near-infrared reflectance (Tucker, 1979). Subsequently, numerous alternative indices have emerged, designed to improve the specificity toward traits such as chlorophyll content (Katsoulas et al., 2016), leaf area index (LAI) (Wu et al., 2008; Gitelson and Merzlyak, 1994) water status (Katsoulas et al., 2016), leaf age (Merzlyak et al., 1999), nitrogen content (Daughtry, 2000) and pigment composition (Gamon and Surfus, 1999; Pen Uelas et al., 1995) have been proposed. Many of these physiological parameters, such as chlorophyll content change during leaf ontogeny, leading to the assumption that reflectance could also serve as an indicator for developmental stage.
However, existing spectral indices frequently depend on reflectance data beyond 740nm, a spectral region often not emitted by horticultural LED systems predominantly used in greenhouses and indoor farms. Moreover, many indices originally developed for satellite or Unmanned Aerial Vehicle-based remote sensing of entire canopies might lack direct applicability for monitoring individual plants in controlled environments, where background signals and viewing geometry are different.
Low-cost reflectance sensing technologies based on photodiodes coupled with narrowband filters (spectral sensors) have gained interest due to their ability to support simplified, application-specific hardware designs suitable for distributed sensor networks in greenhouse environments (Tran et al., 2022; Kirci et al., 2022; Kaiser et al., 2024). In contrast, RGB imaging-based methods are suitable for large-scale screening of morphological traits such as leaf area or biomass, yet their limited spectral resolution restricts their capability to detect subtle biochemical shifts such as pigment variations or early-stage developmental transitions (Kaiser et al., 2024).
Despite advances in spectral sensing, systematic studies examining the relationship between leaf reflectance and leaf age, particularly within the visible spectrum (440–740nm), remain scarce. While the effects of species variation, stress factors, and nutrient availability on reflectance have been widely studied, the influence of leaf order (counting with leaf appearance) on spectral reflectance under controlled cultivation conditions has received limited attention. Furthermore, publicly available spectral datasets for near-field, single-leaf reflectance under controlled lighting conditions are currently limited.
This study addresses these research gaps by investigating spectral metrics suitable for detecting leaf age via leaf order, using cucumber (Cucumis sativus) cultivated under controlled artificial lighting as a model organism. Specifically, we aim to:
● Identify spectral indices and wavelength-specific reflectance metrics within the visible spectrum (440nm–740nm) that robustly correlate with leaf order.
● Compare adaxial (upper) and abaxial (lower) leaf surfaces to determine differences in spectral sensitivity related to ontogenetic stage.
● Provide a detailed spectral dataset enabling the development of simple, real-time reflectance-based sensors tailored for growth monitoring of cucumber plants, serving as a first step toward sensor design, with subsequent validation needed under practical greenhouse conditions.
2 Materials and methods
2.1 Plant materials
Cucumber plants (Cucumis sativus, cv. Saladin F1, Philipp Klein GmbH, Fürth, Germany) were cultivated in individual pots (7 x 7 x 8 cm) under a 16-hour photoperiod using white horticultural LEDs (Luxeon SunPlus 2835, 250 ±50 µmolm−2 s−1). Germination occurred in a growth tray and plants were transferred after 8–10 days to an automated drip irrigation system supplying each plant with 20mL nutrient solution twice daily. The nutrient solution comprised demineralized water enriched with calcium-magnesium supplements (CalMag, Plagron, Weert, Netherlands) and hydroponic fertilizers (Hydro A+B, Plagron, Weert, Netherlands). Plants were utilized at the five-leaf developmental stage, approximately 30 days post-sowing. Leaves were numbered according to their date of first appearance, starting from the first one labeled as order one to the fifth, labeled as order five.
2.2 Measurement setup
Leaf spectral reflectance measurements were conducted using an integrating sphere (ISP-REF, Ocean Optics, USA) coupled to a spectrometer (Ocean HDX, Ocean Optics, USA), see Figure 1, providing a spectral range of 200nm to 1100nm with a resolution of approximately 0.75nm to 1.2nm. Measurements were calibrated for instrument nonlinearities and dark- current correction according to manufacturer specifications. Illumination was provided by a deuterium-halogen lamp (DH-2000, Ocean Optics, USA) guided via fiber optics into the integrating sphere. Stray light and back-reflections were minimized using a custom-built black light trap lined with highly absorptive Musou Black felt (Koyo Orient, Japan; absorbance > 99.9%). Reflectance spectra were normalized relative to a Spectralon white reference standard (99% reflectance), with integration times dynamically adjusted to maintain optimal detector utilization (approximately 90% of detector saturation).
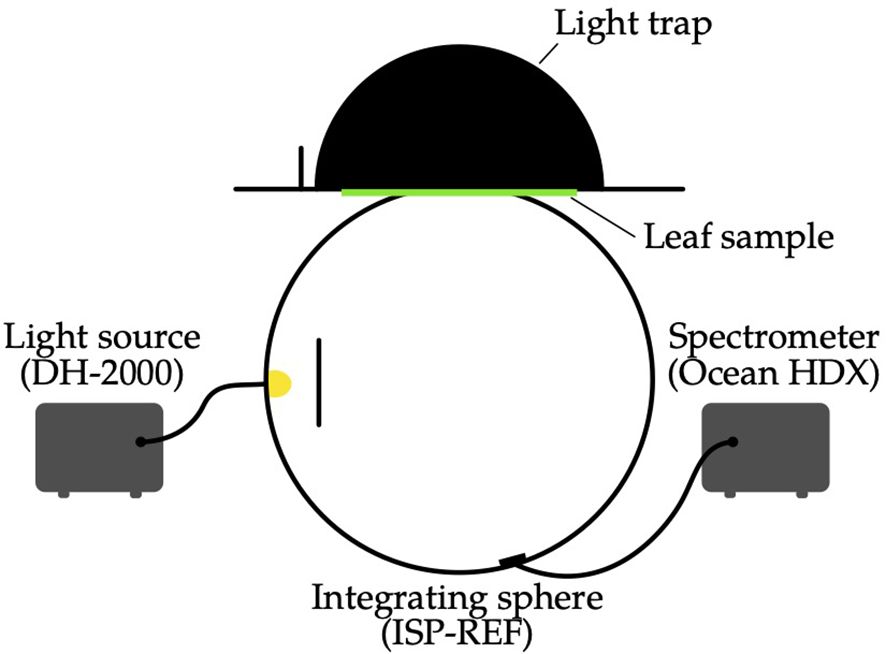
Figure 1. Schematic of the measurement setup used to determine leaf spectral reflectance. A deuteriumhalogen lamp illuminates the leaf sample held at the port of an integrating sphere. Reflected light is collected by the sphere and measured by a fiber-coupled spectrometer.
Final reflectance values were calculated as in Equation 1:
with the spectral radiant flux of the leaf probe , the one of the white reference standard , the dark spectral radiant flux and the spectral reflectance of the whitestandard . Spectral measurements were limited to the range from 440 nm to 850 nm.
2.3 Determination of measurement point number per leaf
The analysis revealed that using five sampling points per leaf reduced the standard error of integrated reflectance from 6.9% at one point to 3.1% at five points, further decreasing to 2.1% when using ten points and reaching a minimum of 1.6% at twenty points. The sampling density of five points provided a practical balance between measurement speed and precision. Consequently, all subsequent leaf-level spectral measurements were performed using five representative points per leaf, in total 34 plants. All measured spectral reflectance data is available in the Supplementary Data. In cucumber leaves, which are larger than those of e.g. tomato or basil, pigment inhomogeneities can affect measurement results. Smaller leaves tend to average out such variation across the field of view, but for larger leaves, increased sampling density improves accuracy. This should be considered when performing similar measurements with different species.
2.4 Established vegetation indices
To evaluate whether the optical properties of cucumber leaves vary systematically with leaf order, a set of established vegetation indices originally developed for remote sensing applications was calculated from adaxial reflectance spectra. These indices were not specifically designed for greenhouse crops such as cucumber, but are commonly used to estimate parameters such as chlorophyll and anthocyanin content, leaf area index (LAI), leaf mass, water status, or senescence stage (Coops and Stone, 2005). Their definitions and target variables are summarized in Table 1.
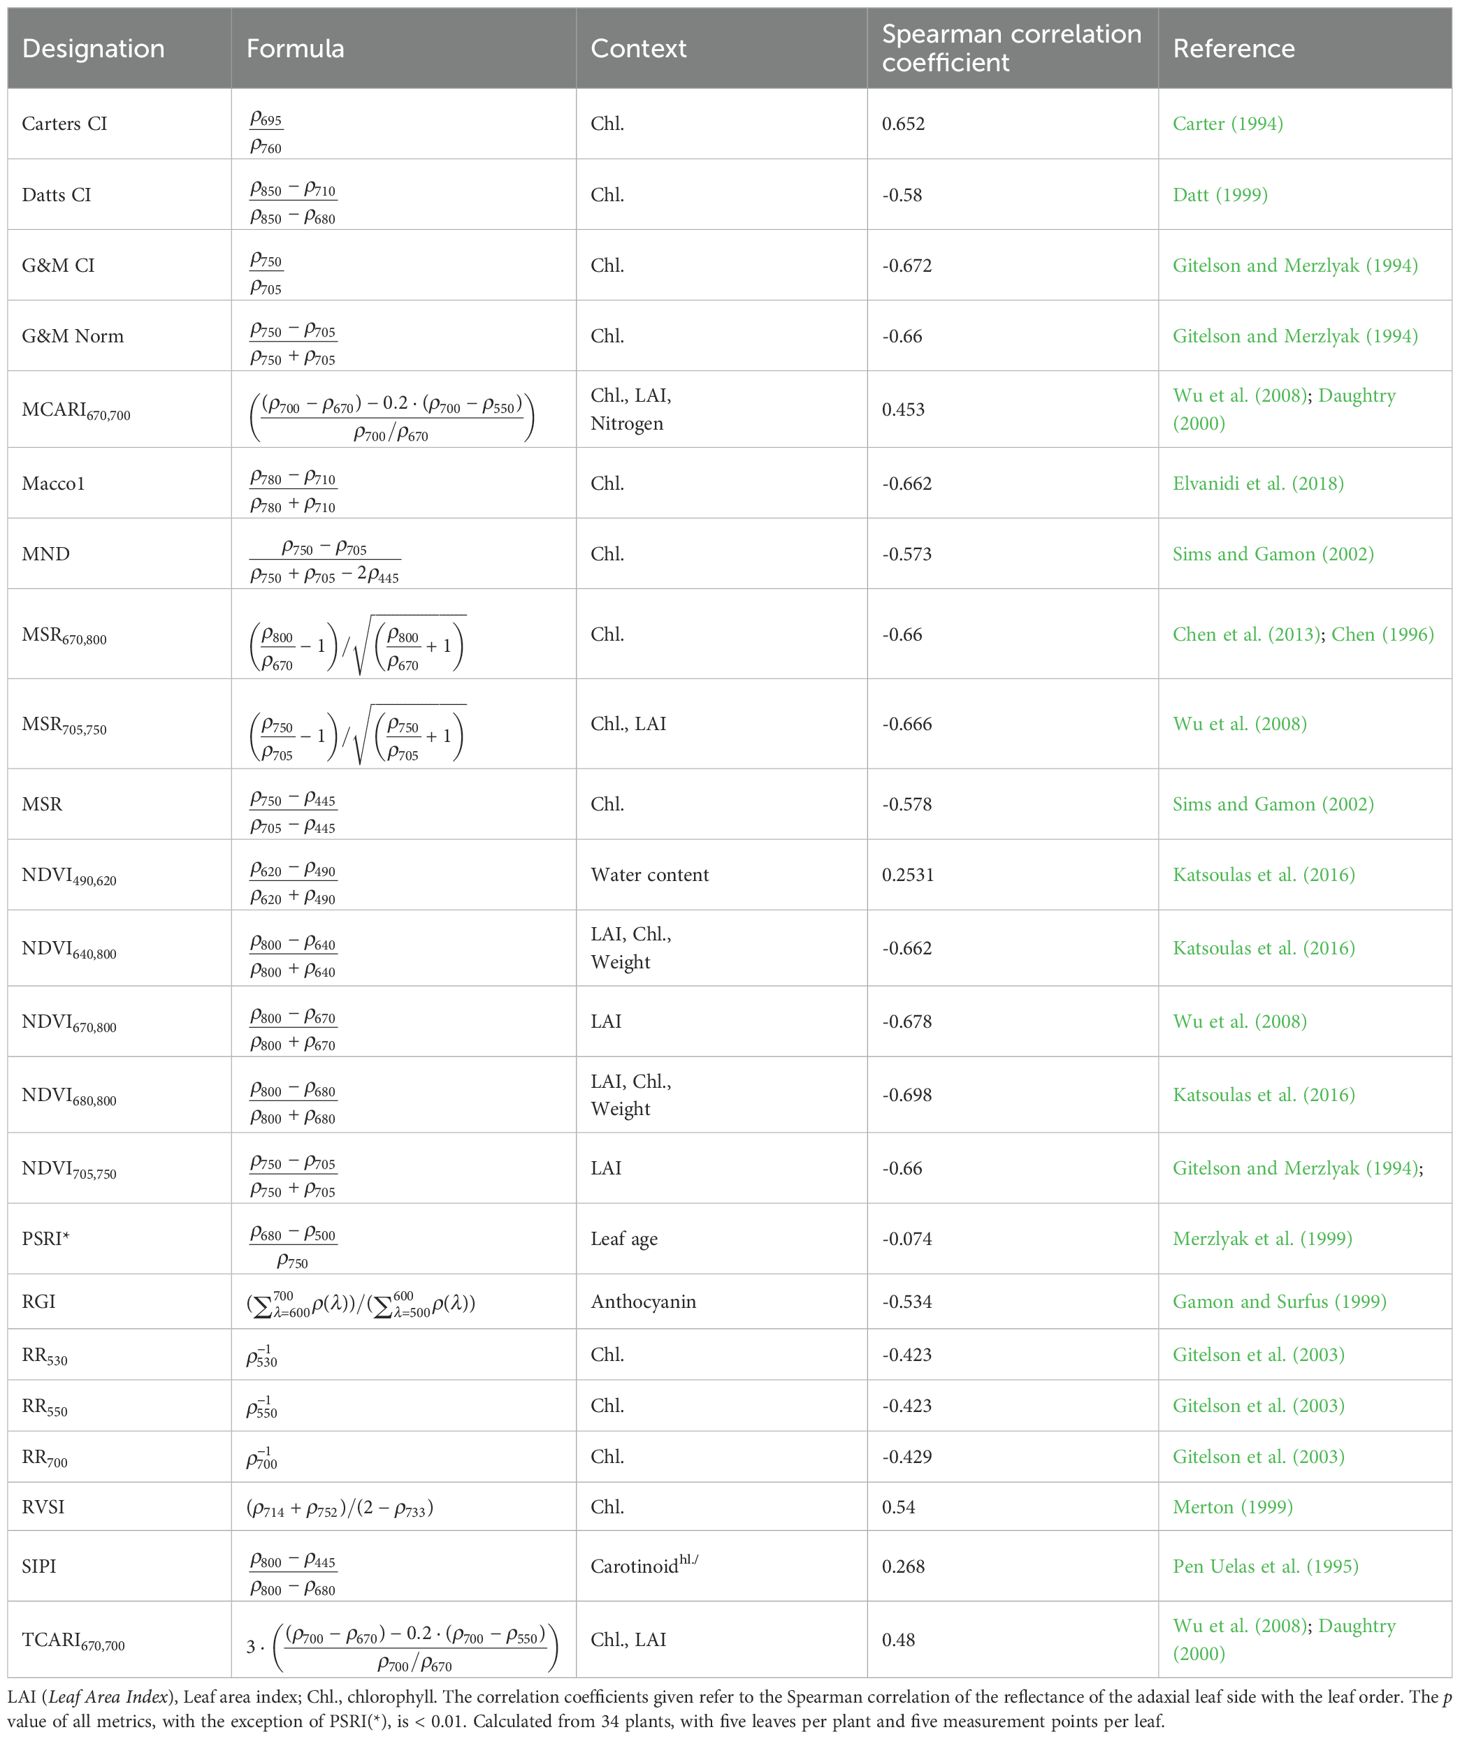
Table 1. Spearman correlation coefficients between established vegetation indices and cucumber leaf order, calculated from adaxial reflectance data. Based on the work of (Coops and Stone, 2005) and additional own research.
The simplest metrics are the reciprocal-reflectance indices (RR), where the inverse of reflectance at a given wavelength is used as a proxy (e.g., RR530, RR550, RR700) to relate to chlorophyll (Gitelson et al., 2003). To reduce the influence of non-photosynthetic/background effects, ratio-type metrics have been introduced. The modified simple ratio (MSR) enhances sensitivity relative to simple ratios and compresses dynamic range (Chen, 1996; Chen et al., 2013). Chlorophyll index (CI) variants (Carter’s CI, Datt’s CI, and the Gitelson & Merzlyak forms) use red/red-edge (Horler et al., 1983) and NIR bands to estimate chlorophyll concentration (Carter, 1994; Datt, 1999; Gitelson and Merzlyak, 1994).
The modified and transformed chlorophyll absorption ratio indices (MCARI, TCARI) quantify absorption features around 670nm to 700nm while incorporating a reference at 550nm, thereby reducing structural/background influences (Daughtry, 2000; Wu et al., 2008). The modified normalized difference (MND) minimizes structural effects by including a structurally insensitive band near 445nm (Sims and Gamon, 2002). The red-edge vegetation stress index (RVSI) exploits reflectance differences around the red-edge region as a stress-sensitive proxy (Merton, 1999).
Beyond chlorophyll, the structure insensitive pigment index (SIPI) targets the carotenoid-to-chlorophyll balance (Pen Uelas et al., 1995), and the red-to-green index (RGI) is linked to anthocyanin content (Gamon and Surfus (1999)). Variants of the normalized difference vegetation index (NDVI) use red or red-edge bands against a reference band (e.g. at 800nm) and are frequently related to canopy greenness and LAI (Katsoulas et al. (2016); Wu et al. (2008)). Finally, the plant senescence reflectance index (PSRI) is used as an indicator of leaf age and fruit ripening (Merzlyak et al. (1999)).
2.5 Method for correlation analysis
The relationship between spectral metrics and leaf order (as an indicator of leaf age) was analyzed through the following systematic approach:
1. Metric computation per leaf: Metric values (xpoint) were computed at each measurement location. The leaf-specific mean value was derived from five replicate measurements per leaf as in Equation 2:
2. Within-plant centering: Leaf-averaged metric values were normalized per plant by subtracting the median (Equation 3): across all five leaves, removing plant-specific systematic offsets (Equation 4):
3. Statistical Correlation: The centered values were correlated with leaf order, where a lower order number indicates an older leaf. The Spearman order correlation coefficient was used to assess monotonic relationships without assuming linearity. All calculations were performed using the SciPy library (Virtanen et al., 2020).
No data points were excluded as outliers. Potential measurement noise and biological variability were accounted for statistically by averaging five replicate points per leaf (Equation 2) and by within-plant centering (Equation 4), which removed plant-specific offsets. Since the analysis relied on Spearman rank correlations, which are non-parametric and insensitive to absolute magnitude deviations, individual extreme values exert minimal influence on correlation strength or direction.
3 Results and discussions
3.1 Mean spectral reflectance
The mean adaxial and abaxial reflectance spectra of cucumber leaves exhibit characteristic patterns associated with chlorophyll-dominated absorption in the visible range and internal structural scattering in the near-infrared (Figure 2). Across all leaf orders and measurement points, adaxial surfaces reflected more light than abaxial ones, particularly below 700nm.
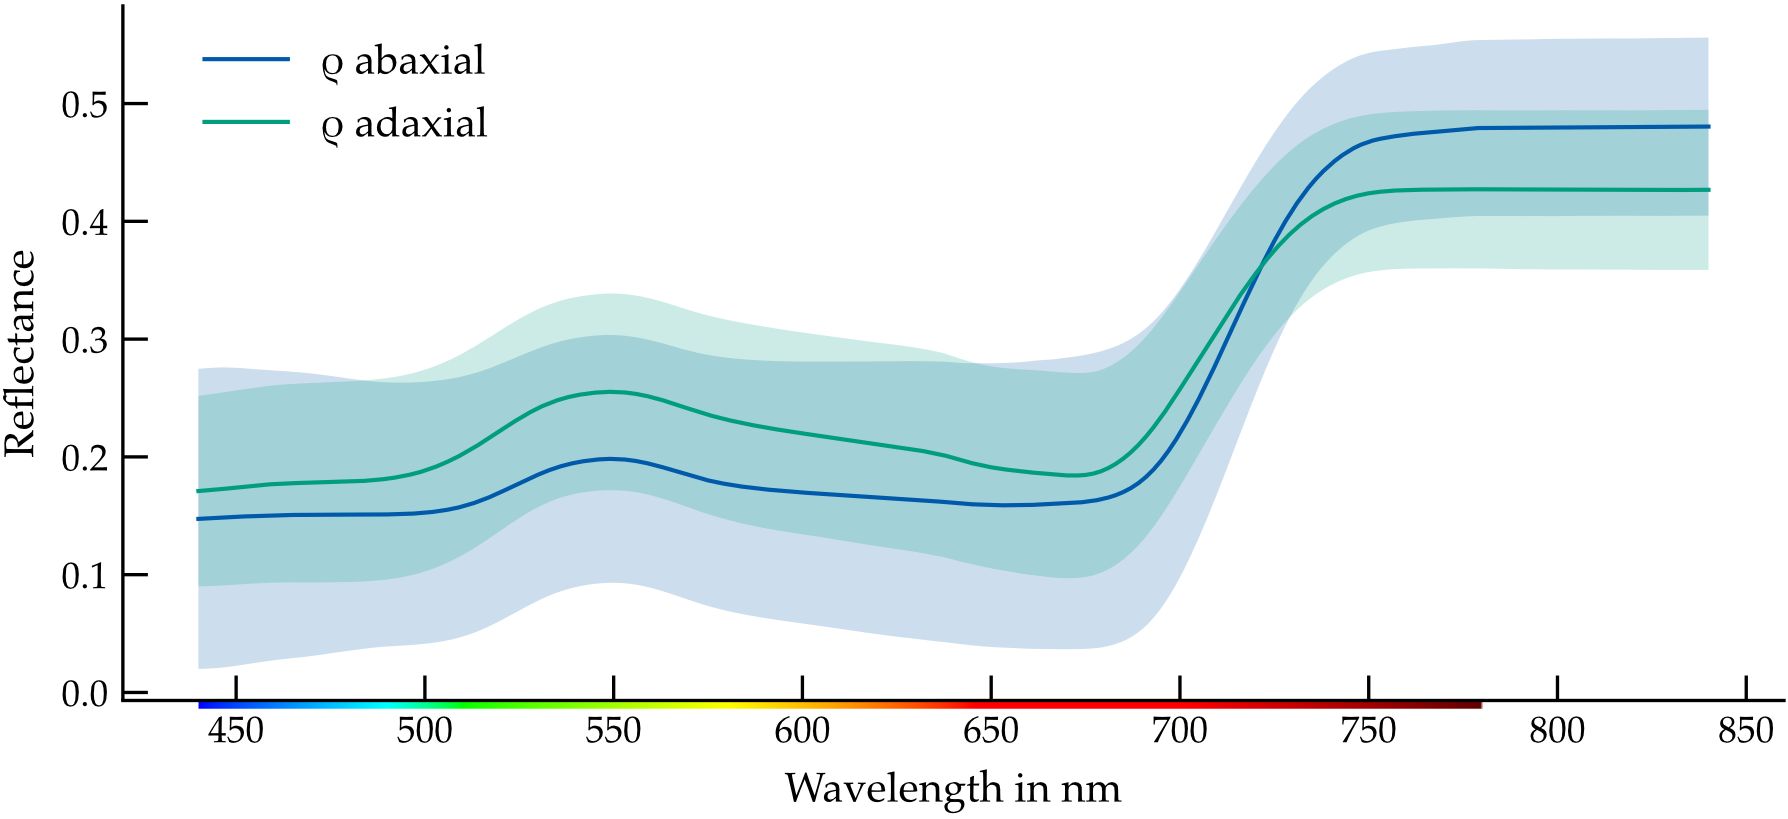
Figure 2. Averaged spectral reflectance of both leaf sides with enveloping standard deviation. Calculated from all plant data sets of 34 plants, each with five leaves and five measurement points per leaf, a total of 850 measurements per leaf side. The colorbar illustrates the corresponding color representation for the human-visible wavelength range.
In the blue region (< 500nm), average reflectance was approximately 19% on the adaxial and 14% on the abaxial surface. A distinct local maximum occurred at 550nm, with values of 26% (adaxial) and 19% (abaxial). Reflectance dropped to a local minimum near 670nm, corresponding to the red chlorophyll absorption peak before rising again toward the red-edge (Horler et al., 1983). At 700nm, reflectance reached 26% (adaxial) and 20% (abaxial), respectively.
These side-dependent differences were consistent across samples and most pronounced in the green and red spectral regions. The standard deviation across biological replicates remained relatively constant across wavelengths, indicating stable measurement conditions and low within-group variability.
The higher reflectance on the adaxial surface is likely attributable to anatomical asymmetries, including differences in epidermal structure, wax layer thickness, or palisade cell orientation. These findings establish a baseline for subsequent analyses of order-dependent reflectance variation.
To statistically assess whether these spectral differences between leaf surfaces are significant, a two-sided Mann–Whitney U test was applied at each wavelength using the SciPy library in Python (Virtanen et al., 2020). The test compared the distributions of reflectance values from all adaxial and abaxial leaf samples, respectively.
As shown in Figure 3, over 90% of all wavelengths below 700nm yielded statistically significant differences between the two surfaces (p < 0.05). Above 700nm, these differences sharply declined, with significance observed in less than 10% of the spectral range. This confirms that reflectance is strongly dependent on leaf side throughout the photosynthetically active region and should be considered accordingly in optical sensor design.
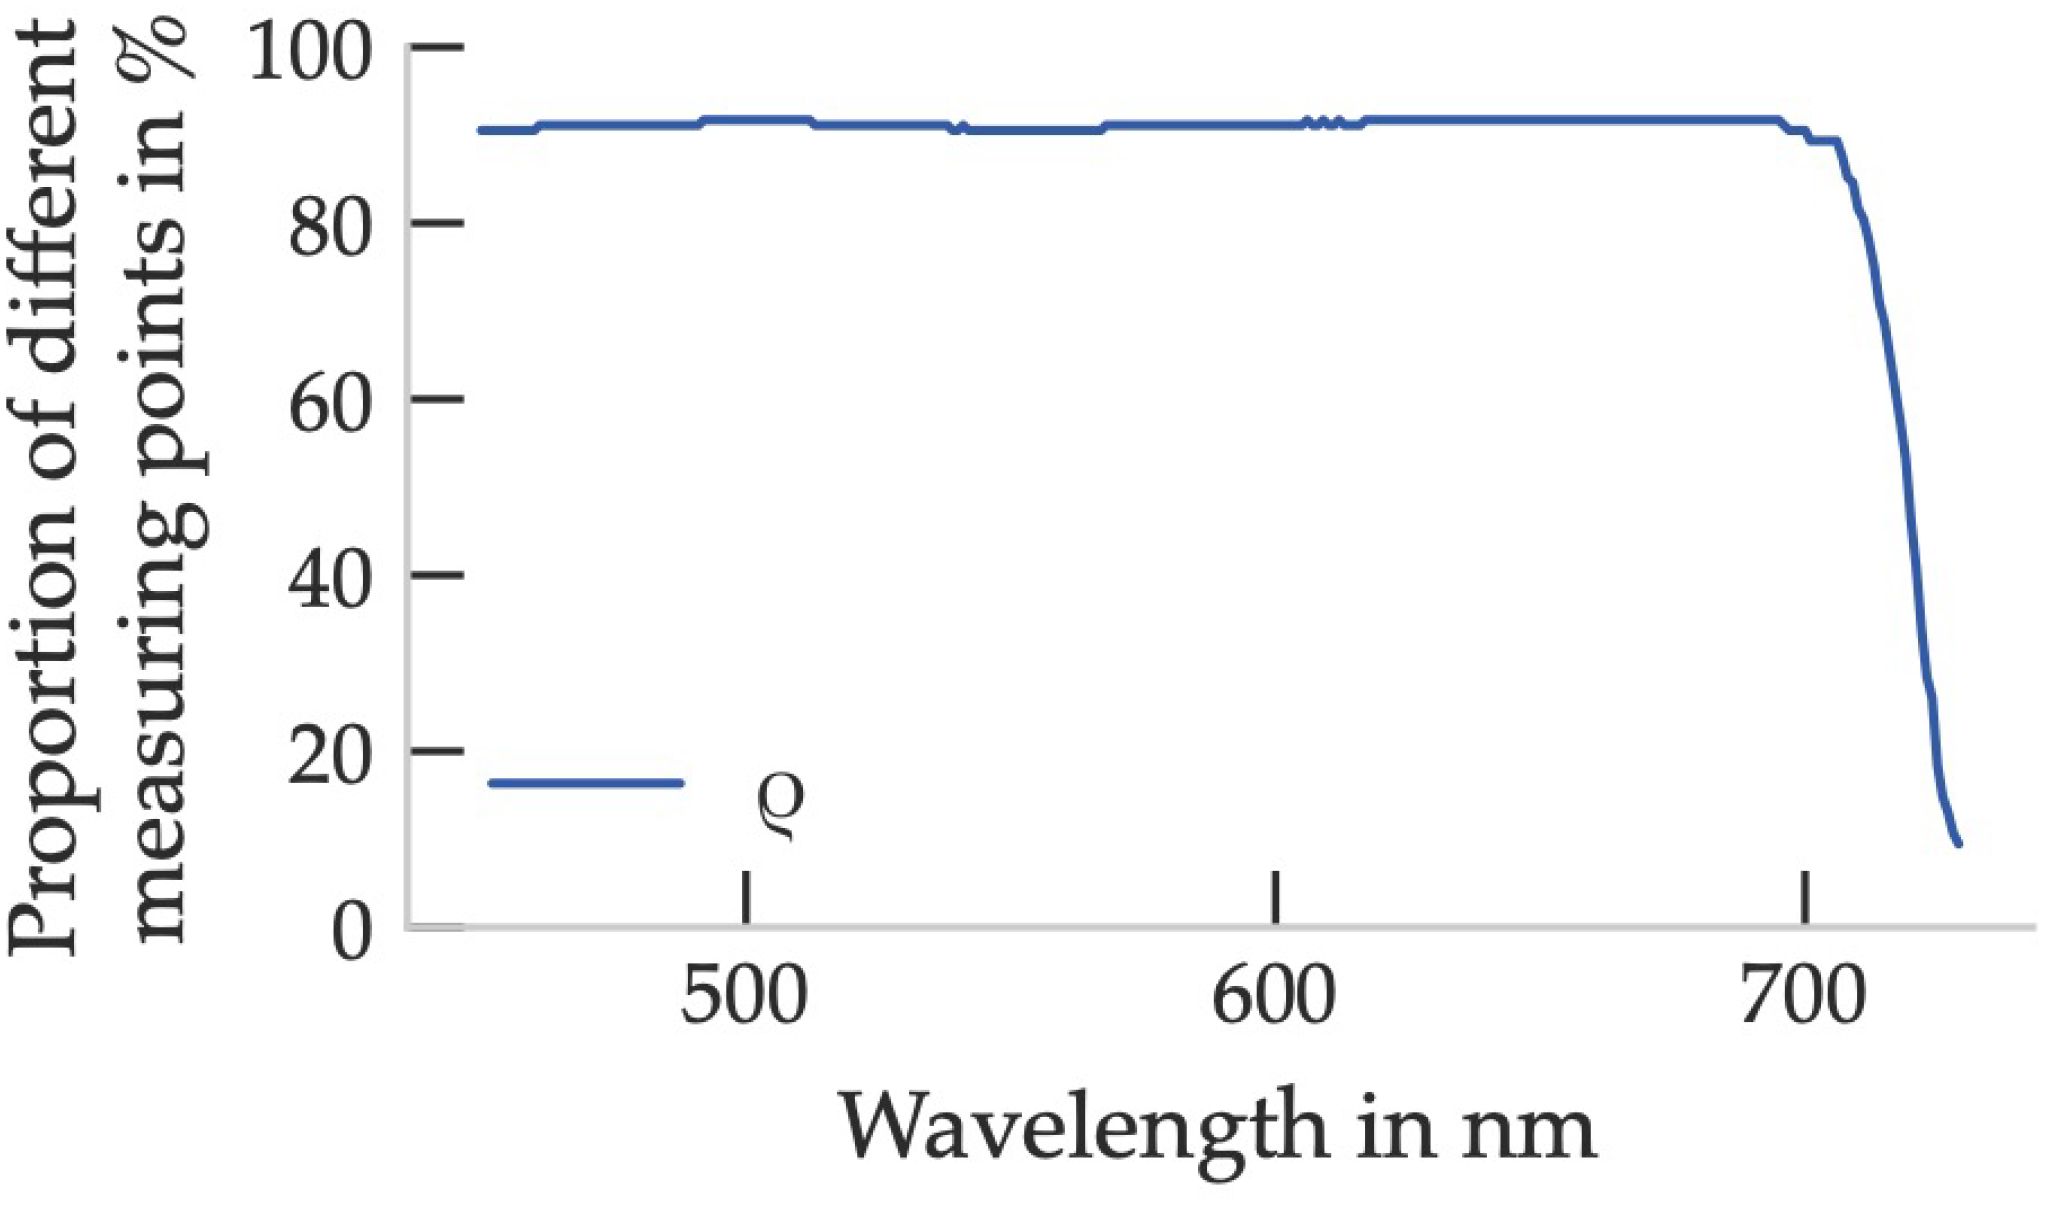
Figure 3. Proportion of different leaf sides of spectral reflectance based on the Mann-Whitney-U hypothesis test (p < 0.05). 170 tests were carried out, with five measurement points per leaf side.
3.2 Correlation between adaxial vegetation indices and leaf order
The Spearman correlation coefficients between each index and leaf order were computed and are shown in Figure 4. Most indices exhibited strong absolute correlations (|r| > 0.6), especially those related to chlorophyll content, LAI, and biomass. Indices based on spectral ratios generally yielded stronger correlations than those based on inverse reflectance, such as RR530.
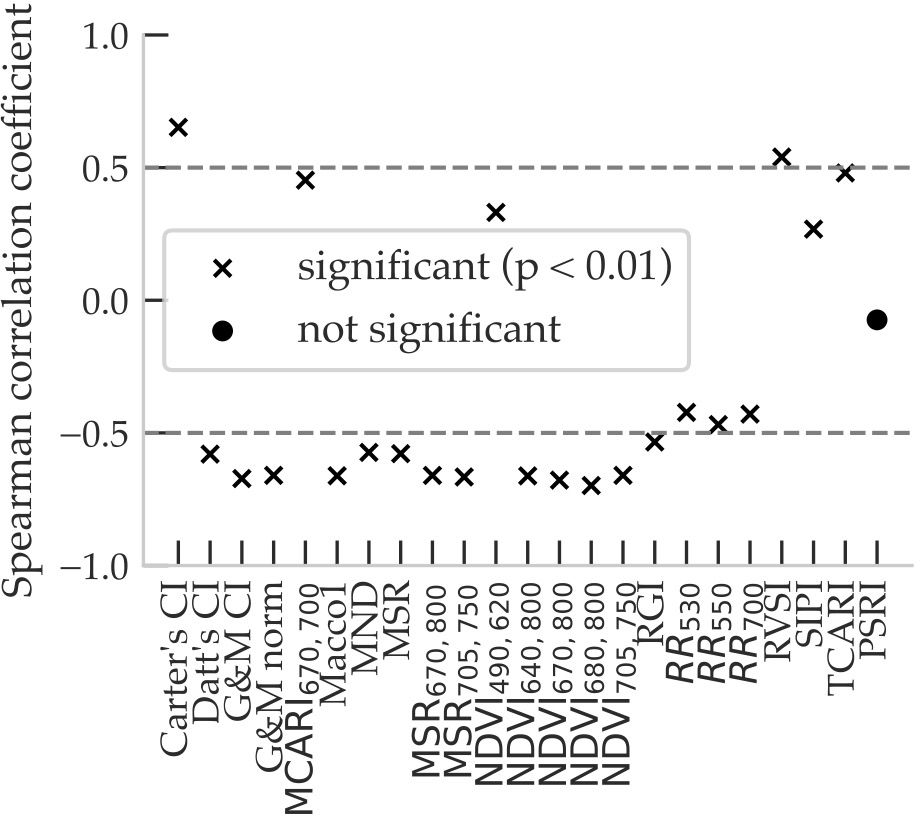
Figure 4. The Spearman correlation coefficients of the calculated metrics from the remote sensing range in relation to the leaf order are shown. The calculation is based on the spectral reflectance values. Significant correlations (p < 0.01) are marked with a cross. The indicated correlation coefficients refer to the correlation of the reflectance of the adaxial leaf side with the leaf order. Calculated from 34 plants, with five leaves per plant and five measurement points per leaf.
The observed correlation between order and chlorophyll-sensitive indices suggests a relationship between chlorophyll content and leaf age. This is supported by results from Liu et al., who found systematic changes in chlorophyll concentration across different leaf ages in six plant species (Liu et al., 2009).
In contrast, the Plant Senescence Reflectance Index (PSRI), which targets age-related pigment degradation in senescing tree species, did not correlate in this study. This is consistent with expectations, as young cucumber plants do not exhibit the strong seasonal pigment shifts observed in deciduous species.
Among NDVI-based metrics, all but NDVI490,620 (which relates to water content) were negatively correlated with leaf order. NDVI680,800, which reflects LAI, showed the strongest correlation among them. This negative relationship indicates increasing leaf area with developmental progression, consistent with plant growth dynamics.
Indices based on inverse reflectance at 530nm, 550nm, and 700nm had moderate negative correlations around r ≈ −0.45, which were notably lower than those of NDVI-type metrics targeting chlorophyll content. The SIPI, which combines chlorophyll and carotenoid sensitivity, showed a weaker correlation of r = 0.27. The RGI, associated with anthocyanin content, reached r = −0.53, similar to inverse single-band metrics.
In summary, most indices linked to chlorophyll, anthocyanin, and LAI showed significant correlations with leaf order, while indices associated with water or nitrogen content showed weaker relationships. Interestingly, the only metric designed specifically to estimate leaf age, PSRI, did not correlate in this context, likely due to the limited pigment variation in young cucumber foliage compared to autumn leaves of trees.
These findings suggest that several established reflectance indices may be useful for in situ estimation of leaf developmental stage. However, many of them incorporate spectral bands outside the 440nm to 740nm range. For use in sensor-based plant monitoring systems, particularly with simplified multispectral hardware, further investigations on more metrics will be required.
3.3 Wavelength-specific correlation of reflectance with leaf order
Beyond index-based metrics, we examined how spectral reflectance at discrete wavelengths correlates with leaf order. Spearman correlation coefficients were calculated in 20nm increments across the measured spectrum, results are shown in Figure 5.
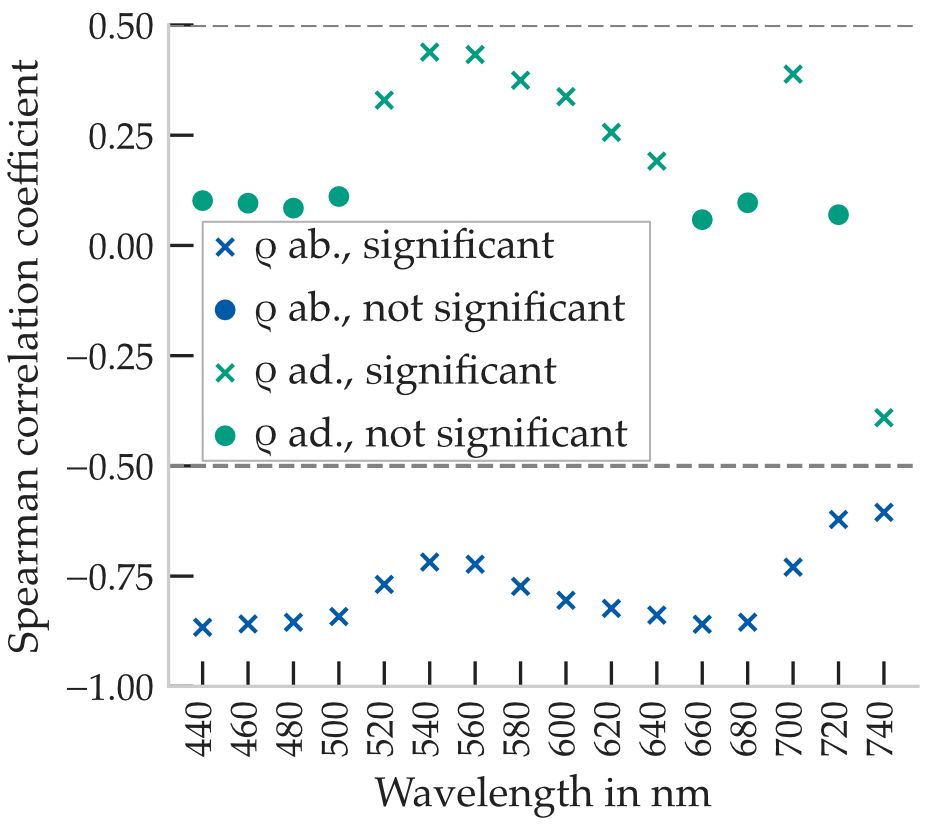
Figure 5. Spearman correlation coefficients of the spectral reflectance and transmittance of the two leaf sides with the leaf order. Significant correlations are entered as a cross (p < 0.01). Calculated from 34 plants, with five leaves per plant and five measurement points per leaf.
On the abaxial leaf surface, reflectance generally decreases with increasing leaf order (i.e., younger leaves). Correlation coefficients were consistently negative and reached values below r = −0.5 across most parts of the spectrum. The strongest correlations were observed in the blue and red regions, with a minimum of r = −0.87, indicating pronounced age-related spectral changes on the abaxial side.
In contrast, reflectance on the adaxial surface exhibited weaker and more wavelength-dependent correlations. In the blue (<500nm) and red absorption bands (640nm to 680nm), no significant correlation was detected. Slight positive correlations were observed in the green spectral range between 520nm and 620nm, with a maximum of r = 0.43 around 540nm. A minor negative correlation also appeared near 740nm. These results suggest that adaxial reflectance shows only a weak association with leaf age, primarily in the green spectral region.
Figure 5 highlights the spectral intervals where statistically significant correlations (p < 0.01) were found. In particular, the ranges around 520nm to 580nm and near 700nm yielded the most consistent relationships with leaf order.
Overall, the analysis demonstrates that reflectance–order correlations are wavelength-dependent and leaf-side specific. While the abaxial side exhibits stronger monotonic trends, especially in pigment-absorbing bands, the adaxial side provides localized but weaker correlations. These findings further support the selection of narrowband spectral regions for sensor-based leaf age monitoring.
3.4 Correlation matrices of spectral reflectance ratios
Several established vegetation indices yielded strong correlations with leaf order when computed from adaxial reflectance data. However, many of these indices include wavelengths above 740nm, which are outside the PAR spectral range and could not be present in solely artificial lighting cultivation systems. In addition, the previous spectral analysis showed that reflectance-based metrics in the PAR region can still exhibit informative correlations with leaf order.
To systematically evaluate which spectral combinations carry the strongest ontogenetic signals, we computed pairwise reflectance ratios for all measured wavelengths between 440nm and 740nm in 20nm increments. The general formula for spectral ratios is:
Here, λnum and λden denote the wavelengths at which reflectance ρ(λ) is evaluated for the numerator and denominator of the ratio, respectively.
Spearman correlation coefficients between each spectral ratio and leaf order were calculated. The resulting correlation maps are shown in Figures 6, 7 for abaxial and adaxial reflectance, respectively. Note that the visualizations differ from conventional correlation matrices: axes represent numerator and denominator wavelengths instead of distinct variables.
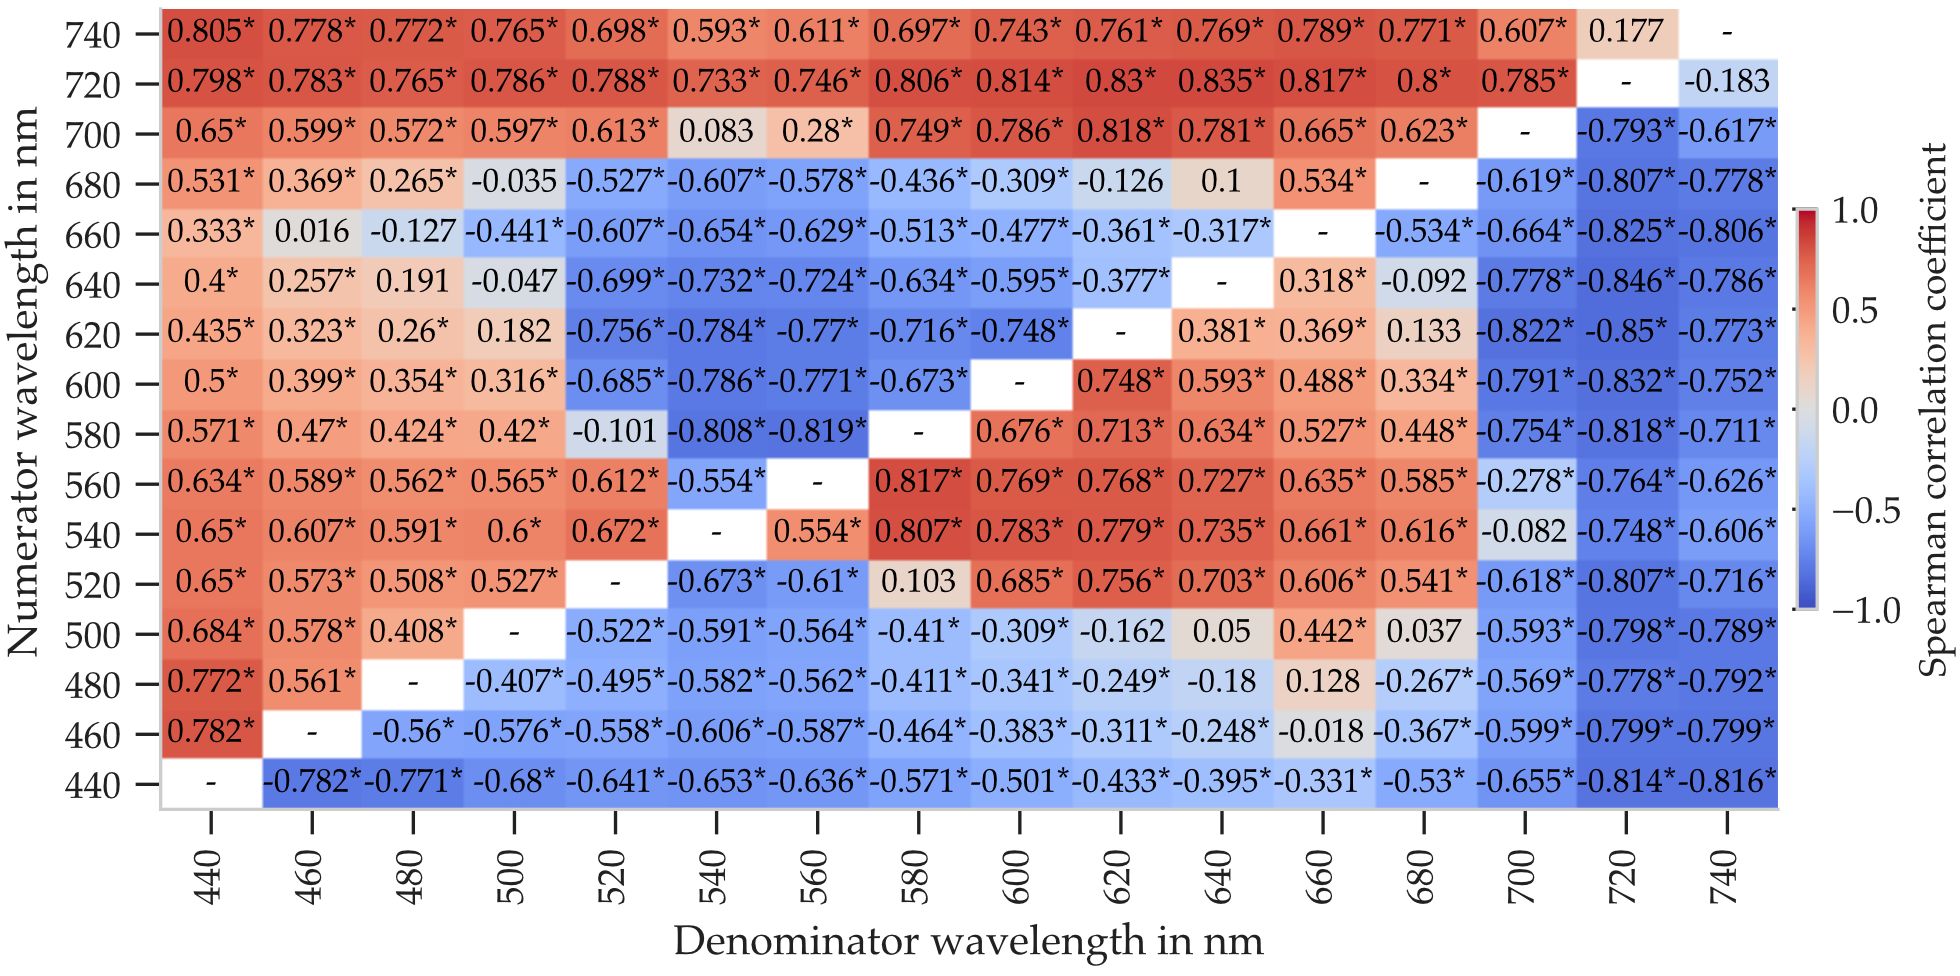
Figure 6. Spearman correlation coefficients between leaf order and spectral reflectance ratios computed from abaxial reflectance. Ratios were calculated as ρ(λnum)/ρ(λden) for all combinations of wavelengths between 440nm and 740nm in 20nm steps. Asterisks mark statistically significant correlations (p < 0.01). Calculated from 34 plants, with five leaves per plant and five measurement points per leaf.
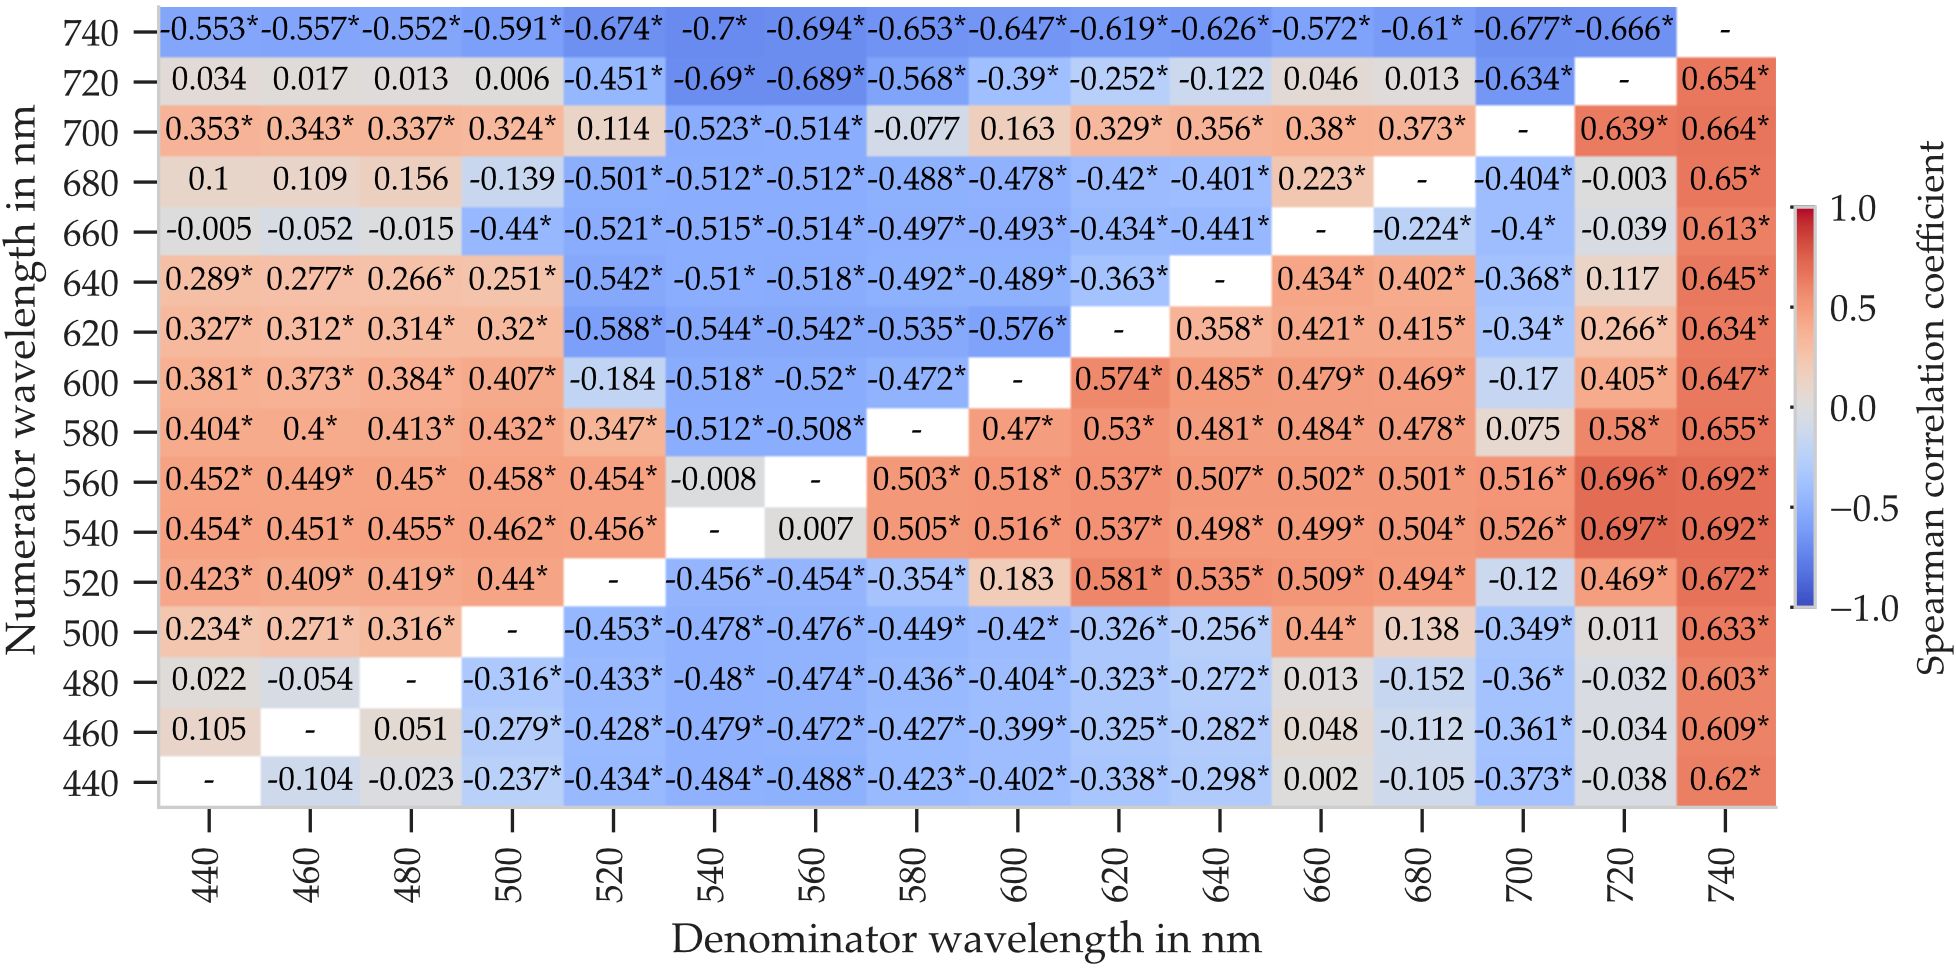
Figure 7. Spearman correlation coefficients between leaf order and spectral reflectance ratios computed from adaxial reflectance. Ratios were calculated as ρ(λnum)/ρ(λden) for all combinations of wavelengths between 440nm and 740nm in 20nm steps. Asterisks mark statistically significant correlations (p < 0.01). Calculated from 34 plants, with five leaves per plant and five measurement points per leaf.
Figure 6 shows that several abaxial spectral ratios exhibit strong correlations with leaf order, particularly when the numerator or denominator includes 440nm, 720nm, or 740nm. The strongest absolute correlation (r = −0.835) was observed for the ratio ρ(720nm)/ρ(640 nm), although this value remained below the correlation achieved by the pure reflectance at 440nm alone.
In contrast to the direct reflectance values shown previously, spectral ratios from adaxial reflectance produced significantly higher correlation coefficients (Figure 7), reaching up to r = 0.741, compared to a maximum of r = 0.433 for single wavelengths. On the adaxial side, however, the specific wavelength combinations had a greater influence on correlation strength. For example, ratios involving 720nm yielded strong correlations only when paired with 540nm or 560nm.
These results suggest that appropriately chosen spectral ratios can enhance sensitivity to leaf ontogeny, especially for adaxial reflectance. While single-wavelength metrics may suffice in some cases, ratio-based metrics allow for improved robustness and potentially better sensor integration within the 440nm to 740nm range.
4 Conclusion
This study identified spectral metrics within the PAR range for monitoring cucumber leaf order and thus the plants development stage. Abaxial leaf reflectance showed a strong, direct correlation with leaf age across the visible spectrum, while adaxial reflectance required the use of spectral ratios.
In a first step, established vegetation indices based on adaxial reflectance were tested. Indices associated with chlorophyll content and LAI showed strong negative correlations with order. However, many of these indices use spectral bands beyond 740nm, which are typically not present in LED-light environments. Thus, while they confirm an age-related signal, their applicability for sensor-based monitoring within the PAR range is limited.
Subsequent correlation analysis focused on direct reflectance values between 440nm and 740nm. Abaxial reflectance showed strong negative correlations with leaf order across large parts of this range. Adaxial reflectance, in contrast, exhibited weaker but positive correlations around 540nm and 700nm. These findings suggest that while adaxial reflectance is less strongly correlated with leaf order overall, specific regions of the spectrum still carry ontogenetic information.
Spectral ratio metrics further supported this conclusion. Several adaxial ratios achieved correlation coefficients up to r = 0.696, and abaxial ratios up to r = 0.818. The reflectance ratio ρ(720nm)/ρ(700nm) consistently emerged as one of the most informative features across all datasets and leaf surfaces.
Based on these results, reflectance should be measured separately by leaf order when used for developmental stage estimation. The identified spectral metrics could also be applied to estimate leaf age in situ using reflectance sensor data under real cultivation conditions.
Furthermore, given the stronger order-dependency observed on the abaxial surface, these findings suggest that bottom-up reflectance measurement, rather than conventional top-down approaches, may be more sensitive to physiological changes in leaf development. Its application requires further investigation since no established sensor configuration currently exists.
Although the results appear robust within the investigated leaf type, follow-up studies should examine the transferability to other varieties, species and light regimes. Future studies should investigate whether spectral markers can indicate not only the developmental stage, but also stress or disease phases at an early stage. As a pragmatic near-term step, we recommend deploying compact top-down VIS spectral sensors in LED-illuminated environments to verify, under operational conditions, the observed relationship between developmental stage and the reflectance ratio ρ(720nm)/ρ(700nm). In practical terms, the present results delineate which VIS bands such sensors should prioritize in LED-dominated settings, particularly the region around 700nm to 730nm together with the 700nm reference band.
Data availability statement
The original contributions presented in the study are included in the article/Supplementary Material. Further inquiries can be directed to the corresponding author.
Author contributions
JB: Conceptualization, Data curation, Formal Analysis, Funding acquisition, Investigation, Methodology, Project administration, Software, Validation, Visualization, Writing – original draft, Writing – review & editing. FW: Writing – original draft, Writing – review & editing, Data curation, Methodology. AH: Methodology, Writing – original draft, Writing – review & editing. TK: Funding acquisition, Supervision, Writing – original draft, Writing – review & editing.
Funding
The author(s) declare financial support was received for the research and/or publication of this article. We thank the Deutsche Forschungsgemeinschaft (DFG, German Research Foundation) for funding of this work under grant no. 516682649.
Acknowledgments
The authors would like to thank Mr. Tim Hegemann for researching some of the metrics used as part of his Master’s thesis (Hegemann, 2019). This article incorporates the results of the doctoral thesis published in February 2025 at the Laboratory of Adaptive Lighting Systems and Visual Processing at the Technical University of Darmstadt, Germany, with the title “Geometrisch-optische Strukturmodellierung zur Simulation von Pflanzenbelichtung” (English: “Geometric-optical structure modeling for the simulation of plant lighting”) by Jens Balasus (Balasus 2025).
Conflict of interest
The authors declare that the research was conducted in the absence of any commercial or financial relationships that could be construed as a potential conflict of interest.
Generative AI statement
The author(s) declare that Generative AI was used in the creation of this manuscript. Generative AI tools were used during manuscript preparation for language editing and restructuring. Specifically, DeepL (deepl.com) was used for initial translation from German to English, and OpenAI ChatGPT (GPT-4 model) was used to assist with improving clarity, grammar, and consistency in scientific writing. All scientific content, analyses, figures, and references were created and curated by the authors. No content, data, or citations were generated by AI. The authors take full responsibility for the integrity and accuracy of the manuscript.
Any alternative text (alt text) provided alongside figures in this article has been generated by Frontiers with the support of artificial intelligence and reasonable efforts have been made to ensure accuracy, including review by the authors wherever possible. If you identify any issues, please contact us.
Publisher’s note
All claims expressed in this article are solely those of the authors and do not necessarily represent those of their affiliated organizations, or those of the publisher, the editors and the reviewers. Any product that may be evaluated in this article, or claim that may be made by its manufacturer, is not guaranteed or endorsed by the publisher.
Supplementary material
The Supplementary Material for this article can be found online at: https://www.frontiersin.org/articles/10.3389/fhort.2025.1664316/full#supplementary-material
The measured spectral reflectance data is available in the Supplemental Data.
References
Balasus J. (2025). Geometrisch-optische Strukturmodellierung zur Simulation von Pflanzenbelichtung. (Darmstadt: Technische Universität Darmstadt). doi: 10.26083/TUPRINTS-00029371
Carter G. A. (1994). Ratios of leaf reflectances in narrow wavebands as indicators of plant stress. Int. J. Remote Sens. 15, 697–703. doi: 10.1080/01431169408954109
Chen J. M. (1996). Evaluation of vegetation indices and a modified simple ratio for boreal applications. Can. J. Remote Sens. 22, 229–242. doi: 10.1080/07038992.1996.10855178
Chen W.-T., Yeh Y.-H. F., Liu T.-Y., and Lin T.-T. (2013). An automatic plant growth measurement system for plant factory. IFAC Proc. Volumes 46, 323–327. doi: 10.3182/20130327-3-JP-3017.00073
Coops N. C. and Stone C. (2005). A comparison of field-based and modelled reflectance spectra from damaged Pinus radiata foliage. Aust. J. Bot. 53, 417. doi: 10.1071/BT04129
Datt B. (1999). A new reflectance index for remote sensing of chlorophyll content in higher plants: tests using eucalyptus leaves. J. Plant Physiol. 154, 30–36. doi: 10.1016/S0176-1617(99)80314-9
Daughtry C. (2000). Estimating corn leaf chlorophyll concentration from leaf and canopy reflectance. Remote Sens. Environ. 74, 229–239. doi: 10.1016/S0034-4257(00)00113-9
Elvanidi A., Katsoulas N., Augoustaki D., Loulou I., and Kittas C. (2018). Crop reflectance measurements for nitrogen deficiency detection in a soilless tomato crop. Biosyst. Eng. 176, 1–11. doi: 10.1016/j.biosystemseng.2018.09.019
Gamon J. A. and Surfus J. S. (1999). Assessing leaf pigment content and activity with a reflectometer. New Phytol. 143, 105–117. doi: 10.1046/j.1469-8137.1999.00424.x
Gitelson A. and Merzlyak M. N. (1994). Spectral Reflectance Changes Associated with Autumn Senescence of Aesculus hippocastanum L. and Acer platanoides L. Leaves. Spectral Features and Relation to Chlorophyll Estimation. J. Plant Physiol. 143, 286–292. doi: 10.1016/S0176-1617(11)81633-0
Gitelson A. A., Gritz Y., and Merzlyak M. N. (2003). Relationships between leaf chlorophyll content and spectral reflectance and algorithms for non-destructive chlorophyll assessment in higher plant leaves. J. Plant Physiol. 160, 271–282. doi: 10.1078/0176-1617-00887
Hegemann T. (2019). “Modellierung des Pflanzenwachstums mittels spektraler Sensordaten,” (Technische Universität Darmstadt, Masterarbeit).
Horler D. N. H., Dockray M., and Barber J. (1983). The red edge of plant leaf reflectance. Int. J. Remote Sens. 4, 273–288. doi: 10.1080/01431168308948546
Kaiser E., Kusuma P., Vialet-Chabrand S., Folta K., Liu Y., Poorter H., et al. (2024). Vertical farming goes dynamic: Optimizing resource use efficiency, product quality, and energy costs. Front. Sci. 2. doi: 10.3389/fsci.2024.1411259
Katsoulas N., Elvanidi A., Ferentinos K. P., Kacira M., Bartzanas T., and Kittas C. (2016). Crop reflectance monitoring as a tool for water stress detection in greenhouses: A review. Biosyst. Eng. 151, 374–398. doi: 10.1016/j.biosystemseng.2016.10.003
Kirci P., Ozturk E., and Celik Y. (2022). A novel approach for monitoring of smart greenhouse and flowerpot parameters and detection of plant growth with sensors. Agriculture 12, 1705. doi: 10.3390/agriculture12101705
Liu N., Lin Z.-F., Van Devender A., Lin G.-Z., Peng C.-L., Pan X.-P., et al. (2009). Spectral reflectance indices and pigment functions during leaf ontogenesis in six subtropical landscape plants. Plant Growth Regul. 58, 73–84. doi: 10.1007/s10725-008-9353-9
Merton R. N. (1999). Multi-temporal analysis of community-scale vegetation stress with imaging spectroscopy. Department of Geography, University of Auckland, Auckland, New Zealand.
Merzlyak M. N., Gitelson A. A., Chivkunova O. B., and Rakitin V. Y. (1999). Non-destructive optical detection of pigment changes during leaf senescence and fruit ripening. Physiologia Plantarum 106, 135–141. doi: 10.1034/j.1399-3054.1999.106119.x
Pen Uelas J., Filella I., Lloret P., Mun Oz F., and Vilajeliu M. (1995). Reflectance assessment of mite effects on apple trees. Int. J. Remote Sens. 16, 2727–2733. doi: 10.1080/01431169508954588
Sims D. A. and Gamon J. A. (2002). Relationships between leaf pigment content and spectral reflectance across a wide range of species, leaf structures and developmental stages. Remote Sens. Environ. 81, 337–354. doi: 10.1016/S0034-4257(02)00010-X
Tran T., Keller R., Trinh V., Tran K., and Kaldenhoff R. (2022). Multi-channel spectral sensors as plant reflectance measuring devices—Toward the usability of spectral sensors for phenotyping of sweet basil (Ocimum basilicum). Agronomy 12, 1174. doi: 10.3390/agronomy12051174
Tucker C. J. (1979). Red and photographic infrared linear combinations for monitoring vegetation. Remote Sens. Environ. 8, 127–150. doi: 10.1016/0034-4257(79)90013-0
Virtanen P., Gommers R., Oliphant T. E., Haberland M., Reddy T., Cournapeau D., et al. (2020). SciPy 1.0: Fundamental algorithms for scientific computing in python. Nat. Methods 17, 261–272. doi: 10.1038/s41592-019-0686-2
Woolley J. T. (1971). Reflectance and transmittance of light by leaves. Plant Physiol. 47, 656–662. doi: 10.1104/pp.47.5.656
Keywords: spectral reflectance, vegetation index, leaf age, horticultural lighting, non-destructive sensing, optical sensors
Citation: Balasus J, Wirth F, Herzog A and Khanh TQ (2025) Identifying reliable visible-spectrum reflectance metrics for monitoring cucumber leaf development. Front. Hortic. 4:1664316. doi: 10.3389/fhort.2025.1664316
Received: 11 July 2025; Accepted: 10 November 2025; Revised: 21 October 2025;
Published: 26 November 2025.
Edited by:
Oksana Lastochkina, Institute of Biochemistry and Genetics of Ufa Scientific Centre (RAS), RussiaCopyright © 2025 Balasus, Wirth, Herzog and Khanh. This is an open-access article distributed under the terms of the Creative Commons Attribution License (CC BY). The use, distribution or reproduction in other forums is permitted, provided the original author(s) and the copyright owner(s) are credited and that the original publication in this journal is cited, in accordance with accepted academic practice. No use, distribution or reproduction is permitted which does not comply with these terms.
*Correspondence: Jens Balasus, YmFsYXN1c0BsaWNodHRlY2huaWsudHUtZGFybXN0YWR0LmRl