Abstract
In urban areas with many commercial facilities, patrolling by police officers or security guards is essential for crime prevention, in addition to the use of surveillance cameras. To address the challenge of planning effective patrol routes, Tohyama and Tomisawa introduced the Police Officer Patrolling Problem (POPP), an arc routing problem that allows for visual monitoring from intersections and is proven to be NP-complete. Building on this work, we propose the Generalized POPP (GPOPP), a more realistic bi-objective combinatorial optimization model. This model simultaneously minimizes the total patrol route length and maximizes the coverage of surveillance areas. The contributions of this paper are threefold: (1) we formulate the GPOPP by incorporating practical constraints, such as mandatory patrolling of high-security roads and visibility-based coverage from intersections; (2) we develop a novel hybrid heuristic method that combines a multi-objective evolutionary algorithm (MoEA-HSS) with an improved Jaya algorithm to solve the GPOPP effectively; and (3) we conduct comprehensive computational experiments using benchmark instances to evaluate the effectiveness and competitiveness of the proposed method. These contributions demonstrate the practicality and efficiency of our approach for addressing realistic urban patrolling problems.
1 Introduction
In the fields of information engineering and science, to solve various social and economic problems, these problems are generally structured as mathematical models, and solutions are found using algorithms that are suited to that structure. Many of these problems are modeled using discrete graphs, and there are many studies on them.
One of the problems modeled by discrete graphs is the routing problem. Routing problems are classified as node routing problems (NRPs), which traverse the nodes of a graph, and arc routing problems (ARPs), which traverse the edges (or arcs). A typical NRP is the traveling salesperson problem (TSP). The TSP is a problem that involves finding the minimum-cost route that visits every vertex exactly once. The vehicle routing problem (VRP) (Dantzig and Ramser, 1959) is a generalization of the TSP. This problem involves planning transportation from a distribution center to multiple customers using trucks or other transportation methods. Both the TSP and VRP are NP-hard; thus, evolutionary algorithms, such as genetic algorithms (GAs), have been studied (Elatar et al., 2023).
The most famous ARP is probably the Euler circuit problem. This problem determines whether there exists a circuit that traverses all edges exactly once for a given graph, and this problem is solvable in polynomial time. The Chinese postman problem (CPP) (Mei-Ko, 1962), which is a generalization of the Euler circuit problem, involves determining whether a tour exists for a post officer in a given area within a given amount of time that starts and ends at the post office. The post officer must traverse every street in the area at least once; however, they may traverse any street several times. The CPP on undirected or directed graphs can be solved in polynomial time (Edmonds and Johnson, 1973). Papadimitriou (1976) showed that the CPP on mixed graphs is NP-complete. Mixed graphs represent realistic situations in urban areas with both two- and one-way streets. The rural postman problem (RPP) is a generalization of the CPP with a given set of edges that must be traversed by a post officer. This problem considers the fact that, in rural areas, not every street has a delivery destination. Lenstra and Rinnooy-Kan (1976) and Lenstra and Rinnooy-Kan (1981) showed that the optimization version of the RPP on undirected or directed graphs is NP-hard. The capacitated ARP (CARP) is an ARP corresponding to the VRP, which belongs to the NRP. The CPP, RPP, and CARP correspond to mathematical models of real social problems such as postal delivery, delivery planning, snow shoveling, and garbage collection. Finding exact solutions for the CPP and RPP optimization problems is intractable, along with the TSP and VRP; thus, various heuristic methods have been proposed for these problems. Recent examples include methods using GAs (Gil-Gala et al., 2023), the Tabu search algorithm (Tang et al., 2024), and ant colony optimization (Sgarro and Grilli, 2024).
Police patrols play a crucial role in preventing crimes and accidents, thereby ensuring public safety within their jurisdictions. Recent studies such as (Kim et al., 2023; Dewinter et al., 2020; Samanta et al., 2022) have proposed methods for optimizing patrol routes. These approaches primarily employ heuristic algorithms to generate efficient patrol routes for multiple officers operating within the shared area.
Recently, Tohyama and Tomisawa (2022) proposed the police officer patrol problem (POPP) as a mathematical model of the patrolling route problem of police officers (or security guards), and showed that the decision problem is NP-complete (Tohyama and Tomisawa, 2022). Patrolling areas generally include one- and two-way streets; thus, the POPP is modeled using a mixed graph. At each intersection, police officers may conduct security checks visually even if they do not traverse the streets connecting to it. If the POPP is considered a CPP model, it is necessary to find a patrolling route that traverses all streets. The POPP model allows some streets to conduct visual security checks without traversing, making it possible to find more efficient patrolling routes. In addition, Tomisawa and Tohyama showed that the POPP on weighted digraphs is NP-complete (Tomisawa and Tohyama, 2024).
In this study, we introduce the generalized POPP (GPOPP) as a model to adapt the POPP to more realistic patrolling routes by police officers. The POPP model requires that all areas be guarded. However, in reality, some streets require security because important facilities are located there, and some roads do not necessarily require security (Chainey et al., 2021). In addition, there are cases where a patrolling route needs to be found that can be patrolled within a given time. Therefore, we define the GPOPP as an optimization problem with the following two objectives. The first objective is to find the shortest patrolling route among the routes that traverse all high-security streets. The second objective is to find a patrolling route that guards as large a given area as possible (maximizes coverage).
Many GAs have been proposed to solve multi-objective problems (Deb et al., 2002; Sardinas et al., 2006; Pizzuti, 2009; Ghoseiri and Ghannadpour, 2010; Aiello et al., 2012; Akyurt et al., 2015; Yu et al., 2015; Lu et al., 2019). The hybrid sampling strategy based multi-objective evolutionary algorithm (MoEA-HSS) (Zhang et al., 2014) is based on a hybrid sampling strategy that combines a vector-valued GA (VEGA) (Schaffer, 2014) and a sampling strategy according to the Pareto dominating and dominated relationship-based fitness function (PDDR-FF) (a goodness-of-fit function based on Pareto dominance–dominance relations). The MoEA-HSS has demonstrated effectiveness for several problems. The Jaya algorithm (Rao, 2016) is a meta-heuristic algorithm with a very simple structure based on the concept that solutions obtained for a particular problem progress toward the best solution and avoid the worst solution. We propose a hybrid heuristic approach that combines the MoEA-HSS with an improved Jaya algorithm, and demonstrate its effectiveness through numerical experiments.
The remainder of this paper is organized as follows. In Section 2, we formally define the Generalized Police Officer Patrolling Problem (GPOPP) and present the necessary graph-theoretical concepts. Section 3 provides a mathematical formulation of the GPOPP as a bi-objective optimization problem. In Section 4, we describe the proposed hybrid heuristic method that combines the MoEA-HSS and an improved Jaya algorithm. Section 5 presents the results of the numerical experiments conducted to evaluate the performance of the proposed method. Finally, Section 6 concludes the paper and discusses potential directions for future research.
2 Generalized police officer patrolling problem (GPOPP)
In this study, we introduce a bi-objective problem that can be applied to more realistic problems based on the POPP, which is NP-complete edge routing decision problem, and propose a heuristic algorithm to solve the problem. One police officer (or security guard or robot) is assigned to a security area, and each officer patrols his/her assigned area. Each street through which a police officer is traversed during a patrol is considered guarded. In addition, except for streets with important facilities, police officers are allowed to visually confirm each street adjacent to an intersection without traversing it. The GPOPP is a bi-objective optimization problem with the following two objectives: One is to find the patrolling route with the shortest length, and the other is to find the route with the largest guarded area. Here, we note that all high-security streets must be traversed. In this section, we define the notion in graph theory necessary to formulate the GPOPP.
Throughout this paper, let be the set of all natural numbers. Let and for each . Let be a connected simple mixed graph, where is the set of vertices, is the set of undirected edges and is the set of arcs. Hereafter, the number of vertices in is denoted as and fixed to . Here, we denote an undirected edge by and an arc by . The term “edge” refers to either an undirected edge or an arc, denoted by . Thus, if is an undirected edge, ; if it is an arc, .
Let
be a sufficiently large positive integer. Then, let
be a function from
to
satisfying the following conditions: for all
,
1. ,
2. ,
3. , .
Here, denotes the distance between and if there exists an edge (or ). For convenience, when there is no edge between and .
Let
be a subset of
. We consider that there exist important facilities on each edge in
that must be stopped at. Each edge in
is considered a high-security edge. A sequence
:
,
,
,
,
of vertices is considered a patrolling route on
if the following conditions hold:
1. The sequence is a walk. That is, for each .
2. All edges in are on . That is, if , there exists satisfying and or and . If , there exists satisfying and .
3. . That is, the walk is closed.
The length of a patrolling route is the total sum of the distances of all edges on and is calculated as follows:
For a patrolling route , let and . Here, denotes the set of vertices on , and denotes the set of edges traversed in . Let be an edge of . If or , the edge is considered guarded. In particular, if , said the edge is considered guarded by traversing; otherwise, if exactly one vertex of and is in , the edge is considered guarded by visual confirmation.
Let be a set of edges guarded by a patrolling route . Then, the total sum of the distances of all edges guarded by is denoted as . The total sum of the distances of all edges of is denoted as ; thus, the covered ratio of by is defined as follows:
Similarly, is called the noncovered ratio of by . For any patrolling route of , and holds.
An example of a patrolling route for a mixed graph is illustrated in Figure 1. The red edges represent high-security edges, and the blue line indicates a patrolling route. The green area is guarded by this patrolling route. In particular, the green area not on the patrolling route is guarded by visual confirmation. The graph shown in Figure 1 has 60 vertices and 104 edges. Let us assume that the distance between any two vertices is one. Then, the length of the patrolling route is 44. The total sum of the distances of the guarded edges is 84, and the covered and noncovered ratios are 0.808 and 0.192, respectively.
FIGURE 1

Patrolling route (blue line) on mixed graph. The red edges represent high-security edges, and the green area indicates a guarded area.
Let be a vertex on a patrolling route : , , , , of a mixed graph . If , and , then the sequence : , , , , , , , , by removing from is also a patrolling route of (In the case , : , , , , , is a patrolling route if , and ). Some edges guarded by visual confirmation from on may not be guarded on , although two edges removing from are guarded by visual confirmation. That is, holds. On the other hand, the increase or decrease in the length of the sequence , , , , does not determine the increase or decrease in the length of the patrolling route. That is, holds if the triangle inequality ( in the case ) is satisfied, otherwise, holds.
3 Formulation
The GPOPP is a bi-objective optimization problem that obtains a patrolling route with the shortest length and the lowest noncovered ratio for a given connected simple mixed graph
, a set
of high-security edges, and a distance function
. The parameters
,
,
, and
for the GPOPP are defined as follows:
(i) : number of vertices.
(ii)
If
has an undirected edge
,
; if
has an arc
,
and
.
(iii)
Note that
even if
is an arc in
.
(iv) for each .
(v)
In other words, when there is an edge that has endpoints and ; when there is no edge between them in the mixed graph . is immediately obtained from .
The decision variables for the GPOPP are
and
. The decision variable
represents the number of times the edge
is traversed from
to
. If there exists no edge between
and
,
. The decision variable
is expressed as follows:
(vi)
We remark that is strictly positive if and only if the vertex is in . Thus, when both and are on ; and when is on even though is not on . Note that does not mean that or are in . Then, denotes the total length of edges guarded by the patrolling route .
Let be an -tuple of nonnegative integers. The mathematical model for the GPOPP is formulated as follows:
The objective function is the function that minimizes the total length of the patrolling route, and is the function that minimizes the noncovered ratio.
The following constraints must be satisfied:where is the same as defined in the previous section. Equation 1: The number of times to directly traverse from to is nonnegative. Equation 2: If there exists no edge between and or even if there exists an arc from to , it is not possible to directly traverse from to . Equation 3: The edge (or ) must be traversed if it is a high-security edge. Equation 4: For any vertex , the number of times traversed from other vertices to is the same as the number of times traversed from to other vertices.
Suppose that does not satisfy Equation 5. Then, there exists a nonempty proper subset of that satisfies . This means that any edge incident to and is not traversed; therefore, represents two or more separate walks. In other words, based on Equation 5, the patrolling route is a continuous closed walk.
The notation used in formulating the mathematical programming model for GPOPP is summarized as follows:
Parameters
1 if , 0 otherwise
1 if or , 0 otherwise
same as
1 if or , 0 otherwise
number of vertices
Decision variables
number of traversing from to
if both on , 1 if only one of or ,
Objective functions
minimize the length of the patrolling route
minimize the length of the non-covered ratio
4 Proposed methods
4.1 Framework
The GPOPP requires two conflicting objectives to be considered simultaneously: minimizing the total length of the patrolling route and minimizing its noncoverage ratio. Many Pareto-optimal solutions with incomparable qualities must be generated for the decision-maker. In this section, we introduce a hybrid heuristic approach based on the MoEA-HSS and the improved Jaya algorithm for the GPOPP.
The MoEA-HSS is based on a hybrid sampling strategy that combines the VEGA and a sampling strategy according to the PDDR-FF. The sampling strategy of the VEGA is a natural extension of simple GAs in the sense that the individuals are divided and reproduced independently according to each objective function. It prefers the edge region of the Pareto front with less time complexity, and the qualities of the solution are not good because of the selection bias. Conversely, the PDDR-FF-based sampling strategy tends to converge toward the central area of the Pareto front. The combination of these two mechanisms is expected to maintain both the convergence rate and distribution performance. The Jaya algorithm modifies a given individual to move closer to the best solution and away from the worst solution based on the best and worst candidates in the population. The Jaya algorithm is expected to accelerate the convergence rate.
The main framework of the proposed method is shown in Figure 2. The assemblage of chromosomes in each generation is divided into two groups and . and are called Archive and Population, respectively. The Pareto solution set update shown in the figure follows the same procedure as in the MoEA-HSS (Zhang et al., 2014) framework.
FIGURE 2
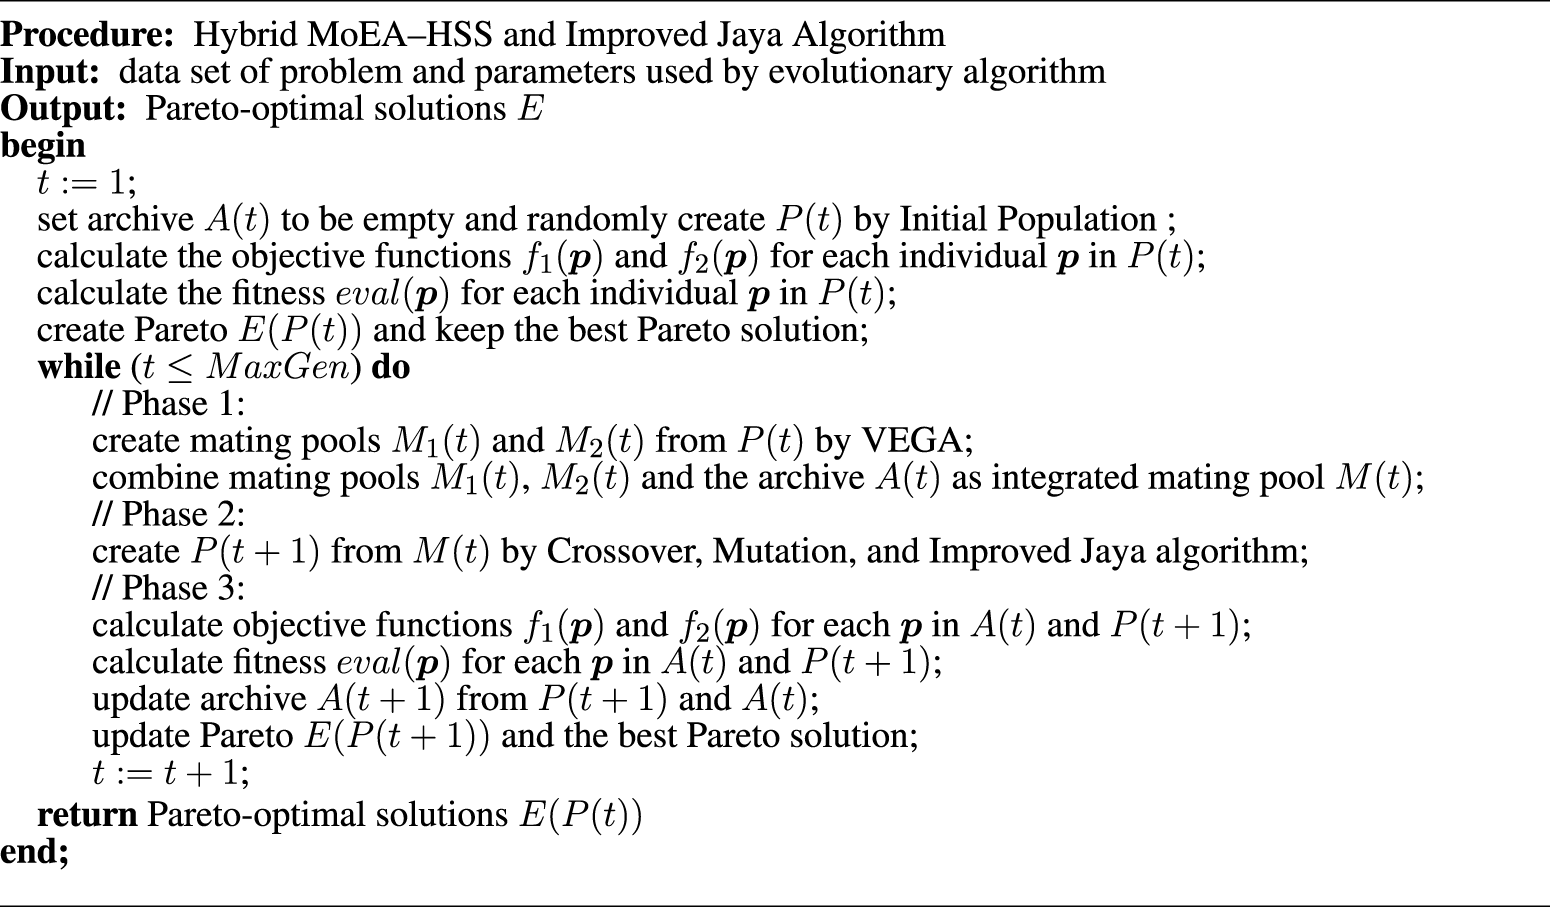
Pseudocode for the proposed method.
Let be a positive constant. Initially, archive is set to empty, and the initial population consists of individuals. For each individual in population, the objective functions and and the evaluation function are calculated. We adopt the PDDR-FF as the evaluation function . Let be the number of individuals that can be dominated by the individual and be the number of individuals that can dominate the individual . Then,
Based on these values, the Pareto-optimal solution in the population is obtained and maintained.
The following three phases are executed in each generation
. In each generation
, archive
contains
individuals and population
contains
individuals generated by genetic operations (Crossover and Mutation) and Improved Jaya algorithm in the previous generation.
Phase 1: generating mating pools
1. Using the VEGA, two subpopulations and , called mating pools from , are created. is created by individuals selected from based only on the value of . Then, the value of is ignored. Similarly, is created by individuals selected from based only on the value of .
2. An integrated mating pool is created by combining the two mating pools and and Archive .
Phase 2: create
For individuals in the integrated mating pool , Crossover and Mutation operations and the Improved Jaya algorithm are applied, and the -th generation population consisting of or more individuals is created. These three operations are described in detail in the following.
Phase 3: create
1. For each in and , the values , , and are computed.
2. is created by selecting individuals from and in the order of decreasing value.
Phases 1 – 3 of the proposed method are depicted in Figure 3.
FIGURE 3
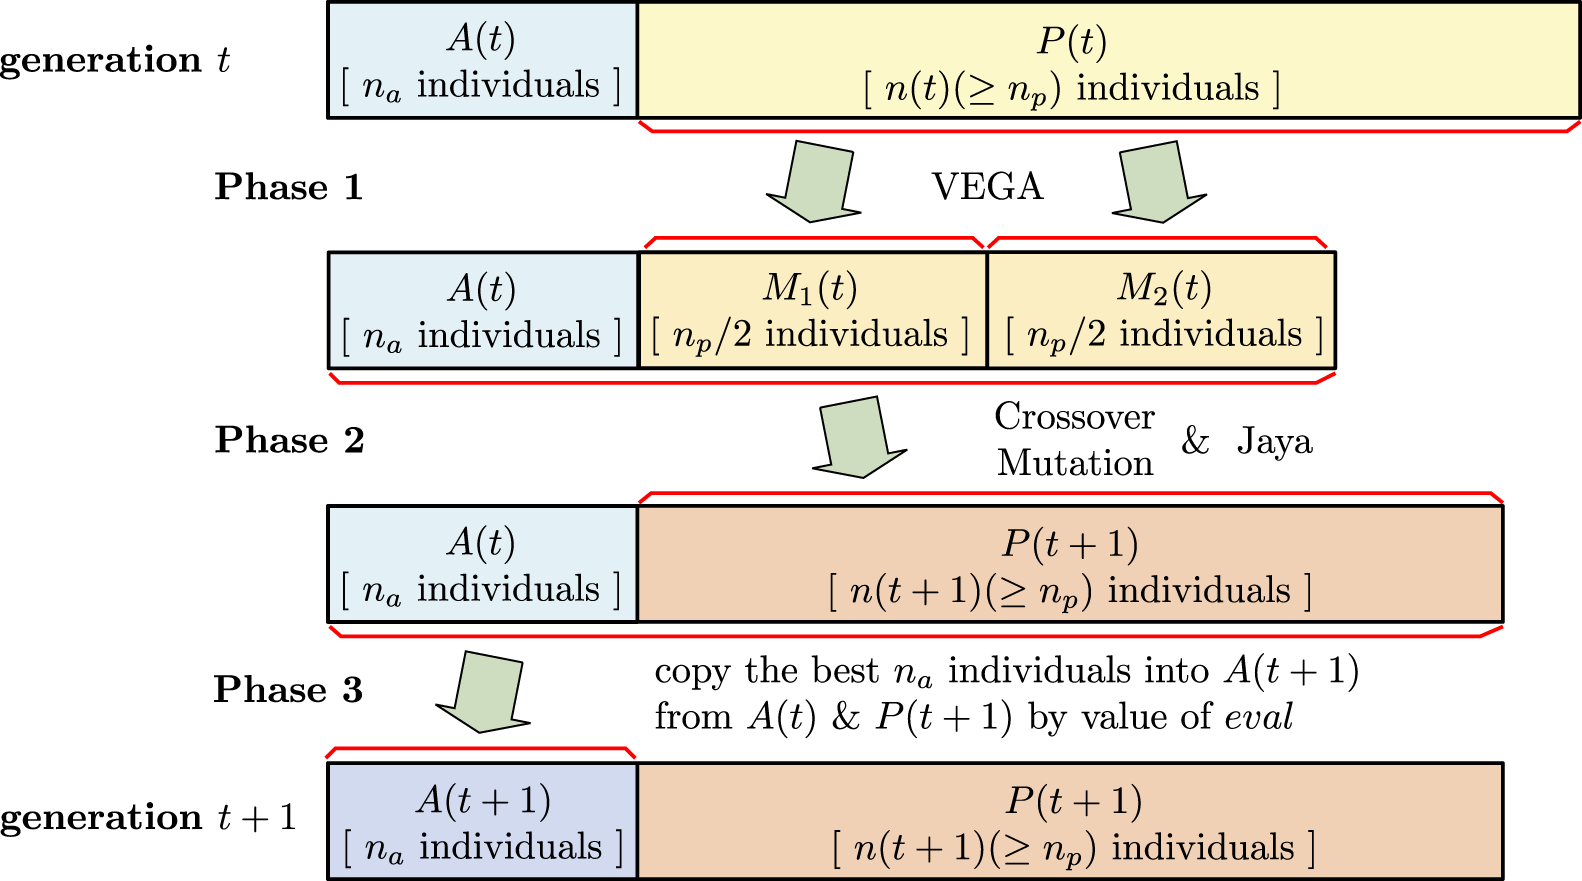
Phases 1–3 of the proposed method.
4.2 Chromosome representation and notation
The most natural route expression is adopted as the chromosome expression in the proposed method. For example, if a sequence : , , , , of vertices is a legal patrolling route, its chromosome representation is a -tuple . The first component of is considered the starting point. By rotating the genes in , the chromosome at which the starting point is replaced with is denoted by . That is,
Since GPOPP does not have a fixed starting point, all chromosomes
,
,
,
,
represent the same patrolling route. This representation
obtained by routing the genes of chromosome
is useful for explaining the genetic operations introduced below. Let
be the set of all genes and
be the set of genes contained in chromosome
. For each gene
, let
be the set of gene loci whose gene is
. Let
and
be a set of pairs of adjacent genes in chromosome
and
. Genes
and
are also considered adjacent. Here,
and
. Let
and
denote the previous and next genes of
in chromosome
, respectively. Here, these gene loci are
and
, where
(mod
) denotes the least nonnegative remainder when
is divided by
. Then, the two sets
and
of the gene loci are defined as follows:
For each gene ,
For each gene ,
4.3 Initial population
As mentioned in
Section 4.1, an initial population consisting of
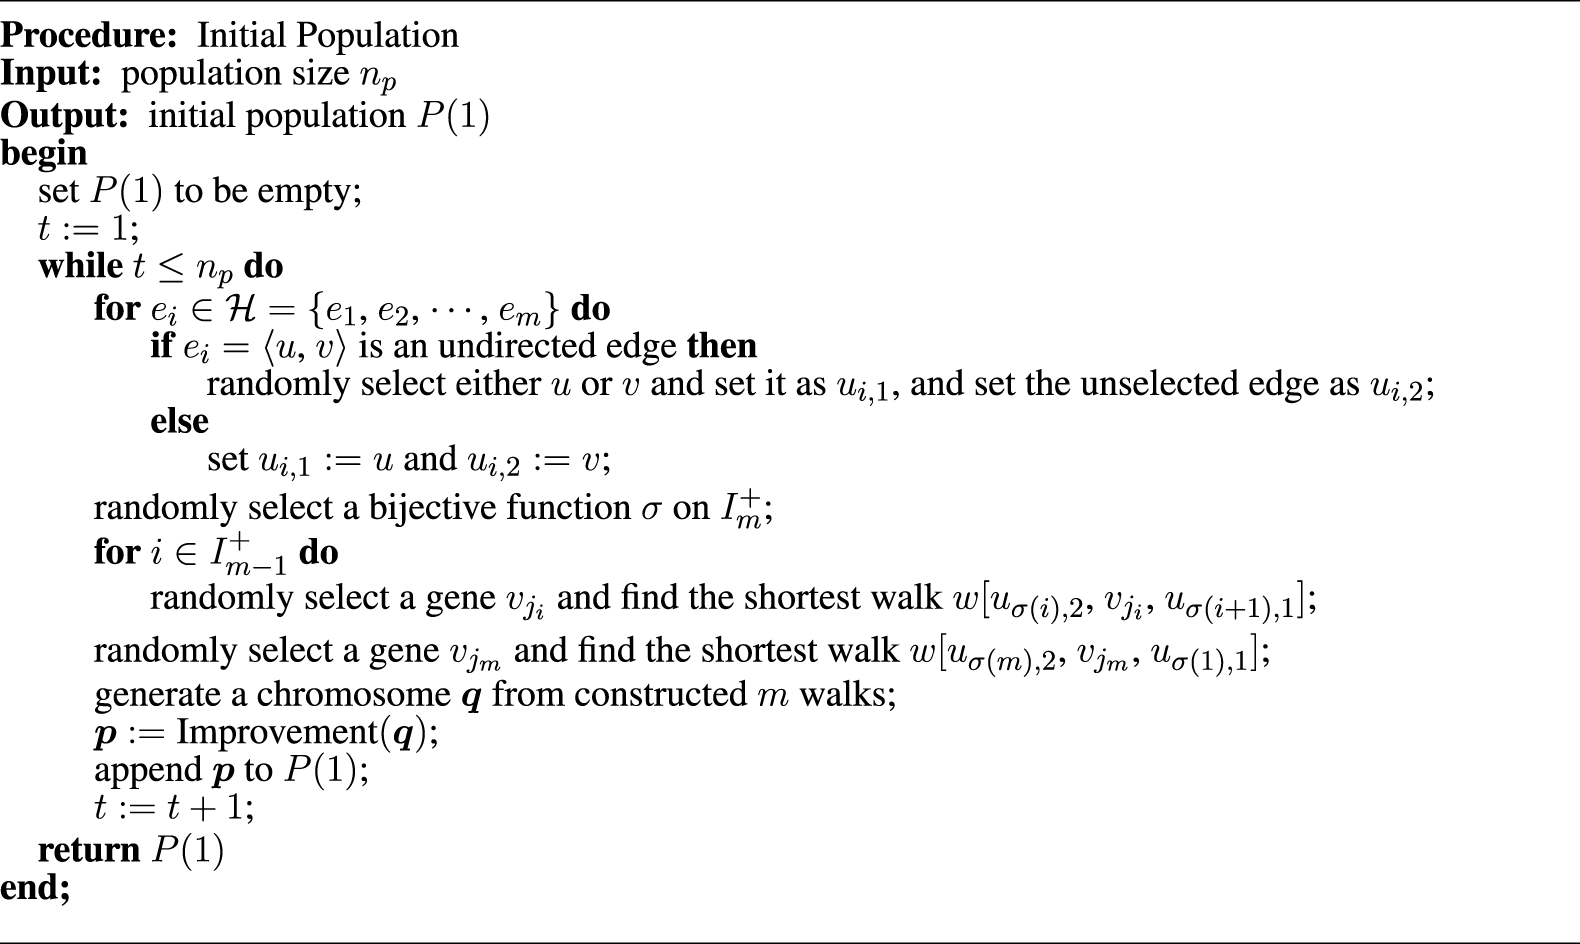
individuals is constructed. Each individual in the initial population is generated as follows:
1. First, the direction traversing each high-security undirected edge is decided randomly, since because all high-security edges are traversed on every patrolling route.
2. Determine the order of traversing high-security edges randomly.
3. Generate chromosome representing the patrolling route that traverses high-security edges in the order determined in step 2. Here, to maintain the diversity of the initial population, two consecutive high-security edges are connected by a shortest path via a randomly selected vertex. The shortest walk from vertex to via can be determined using the Dijkstra’s algorithm.
4. The patrolling route represented by the generated chromosome may be able to reduce the total length without changing the noncoverage rate. Therefore, the improvement procedure described below is used for chromosome generated in step 3.
The pseudocode for the procedure generating the initial population consisting of individuals is presented in Figure 4.
FIGURE 4
Pseudocode for the creation of the initial population.
Let , , , , , be a patrolling route, and assume that and (, , ). Then, the edge connecting and is undirected. If , the edge is traversed three times on , as shown in the left panel of Figure 5a, and there exists a patrolling route that reduces the total length, as shown in the right panel of Figure 5a. Such a patrolling route traverses all edges on the original route; thus, the noncoverage rate remains unchanged. Similarly, even if , the edge is traversed three times, as shown in the left panel of Figure 5b, and there exists a patrolling route that reduces the total length without changing the noncoverage rate, as shown in the right panel of Figure 5b. In general, assume that undirected edge is traversed from to times and from to times. If , there exists a patrolling route that reduces both the number of times traversing from to and from to by times without changing the noncoverage rate. If , there exists a patrolling route that reduces both the number of times traversing from to and from to by times without changing the noncoverage rate. The pseudocode for the improvement procedure of the chromosome is shown in Figure 6.
FIGURE 5

Construction of patrolling route from which redundant traversing of undirected edges is reduced: (a) case i < j, (b) case j < i.
FIGURE 6
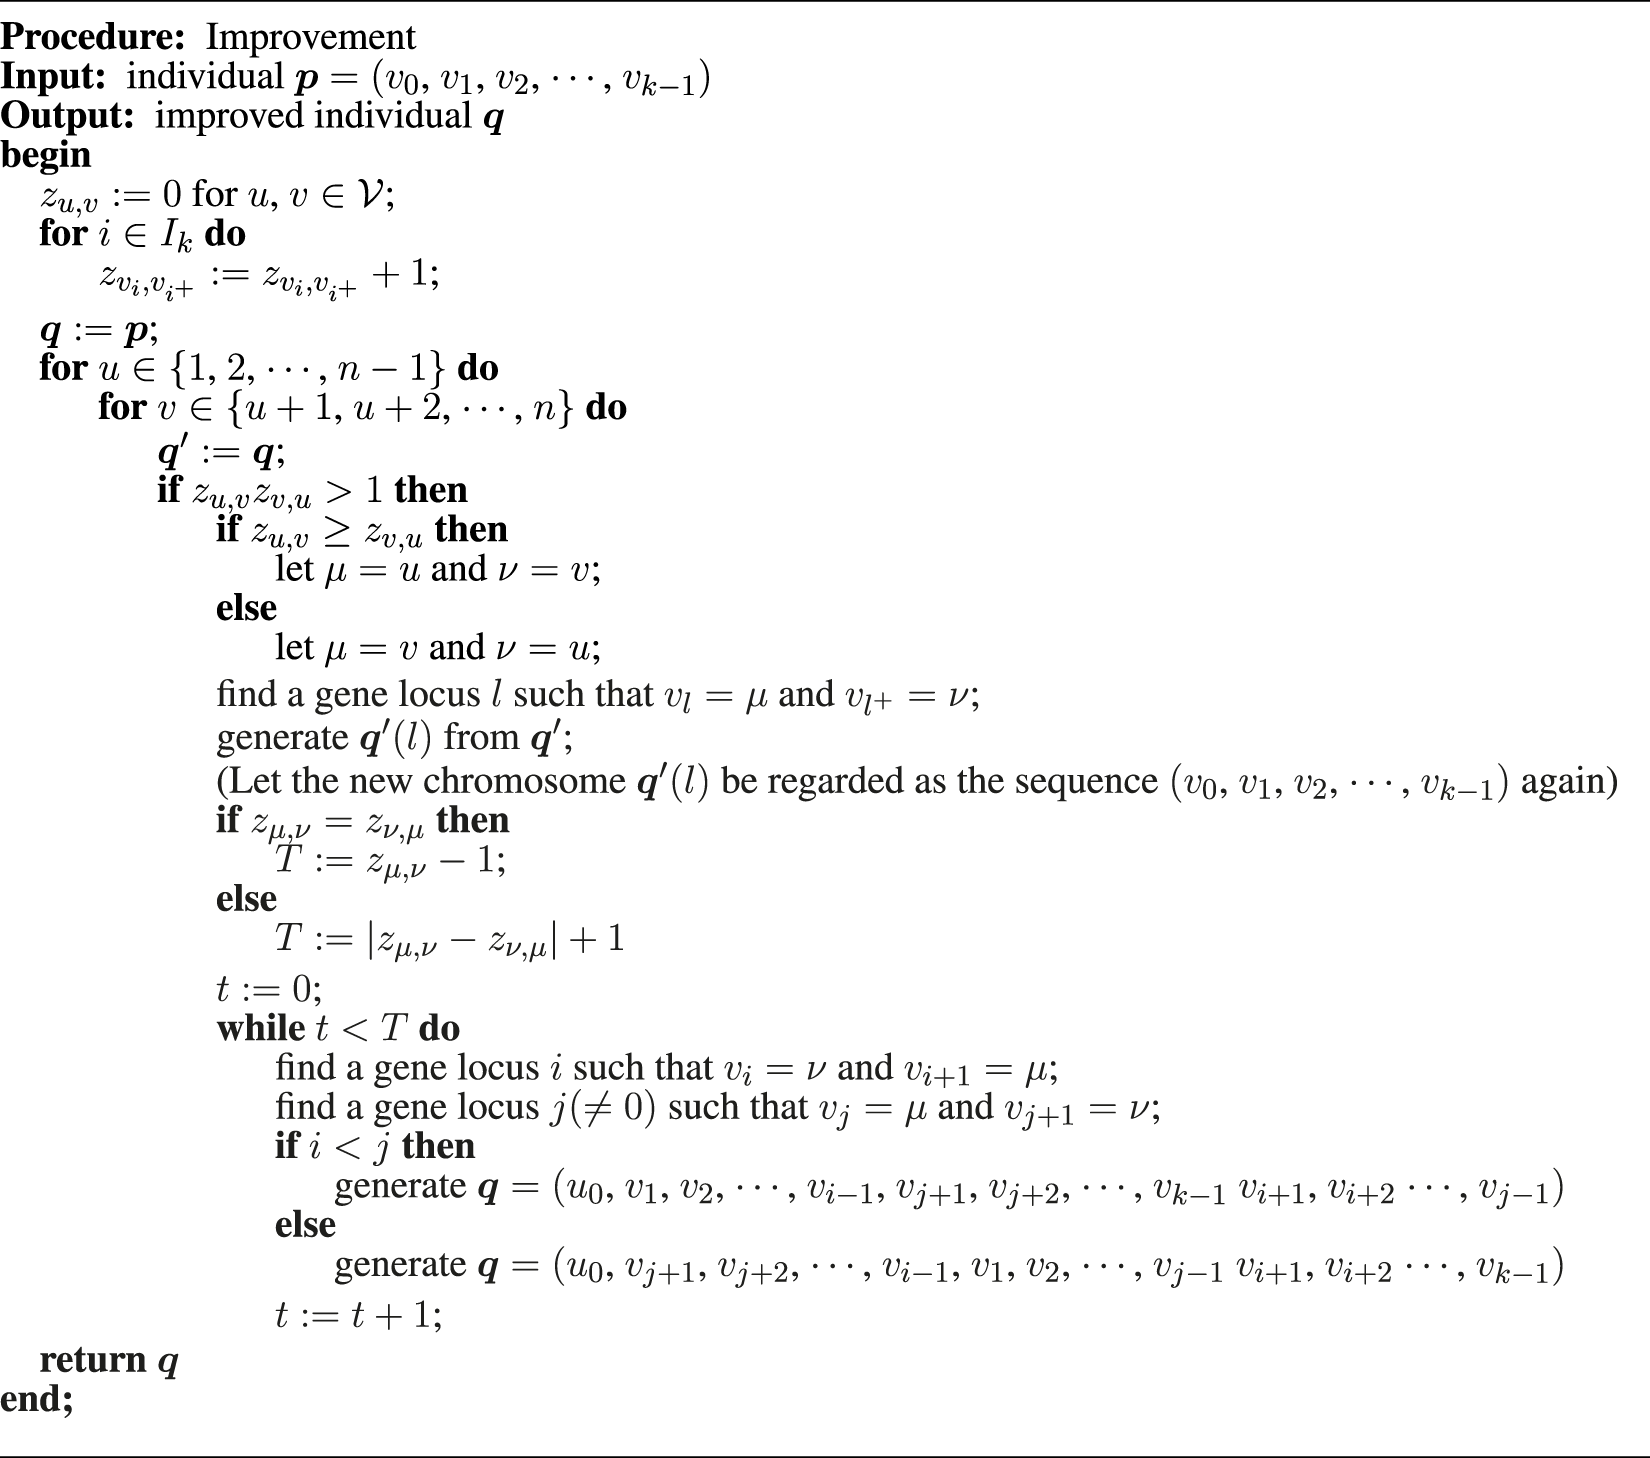
Pseudocode for the improvement of individual.
4.4 Crossover
Let
and
be two parent individuals. Then, the crossover operation is used in the proposed method to replace a partial walk on the patrolling route corresponding to
with that corresponding to
. The procedure is as follows:
(a) Any patrolling route requires that all high-security edges are traversed. First, one high-security edge is randomly selected from , and one gene in such that and one gene in such that are selected (Figure 7a).
(b) Find the high-security edge that first appears in the rotated chromosome , and in the rotated chromosome , randomly select one gene such that (Figure 7b).
(c) In the patrolling route corresponding to the chromosome , the partial walk between and does not include high-security edges. Therefore, offspring can be created by replacing this partial walk with the partial walk between and in . However, when selected high-security edges or are undirected edges, the direction of traversing them on may differ from the direction of traversing them on . In this case, simply exchanging partial walks does not lead to creating an accurate patrolling route. Based on the direction of traversing and , the process of creating offspring can be divided into four steps as follows (Figure 7c): Let be a chromosome to be created by simply replacing the partial walk from to on with the partial walk to on . Then,
(1) When both and are traversed in the same direction on and (that is, and ), let be .
(2) When is traversed in the opposite direction although is traversed in the same direction (that is, and ), let be the chromosome created by inserting gene between and on .
(3) When is traversed in the opposite direction although is traversed in the same direction (that is, and ), let be the chromosome created by appending gene at the end on .
(4) When both and are traversed in the opposite direction (that is, and ), let be the chromosome created by inserting gene between and and by appending gene at the end on .
(d) Find the high-security edge that first appears in the rotated chromosome , and in the rotated chromosome , randomly select one gene such that . Following the procedure used to create offspring , offspring is created.
(e) Create offspring and by applying the improvement procedure described in Section 4.3 to and .
FIGURE 7
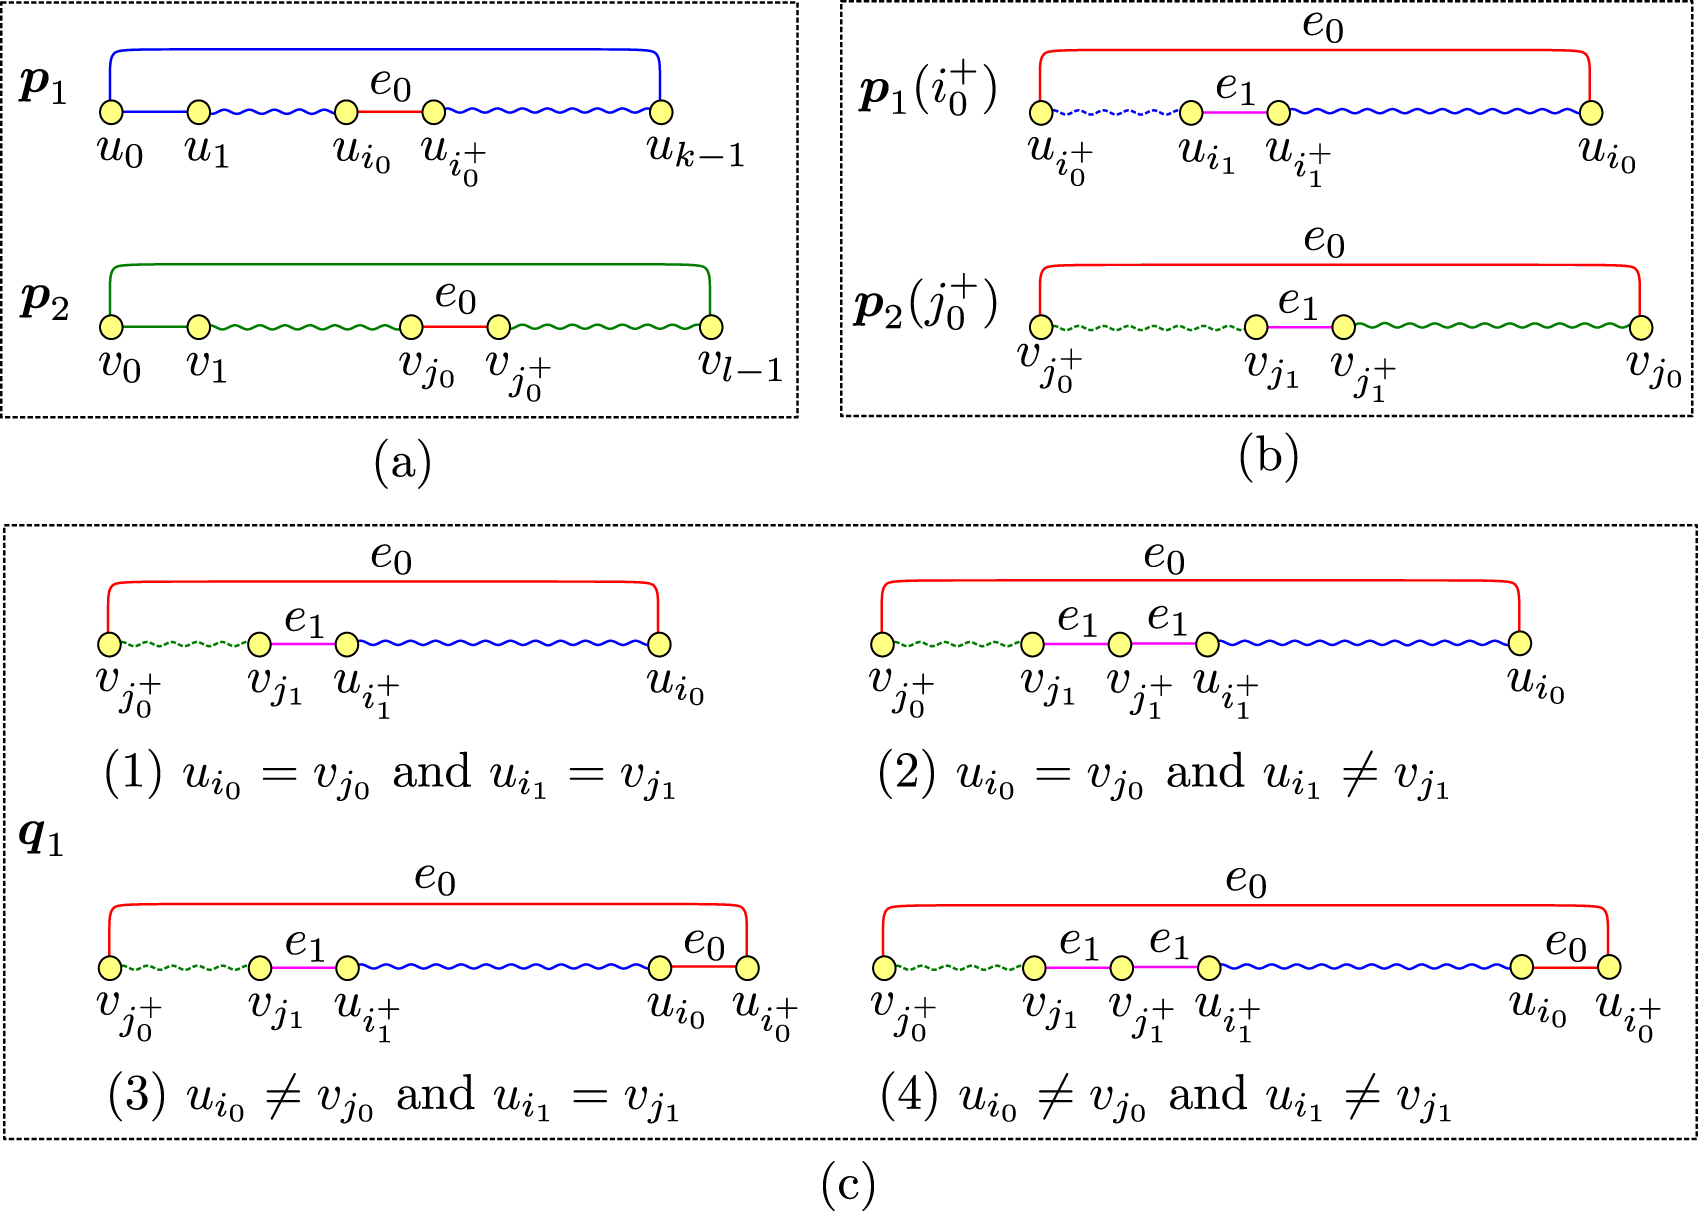
Creation of offspring from parent individuals in Crossover operation: (a) original parent individuals and , (b) rotated chromosomes and , and (c) offspring created from and .
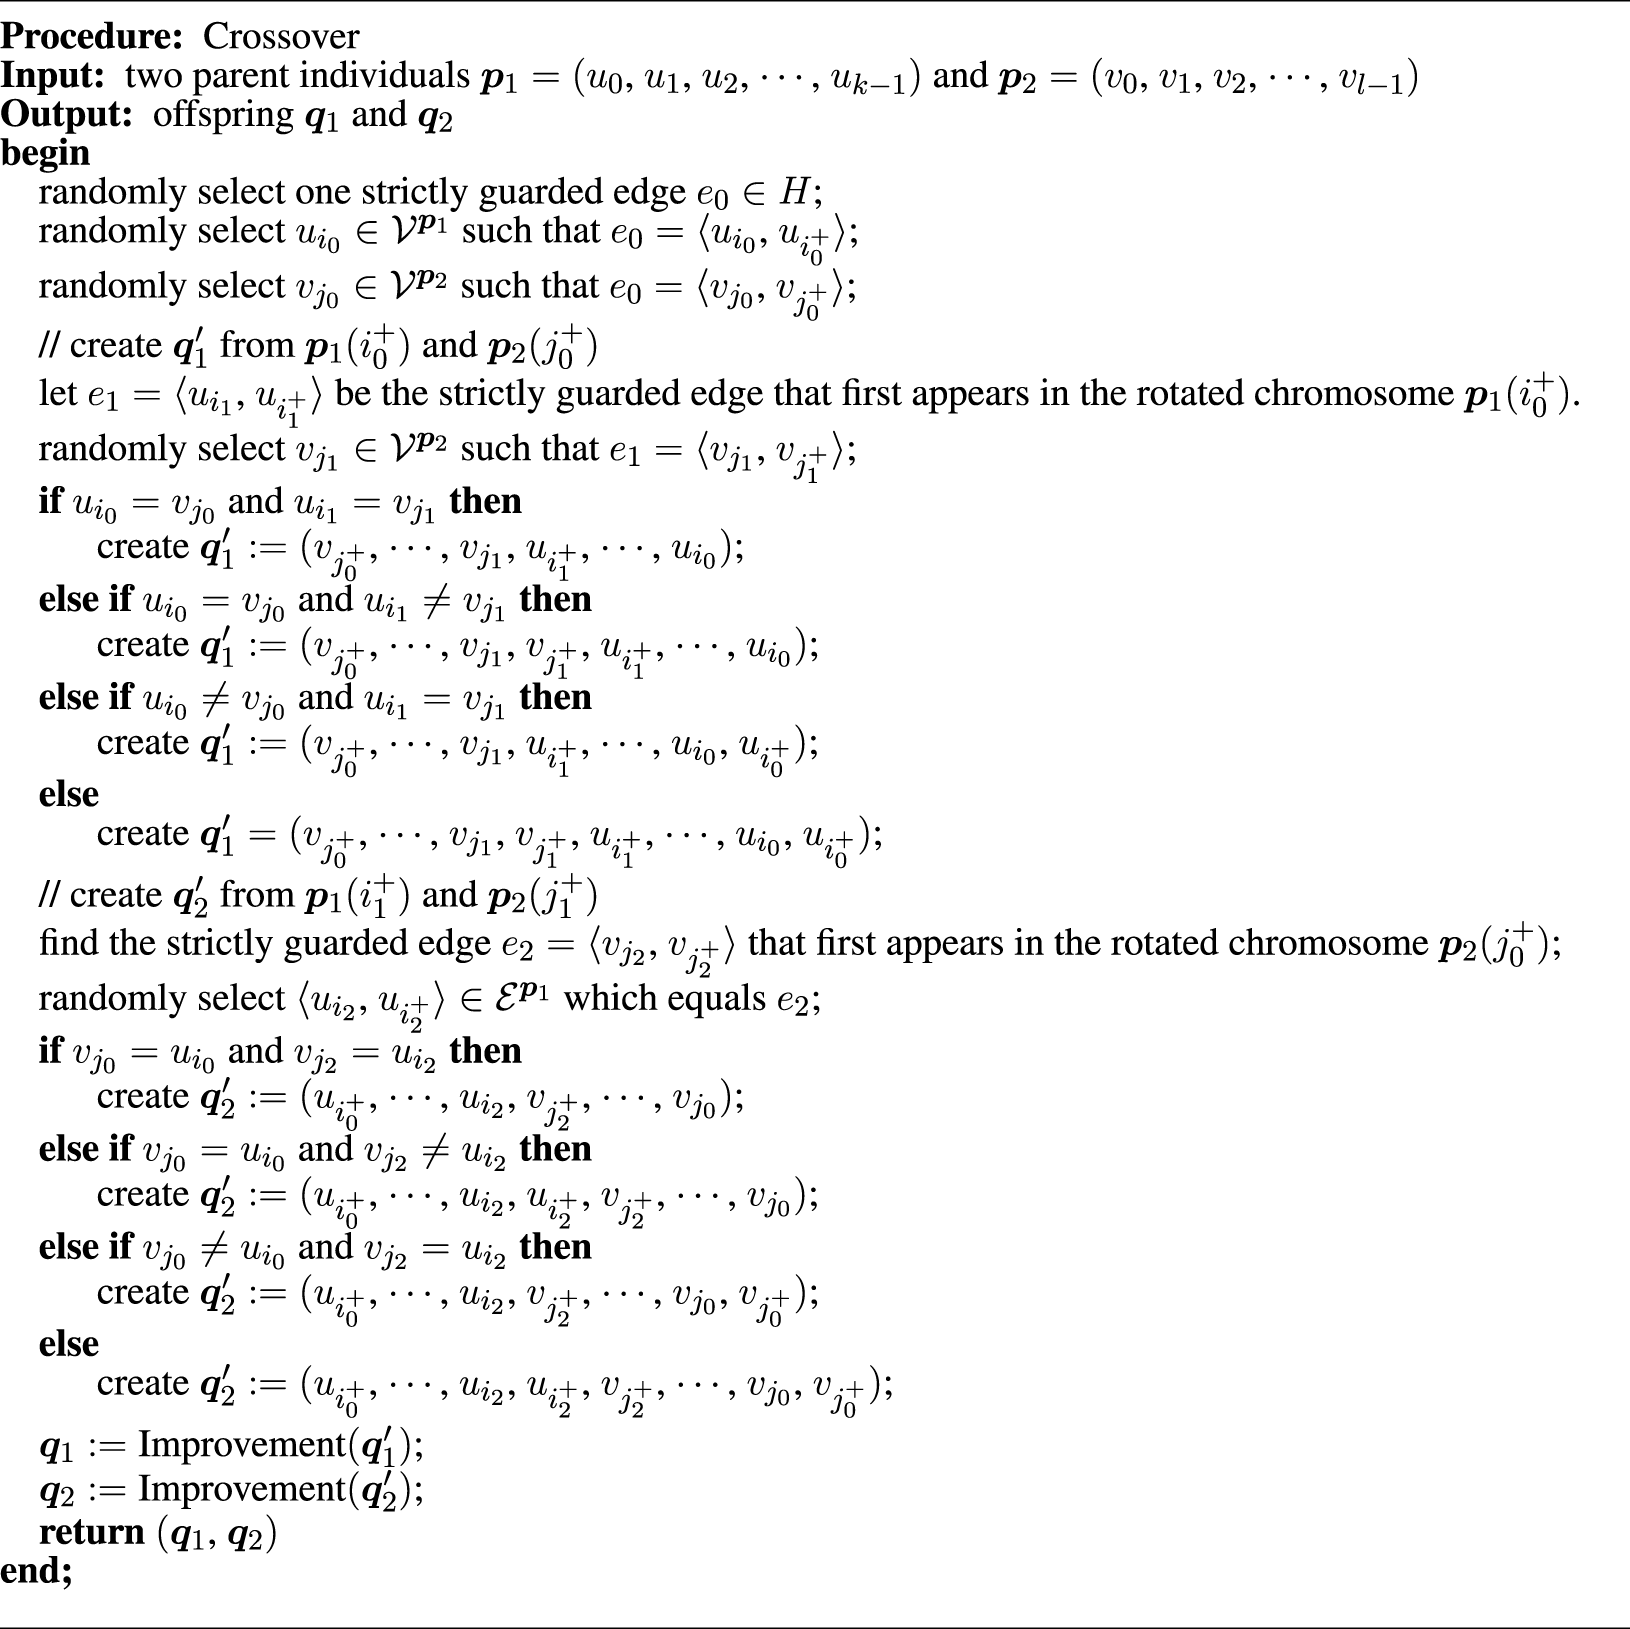
The pseudocode for the proposed crossover operation is presented in Figure 8.
FIGURE 8
Pseudocode for crossover operation.
4.5 Mutation
In the crossover operation, the walk of parent individuals tends to be inherited by their offspring. Therefore, it is seldom that generated offspring will traverse vertices or edges that their parents do not. To maintain the diversity of the population, we introduce a mutation operation (Figure 9).
FIGURE 9
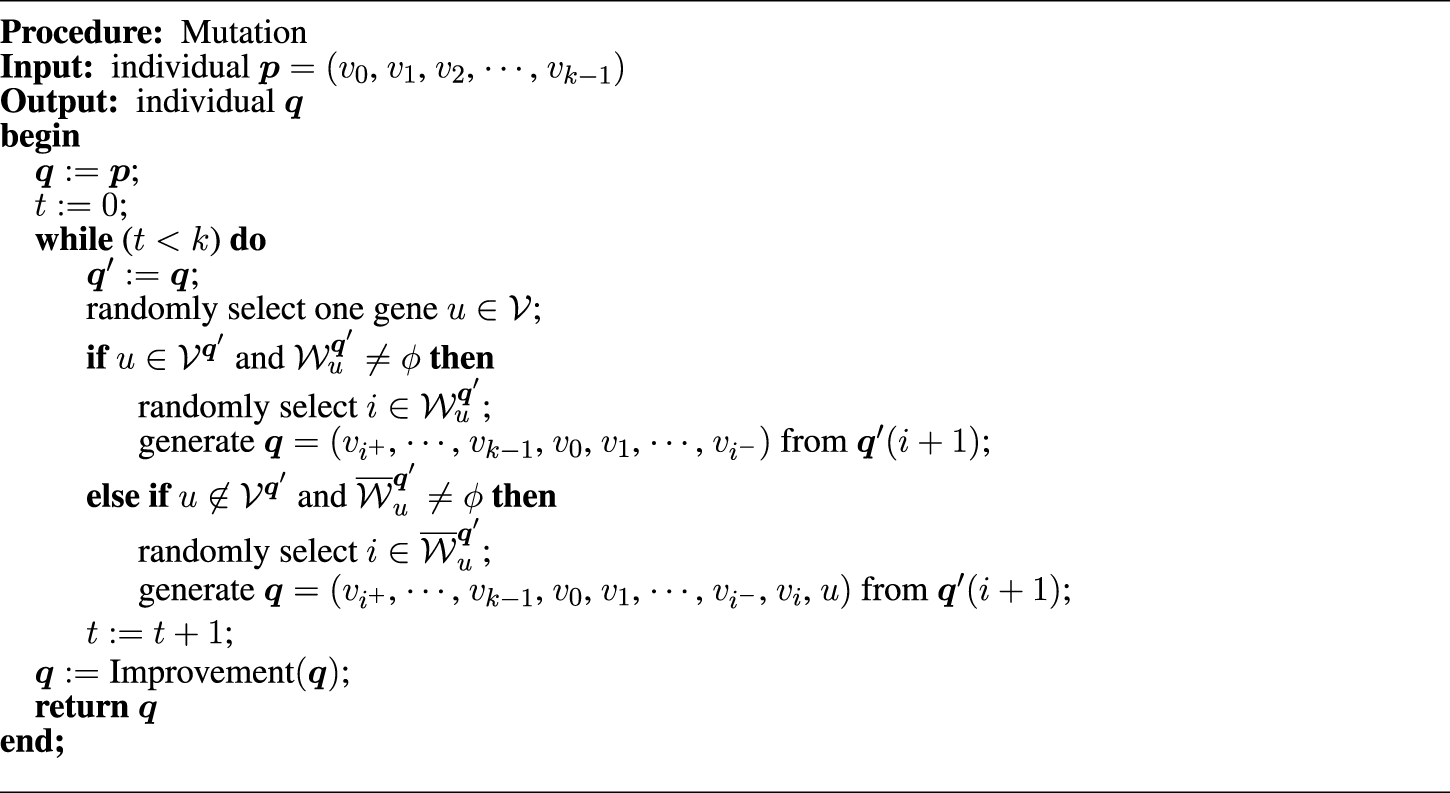
Pseudocode for mutation operation.
In this operation, the following steps are executed repeatedly: randomly select a gene (vertex)
and
1. if gene exists on the patrolling route corresponding to the chromosome, select one locus such that , and if there exists an edge connecting vertices and before and after , remove gene from the chromosome (see Figure 10a).
2. if gene does not exist on the patrolling route corresponding to the chromosome and succsessive genes and exist on the route such that both and are in , insert gene between and (see Figure 10b).
FIGURE 10
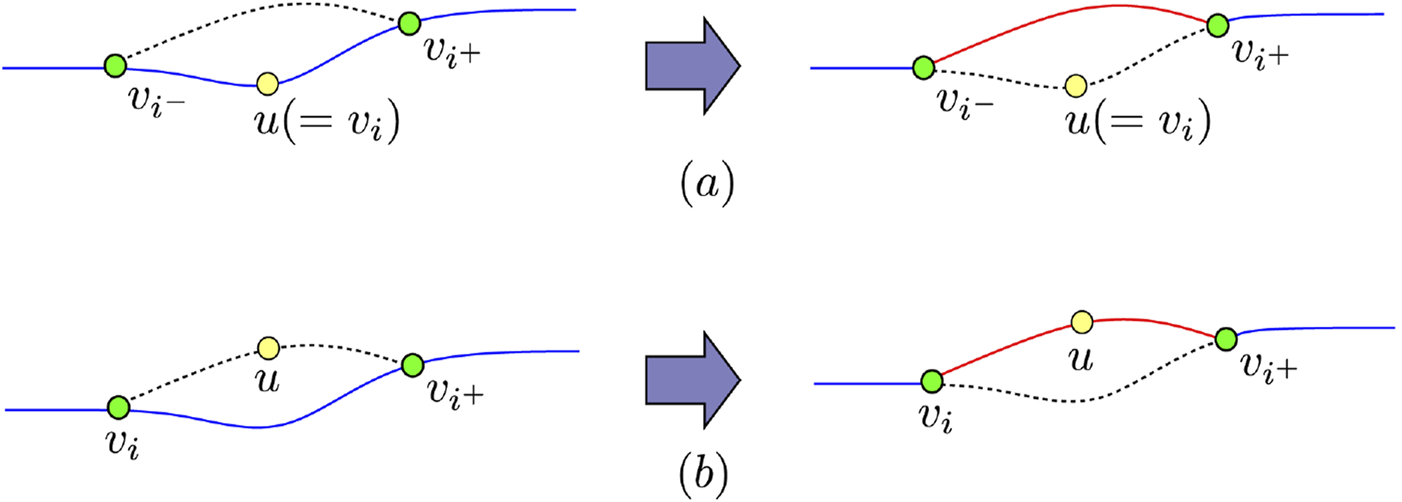
Mutation operation in which a vertex is selected. (a) the case that is on the patrolling route and there exists an edge connecting vertices before and after ; (b) the case that is not on the route and there exist edges and for some vertex on the route.
4.6 Local search strategy based on the Jaya algorithm
The crossover operation introduced in Section 4.4 is an order-based operation in which the orders of traversing the high-security edges of parents and other edges are inherited by offspring. To compensate for the ability to converge the solutions of this crossover, we introduce an improvement strategy that moves dominated solutions closer to a Pareto-optimal solution by combining the strategy used in the mutation operation with the Jaya algorithm.
As mention in Section 2, if the triangle inequality holds, removing a vertex from the patrolling route tends to reduce the noncovered ratio since edges may be no longer guarded by visual confirmation from , although the total length of the patrolling route becomes shorter. Conversely, adding a vertex that is not on the patrolling route increases the total length; however, this is expected to improve the noncovered ratio because edges guarded by visual confirmation may increase.
The approach we propose here (called the improved Jaya algorithm below) modifies a given individual to move closer to the best solution and away from the worst solution based on the best and worst candidates in the population. The outline of the proposed strategy is presented in
Figure 11. Let
and
be the best and worst chromosomes in the current population, respectively, and let
and
be the patrolling routes corresponding to
and
, respectively. Let
be a sufficiently small positive real number. By putting
,
,
,
, the coordinates of
and
are
and
, respectively. Then, to modify a certain dominated solution
to be closer to
and away from
, a hypothetical solution
is computed based on the strategy of the improved Jaya algorithm. To move
closer to the hypothetical solution
, the mutation strategy is strategically repeated as follows: Let
and
, which are normalizations of
and
, respectively. If all edges are high-security edges, set
because
. The following operations are performed if the triangle inequality holds.
if , an operation is performed to move the first component of point closer to the first component of point . Specifically, if , vertices are removed from the patrolling route to reduce the total distance; if , vertices are added not on the patrolling route increase the total distance.
If , an operation is performed to move the second component of point closer to the second component of point . Specifically, if , vertices are removed from the patrolling route to reduce the noncovered ratio; if , vertices are added not on the patrolling route to increase the noncovered ratio.
FIGURE 11
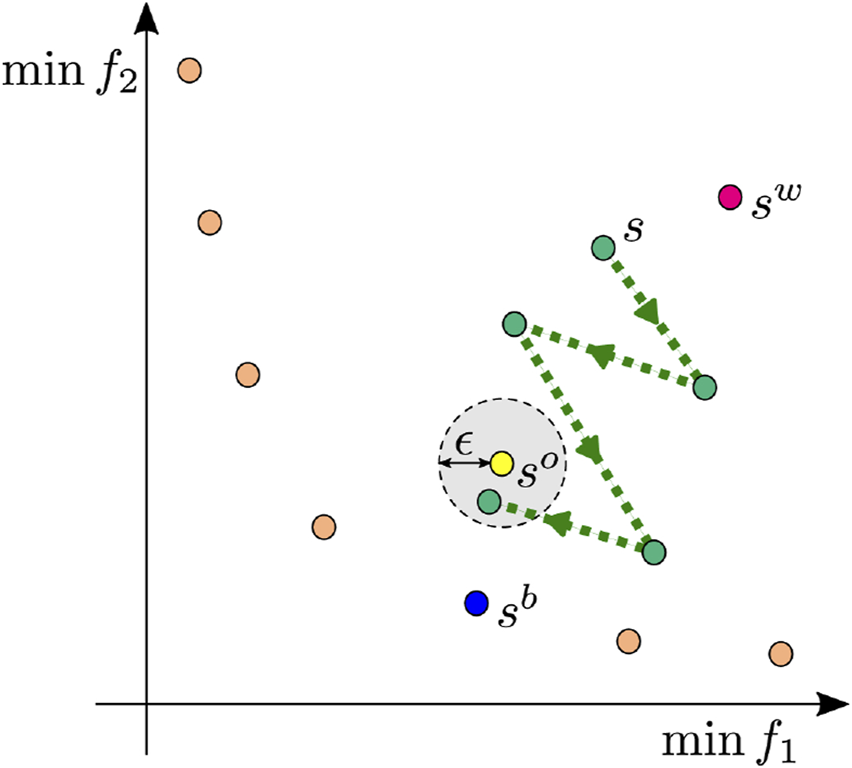
Behavior of the improved Jaya algorithm in the criterion space.
Remark that is a hypothetical solution that does not always exist; thus, the operation is repeated until approaching the neighborhood of (inside a circle of radius centered on ), or the operation is repeated until the terminal condition is reached. The pseudocode for the improved Jaya algorithm is presented in Figure 12.
FIGURE 12
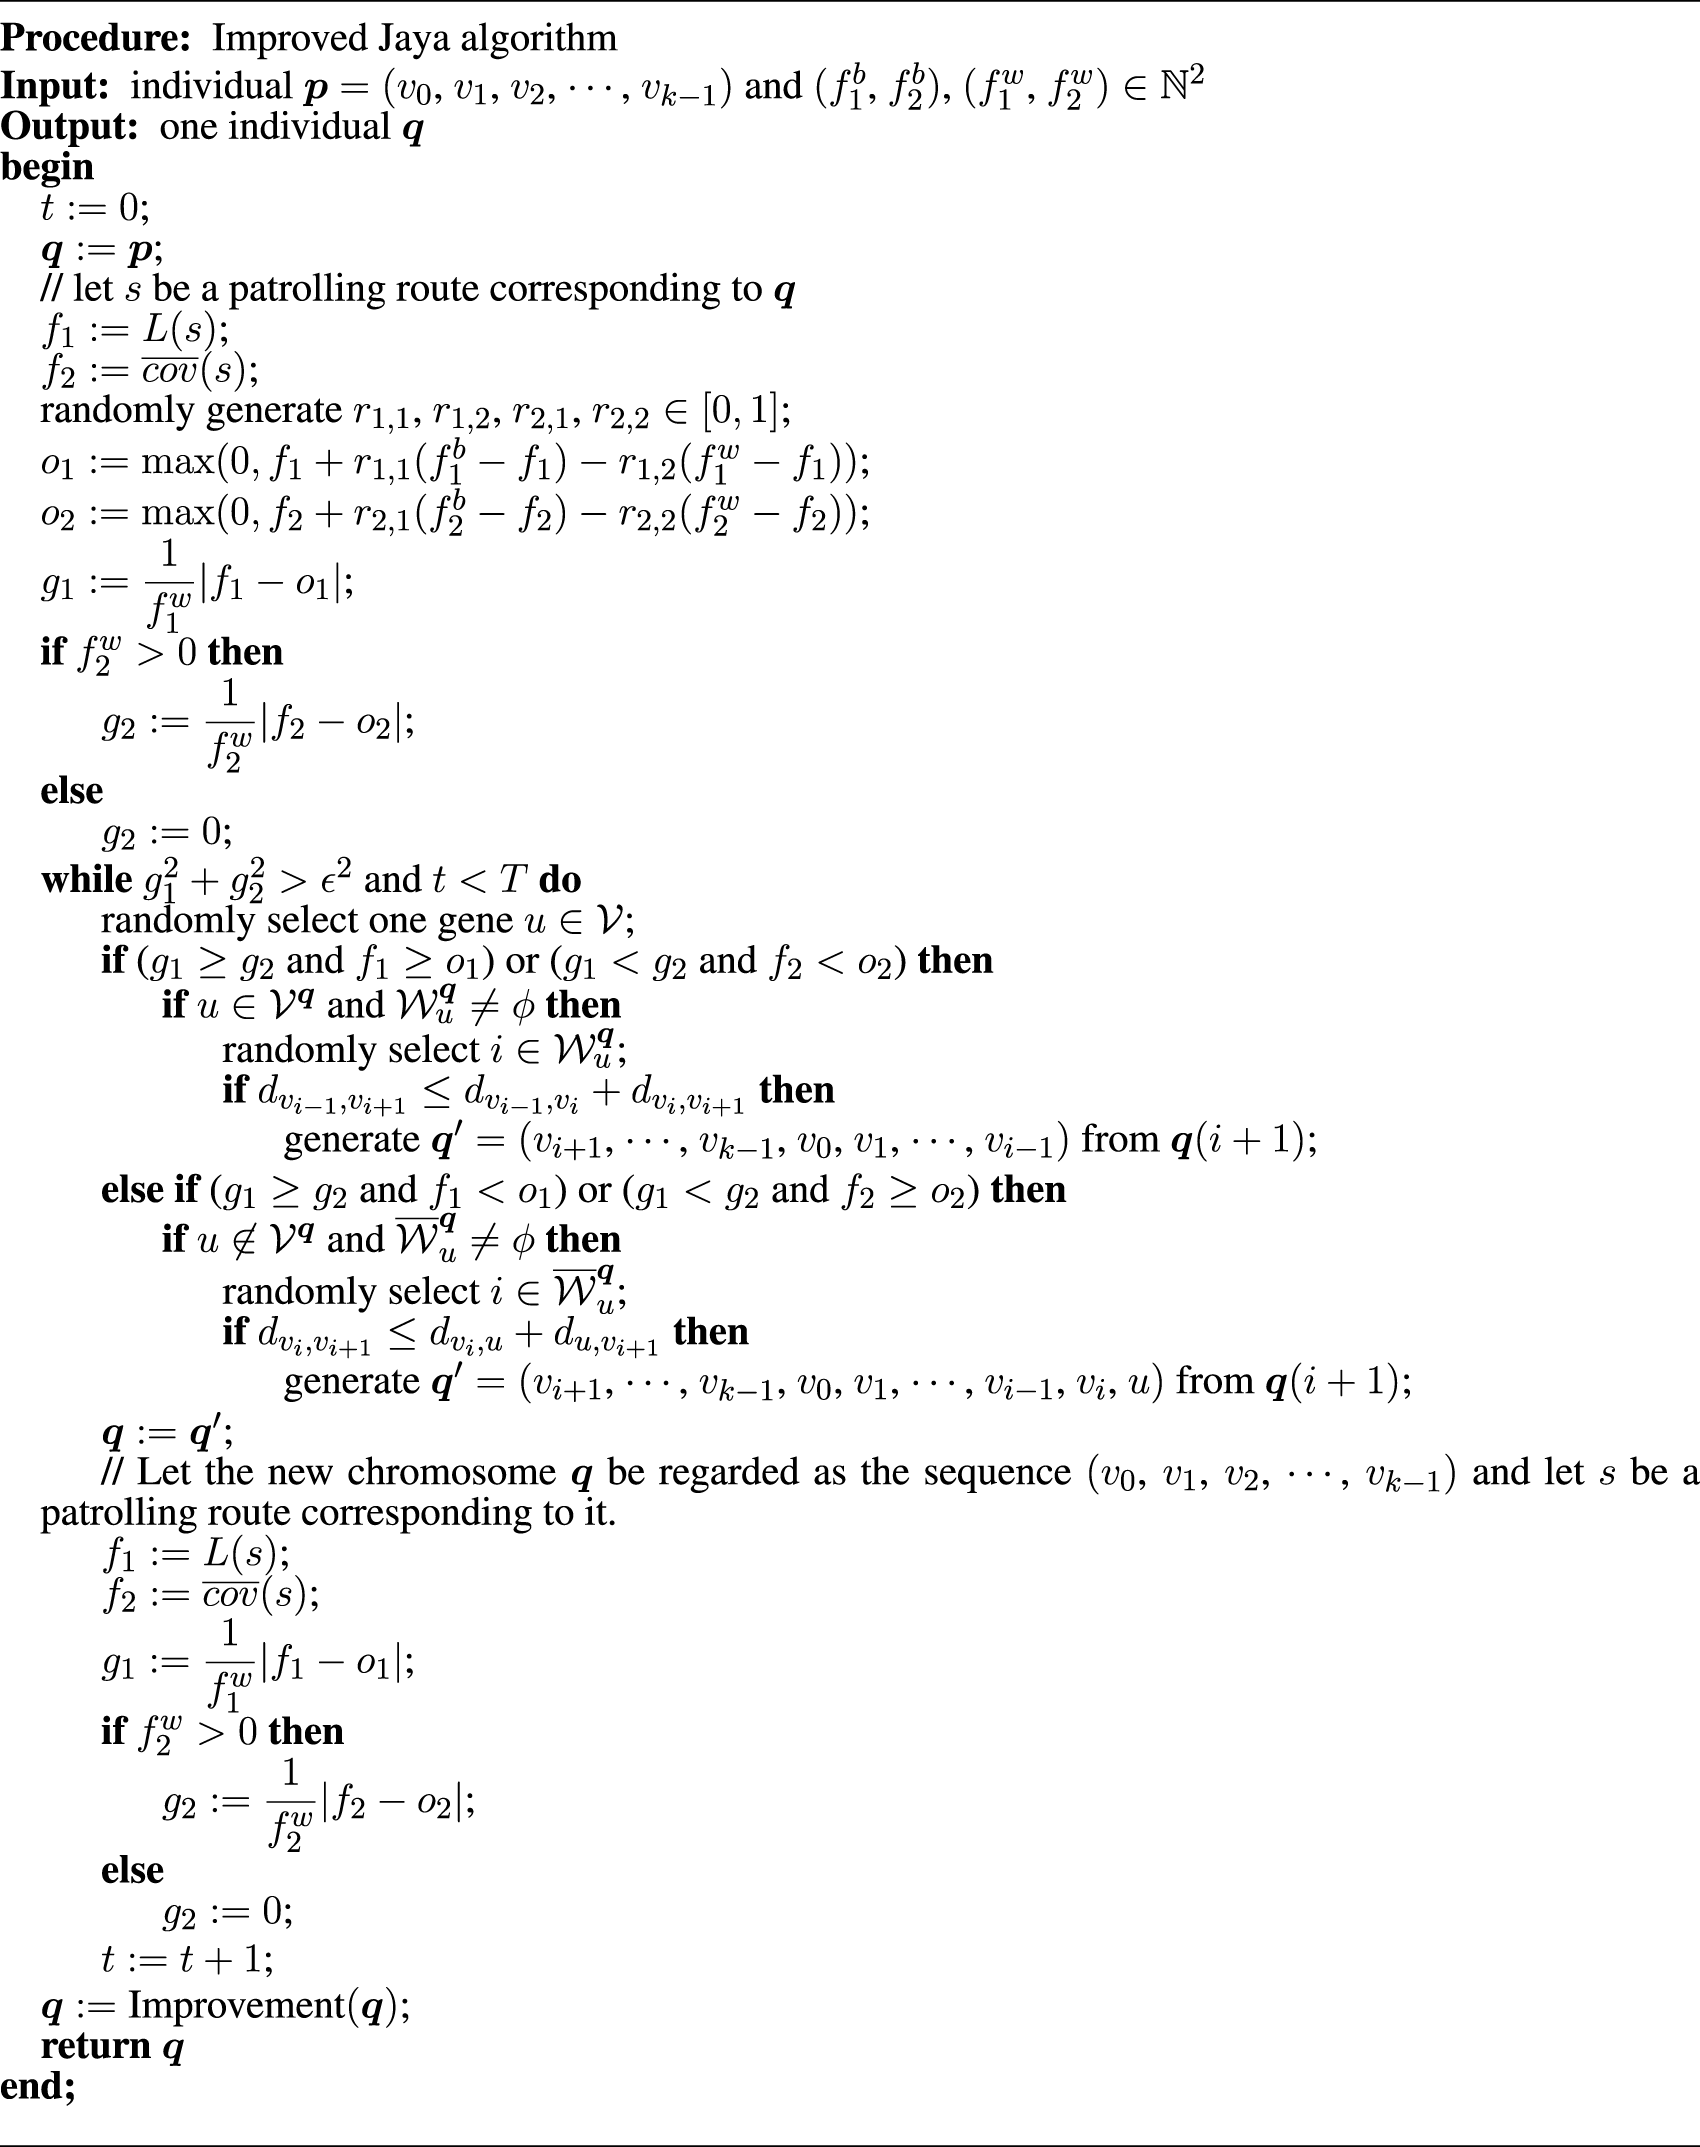
Pseudocode for the improved Jaya algorithm.
5 Numerical experiments
In this section, we report the results of numerical experiments conducted to verify the effectiveness of the proposed method (the hybrid strategy of MoEA-HSS and the improved Jaya algorithm) for the GPOPP. In these experiments, we compared the proposed method (called pMH) with the NSGA-II (called NSGA-II) proposed by Deb et al. (2002) and the original MoEA-HSS without the improved Jaya algorithm (called MoEA-HSS). All these methods incorporated the crossover and mutation operations proposed in this paper.
Evaluating the performance of multi-objective optimization methods is not easy since it is difficult to compare the Pareto-optimal solutions (also called the nondominated solutions) obtained by different methods. We compared pMH with NSGA-II and MoEA-HSS using three representative comparison methods. Let be the number of numerical experiments for each method. Let , and be the Pareto-optimal solution sets of NSGA-II, MoEA-HSS and pMH obtained by the -th experiment, respectively. The reference solution set is defined as the set of nondominated solutions in the union of all Pareto-optimal solution sets .
The three evaluation criteria we used are as follows:
1. Number of nondominated solutions. For each method {NSGA-II, MoEA-HSS, pMH}, is the number of nondominated solutions obtained by the -th experiment for . In general, the selection of the final solution is left to human judgment; thus, the number of Pareto-optimal solutions is an important evaluation criterion.
2. Generational distance. For the nondominated solution set obtained by each method {NSGA-II, MoEA-HSS, pMH} and the reference solution set , the generational distance is defined as follows (Van Veldhuizen, 1999; Ishibuchi et al., 2015):
where
and
denotes the Euclidean distance between a solution
in
and a reference solution
in
. A smaller
value implies that
is closer to
.
3. Coverage of two sets. For two , where , the coverage is defined as follows (Zitzler and Thiele, 1999):
where
means that
holds for any objective function
. The value
is in the interval [0,1], with values approaching 1 indicating that a greater number of solutions in
are covered by those in
.
The benchmark problems used in the experiments were created based on the Mixed Rural Postman Problem (MRPP) benchmark problems RB422 (, , ), RB452 (, , ), RB472 (, , ), RB522 (, , ), RB552 (, , ) and RB572 (, , ) shown in Arc Routing Problems: Data Instances (https://www.uv.es/corberan/instancias.htm). The number of high-security edges (called required edges) defined in the MRPP benchmark problems is sufficiently large. Therefore, they are not suitable for use as benchmarks for methods against the GPOPP in which visual confirmation is allowed. To confirm the effect of visual confirmation, in these experiments, we changed the required edges of each benchmark problem to non-required edges, creating four patterns of benchmark problems with 10, 20, 30, and 40 high-security edges. We used these edges in the experiments. In addition, the ratio of the number of high-security undirected edges to high-security arcs was set to .
The experiments were conducted on a PC with Windows 11, an AMD Ryzen 5 3500 CPU, 3.59 GHz, and 16.0 GB RAM. We conducted preliminary experiments using the benchmark problem RB422_10 with eight high-security undirected edges and two high-security arcs. The parameters were set as follows: the positive constant
, the archive size
, the initial population size
,
,
, the terminating condition for the improved Jaya algorithm
, the radius
of a circle centered on the hypothetical solution
and the maximum generations
. When using the improved Jaya algorithm in pMH, the best solution
is selected from the nondominated solution set
. If many nondominated solutions in
are concentrated in close proximity, the probability that
will be selected from among these concentrated individuals increases. Consequently, the individuals generated by the improved Jaya algorithm also tend to move in the direction of the concentrated population. To distribute the location of the individuals generated by the improved Jaya algorithm to some extent,
was selected as follows: Let
and
. Then
1. If , then let .
2. If , then partition into subsets , , , , which satisfy the following conditions:
,
(, , ),
(), ().
For each ,
3. Randomly select one subset from the subsets, randomly select one solution from , and put .
We ran 10 numerical experiments for each method (that is, ). Comparison results of pMH with NSGA-II and MoEA-HSS at 10, 50, 150 and 300 generations are shown in Table 1. The number of nondominated solutions, generational distance and CPU time are shown in (a) and these are the maximum, minimum, average and standard deviation obtained by 10 experiments. Here, the for each generation is calculated using the Pareto-optimal solution sets at the -th generation and the reference solution set at the 300th generation. The comparison results for the coverage are shown in (b) and these are calculated by 100 values of . The evolution of the Pareto-optimal solution set at the 1st experiment for each method is shown in Figure 13.
TABLE 1
| (a) The number of nondominated solutions, generational distance and CPU time | ||||||||||
|---|---|---|---|---|---|---|---|---|---|---|
| Gen | Method | CPU time [sec] | ||||||||
| min | max | ave | std | min | max | ave | std | Ave | ||
| 10 | NSGA-II | |||||||||
| MoEA-HSS | ||||||||||
| pMH | ||||||||||
| 50 | NSGA-II | |||||||||
| MoEA-HSS | ||||||||||
| pMH | ||||||||||
| 150 | NSGA-II | |||||||||
| MoEA-HSS | ||||||||||
| pMH | ||||||||||
| 300 | NSGA-II | |||||||||
| MoEA-HSS | ||||||||||
| pMH | ||||||||||
| (b) The coverage of two sets | ||||||||||||
|---|---|---|---|---|---|---|---|---|---|---|---|---|
| Gen | Methods | Methods | ||||||||||
| min | max | ave | std | min | max | ave | std | |||||
| 10 | pMH | NSGA-II | pMH | MoEA-HSS | ||||||||
| NSGA-II | pMH | MoEA-HSS | pMH | |||||||||
| 50 | pMH | NSGA-II | pMH | MoEA-HSS | ||||||||
| NSGA-II | pMH | MoEA-HSS | pMH | |||||||||
| 150 | pMH | NSGA-II | pMH | MoEA-HSS | ||||||||
| NSGA-II | pMH | MoEA-HSS | pMH | |||||||||
| 300 | pMH | NSGA-II | pMH | MoEA-HSS | ||||||||
| NSGA-II | pMH | MoEA-HSS | pMH | |||||||||
Comparison of pMH with NSGA-II and MoEA-HSS during evolution (benchmark problem: RB422_10).
FIGURE 13
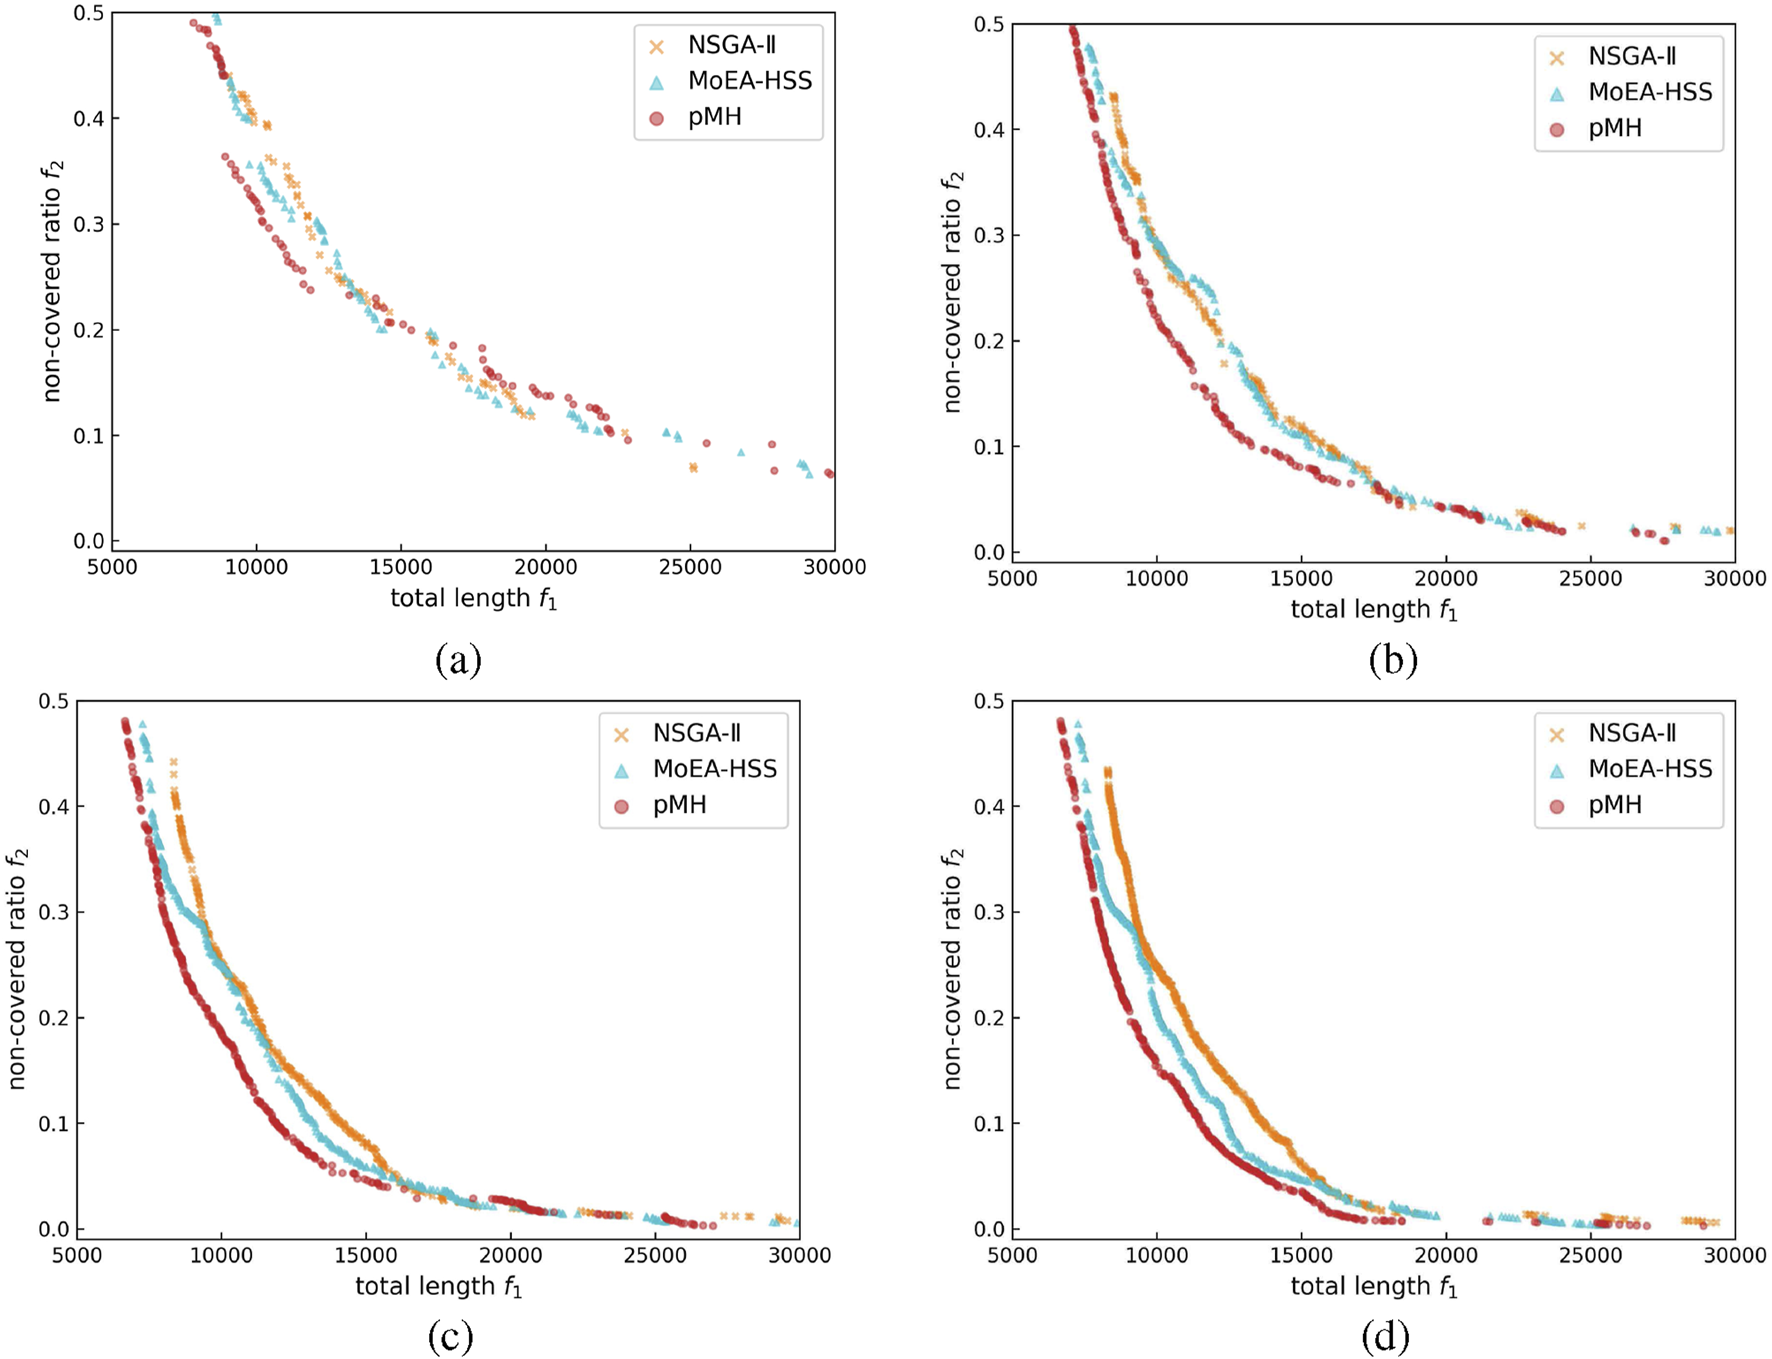
Evolution of nondominated solutions when executing NSGA-II, MoEA-HSS and pMH for RB422_10. (a) gen = 10 (b) gen = 50 (c) gen = 150 (d) gen = 300.
The number of nondominated solutions for NSGA-II and pMH are no significant difference, although the value for MoEA-HSS is slightly lower. If the Pareto-optimal solution set contains even a single solution that is far from , the generational distance will have a large value. Therefore, method cannot be considered inferior simply because the generational distance has a large value. On the other hand, when the minimum value of the generational distance is sufficiently small, method is considered superior because the nondominated solutions obtained by method are likely to be close to the solutions in the reference solution set . For these reasons, it is more appropriate to use the minimum value, rather than the average or maximum, when conducting evaluations with the generational distance. Therefore, from these experimental results, in evaluations based on the number of nondominated solutions and the generational distance, pMH can be considered superior to other methods. In particular, the comparison between MoEA-HSS and pMH based on these criteria implies that the ability of local search for the improved Jaya algorithm has achieved the expected results.
The coverage is the rate that solutions in are covered by solutions in . Hence, if the average of is higher than the average of , can be considered as better than under this criterion. Therefore, by comparing the average of two coverages and ({NSGA-II, MoEA-HSS}), the Pareto-optimal solution set is considered statistically superior to obtained by other methods at every generations.
The experiment results of comparing pMH with NSGA-II and MoEA-HSS when we ran each method until 300 generations for all benchmark problems are shown in Tables 2, 3.
TABLE 2
| Problem | Method | CPU time [sec] | ||||||||
|---|---|---|---|---|---|---|---|---|---|---|
| min | max | ave | std | min | max | ave | std | Ave | ||
| RB422_10 | NSGA-II | |||||||||
| MoEA-HSS | ||||||||||
| pMH | ||||||||||
| RB422_20 | NSGA-II | |||||||||
| MoEA-HSS | ||||||||||
| pMH | ||||||||||
| RB422_30 | NSGA-II | |||||||||
| MoEA-HSS | ||||||||||
| pMH | ||||||||||
| RB422_40 | NSGA-II | |||||||||
| MoEA-HSS | ||||||||||
| pMH | ||||||||||
| RB452_10 | NSGA-II | |||||||||
| MoEA-HSS | ||||||||||
| pMH | ||||||||||
| RB452_20 | NSGA-II | |||||||||
| MoEA-HSS | ||||||||||
| pMH | ||||||||||
| RB452_30 | NSGA-II | |||||||||
| MoEA-HSS | ||||||||||
| pMH | ||||||||||
| RB452_40 | NSGA-II | |||||||||
| MoEA-HSS | ||||||||||
| pMH | ||||||||||
| RB472_10 | NSGA-II | |||||||||
| MoEA-HSS | ||||||||||
| pMH | ||||||||||
| RB472_20 | NSGA-II | |||||||||
| MoEA-HSS | ||||||||||
| pMH | ||||||||||
| RB472_30 | NSGA-II | |||||||||
| MoEA-HSS | ||||||||||
| pMH | ||||||||||
| RB472_40 | NSGA-II | |||||||||
| MoEA-HSS | ||||||||||
| pMH | ||||||||||
| RB522_10 | NSGA-II | |||||||||
| MoEA-HSS | ||||||||||
| pMH | ||||||||||
| RB522_20 | NSGA-II | |||||||||
| MoEA-HSS | ||||||||||
| pMH | ||||||||||
| RB522_30 | NSGA-II | |||||||||
| MoEA-HSS | ||||||||||
| pMH | ||||||||||
| RB522_40 | NSGA-II | |||||||||
| MoEA-HSS | ||||||||||
| pMH | ||||||||||
| RB552_10 | NSGA-II | |||||||||
| MoEA-HSS | ||||||||||
| pMH | ||||||||||
| RB552_20 | NSGA-II | |||||||||
| MoEA-HSS | ||||||||||
| pMH | ||||||||||
| RB552_30 | NSGA-II | |||||||||
| MoEA-HSS | ||||||||||
| pMH | ||||||||||
| RB552_40 | NSGA-II | |||||||||
| MoEA-HSS | ||||||||||
| pMH | ||||||||||
| RB572_10 | NSGA-II | |||||||||
| MoEA-HSS | ||||||||||
| pMH | ||||||||||
| RB572_20 | NSGA-II | |||||||||
| MoEA-HSS | ||||||||||
| pMH | ||||||||||
| RB572_30 | NSGA-II | |||||||||
| MoEA-HSS | ||||||||||
| pMH | ||||||||||
| RB572_40 | NSGA-II | |||||||||
| MoEA-HSS | ||||||||||
| pMH | ||||||||||
Comparison of pMH with NSGA-II and MoEA-HSS by the number of nondominated solutions, generational distance and CPU time .
TABLE 3
| Problem | Methods | Methods | ||||||||||
|---|---|---|---|---|---|---|---|---|---|---|---|---|
| min | max | ave | std | min | max | ave | std | |||||
| RB422_10 | pMH | NSGA-II | pMH | MoEA-HSS | ||||||||
| NSGA-II | pMH | MoEA-HSS | pMH | |||||||||
| RB422_20 | pMH | NSGA-II | pMH | MoEA-HSS | ||||||||
| NSGA-II | pMH | MoEA-HSS | pMH | |||||||||
| RB422_30 | pMH | NSGA-II | pMH | MoEA-HSS | ||||||||
| NSGA-II | pMH | MoEA-HSS | pMH | |||||||||
| RB422_40 | pMH | NSGA-II | pMH | MoEA-HSS | ||||||||
| NSGA-II | pMH | MoEA-HSS | pMH | |||||||||
| RB452_10 | pMH | NSGA-II | pMH | MoEA-HSS | ||||||||
| NSGA-II | pMH | MoEA-HSS | pMH | |||||||||
| RB452_20 | pMH | NSGA-II | pMH | MoEA-HSS | ||||||||
| NSGA-II | pMH | MoEA-HSS | pMH | |||||||||
| RB452_30 | pMH | NSGA-II | pMH | MoEA-HSS | ||||||||
| NSGA-II | pMH | MoEA-HSS | pMH | |||||||||
| RB452_40 | pMH | NSGA-II | pMH | MoEA-HSS | ||||||||
| NSGA-II | pMH | MoEA-HSS | pMH | |||||||||
| RB472_10 | pMH | NSGA-II | pMH | MoEA-HSS | ||||||||
| NSGA-II | pMH | MoEA-HSS | pMH | |||||||||
| RB472_20 | pMH | NSGA-II | pMH | MoEA-HSS | ||||||||
| NSGA-II | pMH | MoEA-HSS | pMH | |||||||||
| RB472_30 | pMH | NSGA-II | pMH | MoEA-HSS | ||||||||
| NSGA-II | pMH | MoEA-HSS | pMH | |||||||||
| RB472_40 | pMH | NSGA-II | pMH | MoEA-HSS | ||||||||
| NSGA-II | pMH | MoEA-HSS | pMH | |||||||||
| RB522_10 | pMH | NSGA-II | pMH | MoEA-HSS | ||||||||
| NSGA-II | pMH | MoEA-HSS | pMH | |||||||||
| RB522_20 | pMH | NSGA-II | pMH | MoEA-HSS | ||||||||
| NSGA-II | pMH | MoEA-HSS | pMH | |||||||||
| RB522_30 | pMH | NSGA-II | pMH | MoEA-HSS | ||||||||
| NSGA-II | pMH | MoEA-HSS | pMH | |||||||||
| RB522_40 | pMH | NSGA-II | pMH | MoEA-HSS | ||||||||
| NSGA-II | pMH | MoEA-HSS | pMH | |||||||||
| RB552_10 | pMH | NSGA-II | pMH | MoEA-HSS | ||||||||
| NSGA-II | pMH | MoEA-HSS | pMH | |||||||||
| RB552_20 | pMH | NSGA-II | pMH | MoEA-HSS | ||||||||
| NSGA-II | pMH | MoEA-HSS | pMH | |||||||||
| RB552_30 | pMH | NSGA-II | pMH | MoEA-HSS | ||||||||
| NSGA-II | pMH | MoEA-HSS | pMH | |||||||||
| RB552_40 | pMH | NSGA-II | pMH | MoEA-HSS | ||||||||
| NSGA-II | pMH | MoEA-HSS | pMH | |||||||||
| RB572_10 | pMH | NSGA-II | pMH | MoEA-HSS | ||||||||
| NSGA-II | pMH | MoEA-HSS | pMH | |||||||||
| RB572_20 | pMH | NSGA-II | pMH | MoEA-HSS | ||||||||
| NSGA-II | pMH | MoEA-HSS | pMH | |||||||||
| RB572_30 | pMH | NSGA-II | pMH | MoEA-HSS | ||||||||
| NSGA-II | pMH | MoEA-HSS | pMH | |||||||||
| RB572_40 | pMH | NSGA-II | pMH | MoEA-HSS | ||||||||
| NSGA-II | pMH | MoEA-HSS | pMH | |||||||||
Comparison of pMH with NSGA-II and MoEA-HSS by the coverage .
Our method pMH achieved better results than other methods in all benchmark problems with respect to the generational distance and the coverage of two sets, although pMH and NSGA-II are evenly-matched at the criterion the number of nondominated solutions. Here, even if pMH is inferior to that of other methods at the criteria the number of nondominated solutions, since it is considered that the ratio of solutions in covered by solutions in is high, is not necessarily inferior to or . Based on these numerical experiments, we confirmed that the local search based on the improved Jaya algorithm is effective and that pMH can generate superior Pareto-optimal solutions.
6 Conclusion
In this study, we defined a new arc routing bi-objective optimization problem (GPOPP) that models the patrol security of police officers (or security guards) based on the POPP and proposed a hybrid heuristic approach for the GPOPP. The proposed method combines the hybrid sampling strategy MoEA-HSS, which combines sampling strategies based on the VEGA and PDDR-FF, with a solution improvement strategy based on the improved Jaya algorithm. The solutions of the MoEA-HSS approach to the true Pareto differ in various directions because the VEGA-based sampling strategy has a preference for the edge region of the Pareto front and the PDDR-FF-based sampling strategy tends to converge toward the center area of the Pareto front. The proposed method (pMH) improves convergence by combining the MoEA-HSS with the improved Jaya algorithm-based local search method. The numerical experimental results demonstrate that the proposed method can obtain better solutions than the NSGA-II and the MoEA-HSS. The remaining challenge for us is to improve efficiency by reducing CPU time while maintaining high solution quality. In addition, extending GPOPP model will enable us to more accurately replicate the complex challenges of real-world urban policing. One extension would be to model situations where multiple officers work together, and we consider to adapt our method to address such extended problems.
Statements
Data availability statement
The raw data supporting the conclusions of this article will be made available by the authors, without undue reservation.
Author contributions
FK: Writing – review and editing, Writing – original draft. HT: Writing – original draft, Writing – review and editing. MT: Writing – original draft, Writing – review and editing.
Funding
The author(s) declare that financial support was received for the research and/or publication of this article. This work was supported by research funding provided by the Maebashi Institute of Technology, Japan.
Conflict of interest
The authors declare that the research was conducted in the absence of any commercial or financial relationships that could be construed as a potential conflict of interest.
Generative AI statement
The author(s) declare that no Generative AI was used in the creation of this manuscript.
Publisher’s note
All claims expressed in this article are solely those of the authors and do not necessarily represent those of their affiliated organizations, or those of the publisher, the editors and the reviewers. Any product that may be evaluated in this article, or claim that may be made by its manufacturer, is not guaranteed or endorsed by the publisher.
References
1
Aiello G. La Scalia G. Enea M. (2012). A multi objective genetic algorithm for the facility layout problem based upon slicing structure encoding. Expert Syst. Appl.39, 10352–10358. 10.1016/j.eswa.2012.01.125
2
Akyurt İ. Z. Keskinturk T. Kalkancı Ç. (2015). Using genetic algorithm for winter maintenance operations: multi depot K-Chinese postman problem. EMAJ Emerg. Mark. J.5, 50–59. 10.5195/emaj.2015.69
3
Chainey S. P. Matias J. A. Nunes Junior F. C. F. Coelho da Silva T. L. de Macêdo J. A. F. Magalhães R. P. et al (2021). Improving the creation of hot spot policing patrol routes: comparing cognitive heuristic performance to an automated spatial computation approach. ISPRS Int. J. Geo-Information10, 560. 10.3390/ijgi10080560
4
Dantzig G. B. Ramser J. H. (1959). The truck dispatching problem. Manag. Sci.6, 80–91. 10.1287/mnsc.6.1.80
5
Deb K. Pratap A. Agarwal S. Meyarivan T. (2002). A fast and elitist multiobjective genetic algorithm: NSGA-II. IEEE Trans. Evol. Comput.6, 182–197. 10.1109/4235.996017
6
Dewinter M. Vandeviver C. Vander Beken T. Witlox F. (2020). Analysing the police patrol routing problem: a review. ISPRS Int. J. Geo-Information9, 157. 10.3390/ijgi9030157
7
Edmonds J. Johnson E. (1973). Matching, euler tours and the chinese postman. Math. Program.5, 88–124. 10.1007/bf01580113
8
Elatar S. Abouelmehdi K. Riffi M. E. (2023). The vehicle routing problem in the last decade: variants, taxonomy and metaheuristics. Procedia Comput. Sci.220, 398–404. 10.1016/j.procs.2023.03.051
9
Ghoseiri K. Ghannadpour S. F. (2010). Multi-objective vehicle routing problem with time windows using goal programming and genetic algorithm. Appl. Soft Comput.10, 1096–1107. 10.1016/j.asoc.2010.04.001
10
Gil-Gala F. J. Afsar S. Durasevic M. Palacios J. J. Afsar M. (2023). “Genetic programming for the vehicle routing problem with zone-based pricing,” in Proceedings of the genetic and evolutionary computation conference, 1118–1126. 10.1145/3583131.3590366
11
Ishibuchi H. Masuda H. Tanigaki Y. Nojima Y. (2015). “Modified distance calculation in generational distance and inverted generational distance,” in Evolutionary multi-criterion optimization: 8Th international conference, EMO 2015, guimarães, Portugal, march 29–April 1, 2015. Proceedings, part II 8 (Springer), 110–125.
12
Kim D. Kan Y. Aum Y. Lee W. Yi G. (2023). Hotspots-based patrol route optimization algorithm for smart policing. Heliyon9, e20931. 10.1016/j.heliyon.2023.e20931
13
Lenstra J. K. Kan A. H. G. R. (1976). On general routing problems. Networks6, 273–280. 10.1002/net.3230060305
14
Lenstra J. K. Kan A. H. G. R. (1981). Complexity of vehicle routing and scheduling problems. Networks11, 221–227. 10.1002/net.3230110211
15
Lu Z. Whalen I. Boddeti V. Dhebar Y. Deb K. Goodman E. et al (2019). “NSGA-Net: neural architecture search using multi-objective genetic algorithm,” in Proceedings of the genetic and evolutionary computation conference, 419–427. 10.1145/3321707.3321729
16
Mei-Ko K. (1962). Graphic programming using odd or Even points. Chin. Math.1, 237–277.
17
Papadimitriou C. H. (1976). On the complexity of edge traversing. J. ACM (JACM)23, 544–554. 10.1145/321958.321974
18
Pizzuti C. (2009). “A multi-objective genetic algorithm for community detection in networks,” in 2009 21st IEEE international conference on tools with artificial intelligence (IEEE), 379–386.
19
Quiza Sardiñas R. Rivas Santana M. Alfonso Brindis E. (2006). Genetic algorithm-based multi-objective optimization of cutting parameters in turning processes. Eng. Appl. Artif. Intell.19, 127–133. 10.1016/j.engappai.2005.06.007
20
Samanta S. Sen G. Ghosh S. K. (2022). A literature review on police patrolling problems. Ann. Operations Res.316, 1063–1106. 10.1007/s10479-021-04167-0
21
Schaffer J. D. (2014). “Multiple objective optimization with vector evaluated genetic algorithms,” in Proceedings of the first international conference on genetic algorithms and their applications, 93–100.
22
Sgarro G. A. Grilli L. (2024). Ant colony optimization for Chinese postman problem. Neural Comput. Appl.36, 2901–2920. 10.1007/s00521-023-09195-4
23
Tang J. He L. Cao Y. Bai H. (2024). Critical-edge based tabu search algorithm for solving large-scale multi-vehicle Chinese postman problem. Sci. Rep.14, 12437. 10.1038/s41598-024-62992-2
24
Tohyama H. Tomisawa M. (2022). Complexity of the police officer patrol problem. J. Inf. Process.30, 307–314. 10.2197/ipsjjip.30.307
25
Tomisawa M. Tohyama H. (2024). Computational complexity of the police officer patrol problem on weighted digraphs. Electron. J. Graph Theory Appl.12, 297–313. 10.5614/ejgta.2024.12.2.10
26
Van Veldhuizen D. A. (1999). Multiobjective evolutionary algorithms: classifications, analyses, and new innovations. Air Force Institute of Technology, 6–15.
27
Venkata Rao R. (2016). Jaya: a simple and new optimization algorithm for solving constrained and unconstrained optimization problems. Int. J. Industrial Eng. Comput.7, 19–34. 10.5267/j.ijiec.2015.8.004
28
Yu W. Li B. Jia H. Zhang M. Wang D. (2015). Application of multi-objective genetic algorithm to optimize energy efficiency and thermal comfort in building design. Energy Build.88, 135–143. 10.1016/j.enbuild.2014.11.063
29
Zhang W. Gen M. Jo J. (2014). Hybrid sampling strategy-based multiobjective evolutionary algorithm for process planning and scheduling problem. J. Intelligent Manuf.25, 881–897. 10.1007/s10845-013-0814-2
30
Zitzler E. Thiele L. (1999). Multiobjective evolutionary algorithms: a comparative case study and the strength pareto approach. IEEE Trans. Evol. Comput.3, 257–271. 10.1109/4235.797969
Summary
Keywords
arc routing problem, police officer patrolling problem, genetic algorithm, MoEA-HSS, Jaya algorithm
Citation
Kudo F, Tohyama H and Tomisawa M (2025) Hybrid heuristic approach for generalized police officer patrolling problem. Front. Ind. Eng. 3:1620422. doi: 10.3389/fieng.2025.1620422
Received
29 April 2025
Accepted
09 July 2025
Published
25 August 2025
Volume
3 - 2025
Edited by
Mitsuo Gen, Tokyo University of Science, Japan
Reviewed by
Wenqiang Zhang, Henan University of Technology, China
Huizhen Zhang, University of Shanghai for Science and Technology, China
Updates
Copyright
© 2025 Kudo, Tohyama and Tomisawa.
This is an open-access article distributed under the terms of the Creative Commons Attribution License (CC BY). The use, distribution or reproduction in other forums is permitted, provided the original author(s) and the copyright owner(s) are credited and that the original publication in this journal is cited, in accordance with accepted academic practice. No use, distribution or reproduction is permitted which does not comply with these terms.
*Correspondence: Masaki Tomisawa, tomisawa@maebashi-it.ac.jp
Disclaimer
All claims expressed in this article are solely those of the authors and do not necessarily represent those of their affiliated organizations, or those of the publisher, the editors and the reviewers. Any product that may be evaluated in this article or claim that may be made by its manufacturer is not guaranteed or endorsed by the publisher.