 Koichi Kubota1* and Yuichi Kadoya2
- 1 Department of Microbiology, Kitasato University School of Medicine, Sagamihara, Kanagawa, Japan
- 2 Department of Anatomy, Kitasato University School of Allied Health Sciences, Sagamihara, Kanagawa, Japan
Production of innate interferon-γ (IFN-γ) is a crucial step in immunological defense against bacteria. However, there is little information regarding cellular mechanisms underlying IFN-γ production in vivo early after bacterial infection. Here we analyze innate IFN-γ production in the spleen of mice early after Listeria monocytogenes (LM) infection ex vivo by flow-cytometry and in situ by immunohistochemistry, and compare them with the IFN-γ-producing cells reported previously in our in vitro coculture system in which cell-cell interaction between lymphocytes and dying bacterial-infected macrophages is required for the production of IFN-γ. In the spleen at 20 h after LM infection, natural killer (NK) cells, a subset of αβ T cells, and subsets of NKT and γδ T cells produced IFN-γ with features similar to the IFN-γ-producing cells in our in vitro coculture system. Immunohistochemistry revealed that LM bacteria were first phagocytosed mainly by ER-TR9+ marginal zone macrophages (MZMs), then forming infectious foci in close vicinity of the marginal zone (MZ) at 20-h postinfection. At this time point, the IFN-γ-producing cells were accumulating at the same site of infectious foci, around which ER-TR9+ MZMs were clustered but most of bacteria were no longer associated with ER-TR9+ MZMs. These results indicate that innate IFN-γ production by innate lymphocytes takes place at infectious foci formed in close vicinity of the MZ, and they also suggest an important role for the microenvironment of the cells accumulated at infectious foci in inducing the production of innate IFN-γ.
Introduction
Listeria monocytogenes (LM) is a Gram-positive facultative intracellular bacterium that causes severe disseminated infection or local infection like meningitis in immunocompromised individuals and in pregnant women (Vazquez-Boland et al., 2001). Studies of LM infection in mice as a model for antimicrobial defense have brought us marked progress in our understanding of the innate and adaptive immunity (Parham, 1997). During an early stage of LM infection innate immune responses control initial infection, and subsequently T helper type 1 (Th1) adaptive immune responses develop to sterilize LM-infected mice (Unanue, 1997). interferon-γ (IFN-γ) secreted by the innate immune cells (called “innate IFN-γ”) is one of the most important cytokines that contribute to these innate and adaptive immune responses; i.e., IFN-γ plays a crucial role for the activation of macrophage effector functions that are required to limit bacterial growth and control infection, and in the adaptive immunity IFN-γ is responsible for a bias toward Th1 responses (Schroder et al., 2004). Natural killer (NK) cells are thought to be the main source of innate IFN-γ, but other multiple cell types, such as memory type CD8+ T cells, NKT cells, γδT cells, macrophages, and dendritic cells (DCs) are also claimed to produce innate IFN-γ (Hiromatsu et al., 1992; Bancroft, 1993; Frucht et al., 2001; Berg et al., 2005; Berntman et al., 2005; Thale and Kiderlen, 2005). Furthermore, NK1.1+CD11c+ cells have recently been reported to be the primary IFN-γ-producing cells in the spleen early after LM infection in mice (Chang et al., 2007; Plitas et al., 2007). Thus, the cellular sources of innate IFN-γ remain still unsettled.
The spleen has multiple functions such as the phagocytosis of aged erythrocytes, the capture and destruction of pathogens, and the induction of the innate and adaptive immunity. Accordingly, the spleen has a highly organized structure, consisting of the red pulp, distinguishable by the abundance of erythrocytes, and the white pulp where the majority of T cells and B cells reside (Mebius and Kraal, 2005). The white pulp and the red pulp are separated by the marginal zone (MZ), which consists of sinus-lining reticular cells, MZ B cells, dendritic cells, marginal metallophilic macrophages, and marginal zone macrophages (MZMs). Most of the blood flow passes through the MZ and thus macrophages of the MZ are essential for trapping blood–bone pathogens and early control of infection (Aichele et al., 2003). It is widely accepted that upon LM infection of mice, LM bacteria are first trapped by macrophages in the MZ, forming MZ infectious foci and then LM-infected phagocytes translocate from the MZ into the white pulp where they establish secondary infectious foci (Conlan, 1996). The field of infectious foci is considered to be the site for control of bacterial infection through orchestrating innate immune responses (Serbina et al., 2003; Berg et al., 2005; Kang et al., 2008). Also, it may be the site in which antigen presentation to T cells occurs to induce adaptive immune responses especially when they are formed in the white pulp (Muraille et al., 2005). Since IFN-γ is a key cytokine to control bacterial infection, dissecting cellular mechanisms responsible for innate IFN-γ production in the spleen is indispensable for understanding the host defense against bacterial infection. However, there is little experimental data as to where in the spleen and how innate IFN-γ is produced early after LM infection.
In this study, we characterize IFN-γ-producing cells in the spleen of mice early after LM infection by flow-cytometric analysis to determine the cellular source of innate IFN-γ and also we examine the localization of the IFN-γ-producing cells and bacteria within the LM-infected spleens by immunohistochemistry to determine their dynamic relationships. Furthermore, as we have recently shown by using an in vitro coculture system that subsets of NK, NKT, and γδ T cells, which are generically referred to as innate lymphocytes (Bendelic et al., 2001), produce IFN-γ in a cell–cell contact dependent manner in response to dying bacterial-infected macrophages (Kubota, 2006) and have proposed that this IFN-γ production pathway contributes to the host defense at the initial phase of bacterial infection (Kubota, 2010), we compare the innate IFN-γ-producing cells in the LM-infected spleen with the IFN-γ-producing cells in our in vitro coculture system to explore the relevance of our in vitro finding to the in vivo situation in the spleen early after LM infection.
We revealed in this study that early after LM infection, NK cells and, to a lesser extent, a subset of αβ T cells, subsets of NKT and γδ T cells are the cellular sources of innate IFN-γ, and that LM bacteria are first phagocytosed by MZMs, then forming infectious foci in close vicinity of the MZ without being associated with MZMs at 20-h postinfection, and that the innate IFN-γ-producing cells form cell clusters at the same site of infectious foci. This study also demonstrated that there are many similarities between the features of the IFN-γ-producing cells in the LM-infected spleen and those in our in vitro coculture system. These results suggest that the cellular microenvironment similar to our in vitro setting may play an important role in the production of innate IFN-γ by innate lymphocytes in the LM-infected spleen.
Materials and Methods
Bacteria
Listeria monocytogenes (EGD strain) were grown in tryptic soy broth overnight, washed with PBS and stored at −80°C until use.
Mice and Cells
C57BL/6 mice were purchased from Oriental Yeast (Tokyo, Japan). Mice were used in accordance with the institutional guideline. Bone marrow-derived macrophage (BMM) cells were grown from marrow cells according to the method described previously (Kubota, 2006). Nylon wool non-adherent (NWNA) spleen cells were prepared according to the method described elsewhere (Hothcock, 1998).
Antibodies and Reagents
Anti-FcγR (2.4G2) monoclonal antibody (mAb) and FITC-conjugated, PE-conjugated, or biotinylated mAbs specific for NK1.1 (PK136), TCRαβ (H57-597), CD244 (2B4), CD11c (HL-3), CD4 (GK1.1), and CD8b (H35-17.2) were purchased from BD Bioscience (San Jose, CA, USA). PE-conjugated anti-TCRγδ (GL3) and FITC-conjugated CD45R (B220) mAbs were purchased from Caltag Laboratories (Burlingama, CA, USA) and Life Technologies (Carlsbad, CA, USA), respectively. PITC-conjugated anti-mouse IFN-γ, biotinylated CD11b (M1/70), biotinylated anti-TCRγδ, and PE-Cy5-conjugated streptavidin were purchased from eBioscience (San Diego, CA, USA). Rabbit anti-murine IFN-γ polyclonal Ab was purchased from PBL Biomedical Laboratories (Piscataway, NJ, USA). Rabbit anti-LM antibody (IgG fraction) was purchased from ViroStat (Portland, ME, USA). Biotinylated mAb to mouse MZMs (ER-TR9; rat IgM; Dijkstra et al., 1985) was purchased from BMA Biomedicals (Augst, Switzerland). Anti-perlecan rat mAb, DTAF-, or FITC-labeled donkey anti-rabbit IgG Ab, and DTAF-labeled donkey anti-rat IgG Ab were purchased from Millipore (Billerica, MA, USA). Alexa Fluor 488-conjugated streptavidin was purchased from Molecular Probe, Inc. (Eugene, OR, USA). Interleukin (IL)-12p70 and IL-18 were purchased from Peprotech (London, UK) and MBL (Nagoya, Japan), respectively. The fluorescent Fluoresbrite Carboxy BB microspheres (1 μm diameter, excitation:360 nm, emission:470 nm) were purchased from Polysciences (Warrington, PA, USA) and were washed in PBS before use. Brefeldin A (BFA) was purchased from Sigma (St. Louis, MO, USA) and a 20-mg/ml stock solution was prepared in DMSO.
In vitro Stimulation of Nylon Wool Non-Adherent Spleen Cells by LM-Infected BMM Cells
This method was described previously (Kubota, 2006, 2010). Briefly, C57BL/6 mice-derived BMM cells (4 × 10⁵ cells/ml) were suspended in culture medium without antibiotics, seeded into a 96-well culture plate and were cultured at 37°C overnight in a CO2 incubator. After each well was washed with DMEM without antibiotics, bacteria were inoculated into each well at a multiplicity of infection (MOI) of 50, and the plate was centrifuged at 800 g for 5 min and then incubated at 37°C in a CO2 incubator. After a 1-h infection period, NWNA spleen cells (5 × 10⁶ cells/ml) suspended in culture medium containing gentamicin (100 μg/ml) were added to each well. The plate was incubated at 37°C for 20 h in a CO2 incubator. During the last 6 h of culture, GolgiStop (BD Pharmingen) was added, and intracellular IFN-γ staining was conducted and analyzed on FACScan (BD Bioscience).
In vivo Infection
C57BL/6 mice were infected intravenously (i.v.) with LM with or without fluorescent Fluoresbrite Carboxy BB microspheres (1 × 10⁸). Mice were inoculated i.v. with 250 μg of BFA 4 h before sacrifice (Lin and Whitton, 2005). At 4- and 20-h postinfection mice were killed and the spleens were excised from the mice for FACS analysis and immunohistochemistry. For FACS analysis, splenocytes were gently dispersed in Ten-broeck Tissue grinder (Wheaton Scientific, Millville, NJ, USA) and erythrocytes were lysed in NH4Cl buffer (155 mM NH4Cl, 10 mM KHCO3, 0.1 mM EDTA).
Intracellular IFN-γ Assay
This method was described previously (Kubota, 2006). Briefly, splenocytes and NWNA spleen cells pretreated with the blocking anti-FcγR mAb (2.4G2) were stained with mAbs against surface markers, and then the cells were permeabilized using the Cytofix/Cytoperm Plus kit (BD Bioscience) and stained using FITC-conjugated anti-IFN-γ. The data were acquired using FACScan and analyzed using CellQuest software (BD Bioscience).
Immunohistochemistry
Spleen tissues were fixed with 1% formaldehyde in 0.1 M phosphate buffer (pH 7.2) for 1 h, washed with phosphate buffered saline (PBS), and incubated overnight at 4°C in Holt’s gum sucrose solution. They were then embedded in OCT compound (Sakura Tissue-Tek, Tokyo, Japan), frozen in liquid nitrogen, and then 7- to 10-μm-sections were cut and air-dried. For staining of MZMs and perlecan, tissues were immediately embedded in OCT compound and fresh-frozen. Fresh-frozen sections (7–10 μm) were fixed with acetone (−20°C) for 5 min. After blocking with 1% bovine serum albumin (BSA) dissolved in PBS (BSA–PBS) for 1 h, sections were incubated overnight with diluted primary antibodies, washed with PBS (5 min × 3 times). Bound primary antibodies were visualized by incubation for 1 h with fluorochrome labeled species-specific secondary antibodies. Bound ER-TR9 mAb was detected with Alexa Fluor 488-conjugated streptavidin. For double immunofluorescence staining, antibodies were mixed and applied onto sections. After washing with PBS (3 min × 3 times), specimens were mounted with Fluoromount (Diagnostics Biosystems, Pleasanton, CA, USA) and examined under an Axioplan-2 epifluorescence microscope (Zeiss, Tokyo, Japan). Images were captured with a cooled CCD camera (Quantix, Photometrics, Munchen, Germany) and processed using IPlab software (Scanalytics, Fairfax, VA, USA). Deconvolution of some images was performed using Hazebuster software (Vay Tek, Fairfield, IA, USA). All antibodies and Alexa Fluor 488-conjugated streptavidin were diluted 1:100 and 1:500 in 1% BSA–PBS, respectively. Negative control experiments were performed by replacing the primary antibodies with 1% BSA–PBS. Some spleen tissues exhibited background autofluorescence.
Results
A Minor Subset of αβ T Cells and NK, NKT, and γδ T Cells are the Cellular Sources of Innate IFN-γ in the Spleen Early after LM Infection
To examine innate IFN-γ production in the spleen of mice following infection with LM, we inoculated C57BL/6 mice with LM and analyzed splenocytes ex vivo by three-color flow-cytometry. Detection of cytokine production in vivo has usually been conducted by culturing splenocytes in vitro with brefeldin A (BFA), an inhibitor of Golgi transporter, for a short period of time, followed by intracellular cytokine staining (Emoto et al., 2001; Thale and Kiderlen, 2005; Chang et al., 2007). In the present study, to avoid in vitro manipulation, we employed an approach of in vivo injection of BFA (Lin and Whitton, 2005); i.e., BFA was administered to LM-infected or uninfected C57BL/6 mice 4 h before sacrifice. The spleens were excised from the mice and splenocytes were immediately assessed for IFN-γ production by intracellular cytokine staining in combination with surface staining of NK1.1 and either TCRαβ or TCRγδ. Preliminary experiments showed that the highest number of IFN-γ-producing cells was induced in the spleen of mice injected with LM at a range of doses from 2 to 5 × 10⁵ bacteria. When mice were infected with 5 × 10⁵ LM, the IFN-γ response in the spleen began around 14 h after LM infection and the maximum response was induced at 20-h postinfection (Figure 1). Thus, in all the following experiments mice were injected with 5 × 10⁵ bacteria and the IFN-γ production was assessed at 20-h postinfection. Figure 2 shows that while no IFN-γ producing cells were detected in the splenocytes from control uninfected mice (Figure 2A), 1.1 ± 0.2% of total splenocytes from LM-infected mice produced IFN-γ, of which IFN-γ+ percentages of αβ T cells and γδ T cells were 1.0 ± 0.2 and 8.4 ± 1.9%, respectively (Figure 2B). When dot plots were gated on IFN-γ-producing αβ T cells, 28 ± 1.0% were NK1.1+, indicating that IFN-γ-producing αβ T cells include NKT cells (Figure 2B). Of TCRαβ+NK1.1+ (NKT cells), 32 ± 7.5% were IFN-γ+ and of TCRαβ−NK1.1+ cells (hereafter denoted “NK” cells because these cells are mostly composed of NK cells), 32 ± 3.3% were IFN-γ+ (Figure 2B right panel). These results indicate that a minor subset of αβ T cells and subsets of NK, NKT, and γδ T cells are the cellular sources of innate IFN-γ production in the spleen at 20 h after LM infection.
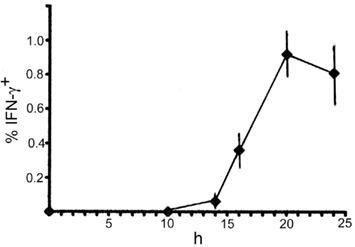
Figure 1. Time course of IFN-γ-production in the spleen early after LM infection. C57BL/6 mice were infected with 5 × 10⁵ bacteria, and the spleens were excised at each time point indicated, examined for intracellular IFN-γ by FACS analysis. Mean percentages and SD (n = 4) of IFN-γ+ cells in total splenocytes are diagrammed.

Figure 2. Interferon-γ production by a minor subset of αβ T cells and subsets of NK, NKT, and γδ T cells in the spleen early after LM infection. C57BL/6 mice uninfected or infected with 5 × 10⁵ LM were inoculated i.v. with BFA 4 h before sacrifice. At 20-h postinfection the spleens were excised from mice and splenocytes from uninfected (A) and infected mice (B) were stained for NK1.1, intracellular IFN-γ and either TCRαβ or TCRγδ, and analyzed on FACScan. Representative data from one of three independent experiments are shown. The numbers shown on the upper right quadrants represent mean percentages of IFN-γ+ cells in αβ T and γδ T cells, respectively, and the numbers within the histograms represent the mean percentage of NK1.1+ or IFN-γ+ cells in gated cell populations. (C,D) Immunohistochemical staining of LM-infected spleens. A formaldehyde-fixed section of the above LM-infected spleens was stained with anti-IFN-γ Ab [green (D)]. IFN-γ-producing cells form clusters. A negative control exhibits only background staining (C). Inset is an enlarged view of the IFN-γ-producing cell cluster. (E) The same section shown in (D) was subsequently stained with hematoxylin and eosin to distinguish the red pulp (rp) and the white pulp (wp). Bars in (C–E) = 200 μm. Bar in [(D) inset] = 20 μm. Representative sections are shown.
When dot blots were gated on IFN-γ+ TCRγδ+ cells and IFN-γ− TCRγδ+ cells, we found that 69 ± 7.3% of IFN-γ-producing γδ T cells were NK1.1+ whereas only 21 ± 5.3% of IFN-γ− γδ T cells expressed NK1.1 (Figure 2B). The proportion of NK1.1+ cells within normal splenic γδ T cells was 22 ± 3.5% (Figure 2A). These results indicate that the cellular source of IFN-γ among γδ T cell populations in the spleen is biased to NK1.1+ γδ T cells.
We next investigated the localization of IFN-γ-producing cells in the spleen of mice 20 h after LM infection. To this end, part of the spleens used for FACS analysis was fixed with formaldehyde and the sections were stained for IFN-γ (Figure 2D). Control staining of the spleen was also conducted (Figure 2C). The results clearly show that the IFN-γ-producing cells (green) identified as being composed of subsets of innate lymphocytes by FACS analysis (Figure 2B) accumulate at several discrete sites, thus forming multiple cell clusters in the spleen (Figure 2D). It was of interest that IFN-γ expressed in the cytoplasm of the cells appeared to concentrate beneath the cell membrane (Figure 2D inset). Additionally, a large number of CD11b+ cells were stained within the clusters of IFN-γ-producing cells (Data not shown), suggesting that macrophages and granulocytes were attracted to the clusters. We next stained the same section with hematoxylin and eosin to distinguish the white pulp and the red pulp (Figure 2E). Comparison between Figures 2D,E unveiled that the clusters of IFN-γ-producing cells appear to be localized to the boundary between the white pulp and the red pulp.
NK1.1+CD11c+ Cells are the Main IFN-γ-Producing Cells in Both in vitro and in vivo LM Infection
Recent papers have shown that early IFN-γ producing cells in the spleen of mice infected with LM are primarily NK1.1+CD11c+ cells (Chang et al., 2007; Plitas et al., 2007). To confirm those reports, we next examined NK1.1 and CD11c expressions of splenocytes excised from control uninfected mice and LM-infected mice at 20-h postinfection (Figures 3A,B). Approximately 50% of NK1.1+ cells of control splenocytes expressed low levels of CD11c antigen, as had been reported previously (Laouar et al., 2005; Chang et al., 2007) and almost all of them expressed the NK receptor CD244 (Boles et al., 2001), but not CD3 antigen of the T cell (Figure 3A). This result supports the notion that CD11c antigen is expressed on NK cells (Laouar et al., 2005; Schleicher et al., 2005). When splenocytes from LM-infected mice were examined for the expression of NK1.1, CD11c, and intracellular IFN-γ by three-color flow-cytometry, ∼54% of NK1.1+ cells expressed low levels of CD11c (Figure 3B), of which 42 ± 12% were positive for IFN-γ. In addition, 34 ± 9% of CD11c-negative NK1.1+ cells also produced IFN-γ, indicating that both NK1.1+CD11c+ and NK1.1+CD11c− cells produce IFN-γ. It has been reported that DCs can be a candidate for the source of innate IFN-γ production (Frucht et al., 2001). However, when dot plots were gated on CD11chi DC cells, no IFN-γ was detected (Figure 3B). To evaluate the relative contribution of NK1.1+CD11c+ cells to total IFN-γ production, splenocytes from LM-infected mice were gated on IFN-γ+CD11c+ cells, and NK1.1 expression was examined (Figure 3B right panel). Approximately 50% of total IFN-γ+ cells were CD11c+, ∼90% of which express NK1.1, and thus ∼45% of total IFN-γ-producing cells were NK1.1+CD11c+ cells. This result confirms the report of Chang et al. (2007) that NK1.1+CD11c+ cells represent primary IFN-γ-producing cells early after LM infection.
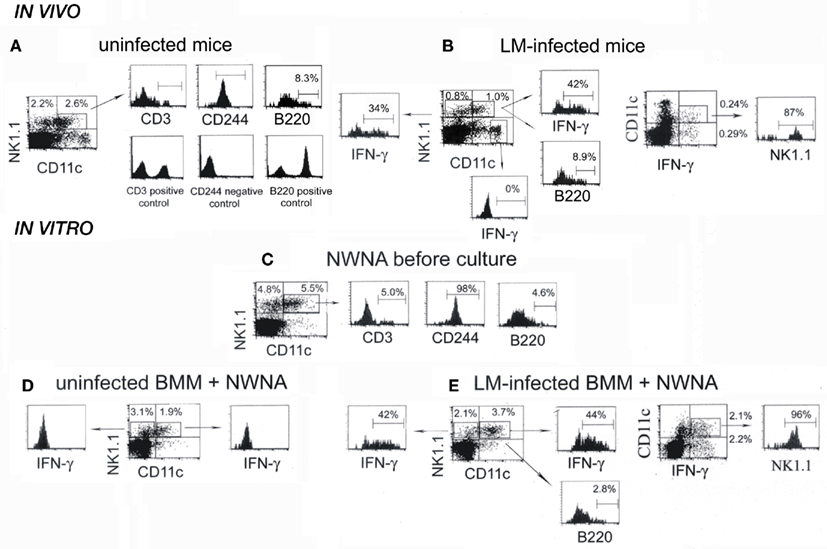
Figure 3. NK1.1+CD11c+ NK cells are main IFN-γ-producing cells in both the spleen of mice infected with LM for 20 h and the in vitro 20-h coculture of NWNA spleen cells with LM-infected BMM cells. (A) Splenocytes from uninfected mice were stained for NK1.1, CD11c, and either CD3, CD244, or B220, and three-color flow-cytometric analysis was performed on FACScan. (B) Splenocytes from LM-infected mice were stained for NK1.1, CD11c, and either intracellular IFN-γ or B220. (C–E) NWNA spleen cells before culture (C) and after coculture with uninfected (D) or LM-infected (E) BMM cells were stained for NK1.1, CD11c, and either intracellular IFN-γ or one of the following surface markers: CD3, CD244, and B220. Representative data from one of three independent experiments are shown. The numbers shown in or outside quadrants represent mean percentages of cells in total splenocytes and the numbers within histograms represent mean percentages of cells expressing surface antigen indicated or intracellular IFN-γ in gated cell populations from three independent experiments.
We previously reported that dying LM-infected BMM cells induce subsets of innate lymphocytes to produce IFN-γ in a cell-cell contact dependent manner in vitro (Kubota, 2006, 2010). Thus, we next asked whether IFN-γ-producing NK1.1+CD11c+ cells are also main IFN-γ-producing cells in our in vitro coculture system. To this end, NWNA spleen cells before culture and NWNA spleen cells cocultured for 20 h with uninfected or LM-infected C57BL/6 BMM cells were subjected to the same analysis as above (Figures 3C–E). Compared to the whole splenocytes (Figure 3A), CD11chi cells were hardly detected in NWNA spleen cells (Figure 3C), indicating that DCs are removed from splenocytes after passing a nylon column. As with the whole splenocytes (Figure 3A), ∼50% of NK1.1+ NWNA spleen cells expressed CD11c, and almost all of the NK1.1+CD11c+ cells were CD3− and CD244+ (Figure 3C). In contrast to uninfected BMM cells (Figure 3D), LM-infected BMM cells, which underwent cell death during culture as had been reported previously (Kubota, 2006, 2010) induced 44 ± 5% of NK1.1+CD11c+ cells and 42 ± 10% of NK1.1+CD11c− cells to produce IFN-γ (Figure 3E). As shown in the right panel of Figure 2E, ∼42% of total IFN-γ-producing cells were NK1.1+CD11c+ cells and thus NK1.1+CD11c+ cells were main IFN-γ-producing cells in our in vitro experimental setting as well as in the spleen in vivo at 20 h after LM infection (Figure 3B right panel).
B220+NK1.1+CD11c+ cell population has been reported as a novel DC subset that has the ability to produce IFN-γ and exhibits properties of both NK cells and DCs (Chan et al., 2006; Taieb et al., 2006). We next examined whether B220 antigen is expressed on the IFN-γ-producing cells responding to LM-infected BMM cells. Figure 3C shows that 4.6 ± 1.4% of NK1.1+CD11c+ NWNA spleen cells expressed B220 antigen. When NWNA spleen cells were cocultured for 20 h with LM-infected BMM cells, this proportion decreased to 2.8 ± 0.1% despite ∼44% of the NK1.1+CD11c+ cell population produced IFN-γ (Figure 3E). The similar results were obtained with NK1.1+CD11c+ IFN-γ-producing cells in LM-infected mice (Figures 3A,B). Thus, B220+NK1.1+CD11c+ cells did exist, but they were not the specific producers of IFN-γ in both in vitro and in vivo.
Similarity between IFN-γ-Producing Cells in the LM-Infected Spleen and those in the Coculture of NWNA Spleen Cells with Dying LM-Infected Macrophages
As it was found that NK1.1+CD11c+ cells are primary IFN-γ-producers in both the LM-infected spleen and in our in vitro coculture system, further comparison between IFN-γ-producing cells in the LM-infected spleens and those in our in vitro coculture system (Kubota, 2006, 2010) was performed and the results are summarized in Figure 4. Since IL-12 and IL-18 can synergistically stimulate lymphocytes to produce IFN-γ in vitro (Dinarello and Fantuzzi, 2003), analysis of IFN-γ production by NWNA spleen cells cultured for 20 h with IL-12 and IL-18 has also been included in this comparison. As shown in Figure 4A, our in vitro coculture and the in vivo infection induced similar proportions of each individual cell type to produce IFN-γ (0.8 ± 0.2 and 1.0 ± 0.2% of αβ T cells, 46 ± 6 and 32 ± 3.3% of “NK” cells, 38 ± 11 and 32 ± 7.5% of NKT cells, and 12 ± 3.4 and 8.4 ± 1.9% of γδ T cells, respectively), whereas, compared to the above two stimulations, the IL-12/IL-18 stimulation resulted in the production of IFN-γ by relatively large proportions of each individual cell type (4.5 ± 1.6% for T cells, 95 ± 3.5% for “NK” cells, 87 ± 3.5% for NKT cells and 37 ± 7.0% for γδ T cells). Thus, the results indicate that the IFN-γ-positive proportions of each individual cell type in the spleen at 20-h postinfection resemble to those observed in our in vitro cocultures of NWNA spleen cells with dying LM-infected BMMs.
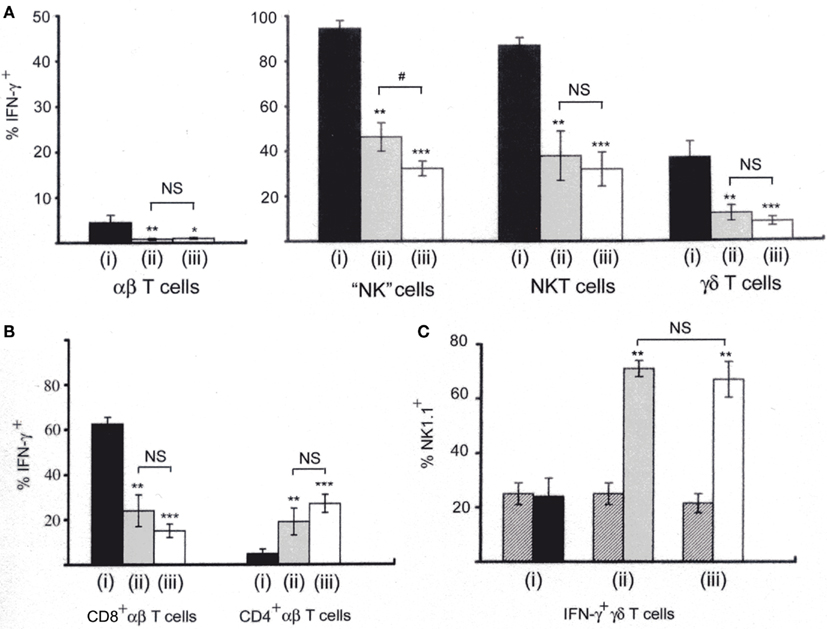
Figure 4. Comparison of IFN-γ-producing cells among lymphocytes stimulated with three different ways. (i) NWNA spleen cells cultured with IL-12 (10 ng/ml) and IL-18 (25 ng/ml); (ii) NWNA spleen cells cocultured with dying LM-infected BMM cells; (iii) splenocytes from mice infected with LM for 20 h. Cells were stained for TCRαβ, intracellular IFN-γ and either CD4 or CD8, and analyzed by three-color flow-cytometry. (A) Percent IFN-γ- producing cells in each cell type. (B) Percent IFN-γ-producing cells in CD4+ αβ T cells and in CD8+ αβ T cells. (C) Percent NK1.1+ cells in IFN-γ-producing γδ T cells. Cells were stained for TCRγδ, NK1.1 and intracellular IFN-γ. Cross-hatched, percent NK1.1+ cells in control γδ T cells without stimulation. See also histograms of γδ T cells shown in Figure 2B. Mean percentages and SD were calculated from 3 to 5 independent experiments and statistics (Student’s t-test) compare the values of (i) to those of (ii) and (iii). *P < 0.05; **P < 0.01; ***P < 0.001. The values of (ii) and (iii) are also statistically compared. #, P < 0.05; NS, not significantly different.
Furthermore, when IFN-γ-producing cells were stained for TCRαβ and either CD4 or CD8 and analyzed by three-color flow-cytometry (Figure 4B), the proportions of CD4+ and CD8+ cells among IFN-γ-producing αβ T cell populations were similar between our in vitro coculture and the in vivo infection (25 ± 7.4 and 15 ± 3.2% for CD8+ cells and 19 ± 5.6 and 27 ± 6.5% for CD4+ cells, respectively), whereas the IL-12/18 stimulation induces relatively a large proportion of CD8+ cells and a small proportion of CD4+ cells to produce IFN-γ (62 ± 3.0 and 4.8 ± 2.0%, respectively).
Because IFN-γ-producing γδ T cells in the spleen of mice infected with LM were found to be biased to NK1.1+ γδ T cells (Figure 2B), we next compared the proportions of NK1.1+ cells in IFN-γ-producing γδ T cells among the three different stimulations by three-color flow-cytometry (Figure 4C). In our in vitro coculture and in the in vivo infection, 76 ± 2.1 and 69 ± 7.3% of IFN-γ-producing γδ T cells were NK1.1+, respectively, while 25 ± 4.3 and 22 ± 3.5% of normal counterparts were NK1.1+ (Figure 4Cii,iii) In contrast, in the IL-12/18 stimulation only 24 ± 7.0% of IFN-γ-producing γδT cells were NK1.1+ (Figure 4Ci) although when the whole NK1.1+ γδT cells were gated, most of them were IFN-γ+ (Data not shown). The results indicate that in our in vitro coculture system as well as in the LM-infected spleens, IFN-γ-producing γδ T cells are biased to the cells with a NK1.1+ phenotype.
Overall, the comparison among the three different stimulations reveals that there are many similarities between the features of IFN-γ-producing cells in the spleen at 20-h postinfection and those in our in vitro cocultures of NWNA spleen cells with dying LM-infected BMMs.
Clusters of the IFN-γ-Producing Lymphocytes are Localized to the Same Site of Infectious Foci Formed in Close Vicinity of the MZ
We next determined the precise localization of IFN-γ-producing cells and bacteria within the LM-infected spleen. To this end, we excised the spleens from mice treated in the same way as the case of FACS analysis except that 3 × 10⁸ fluorescent microspheres were simultaneously injected into mice, and then the spleen sections were examined by immunohistochemistry using antibodies specific to LM, MZM, IFN-γ, and perlecan. Perlecan is a major heparan sulfate proteoglycan constituting various basement membranes (Lokmic et al., 2008). Microspheres have been reported to be taken up by macrophages in the MZ and by CD11c+ DCs in the red pulp when injected into mice (Iyoda et al., 2002). In preliminary experiments we confirmed that the injection of microspheres did not affect the total number of IFN-γ-producing cells in the LM-infected spleens (Data not shown). When cryosections were stained for LM (red) and ER-TR9+ MZMs (green; Figure 5), ER-TR9+ MZMs and microspheres (blue) were observed in the same area of the sections at 4-h postinfection, delineating the MZ, and most of LM bacteria were associated with ER-TR9+ MZMs (Figure 5A). At 20-h postinfection, LM formed infectious foci and ER-TR9+ MZMs were found around the infectious foci, where most of bacteria were no longer associated with ER-TR9+ MZMs (Figure 5B).
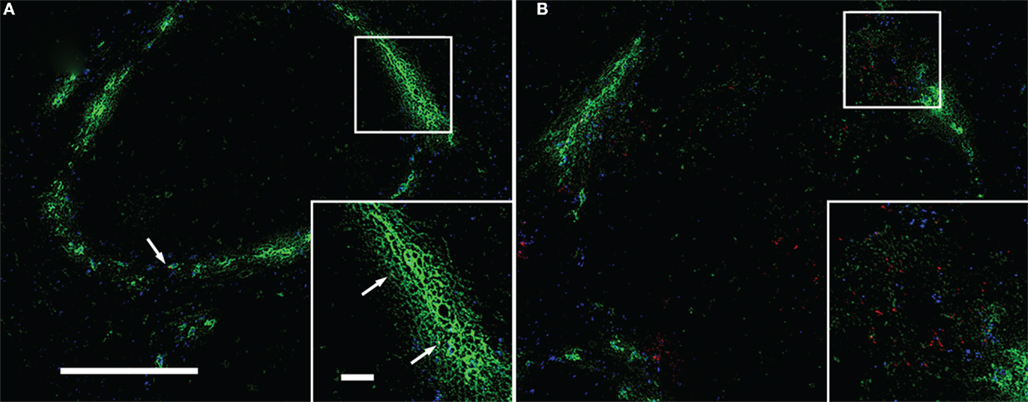
Figure 5. Uptake of LM by ER-TR9+ MZMs and formation of infectious foci without being associated with MZMs. Cryosections of the spleen taken from mice inoculated with LM and fluorescent microsphers (blue) were stained for LM (red) and MZMs (green). (A) Four-hour postinfection; fluorescent microsphers and MZMs delineate the MZ and a few bacteria (arrows) are associated with MZMs. (B) Twenty-hour postinfection; bacteria form infectious foci. MZMs are found around infectious foci, but most of bacteria are no longer associated with MZMs. Insets are enlarged squares shown in (A,B). Some bacteria are also found in the interior of the white pulp. Bar in (A) = 100 μm for both (A,B). Bar in [(A) inset] = 20 μm for both insets. Representative sections are shown.
To determine the location of infectious foci, we next stained spleen tissues excised from LM-infected mice at 16-h postinfection (Figure 6A) and 20-h postinfection (Figure 6B) by using anti-LM antibody (red) and anti-perlecan antibody (green). Staining of perlecan, which detects vascular basement membranes surrounding marginal sinuses and central arterioles, delineated the MZ and the central arteriole. Most of the bacteria were found in close vicinity of the MZ, forming infectious foci in both the 16 and 20-h sections. It should be noted, however, that in the 20-h sections, some bacteria were also observed in the white pulp, occasionally in periarteriolar lymphoid sheath surrounding the central arteriole.
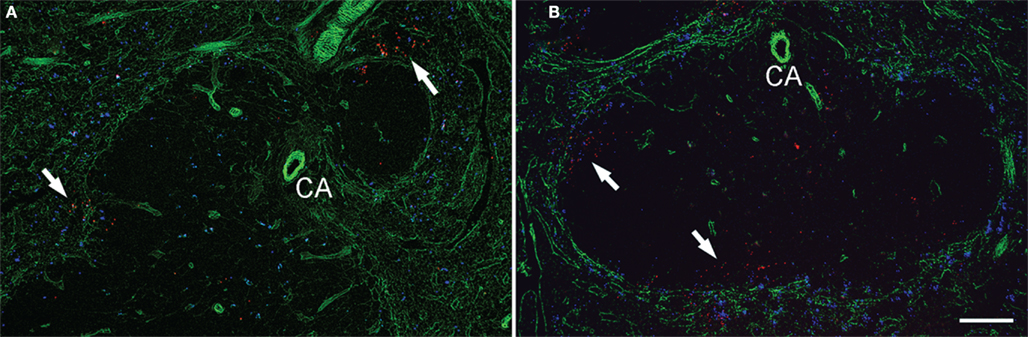
Figure 6. Infectious foci are formed in close vicinity of marginal zone area. Cryosections of the spleens taken from mice 16 h (A) and 20 h (B) after the inoculation of LM and fluorescent microspheres (blue) were stained for perlecan (green) and LM (red). Perlecan is expressed in the basement membranes surrounding the marginal sinuses and blood vessels. Arrows indicate infectious foci. Some bacteria are also found in the interior of the white pulp in (B). CA, central arteriole. Bar = 100 μm. Representative sections are shown.
We next examined the positional relationship between infectious foci and clusters of IFN-γ-producing cells. To this end, because both of the Abs against LM and IFN-γ were rabbit immunoglobulin and therefore unable to be used for double immunofluorescence staining, consecutive sections were separately stained with anti-LM (Figures 7A,C) and anti-IFN-γ (Figures 7B,D) antibodies, respectively, and a series of comparisons between those consecutive sections were conducted. As shown in Figure 7, infectious foci (Figures 7A,C; red) and clusters of IFN-γ-producing cells (Figures 7B,C; red) were always observed in the same area of consecutive sections in close vicinity of the MZ, which were delineated by microsphers (blue). This result indicates that clusters of IFN-γ-producing cells are localized to the same site of infectious foci.
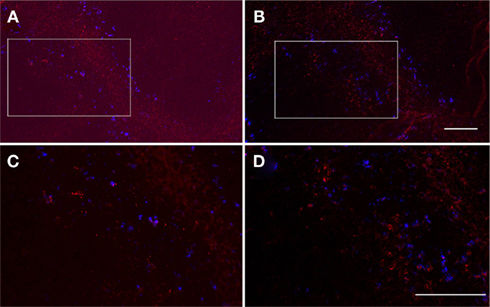
Figure 7. Interferon-γ-producing cells are localized to infectious foci. Serial formaldehyde-fixed sections of the spleen taken from mice 20 h after the inoculation of LM and fluorescent microsphers (blue) were separately stained for LM [(A,C) red] and IFN-γ [(B,D) red], respectively. Consecutive areas were photographed. The squares shown in (A,B) were enlarged in (C,D). Bacteria and IFN-γ-producing cells are visualized as red spots and cytoplasmic staining, respectively. Bar = 100 μm for (A,B), 50 μm for (C,D). Representative consecutive sections are shown.
Taken together, these results indicate that bacteria are mainly trapped by ER-TR9+ MZMs at 4-h postinfection and that at 20-h postinfection infectious foci and clusters of IFN-γ-producing cells are formed at the same sites in close vicinity of the MZ, where most of bacteria are no longer associated with ER-TR9+ MZMs.
Discussion
The present study demonstrated that NK cells and, to a lesser extent, a minor subset of αβ T cells, subsets of NKT and γδ T cells are the cellular sources of innate IFN-γ in the spleen of mice early after LM infection. Contrary to the previous report of Chang et al. (2007) that γδ T cells were not involved in the cellular sources of IFN-γ early after LM infection, our study clearly showed that a subset of γδ T cells participates in the innate IFN-γ production. This discrepancy may be due to the fact that Chang et al. (2007) cultured splenocytes ex vivo with BFA for a short period of time before flow-cytometric analysis while we employed a technique of in vivo administration of BFA which can avoid in vitro artificial effects (Lin and Whitton, 2005). In addition, our results indicate that NK1.1+ γδT cells are main innate IFN-γ-producers among γδ T cell populations in vivo early after LM infection. This result is compatible with the recent reports that γδ T cells with a NK1.1+ phenotype are efficient IFN-γ-producers among γδ T cell populations (Stewart et al., 2007; Haas et al., 2009). The important role of NK1.1+ γδ T cells in innate IFN-γ production has also been suggested by the results of other investigators (Emoto et al., 2001).
It has been claimed that macrophages and DCs can produce IFN-γ under certain conditions, playing an important role in the initial stages of infection (Frucht et al., 2001). However, this notion has been challenged by the recent reports showing that contaminant NK cells with a CD11c+ phenotype may be the source of IFN-γ in macrophage and/or DC populations, and that there were no IFN-γ+ MHC class II+ macrophages/DCs among ex vivo splenocytes from mice early after LM infection (Laouar et al., 2005; Schleicher et al., 2005; Thale and Kiderlen, 2005). Our study using a technique of in vivo administration of BFA clearly indicates that CD11chi DCs did not produce IFN-γ in the spleen. Thus, albeit not excluding a possibility that DCs might produce IFN-γ at later stages in infection, it is unlikely that DCs become a source of IFN-γ in early innate immune responses against bacterial infection.
Recently, it has been reported that NK1.1+CD11c+ cells are the primary IFN-γ-producing cells early after LM infection in mice (Chang et al., 2007; Plitas et al., 2007). NK1.1+CD11c+ cells or B220+NK1.1+CD11c+ cells have been reported to be multifunctional cells with attributes of both NK cells and DCs, and they are referred to as NK dendritic cells (NKDCs) and IFN-γ-producing killer DCs (IKDCs), respectively (Pillarisetty et al., 2005; Chan et al., 2006; Taieb et al., 2006). The present study confirmed that NK1.1+CD11c+ cells are indeed the primary cellular source of IFN-γ in both the spleen early after LM infection and our in vitro coculture system. However, the results presented here also demonstrate that among normal splenocytes, ∼50% of NK1.1+ NK cells express CD11c antigen along with the CD244, an NK receptor. Hence, the IFN-γ-producing NK1.1+CD11c+CD3− cell is most likely to belong to the NK cell type based on the definition of its surface markers. This conclusion is consistent with that of Laouar et al. (2005). In addition, IKDCs have recently been reported to be as an activated form of NK cells (Blasius et al., 2007; Vosshenrich et al., 2007). Thus, although it cannot be excluded that a particular subset of NK cells may have a DC-like function (Terme et al., 2009), our results show that NK cells are the major source of innate IFN-γ in the spleen, and emphasize the important role of NK cells for the innate response to bacterial infection, as has been proposed by other investigators (Bancroft, 1993; Unanue, 1997; Thale and Kiderlen, 2005).
As a whole, our comparative study of IFN-γ-producing cells in vivo and in vitro reveals that the features of the IFN-γ-producing cells in the spleens early after LM infection resemble to those observed in our in vitro coculture system in which NWNA spleen cells are cultured with dying macrophages resulting from bacterial infection (Kubota, 2006, 2010). In our coculture system, cell-cell interaction between NWNA spleen cells and dying bacterial-infected macrophages plays an important role in inducing IFN-γ. Thus, the similarity between the IFN-γ-producing cells in vitro and in vivo suggests that the cellular microenvironment of our in vitro setting that leads to the production of IFN-γ may reflect the in vivo pathophysiological situation in the spleen early after LM infection.
Our immunohistochemical study showed that in the spleen early after LM infection innate IFN-γ-producing cells form clusters at the same site of the infectious foci located in close vicinity of the MZ. The location of infectious foci reported here is in accordance with that suggested by Jablonska et al. (2007). However, this is in contrast to the results of other investigators that infectious foci were predominantly localized to the T cell zone (Serbina et al., 2003; Muraille et al., 2005; Chang et al., 2007; Aoshi et al., 2008; Kang et al., 2008). The reasons for this discrepancy are not clear, although conflicting data may be due to the different doses of LM injected into mice and the different time points of excising the spleens from mice after LM infection. It is generally considered that LM-infected macrophages first accumulate at the MZ and the red pulp to form MZ infectious foci, followed by the translocation of infected macrophages into the white pulp where they establish secondary infectious foci (Conlan, 1996). Thus, it is most likely that we were mainly observing primary infectious foci formed in close vicinity of the MZ. Other investigators, usually using lower doses of LM bacteria for infection, appear to be observing secondary infectious foci, i.e., infected phagocytes translocated from the MZ into the white pulp (Muraille et al., 2005; Aoshi et al., 2008). In fact, in addition to the preferential existence of infectious foci in close vicinity of the MZ, we also observed some of the bacteria reaching the white pulp. Since both innate and adaptive immune responses are mounted in the spleen upon bacterial infection, our histological observations seem to reflect the complexity of host reactions that are proceeding during LM infection, and the different location of infectious foci may represent distinct stages of innate and adaptive immune responses.
At an early stage of LM infection blood-borne LM is reported to be mainly trapped by macrophages in the MZ (Aichele et al., 2003; Jablonska et al., 2007). Consistent with those reports, our immunohistochemical study showed that at 4-h postinfection most of the bacteria are trapped by ER-TR9+ MZMs. However, at 20-h postoinfection when bacteria multiplied and formed infectious foci, MZMs were found around the infectious foci but most of the bacteria were no longer associated with MZMs. The reason most of the bacteria were not found in MZMs at this time point is not clear at present. Our study comparing IFN-γ-producing cells between in vitro and in vivo suggests a possibility that IFN-γ production in the LM-infected spleen occurs under the microenvironment similar to our in vitro coculture system in which cell death in bacterial-infected macrophages is required for inducing IFN-γ (Kubota, 2006, 2010). Therefore, a plausible explanation may well be that in infectious foci LM-infected MZMs undergo cell death that is associated with the production of IFN-γ by innate lymphocytes (Kubota, 2010). Similarly, Jablonska et al. (2007) have argued that LM-infected MZMs in infectious foci might be killed by bacterium. The rationale for their argument is based on the facts that LM-infected MZMs secrete chemokines, thereby becoming the condensation nucleus of inflammatory cell clusters and that when CCL2 chemokine is depleted by injecting anti-CCL2 Abs into mice, uninfected MZMs are not attracted to infectious foci but also the infected MZMs that should have become the condensation nucleus are undetectable in the infectious foci. Thus, one can envisage that early after LM infection in mice LM bacteria are initially trapped by MZMs in the spleen and then the LM-infected MZMs accumulate at discrete sites of the MZ where they attract inflammatory cells by secreting chemokines and that during this period LM-infected MZMs undergo cell death, thereby triggering attracted innate lymphocytes to produce IFN-γ as proposed previously (Kubota, 2010). One must, however, await further evidence in support of this assumption.
In summary, our study revealed the cellular sources of innate IFN-γ in the spleen early after LM infection and shed light on the dynamic relationships among the IFN-γ-producing cells, bacteria, and MZMs in the LM-infected spleen. Furthermore, this study highlights the importance of the cellular microenvironment in which innate lymphocytes and bacterial-infected macrophages interact and cooperate to produce innate IFN-γ and ultimately to control bacterial infection. Further study using our in vitro coculture system will be instrumental in understanding the cellular microenvironment that leads to the production of innate IFN-γ in vivo early after LM infection.
Conflict of Interest Statement
The authors declare that the research was conducted in the absence of any commercial or financial relationships that could be construed as a potential conflict of interest.
Acknowledgments
This work was partly supported by grants from the Waksman Foundation of Japan and from Kitasato University School of Allied Health Science (Grant-in-Aid for Research Project, No.2010-1017).
References
Aichele, P., Zinke, J., Grode, L., Schwendener, R. A., Kaufmann, S. H. E., and Seiler, P. (2003). Macrophages of the splenic marginal zone are essential for trapping of blood-borne particulate antigen but dispensable for induction of specific T cell responses. J. Immunol. 171, 1148–1155.
Aoshi, T., Zinselmeyer, B. H., Konjufca, V., Lynch, J. N., Zhang, X., Koide, Y., and Miller, M. J. (2008). J. Bacterial entry to the splenic White pulp initiates antigen presentation to CD8+ T cells. Immunity 29, 476–486.
Bancroft, G. J. (1993). The role of natural killer cells in innate resistance to infection. Curr. Opin. Immunol. 5, 503–510.
Bendelic, A., Bonneville, M., and Kearney, J. (2001). Autoreactivity by design: innate B and T lymphocytes. Nat. Rev. 1, 177–186.
Berg, R. E., Crossley, E., Murray, S., and Forman, J. (2005). Relative contributions of NK and CD8 T cells to IFN-γ mediated innate immune protection against Listeria monocytogenes. J. Immunol. 75, 1751–1757.
Berntman, E., Rolf, J., Johansson, C., Anderson, P., and Cardell, S. L. (2005). The role of CD1d-restricted NK T lymphocytes in the immune response to oral infection with Salmonella typhimurium. Eur. J. Immunol. 35, 2100–2109.
Blasius, A. L., Barchet, W., Cella, M., and Colonna, M. (2007). Development and function of murine B220+CD11c+NK1.1+ cells identify them as a subset of NK cells. J. Exp. Med. 204, 2561–2568.
Boles, K. S., Stepp, S. E., Bennett, M., Kumar, V., and Mathew, P. A. (2001). 2B4 (CD244) and CS1: novel members of the CD2 subset of the immunoglobulin superfamily molecules expressed on natural killer cells and other leukocytes. Immunol. Rev. 181, 234–249.
Chan, C. W., Crafton, E., Fan, H.-N., Flook, J., Yoshimura, K., Skarica, M., Brockstedt, D., Dubensky, T. W., Stins, M. F., Lanier, L. L., Pardoll, D. M., and Housseau, F. (2006). Interferon-producing killer dendritic cells provide a link between innate and adaptive immunity. Nat. Med. 12, 207–213.
Chang, S.-R., Wang, K.-J., Lu, Y.-F., Yang, L.-J., Chen, W.-J., Lin, Y.-H., Chang, H.-H., and Wang, S.-L. (2007). Characterization of early gamma interferon (IFN-γ) expression during murine listeriosis: identification of NK1.1+ CD11c+ cells as the primary IFN-γ-expressing cells. Infect. Immun. 75, 1167–1176.
Conlan, J. W. (1996). Early pathogenesis of Listeria monocytogenes infection in the mouse spleen. J. Med. Microbiol. 44, 295–302.
Dijkstra, C. H., Vliet, E. V., Dopp, E. A., Van der Lelij, A. A., and Kraal, G. (1985). Marginal zone macrophages identified by a monoclonal antibody: characterization of immuno- and enzyme-histochemical properties and functional capacities. Immunology 55, 23–30.
Dinarello, C. A., and Fantuzzi, G. (2003). Interleukin-18 and host defense against infection. J. Infect. Dis. 187, S370–S384.
Emoto, M., Miyamoto, M., Emoto, Y., Zerrahn, J., and Kaufmann, S. H. E. (2001). A critical role of T-cell receptor γδ cells in antibacterial protection in mice early in life. Hepatology 33, 887–893.
Frucht, D. M., Fukao, T., Bogdan, C., Schindler, H., O’Shea, J. J., and Koyasu, S. (2001). IFN-γ production by antigen-presenting cells: mechanisms emerge. Trends Immunol. 22, 556–559.
Haas, J. D., Gonzalez, F. H. M., Schmitz, S., Chennupati, V., Fohse, L., Kremmer, E., Forster, R., and Prinz, I. (2009). CCR6 and NK1.1 distinguish between IL-17A and IFN-γ-producing γδ effector T cells. Eur. J. Immunol. 39, 3488–3497.
Hiromatsu, K., Yoshikai, Y., Matsuzaki, G., Ohga, S., Muramori, K., Matsumoto, K., Bluestone, J. A., and Nomoto, K. (1992). A protective role of γ/δ T cells in primary infection with Listeria monocytogenes in mice. J. Exp. Med. 175, 49–46.
Hothcock, K. S. (1998). “T cell enrichment by nonadherent to nylon,” in Current Protocols in Immunology, Vol. 3, ed. J. E. Coligan (New York, NY: John Wiley & Sons Inc.), 2.1.1–2.1.4.
Iyoda, T., Shimoyama, S., Liu, K. K., Omatsu, Y., Akiyama, Y., Maeda, Y., Takahashi, K., Steinman, R. M., and Inaba, K. (2002). The CD8+ dendritic cell subset selectively endocytoses dying cells in culture and in vivo. J. Exp. Med. 195, 1289–1302.
Jablonska, J., Dittmar, K. E., Kleinke, T., Buer, J., and Weiss, S. (2007). Essential role of CCL2 in clustering of splenic ERTR-9+ macrophages during infection of BALB/c mice by Listeria monocytogenes. Infect. Immun. 75, 462–470.
Kang, S.-J., Liang, H.-E., Reizis, B., and Locksley, R. M. (2008). Regulation of hierarchical clustering and activation of innate immune cells by dendritic cells. Immunity 29, 819–833.
Kubota, K. (2006). A novel functional T cell hybridoma recognizes macrophage cell death induced by bacteria: a possible role for innate lymphocytes in bacterial infection. J. Immunol. 176, 7576–7588.
Kubota, K. (2010). Innate IFN-γ production by subsets of natural killer cells, natural killer T cells and γδ T cells in response to dying bacterial-infected macrophages. Scan. J. Immunol. 71, 199–209.
Laouar, Y., Sutterwala, F. S., Gorelik, L., and Flavell, R. A. (2005). Transforming growth factor-β controls T helper type 1 cell development through regulation of natural killer cell interferon-γ. Nat. Immunol. 6, 600–607.
Lin, F., and Whitton, J. L. (2005). Re-evaluating the in vivo cytokine responses of CD8+ T cells during primary and secondary viral infections. J. Immunol. 174, 5936–5940.
Lokmic, Z., Lammermann, T., Sixt, M., Cardell, S., Hallmann, R., and Sorokin, L. (2008). The extracellular matrix of the spleen as a potential organizer of immune cell compartments. Semin. Immunol. 20, 4–13.
Mebius, R. E., and Kraal, G. (2005). Structure and function of the spleen. Nat. Rev. Immunol. 5, 606–616.
Muraille, E., Giannino, R., Guirnalda, P., Leiner, I., Jung, S., Pamer, E. G., and Lauvau, G. (2005). Distinct in vivo dendritic cell activation by live versus killed Listeria monocytogenes. Eur. J. Immunol. 35, 1463–1471.
Parham, P. (eds). (1997). Immunity to Listeria monocytogenes: a model intracellular pathogen. Immunol. Rev. 158, 5-169.
Pillarisetty, V. G., Katz, S. C., Bleier, J. I., Shah, A. B., and DeMatteo, R. P. (2005). Natural killer dendritic cells have both antigen presenting and lytic function and in response to CpG produce IFN-γ via autocrine IL-12. J. Immunol. 174, 2612–2618.
Plitas, G., Chaudhry, U. I., Kingham, T. P., Raab, J. R., and DeMatteo, R. P. (2007). NK dentritic cells are innate immune responders to Listeria monocytogenes infection. J. Immunol. 178, 4411–4416.
Schleicher, U., Hesse, A., and Bogdan, C. (2005). Minute numbers of contaminant CD8+ T cells or CD11b+CD11c+ NK cells are the source of IFN-γ in IL-12/IL-18-stimulated mouse macrophage populations. Blood 105, 1319–1328.
Schroder, K., Hertzog, P. J., Ravasi, T., and Hume, D. A. (2004). Interferon-γ: an overview of signals, mechanisms and functions. J. Leuk. Biol. 75, 163–189.
Serbina, N. V., Salazar-Mather, T. P., Biron, C. A., Kuziel, W. A., and Pamer, E. G. (2003). TNF/iNOS-producing dendritic cells mediate innate immune defense against bacterial infection. Immunity 19, 59–70.
Stewart, C. A., Walzer, T., Robbins, S. H., Malissen, B., Vivier, E., and Prinz, I. (2007). Germ-line and rearranged Tcrd transcription distinguish bona fide NK cells and NK-like γδT cells. Eur. J. Immunol. 37, 1442–1452.
Taieb, J., Chaput, N., Menard, C., Apetoh, L., Ullrich, E., Bonmort, M., Pequignot, M., Casares, N., Terme, M., Flament, C., Opolon, P., Lecluse, Y., Métivier, D., Tomasello, E., Vivier, E., Ghiringhelli, F., Martin, F., Klatzmann, D., Poynard, T., Tursz, T., Raposo, G., Yagita, H., Ryffel, B., Kroemer, G., and Zitvogel, L. (2006). A novel dendritic subset involved in tumor immunosurveillance. Nat. Med. 12, 214–219.
Terme, M., Mingnot, G., Ullrich, E., Bonmort, M., Minard-Colin, V., Jacquet, A., Schultze, J. L., Kroemer, G., Leclerc, C., Chaput, N., and Zitvogel, L. (2009). The dendritic cell-like functions of IFN-producing killer dendritic cells in the CD11b+ subset and are licensed by tumor cells. Cancer Res. 69, 6590–6597.
Thale, C., and Kiderlen, A. F. (2005). Sources of interferon-gamma (IFN-γ) in early immune response to Listeria monocytogenes. Immunobiology 210, 673–683.
Unanue, E. R. (1997). Studies in listeriosis show the strong symbiosis between the innate cellular system and the T-cell response. Immunol. Rev. 158, 11–25.
Vazquez-Boland, J. A., Kuhn, M., Berche, P., Chakraborty, T., Dominguez-Bernal, G., Goebel, W., Gonzalez-Zorn, B., Wehland, J., and Kreft, J. (2001). Listeria pathogenesis and molecular virulence determinants. Clin. Microbiol. Rev. 41, 584–640.
Keywords: cellular microenvironment, interferon-γ, Listeria monocytogenes, macrophage cell death, marginal zone macrophage, natural killer cell, innate lymphocyte
Citation: Kubota K and Kadoya Y (2011) Innate IFN-γ-producing cells in the spleen of mice early after Listeria monocytogenes infection: importance of microenvironment of the cells involved in the production of innate IFN-γ. Front. Immun. 2:26. doi: 10.3389/fimmu.2011.00026
Received: 01 March 2011;
Paper pending published: 28 March 2011;
Accepted: 19 June 2011;
Published online: 04 July 2011.
Edited by:
Murali Krishna Kaja, University of Washington, USAReviewed by:
Timothy J. Sellati, Albany Medical College, USAMark T. Heise, The University of North Carolina, USA
Copyright: © 2011 Kubota and Kadoya. This is an open-access article subject to a non-exclusive license between the authors and Frontiers Media SA, which permits use, distribution and reproduction in other forums, provided the original authors and source are credited and other Frontiers conditions are complied with.
*Correspondence: Koichi Kubota, Department of Microbiology, Kitasato University School of Medicine, 1-15-1 Minami-ku Kitasato, Sagamihara, Kanagawa 252-0374, Japan. email:c2hpbmt1Ym9AbWVkLmtpdGFzYXRvLXUuYWMuanA=