 Vipin Narang
 Shek Yoon Wong Shiang Rong Leong
 Bindu Harish
 Jean-Pierre Abastado*
 Alexandre Gouaillard
- Agency for Science, Technology and Research, Singapore Immunology Network, Singapore
In order to metastasize, cancer cells must undergo phenotypic transition from an anchorage-dependent form to a motile form via a process referred to as epithelial to mesenchymal transition. It is currently unclear whether metastatic cells emerge late during tumor progression by successive accumulation of mutations, or whether they derive from distinct cell populations already present during the early stages of tumorigenesis. Similarly, the selective pressures that drive metastasis are poorly understood. Selection of cancer cells with increased proliferative capacity and enhanced survival characteristics may explain how some transformations promote a metastatic phenotype. However, it is difficult to explain how cancer cells that disseminate can emerge due to such selective pressure, since these cells usually remain dormant for prolonged periods of time. In the current study, we have used in silico modeling and simulation to investigate the hypothesis that mesenchymal-like cancer cells evolve during the early stages of primary tumor development, and that these cells exhibit survival and proliferative advantages within the tumor microenvironment. In an agent-based tumor microenvironment model, cancer cell agents with distinct sets of attributes governing nutrient consumption, proliferation, apoptosis, random motility, and cell adhesion were allowed to compete for space and nutrients. These simulation data indicated that mesenchymal-like cancer cells displaying high motility and low adhesion proliferate more rapidly and display a survival advantage over epithelial-like cancer cells. Furthermore, the presence of mesenchymal-like cells within the primary tumor influences the macroscopic properties, emergent morphology, and growth rate of tumors.
Introduction
Cancer progression is typically described as a multi-step process whereby normal replicating cells undergo a series of progressive mutations that lead to dysregulated proliferation, local invasion, and metastatic dissemination (Fidler and Kripke, 1977; Hanahan and Weinberg, 2000). Metastasis was thought to depend on cancer cells which emerge late in the course of disease progression. However, this view has recently been challenged by data from gene expression profiling and reports that metastatic cells disseminate early during primary tumor progression (Bacac and Stamenkovic, 2008; Eyles et al., 2010). The factors that drive this early dissemination are unclear.
The early acquisition of a metastatic phenotype is probably facilitated by epithelial to mesenchymal transition (EMT) of cancer cells (Gavert and Ben-Ze’ev, 2010), a process which normally occurs during embryogenesis (Kalluri and Weinberg, 2009). Several distinct changes in cell properties take place during EMT, including reduced intercellular adhesion and increased cell motility. A central feature of EMT is the down-modulation of E-cadherin, a cell adhesion molecule (CAM) which binds epithelial cells together through adherens junctions. Cells undergoing EMT exhibit fewer adherens junctions, and can thus delaminate from the normal epithelium (Strumane et al., 2004). Moreover, by up-regulation of alternative adhesion molecules such as beta-integrins, these cells can migrate toward and invade the basement membrane. EMT-like processes are likely to drive the acquisition of a metastatic phenotype by cancer cells (Kalluri, 2009; Gavert and Ben-Ze’ev, 2010) and tumor-infiltrating immune cells have been shown to favor these changes (Santisteban et al., 2009; Toh et al., 2011; Bonde et al., 2012). But the factors which promote EMT and drive dissemination of metastatic cells during early cancer progression remain uncertain.
One possible approach to identifying these factors could be to consider tumor growth from an evolutionary perspective; although cancer cells in a tumor share the same clonal origin, these cells subsequently exhibit genetic and epigenetic heterogeneity (Gonzalez-Garcia et al., 2002; Maley et al., 2006; Merlo et al., 2006). There is a constant selective pressure within the developing tumor that favors cells with survival and proliferative advantages (Merlo et al., 2006; Polyak et al., 2009). This selection process may drive cancer cells toward the acquisition of genotypes and phenotypes that allow the tumor to expand. However, it is currently unclear how these genotypes and phenotypes lead to the development of metastatic cells, since metastatic lesions may outgrow many years after the cancer cells initially disseminate. Characteristics of cancer cells which are advantageous for their survival only in the long term cannot account for their selection in the early stages of cancer. We therefore hypothesized that a mesenchymal-like phenotype might also confer a selective advantage on cancer cells in the early stages of primary tumor development. This hypothesis is however difficult to test using conventional in vivo or in vitro experiments.
In recent years, fusion of computational and biological sciences has led to significant advances in our understanding of biological systems (Brent and Bruck, 2006). Computational approaches have permitted the development of relevant in silico models which support the analysis of complex biological systems (Kohl et al., 2000; Noble, 2008). We therefore sought to determine whether a computational model could be used to identify the early selection advantage conferred by a mesenchymal-like phenotype among primary tumor cells. The growth of a tumor involves complex interactions between cancer cells and their surrounding microenvironment through cell signaling, adhesive forces, and competition for nutrients. Recently, agent-based approaches have proved to be an effective tool for modeling complex biological systems (Bonabeau, 2002; Grimm and Railsback, 2005). An agent-based model (ABM) simulates the actions and interactions of individual entities or agents in order to assess their effects on the system as a whole. Using a set of simple, well-defined rules governing each individual agent on the micro-scale, the emergence of complex patterns at the macro-scale can be successfully simulated. ABM of the tumor microenvironment have already been used in the recent past to study how a tumor emerges as a consequence of interactions between individual cancer cells and their environment (Rejniak and Anderson, 2010).
Here we have used an in silico ABM of tumor to investigate whether mesenchymal-like cancer cells are preferentially selected in an avascular primary tumor. Initial simulations were performed using a homogeneous cell population to determine how the physiological properties of cancer cells (including proliferation and apoptosis rates, random motility, cell–cell adhesion, cell–extracellular matrix (ECM) adhesion) and their nutrient consumption influence the morphology and growth of tumors. Subsequent simulations were performed using heterogeneous tumor cell populations to determine how distinct clones of cancer cells compete in a growing tumor. We show that the subpopulation favored by the selection process within the primary tumor also presents metastatic properties, providing a potential explanation as to why metastasis can be selected at an early stage of tumorigenesis.
Materials and Methods
The model represents a two-dimensional approximation of avascular tumor growth which consists of tumor cells, an ECM region where the tumor cells grow, and the nutrients which support these cells. The ECM is a geometric square 2 mm × 2 mm in size.
Two types of nutrients flow through the ECM, one of which supports cell proliferation, and the other which supports cell survival. Nutrient concentration is defined over a regular 200 × 200 grid. The grid spacing, or lattice constant, is Δ = 10 μm. Nutrients diffuse toward the center of the ECM from hypothetical blood vessels located at top and bottom of the grid, where they have a fixed concentration. The governing equation is derived from Ferreira et al. (2002):
where is nutrient concentration field over positions on the lattice and time t, the subscript i refers to the type of nutrient (i = 1 for proliferation nutrient, i = 2 for survival nutrient), D is nutrient diffusion rate, T is the number of tumor cells near the lattice node at time t, γ is the rate of consumption of nutrient by normal cells, and λ is the factor denoting excess nutrient consumption by tumor cells. Boundary conditions are imposed as constant nutrient concentration at top and bottom:
and semi-infinite boundary conditions are imposed at the left and right boundaries. The diffusion equation is numerically solved at every point (x, y) on the lattice using a finite difference discretization (Kumar, 2001).
Tumor cells are mobile agents with a circular geometry of diameter 10 μm. Tumor cell agents are free to move in any direction over the ECM. The physiological properties of tumor cells which are modeled include their proliferation and apoptosis rates, nutrient consumption rate, random cell motility, cell–cell adhesion, and cell–ECM adhesion. Correspondingly, the state of a tumor cell agent is defined by its subpopulation type (an integer, s ∈ {1, 2, …, S}), mass (m), position velocity cell cycle state, nutrient consumption rate (λ), coefficient of random motility (ξ), coefficient of adhesion with ECM as a friction coefficient (μ; friction is encountered as the cell moves over the ECM), and coefficients of adhesion with cells of various subpopulations (εss′ where s′ ∈ {1, 2, …, S}). Tumor cells belonging to different subpopulations have different sets of values for each of these parameters. Cell movement is determined by the forces acting on a cell. The random Brownian motion of a cell is incorporated in the form of a Langevin equation:
where is a random stochastic force and represents deterministic forces. Each cell’s position at a particular time t is computed using the velocity Verlet algorithm of molecular dynamics (Haile, 1992):
where and are respectively the cell velocity and acceleration. In order to obtain accurate simulation results, the time step Δt is taken as a very small value 0.001 in non-dimensional units, where non-dimensionalization is with respect to the cell time constant Δ2/ξ.
The random stochastic force on a cell is calibrated using experimental observations of a cell’s random walk. Variance of is specified by a parameter ς (in Table 1) and can be adjusted in the model by multiplicative factor ξ representing a cell’s random motility:
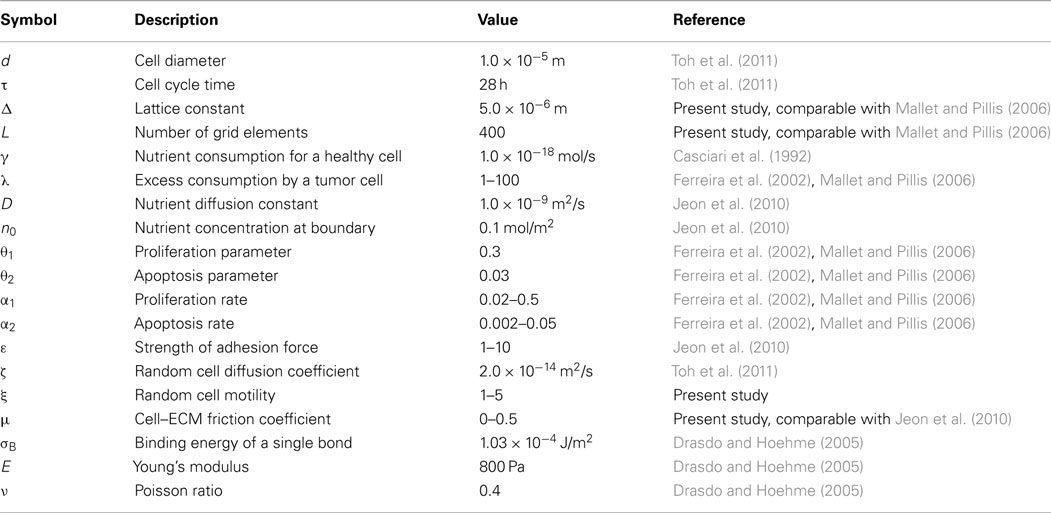
Table 1. Simulation parameters.
represents deterministic forces, which in the present study is intercellular adhesion/repulsion force. These forces describe short range interactions between cells over a distance of one to two cell diameters due to physical contact between their lamellipodia and filopodia protrusions. The attractive component due to formation of bonds via CAMs is described as a sine force:
where r is the distance between cell centers, d is cell diameter, de is the outer diameter of a cell inclusive of lamellipodia and filopodia extensions, and εss′ is the parameter representing strength of intercellular adhesion between cells belonging to subpopulations s and s′. The repulsive component due to elastic deformation upon contact or collision between cells is described using the JKR model (Drasdo and Hoehme, 2005). The pull-off force, Fpulloff, is computed by solving the implicit equations:
where d1 and d2 are the cell diameters, δ denotes the central displacement which measures the deformation of spheres along the axis that joins their centers, E is the Young’s modulus of spheres, ν is the Poisson ratio, and σB is the binding energy of a single bond times the density of surface adhesion molecules in the contact zone. The term a is called the contact radius.
Cells proliferate or undergo apoptosis depending on the locally available nutrient concentration. A cell undergoes mitosis after reaching an age τ (cell cycle time) with a probability Pprolif if there is available space for the daughter cell (Ferreira et al., 2002):
where n1 is the amount of proliferation nutrient near the cell and θ1 is the proliferation parameter. The factor α1 is adjusted to achieve a desired overall proliferation rate, such as about 2% per day as reported in Mehrara et al. (2009). A tumor cell undergoes apoptosis with a probability Papoptosis when there is insufficient survival nutrient in the vicinity (Ferreira et al., 2002):
where n2 is the amount of survival nutrient near the cell and θ2 is the apoptosis parameter. The factor α2 is adjusted to achieve an overall apoptosis rate of about 1/10th of the proliferation rate. Apoptotic cells are immediately removed from the system.
Nutrient diffusion and cell dynamics equations are solved iteratively. The dynamics of nutrients and cells are coupled in the model since nutrient concentration is influenced by consumption, and cells proliferate, sustain, or undergo apoptosis depending upon locally available nutrient concentration. However, since nutrient fields diffuse much faster compared to the motion of cells, the time step for computing nutrients is much smaller compared to that for computing cell dynamics. This allows uncoupling where cell dynamics and nutrient diffusion equations can be solved alternately.
Tumor growth is simulated beginning with a single tumor cell. Nutrient concentrations are initially uniform over the entire ECM, equal to the concentration value at the blood vessels situated at top and bottom of the ECM. As the simulation progresses, the following observations are obtained from the model: (i) numbers of cells of various population types, (ii) snapshots or images of tumor morphology, (iii) nutrient concentrations over the ECM. These observations are collected at regular intervals during simulated tumor growth. Tumor morphology is a qualitative attribute which was classified into one of three distinct categories based on visual evaluation – compact morphology (where tumor cells adhere together forming a single mass), multinodular morphology (where tumor cells form more than one solid mass), and diffuse morphologies (where tumor cells spread and are unable to form a mass).
Results
The model described in Section “Materials and Methods” was used to simulate avascular tumor growth in vivo in two different scenarios. In the first instance, all cancer cell agents in the tumor were identical and displayed the same phenotype, i.e., they employed the same coefficients of nutrient consumption, proliferation, apoptosis, motility, cell–cell adhesion, and cell–ECM adhesion. In the second case, the cancer cell agents were initially of the same phenotype, but after the tumor had grown to a certain size, one of the cancer cells mutated toward a different phenotype. If the mutated cell was able to survive and proliferate, the two different cell lineages then grew in parallel within the same tumor microenvironment. The simulation results are reported below.
Individual Cell Characteristics Determine Tumor Morphology
Figures 1 and 2 show the growth rates and morphologies of tumors that emerge from in silico simulations in which all cancer cell agents are identical. The properties of cancer cell agents are reflected in the parameter values of their nutrient consumption rate (λ), random cell motility (ξ), cell–cell adhesion strength (ε), and cell–ECM adhesion strength (μ). These parameters were then varied in turn across the simulations (only one parameter was altered at any time while keeping the other variables constant in order to study the contributions of individual cellular attributes).
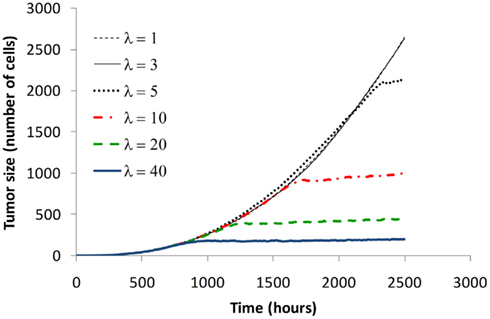
Figure 1. Effect of nutrient consumption on tumor growth rate. The figure shows typical growth curves obtained by varying nutrient consumption rate λ. Increased nutrient consumption rates lead to smaller tumors. For very low nutrient consumption rate, tumor growth does not plateau.
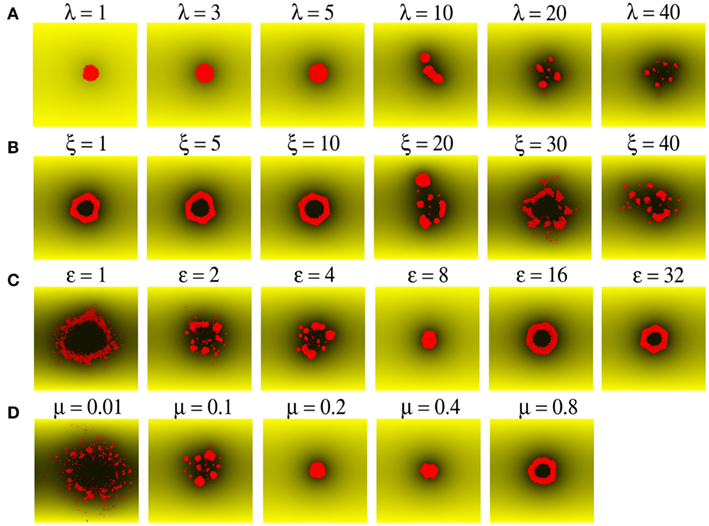
Figure 2. Morphology of the emergent tumor is a function of the properties of simulated cancer cell agents. (A) Tumor size is limited by λ, the rate of nutrient consumption by cancer cells (shown as small red circles). Nutrient concentration in a region is indicated by the shade of yellow color, with black indicating zero concentration. (B) Tumor morphology transitions from compact to multinodular upon increasing random motility of cells ξ. (C,D) Increasing cell–cell adhesion ε, and/or cell–ECM adhesion μ, restricts the mobility of cells, and leads to a transition from a diffuse to a multinodular and finally to a compact morphology.
Figure 1 shows how the growth rate and the final size of a tumor changes as the nutrient consumption rate of cancer cell agents is gradually increased from 1 to 40 times that of a normal cell. As cancer cell agents consume more nutrients, the tumor changes from an unrestricted growing mass (λ = 1, 3) to one which reaches a maximum size (λ ≥ 5). This growth plateau is typical of avascular tumors prior to angiogenic switch (the point at which the tumor initiates angiogenesis to draw extra nutrients from the host).
Figure 2A shows the variation in tumor morphology with altered nutrient consumption rate among cancer cells. The amount of nutrients available at a certain position is depicted by the intensity of yellow shading, where shades close to black denote nutrient depletion. It can be observed that nutrient is in plentiful supply (no black shades) when consumption rate is low (λ = 1, 3). However, nutrient is depleted in the vicinity of cancer cell agents when the consumption rate is high (λ ≥ 5). Few cells are able to survive in regions of low nutrient availability. Accordingly, cancer cell agents in our model were programmed to undergo apoptosis with a high probability when local nutrient supplies were no longer sufficient. As a result, both tumor size and frequency of cancer cell agents depend on the rate of nutrient consumption by the cancer cell agents. Tumor growth is arrested when nutrient is depleted in regions surrounding the cancer cell agents, which can be seen as dark patches in Figure 2A for consumption rate λ ≥ 5.
Another factor which determines tumor size and morphology is the mobility of cancer cell agents, which allows agent migration to locations where more nutrients are available. The movement of cancer cell agents in the system is determined by three factors: their inherent random motility (ξ), cell–cell adhesion (ε), and cell–ECM adhesion (μ). The effect of varying these parameters is shown in Figures 2B–D. Random motility refers to the propensity of cells to move over the ECM, which is measured here in nano-Newtons to represent Brownian motion of cells under the influence of a stochastic force. As seen in Figure 2B, if cancer cell agents are less motile (ξ = 1, 5, 10 nN), they tend to aggregate, resulting in compact tumor morphology with or without hollow core. However, when cell motility increases, the tumor can either grow as a multinodular structure (ξ = 20, 30, 40 nN; Figure 2B) or can form diffuse clusters of cells (see below). The random motility of cancer cell agents can however be restricted by cell–cell and cell–ECM adhesion. Figure 2C shows the effect of increasing cell–cell adhesion in a case where cancer cell agents have high motility (ξ = 20 nN) and would thus tend to migrate away (ε = 1 nN). With these motile cell agents, increasing the strength of cell–cell adhesion leads to a transition in tumor morphology from diffuse cluster (ε = 1 nN) to a multinodular tumor (ε = 2, 4 nN) and finally to a compact tumor (ε = 8, 16, 32 nN). As shown in Figure 2D, a similar tendency to change tumor morphology from a diffuse cluster to multinodular and then to a compact tumor is observed upon increasing cell–ECM adhesion or friction from very weak (μ = 0.01) to strong adhesion (μ = 0.8).
Taken together, these simulation data show that multiple parameters, including nutrient consumption rate, access to nutrients, intrinsic motility, cell–cell adhesion, and cell–ECM adhesion influence tumor growth and morphology.
Interplay between Individual Cell Characteristics for Multinodular Growth
In order to understand the interplay between random cell motility, cell–cell adhesion, and cell–ECM adhesion, extensive simulations were performed scanning a wide range of parameter space. Figure 3 shows observed tumor morphology against various parameter values. Diffuse and multinodular tumors were observed only under conditions of low cell–ECM adhesion or friction (μ = 0.01, 0.1, and 0.2), whereas at higher values of cell–ECM adhesion (μ ≥ 0.4) tumor morphology was compact. For a fixed value of random motility and cell–cell adhesion, the morphology may gradually transition from diffuse, to multinodular, and finally to compact as cell–ECM adhesion increases. For example, where random motility is ξ = 10 nN and cell–cell adhesion is ε = 1 nN, tumor morphology changes from diffuse, to multinodular, and then to compact as cell–ECM adhesion increases from μ = 0.01 to 0.2.
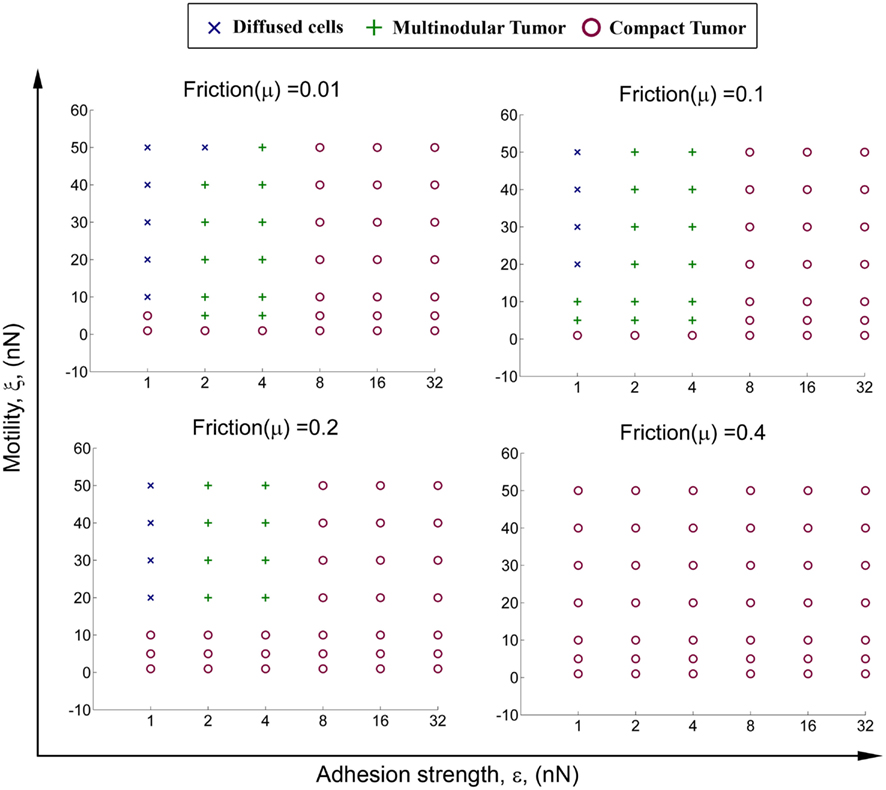
Figure 3. Transition of tumor morphology from diffuse to multinodular to compact. The figure shows change in morphology upon varying the properties of cancer cells, including random cell motility ξ, cell–cell adhesion ε, and cell–ECM adhesion (friction) μ. Cells with high motility and low cell–cell and cell–ECM adhesion result in a diffuse or multinodular tumor, whereas cells with low motility and high cell–cell and cell–ECM adhesion result in a compact tumor. In all of these simulations the rate of nutrient consumption λ is equal to 10.
Similarly, for a fixed value of cell–ECM adhesion μ, tumor morphology may gradually transition from diffuse, to multinodular, and then to compact as cell–cell adhesion ε increases, or as random cell motility ξ decreases. Where cell–ECM adhesion is μ = 0.1 and cell–cell adhesion is ε = 1 nN, tumor morphology changes from diffuse, to multinodular, and then to compact as random motility decreases from ξ = 20 to 1 nN. When random motility is fixed at ξ = 20 nN, tumor morphology changes from diffuse, to multinodular, to compact as cell–cell adhesion increases from ε = 1 to 8 nN.
In conclusion, there is a transition in simulated tumor morphology as parameters representing cancer cell properties are varied. Moreover, while compact growth can be observed for many different values of μ (cell–ECM adhesion) and ε (cell–cell adhesion), multinodular tumors arise only when cancer cell agents exhibit low to moderate cell–cell and cell–ECM adhesion.
Growth Rates of Tumors with Homogenous Cell Populations
We next compared the growth rates of multinodular and compact tumors to determine whether either of these distinct morphologies was favored by selective pressure. Figure 4 shows the growth rates of tumors for the set of simulations in which μ = 0.1, ξ = 20 nN, and cell–cell adhesion ε varies between 2 and 32 nN. As described above, under these conditions, simulated tumor morphology changes from multinodular to compact as cell–cell adhesion increases. Figure 4 shows that tumor growth is exponential at early time points but quickly starts to plateau for both compact and multinodular morphologies. While compact morphology imposed a maximum growth limit on developing tumors, multinodular tumors were able to overcome this growth plateau and continued linear increases in size.
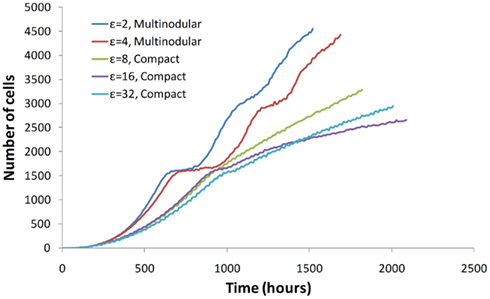
Figure 4. The growth rate of a tumor depends on the properties of cancer cells and on tumor morphology. Initially all tumors grow exponentially and with time their growth plateaus. However, multinodular tumors can initiate new phases of growth at a linear rate.
These observations may be interpreted as follows; initially all cancer cell agents have free access to space and nutrients, hence all cancer cells are able to proliferate and tumor growth is exponential. As the tumor grows larger, cell agents within the tumor proliferate more slowly due to restricted space and limited nutrients, thus tumor growth begins to plateau. The maximum size of a tumor is subsequently reached when nutrient consumption by cell agents exceeds the incoming supply from local blood vessels. Whereas a compact tumor is forced to stop growing at this stage, the low adhesion/high motility agents within multinodular tumors can migrate out of the stagnated nodule to access additional space and nutrients. Cells leaving a nodule can then proliferate to form new satellite nodules, allowing a multinodular tumor to grow in an unrestricted fashion.
These results indicate that tumor growth rate is intricately linked with tumor morphology. While compact tumors eventually reach a growth plateau, multinodular tumor growth slows when nutrients are limiting but does not plateau. These data suggest that cancer cells which form a multinodular tumor may have a selective advantage over those which grow as a compact tumor.
Tumor Growth with Heterogeneous Cell Populations
Tumors are made up of heterogeneous cancer cell populations and competing clones (Gatenby and Gillies, 2008). Based on the results shown in Sections “Interplay Between Individual Cell Characteristics for Multinodular Growth” and “Growth Rates of Tumors with Homogenous Cell Populations,” we next modeled two types of cancer cells: epithelial-like cancer cells with properties of low motility and high adhesion (which form compact tumors), and mesenchymal-like cancer cells with properties of high motility and low adhesion (which form multinodular tumors). We then tested whether mesenchymal-like cancer cells could outcompete epithelial-like cancer cells in the tumor microenvironment.
We modeled genetic instability of cancer cells using the assumption that tumor cells are initially identical and epithelial-like, but 14 days after tumor initiation, when the tumor consists of 50 cells, one of the cancer agents (selected randomly) mutates to become mesenchymal-like. The time point of 14 days corresponds to the time where we observed cancer cell dissemination in mouse model of spontaneous melanoma (Eyles et al., 2010). After this isolated mutation event, there are no further mutations and tumor growth is allowed to continue normally. The mutant mesenchymal-like cell must initially compete against 49 epithelial-like cells and undergo clonal expansion to generate additional mesenchymal-like cells to populate the tumor microenvironment.
Simulations were performed with five different types of epithelial-like cells (labeled E1 to E5) and four different types of mesenchymal-like cells (labeled M1 to M4). The parameter values describing their random motility, cell–cell adhesion, and cell–ECM adhesion are shown in Table 2. The strength of cell–cell adhesion between cells of different types is 1 nN. Figure 5 shows the growth rates of epithelial-like (red) and mesenchymal-like (blue) populations. In the majority of the simulations, it can be seen that the mesenchymal-like population becomes dominant within a few hundred hours after the mutation event.
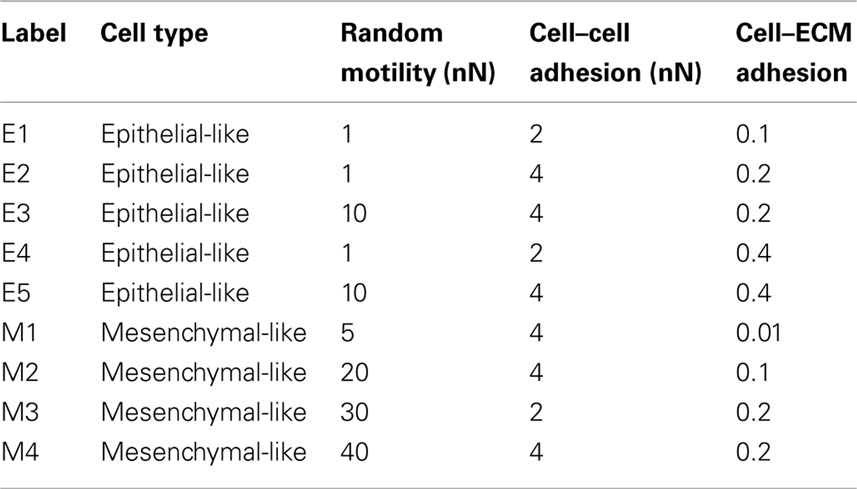
Table 2. Parameter values for epithelial-like and mesenchymal-like cancer cells in simulations of tumor growth with heterogeneous cell populations.
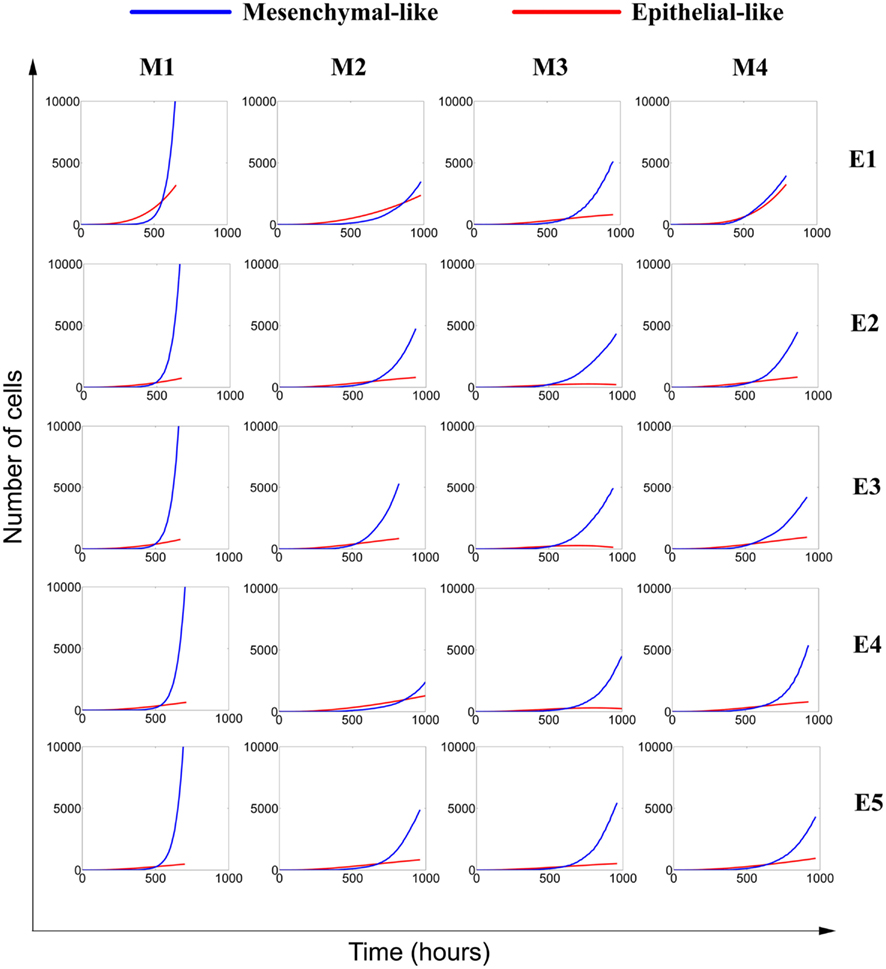
Figure 5. Competition between epithelial-like and mesenchymal-like cells in a growing avascular tumor. Tumor growth initially begins as a homogenous mass of epithelial-like cells with low motility and high adhesion. When the tumor includes 50 cells, one of the cells randomly mutates into a mesenchymal-like cell with high motility and low adhesion. The mesenchymal cell generates its own lineage and competes with epithelial-like cells in the tumor microenvironment. Though all cells have the same proliferation and apoptosis rates, mesenchymal-like cells dominate the tumor due to their greater mobility. Five types of epithelial-like cells (E1–E5) and four types of mesenchymal-like cells (M1–M4) were paired in 20 different simulations (Table 2).
Figure 6 shows the morphologies of simulated tumors corresponding to the cases shown in Figure 5. Epithelial-like cells (red) and mesenchymal-like cells (blue) are shown. The Figure indicates that epithelial-like cells and mesenchymal-like cells typically grow side-by-side as two separate clumps of cells. Note that although the epithelial-like and the mesenchymal-like cells have identical proliferation and apoptosis rates in these simulations, the mesenchymal-like cells are able to grow more rapidly due to their higher mobility, which provides access to more space and additional nutrients to support expansion. In addition, careful examination indicates that in many instances, mesenchymal-like cells surround the epithelial cells and effectively starve these clones of space and nutrients to slow their growth.
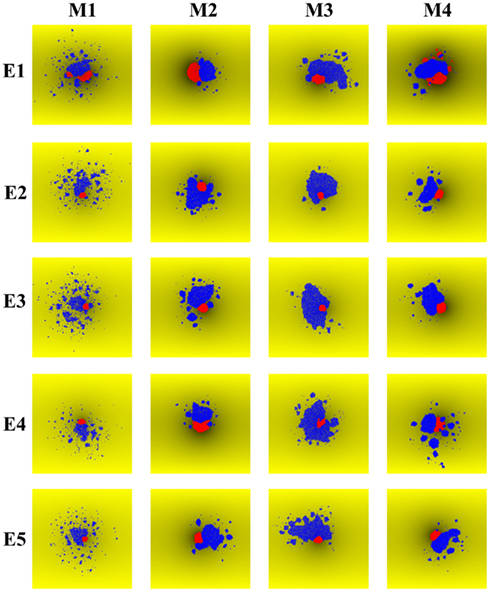
Figure 6. Morphologies resulting from simulated competition between epithelial-like cells and mesenchymal-like cells in a growing avascular tumor. The tumors correspond to the same 20 simulations shown in Figure 5, with five kinds of epithelial-like cells (E1–E5) and four kinds of mesenchymal-like cells (M1–M4) paired together. Epithelial-like (red) and mesenchymal-like (blue) cells usually grow as separate lumps. However, mesenchymal cells are more mobile and often surround the epithelial cells to starve them of space and nutrients, further slowing the growth of epithelial-like cells.
Similar results were obtained when mesenchymal transition was allowed at 65 days after tumor initiation (1 mesenchymal for 200 epithelial cells). These simulation data indicate that even a single mesenchymal-like cancer cell mutant can survive in the early tumor and will eventually come to dominate the entire tumor cell population. Mesenchymal-like cancer cells thus have greater proliferative potential and survival characteristics in the developing tumor and may therefore exhibit a selection advantage over competing epithelial-like cancer cells.
Discussion
In the current report, we used an in silico model to demonstrate that cancer cells with a mesenchymal-like phenotype (low adhesion, high motility) have a survival and proliferative advantage in the microenvironment of an avascular tumor (Figure 7).
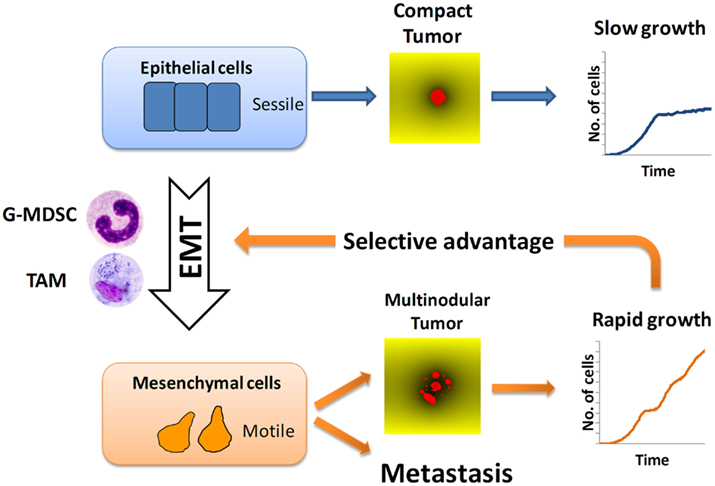
Figure 7. Selection of metastatic cancer cells. Tumor-infiltrating macrophages (TAM) and granulocytic myeloid-derived suppressor cells (G-MDSC) promote epithelial-mesenchymal transition (EMT) of cancer cells. Mesenchymal cancer cells (low adhesion and high motility) give rise to rapidly growing tumors with multinodular morphology. This growth advantage explains the superior aggressiveness of multinodular tumors. It also predicts that, under conditions of limited access to nutrients, cancer cells with strong metastatic propensity will be selected.
Our model shows that tumor morphology is determined by the properties of individual cancer cells and by nutrient distribution. Conversely, tumor morphology may provide information on individual cancer cells and the prevailing growth conditions within that tumor. Multinodular morphology is favored by high random cell motility and low cell–cell and cell–ECM adhesion, which are attributes of mesenchymal cells, whereas compact tumor morphology is favored by low random cell motility and high cell adhesion, which are characteristics of epithelial cells. Competition for nutrients is also necessary for the emergence of multinodular tumor morphology. This finding is in agreement with evidence from the literature showing that mesenchymal transition and nutrient depletion are linked to multinodular tumor formation and metastasis: for example, increased risk of metastasis has been associated with multinodular tumors (Fasani et al., 1999). Furthermore, in hepatocellular carcinoma (HCC) it has been observed that hypoxia induced by treatment with tumor necrosis factor-α-converting enzyme stimulates the growth of HCC cells and promotes tumor multinodularity and metastasis (Song et al., 2001). Similarly, increased numbers of tumor nodules and accelerated metastasis were observed in mice treated with drugs that inhibit tumor angiogenesis (Ebos et al., 2009; Paez-Ribes et al., 2009). Our model explains that antiangiogenic treatments, which aim at starving tumors, favor the emergence of more aggressive variants with increased propensity to metastasize.
The fitness of epithelial-like and mesenchymal-like cancer cells was compared using two types of in silico simulation. Firstly, we showed that multinodular tumors have a proliferative and survival advantage over compact tumors. The growth of compact tumors reaches a plateau dues to nutrient depletion, whereas multinodular continue to grow. The reason behind this is that mesenchymal-like cancer cells can escape out of individual nodules which have stopped growing and gain access to nutrients in neighboring regions, supporting the formation of new nodules. The mesenchymal-like cancer cells which form multinodular tumors therefore appear to exhibit greater fitness (i.e., ability to survive and proliferate) when compared with the epithelial-like cancer cells which form compact tumors. Secondly, in simulation experiments where epithelial and mesenchymal populations of cancer cells were allowed to compete in the same tumor microenvironment, we found that mesenchymal-like cancer cells usually came to dominate the tumor. Thus, if it is possible for a mesenchymal-like cancer cell to emerge in a tumor as a consequence of a single mutation event, then it may be possible for that cell to proliferate and establish a new dominant lineage. This would suggest that EMT, which is linked to metastatic progression (Kalluri, 2009; Gavert and Ben-Ze’ev, 2010) might be favored early during the development of avascular primary tumors. It would explain recent studies showing that cancer cell dissemination is an early event in tumor development (Husemann et al., 2008; Eyles et al., 2010). Importantly, it may also explain the paradox of metastatic cell selection despite prolonged metastatic dormancy. Our simulations show that cancer cells with metastatic potential are selected because they have a growth advantage within the primary tumor.
The greater ability of mesenchymal-like cancer cells to proliferate and survive is consistent with the observed association between primary tumor size and increased risk of metastasis which underlies the TNM staging system (Duffey et al., 2004; Giordano et al., 2004). Since mesenchymal-like cells are linked to both metastasis and multinodular tumors, which can grow in an unrestricted fashion, a positive correlation between tumor size and metastasis is predictable, despite the observation that dissemination is an early event.
In summary, the findings reported here using in silico simulations provide potential explanations for the propensity of multinodular tumors to undergo metastasis, and may clarify how metastatic cells could emerge early in an avascular tumor. Each of the above individual observations is consistent with the concept that EMT confers a selective advantage on cancer cells in a tumor with restricted access to nutrients.
Conflict of Interest Statement
The authors declare that the research was conducted in the absence of any commercial or financial relationships that could be construed as a potential conflict of interest.
Acknowledgments
The authors thank Benjamin Toh for helpful discussions and Neil McCarthy for help in editing the manuscript.
References
Bonabeau, E. (2002). Agent-based modeling: methods and techniques for simulating human systems. Proc. Natl. Acad. Sci. U.S.A. 99(Suppl. 3), 7280–7287.
Bonde, A. K., Tischler, V., Kumar, S., Soltermann, A., and Schwendener, R. (2012). Intratumoral macrophages contribute to epithelial-mesenchymal transition in solid tumors. BMC Cancer 12, 35. doi: 10.1186/1471-2407-12-35
Brent, R., and Bruck, J. (2006). 2020 computing: can computers help to explain biology? Nature 440, 416–417.
Casciari, J. J., Sotirchos, S. V., and Sutherland, R. M. (1992). Variations in tumor cell growth rates and metabolism with oxygen concentration, glucose concentration, and extracellular pH. J. Cell. Physiol. 151, 386–394.
Drasdo, D., and Hoehme, S. (2005). A single-cell-based model of tumor growth in vitro: monolayers and spheroids. Phys. Biol. 2, 133–147.
Duffey, B. G., Choyke, P. L., Glenn, G., Grubb, R. L., Venzon, D., Linehan, W. M., and Walther, M. M. (2004). The relationship between renal tumor size and metastases in patients with von Hippel-Lindau disease. J. Urol. 172, 63–65.
Ebos, J. M., Lee, C. R., Cruz-Munoz, W., Bjarnason, G. A., Christensen, J. G., and Kerbel, R. S. (2009). Accelerated metastasis after short-term treatment with a potent inhibitor of tumor angiogenesis. Cancer Cell 15, 232–239.
Eyles, J., Puaux, A.-L., Wang, X., Toh, B., Prakash, C., Hong, M., Tan, T. G., Zheng, L., Ong, L. C., Jin, Y., Kato, M., Prévost-Blondel, A., Chow, P., Yang, H., and Abastado, J.-P. (2010). Tumor cells disseminate early, but immunosurveillance limits metastatic outgrowth, in a mouse model of melanoma. J. Clin. Invest. 120, 2030–2039.
Fasani, P., Sangiovanni, A., De Fazio, C., Borzio, M., Bruno, S., Ronchi, G., Del Ninno, E., and Colombo, M. (1999). High prevalence of multinodular hepatocellular carcinoma in patients with cirrhosis attributable to multiple risk factors. Hepatology 29, 1704–1707.
Ferreira, S. C., Martins, M. L., and Vilela, M. J. (2002). Reaction-diffusion model for the growth of avascular tumor. Phys. Rev. E 65, 021907.
Fidler, I. J., and Kripke, M. L. (1977). Metastasis results from preexisting variant cells within a malignant tumor. Science 197, 893–895.
Gatenby, R. A., and Gillies, R. J. (2008). A microenvironmental model of carcinogenesis. Nat. Rev. Cancer 8, 56–61.
Gavert, N., and Ben-Ze’ev, A. (2010). Coordinating changes in cell adhesion and phenotype during EMT-like processes in cancer. F1000 Biol. Rep. 2, 86.
Giordano, S. H., Buzdar, A. U., Smith, T. L., Kau, S. W., Yang, Y., and Hortobagyi, G. N. (2004). Is breast cancer survival improving? Cancer 100, 44–52.
Gonzalez-Garcia, I., Sole, R. V., and Costa, J. (2002). Metapopulation dynamics and spatial heterogeneity in cancer. Proc. Natl. Acad. Sci. U.S.A. 99, 13085–13089.
Grimm, V., and Railsback, S. F. (2005). Individual-Based Modeling and Ecology. New Jersey: Princeton University Press.
Haile, J. M. (1992). Molecular Dynamics Simulation: Elementary Methods. New York: John Wiley and Sons.
Husemann, Y., Geigl, J. B., Schubert, F., Musiani, P., Meyer, M., Burghart, E., Forni, G., Eils, R., Fehm, T., Riethmuller, G., and Klein, C. A. (2008). Systemic spread is an early step in breast cancer. Cancer Cell 13, 58–68.
Jeon, J., Quaranta, V., and Cummings, P. T. (2010). An off-lattice hybrid discrete-continuum model of tumor growth and invasion. Biophys. J. 98, 37–47.
Kalluri, R. (2009). EMT: when epithelial cells decide to become mesenchymal-like cells. J. Clin. Invest. 119, 1417–1419.
Kalluri, R., and Weinberg, R. A. (2009). The basics of epithelial-mesenchymal transition. J. Clin. Invest. 119, 1420–1428.
Kohl, P., Noble, D., Winslow, R. L., and Hunter, P. J. (2000). Computational modelling of biological systems: tools and visions. Philos. Trans. R. Soc. Lond. A 358, 579–610.
Kumar, A. (2001). A discretization of the n–dimensional Laplacian for a dimension–independent stability limit. Proc. R. Soc. Lond. A 457, 2667–2674.
Maley, C. C., Galipeau, P. C., Finley, J. C., Wongsurawat, V. J., Li, X., Sanchez, C. A., Paulson, T. G., Blount, P. L., Risques, R. A., Rabinovitch, P. S., and Reid, B. J. (2006). Genetic clonal diversity predicts progression to esophageal adenocarcinoma. Nat. Genet. 38, 468–473.
Mallet, D. G., and Pillis, L. G. D. (2006). A cellular automata model of tumor-immune system interactions. J. Theor. Biol. 239, 334–350.
Mehrara, E., Forssell-Aronsson, E., Ahlman, H., and Bernhardt, P. (2009). Quantitative analysis of tumor growth rate and changes in tumor marker level: specific growth rate versus doubling time. Acta Oncol. 48, 591–597.
Merlo, L. M., Pepper, J. W., Reid, B. J., and Maley, C. C. (2006). Cancer as an evolutionary and ecological process. Nat. Rev. Cancer 6, 924–935.
Noble, D. (2008). Computational models of the heart and their use in assessing the actions of drugs. J. Pharmacol. Sci. 107, 107–117.
Paez-Ribes, M., Allen, E., Hudock, J., Takeda, T., Okuyama, H., Vinals, F., Inoue, M., Bergers, G., Hanahan, D., and Casanovas, O. (2009). Antiangiogenic therapy elicits malignant progression of tumors to increased local invasion and distant metastasis. Cancer Cell 15, 220–231.
Polyak, K., Haviv, I., and Campbell, I. G. (2009). Co-evolution of tumor cells and their microenvironment. Trends Genet. 25, 30–38.
Rejniak, K. A., and Anderson, A. R. A. (2010). Hybrid models of tumor growth. Wiley Interdiscip. Rev. Syst. Biol. Med. 3, 115–125.
Santisteban, M., Reiman, J. M., Asiedu, M. K., Behrens, M. D., Nassar, A., Kalli, K. R., Haluska, P., Ingle, J. N., Hartmann, L. C., Manjili, M. H., Radisky, D. C., Ferrone, S., and Knutson, K. L. (2009). Immune-induced epithelial to mesenchymal transition in vivo generates breast cancer stem cells. Cancer Res. 69, 2887–2895.
Song, B. C., Chung, Y. H., Kim, J. A., Lee, H. C., Yoon, H. K., Sung, K. B., Yang, S. H., Yoo, K., Lee, Y. S., and Suh, D. J. (2001). Association between insulin-like growth factor-2 and metastases after transcatheter arterial chemoembolization in patients with hepatocellular carcinoma: a prospective study. Cancer 91, 2386–2393.
Strumane, K., Berx, G., and Roy, F. (2004). “Cadherins in cancer,” in Handbook of Experimental Pharmacology, Vol. 165, eds J. Behrens, and W. J. Nelson (Berlin: Springer-Verlag), 69–103.
Toh, B., Wang, X., Keeble, J., Sim, W. J., Khoo, K., Wong, W.-C., Kato, M., Prevost-Blondel, A., Thiery, J.-P., and Abastado, J.-P. (2011). Mesenchymal transition and dissemination of cancer cells is driven by myeloid-derived suppressor cells infiltrating the primary tumor. PLoS Biol. 9, e1001162. doi: 10.1371/journal.pbio.1001162
Keywords: tumor microenvironment, epithelial to mesenchymal transition, agent-based modeling and simulation, complex systems
Citation: Narang V, Wong SY, Leong SR, Harish B, Abastado J-P and Gouaillard A (2012) Selection of mesenchymal-like metastatic cells in primary tumors – an in silico investigation. Front. Immun. 3:88. doi: 10.3389/fimmu.2012.00088
Received: 14 February 2012; Accepted: 05 April 2012;
Published online: 27 April 2012.
Edited by:
Catherine Sautes-Fridman, UMRS, FranceReviewed by:
Catherine Sautes-Fridman, UMRS, FranceMansour Mohamadzadeh, University of Florida, USA
Copyright: © 2012 Narang, Wong, Leong, Harish, Abastado and Gouaillard. This is an open-access article distributed under the terms of the Creative Commons Attribution Non Commercial License, which permits non-commercial use, distribution, and reproduction in other forums, provided the original authors and source are credited.
*Correspondence: Jean-Pierre Abastado, Agency for Science, Technology and Research, Singapore Immunology Network, 8A Biomedical Grove, #06-04, Immunos, Singapore 138648. e-mail:YWJhc3RhZG9AaW1tdW5vbC5hLXN0YXIuZWR1LnNn