


- Division of Immunology, Department of Medicine, Weill Cornell Medical College, New York, NY, USA
To explore the role of interleukin-2 (IL-2) in T cell proliferation, and to circumvent the IL-2 deficiency autoimmune syndrome of conventional il2 gene deletion, mice were created to allow conditional il2 gene deletion when treated with the estrogen analog, tamoxifen (TAM) as adults. Splenocytes from four different mouse strains, C57Bl/6 wild type (WT), conventional IL-2(−/−), TAM-treated Cre recombinase-negative (Cre−)/IL2fl/fl, and Cre recombinase-positive (Cre+)/IL2fl/fl, were activated with anti-CD3 and anti-CD28, and monitored for CD4+ and CD8+ T cell lymphocyte blastogenesis, aerobic glycolysis, BrdU incorporation into newly synthesized DNA, and CFSE dye dilution to monitor cell division. IL-2 production was monitored by quantitative ELISA and multiple additional cytokines were monitored by quantitative protein-bead arrays. Splenocytes from conventional IL-2(−/−) and TAM-treated Cre+ mice resulted in undetectable IL-2 production by ELISA, so that both strains were IL-2-deficient. As monitored by flow cytometry, activated CD4+ and CD8+ T cells from WT, Cre+, and Cre− mice all underwent blastogenesis, whereas far fewer cells from conventional IL-2(−/−) mice did so. By comparison, only cells from IL-2 sufficient WT and Cre− mice switched to aerobic glycolysis as evidenced by a drop in media pH. Blastogenesis was mirrored by BrdU incorporation and CFSE dye dilution by CD4+ and CD8+ T cells from WT, Cre+, and Cre− mice, which were all equivalent, while proliferation of cells from conventional IL-2(−/−) mice was compromised. Splenocytes from IL-2 deficient conventional IL-2(−/−) mice produced low or undetectable other γc-chain cytokines (IL-4, IL-7, IL-9, IL-13, IL-15, and IL-21), whereas production of these γc-chain cytokines from IL-2-deficient conditional IL-2(−/−) Cre+ mice were comparable with WT and Cre− mice. These results indicate that CD4+ and CD8+ T cell blastogenesis cannot be attributable to IL-2 alone, but a switch to aerobic glycolysis was attributable to IL-2, and proliferation after CD3/CD28 activation is dependent on γc-chain cytokines, and not CD3/28 triggering per se.
Introduction
With the discovery and purification to homogeneity of the first leukocytotrophic hormone, interleukin-2 (IL-2; Smith et al., 1983), and its receptor (IL-2R; Robb et al., 1981) almost 30 years ago, definitive in vitro reductionist experiments became possible for the first time using purified homogeneous IL-2 and cloned T cells (Baker et al., 1979), together with monoclonal antibodies (MoAbs) reactive with both IL-2 (Smith et al., 1983) and the IL-2 receptor (IL-2R; Leonard et al., 1982). These experiments established that although antigen initiates T cell activation, the T cell proliferative response is mediated by the antigen non-specific IL-2/IL-2R interaction (Cantrell and Smith, 1984; Meuer et al., 1984). Furthermore, in vitro differentiation of both helper and cytolytic T lymphocytes (HTL and CTL) is also dependent on the IL-2/IL-2R interaction (Baker et al., 1978; Seder et al., 1994). Moreover, only four variables were found necessary for T cell proliferation and differentiation: the affinity of the IL-2/IL-2R interaction, the IL-2 concentration, the density of the IL-2Rs/cell, and the duration of the IL-2/IL-2R interaction (Cantrell and Smith, 1984).
Based on these in vitro results, it was anticipated that profound immunodeficiency would result from the deletion of the IL-2 genes via homologous recombination [IL-2(−/−)]. However, the initial experiments revealed only a moderate deficiency, in that the IL-2(−/−) in vitro T cell proliferative responses to mitogenic lectins was still 1/3 that of wild type (WT) T cells, rather than absent altogether (Schorle et al., 1991). Subsequent experiments showed that upon infection with lymphocytic choriomeningitis virus (LCMV), the generation of virus-specific CTL was reduced by 60–90% (Kundig et al., 1993; Cousens et al., 1995). However, IL-2(−/−) animals still cleared the virus and recovered from the initial infection. Subsequent reports using LCMV infection of mixed bone marrow chimeras of WT and IL-2Rα(−/−) mice, revealed that primary immune responses of the IL-2Rα(−/−) T cells were largely intact, but secondary immune responses to LCMV were markedly deficient and the generation of immunological memory was impaired (Williams et al., 2006).
All of the experimental approaches that created an IL-2 deficiency during both prenatal and postnatal development eventually led to a peculiar syndrome characterized by a paradoxical slow accumulation of activated T cells in both lymphoid and non-lymphoid tissues (Sadlack et al., 1993; Horak et al., 1995; Klebb et al., 1996). Therefore, even though these mice were immunodeficient, as they matured they began to suffer from autoimmune phenomena, and they ultimately succumbed prematurely due to disorders such as autoimmune hemolytic anemia and inflammatory bowel disease (Sadlack et al., 1993). Accordingly, to circumvent these developmental disadvantages of conventional IL-2(−/−) mice, we sought to create mice that could be allowed to reach adult stature in IL-2 sufficiency, and then to use an inducible gene deletion system to generate IL-2 deficiency. By doing so, we sought to test the null hypothesis, that acute IL-2 deficiency will not compromise the in vitro proliferative response to T cell activation by anti-CD3/28. Our results, described in this report, indicate that acute IL-2 deprivation in adult mice differs substantially from conventional IL-2(−/−) mice when there is an IL-2 deficiency in both prenatal and postnatal development, as well as adulthood.
Materials and Methods
Mice
To circumvent the IL-2 deficiency T cell hyperproliferative/autoimmune syndrome that occurs when the il2 gene is deleted conventionally, an il2 conditional (−/−) was constructed by inGenious Targeting Laboratory, Inc., Stony Brooke, NY, as shown in Figure 1A. The 62-bp lox P cassette was placed on 1402 bp of the il2 gene including exons I and II. The Neo cassette (3′–5′ orientation) was placed between exons II and III. The primers LAN1 and UNI are indicated, and FRT and loxP sites are also indicated. The reverse primer A3 was used for ES cell screening and F1 genotyping with the LAN1 Neo primer, while the primer LOX1 was used for sequence verification of the single lox P site in PCR applicants from ES clones using DL1 and the Neo primer UNI. F1 genotyping of the single Lox P site by PCR was performed using DL1 and LOX1 primers, and the PCR products were sequenced by LOX1.
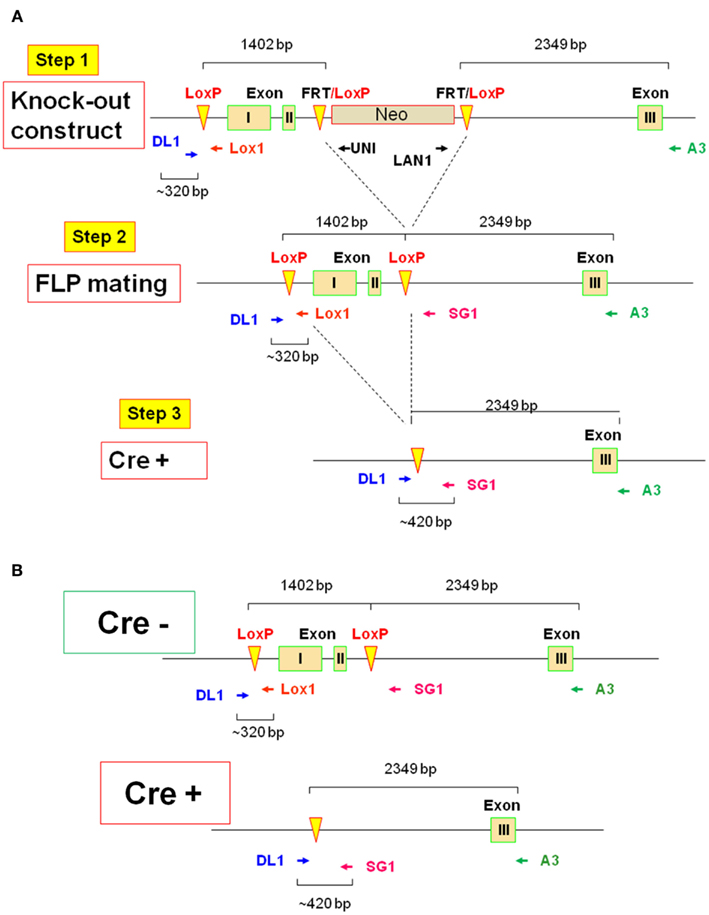
Figure 1. Schematic of conditional il2 gene deletion. (A) Step 1: il2 gene knock-out constructs schematic shows floxed targeted region including exons I and II (1402 bp) and Neo cassette inserted between exons II and III. The primers DL1, Lox1, UNI, LAN1 and A3, and FRT and loxP sites are indicated. Step 2: il2 gene schematic after Neo cassette deletion upon FLP mating and the primers DL1, Lox1, SG1, and A3 is also indicated. Step 3: Schematic of il2 gene of TAM-treated Cre+ (Cre-ERT2/flox-il2) mice is shown. (B) Schematics of il2 gene in the Cre− mice before TAM treatment and the Cre+ mice upon deletion of exons I and II by TAM.
To remove the Neo cassette, targeted C57BL/6 ES cells were microinjected into Balb/c blastocysts. Resulting chimeras with a high percentage of black coat color were mated to wild type (WT) C57BL/6 mice to generate F1 heterozygous offspring. F1 heterozygotes were mated with FLP heterozygotes (Step 2), which were screened for Neo deletion and the FLP transgene. Neo deleted heterozygotes were mated with WT mice and screened for Neo deletion and FLP transgene deletion. Homozygous Neo deleted mice were then mated with Cre-ERT2 mice (Ruzankina et al., 2007). Cre-ERT2 mice contain a gene encoding a fusion protein composed of Cre recombinase and a mutant form of the estrogen receptor that is selectively activated only in the presence of tamoxifen (TAM), but not estrogen. In combination with a flox-conditional allele of il2, the Cre-ERT2 line (hereafter referred to as Cre+) provides a system to efficiently delete the il2 gene both spatially and temporally in the mouse (Ruzankina et al., 2007).
The 62bp lox P cassette: (CGCGGTGGTACCATAACTTCGTATAGCATACATTATACGAAGTTATGAATTCGTCGCCACCG), flanked by EcoRI and KpnI sites; FRT(GAAGTTCCTATTCTCTAGAAAGTATAGGAACTTC), and loxP (ATAACTTCGTATAATGTATGCTATACGAAGTTAT) sites are indicated in Figure 1A. FLP heterozygotes (Jackson Lab #0033800) and Cre-ERT2 (Ruzankina et al., 2007) were used. WT (C57BL/6; Jackson Lab #000664) and conventional IL-2(−/−) mice (Jackson Lab #002252) were bred at Weill Cornell Medical College Animal Facility. Animal studies were approved by the Institutional Animal Care and Use Committee (the IACUC).
PCR Screening Strategy
The reverse primer A3 (5′-TGGAAGGATTCACTTGCACAGTGAC-3′) was used for ES cell screening and F1 genotyping with the LAN1 (5′-CCAGAGGCCACTTGTGTAGC-3′) Neo primer. Primer LOX1 (5′-TGCTTGTTGAGCTTGAGGTAC-3′) was used for sequence verification of the single lox P site in PCR applicants from ES clones using DL1 (5′-ACACATACATGTGCACGCACATGC-3′) and the Neo primer UNI (5′-AGCGCATCGCCTTCTATCGCCTTC-3′). After FLP mating (Figure 1A, Step 2), the mice were screened for FLP transgene by FLP1: 5′-CACTGATATTGTAAGTAGTTTGC-3′ and primer FLP2: 5′-CTAGTGCGAAGTAGTGATCAGG-3′.
Tamoxifen (TAM)-Induced il2 Gene Deletion
Cre+ and Cre− mice (Figure 1B) were allowed to reach adult stature (6–12 weeks old) then treated with TAM (MP Biochemicals) solubilized at 20 mg/mL in a mixture of 98% corn oil (Sigma) and 2% ethanol and delivered into mice by oral gavage (0.5 μmol/g body weight; ∼4 mg/200 μL) once per day for 5 days, followed by a 3-day rest. In initial screens of genomic DNA via PCR a very faint band consistent with the 320-bp fragment of non-deleted il2 exons I and II was detected. Therefore, rather than attempt to quantify this residual genomic IL-2 at the DNA or RNA levels, the efficiency of TAM-induced il2 gene deletion was assessed in all mice and in all experiments by IL-2 ELISA as detailed below.
Splenocytes Isolation, Culture, and Activation
In all experiments total splenocytes from different mouse strains were isolated and activated with soluble anti-CD3 and anti-CD28 (both 2 μg/mL, eBioscience) in complete cell culture media (RPMI 1640 with L-glutamine (Cellgro), supplemented with 10% FBS, 100 U/mL Penicillin/Streptomycin (both Gemini Bio-Products), and 2 μM 2-ME (Sigma-Aldrich). The cells (1 mL, 2 × 10⁶ cells/mL) were cultured in 12-well plates (BD Labware) in a 37°C humidified incubator with 5% CO2.
IL-2 ELISA
Freshly isolated splenocytes were activated and cultured for 20–24 h, when supernatants were harvested. The mouse IL-2 Quantikine Immunoassay kit (R&D Systems) was used to quantify IL-2 concentrations in cell culture supernatants following the manufacturer’s protocol and experimental samples were compared with the kit IL-2 standard. The lower limit of detection (LLD) = 15 pg/mL = 1 pM.
BrdU Incorporation and CFSE Dye Dilution
Freshly isolated splenocytes were activated and cultured for 48 h. BrdU (BrdU Kit, BD Biosciences) was added for the last 2 h. In some experiments, splenocytes were first labeled with 5 μM 5-(and 6-) carboxyfluorescein diacetate succinimidyl ester (CFSE; Molecular Probes) prior to culture, activated and cultured for 48 h.
Monoclonal Antibodies
The following surface mAbs were used all reactive with mouse molecules: CD4 PerCp, CD8 PE, CD8 APC (all BD Biosciences). BrdU mAb (BrdU Kit, BD Biosciences) was used to detect BrdU incorporation into newly synthesized DNA.
Flow Cytometry
Four-color flow cytometry and standard staining protocols were used. Single cell suspensions of splenocytes were stained first for surface molecules for 30 min in the dark (4°C), then washed once with Washing Buffer (1X PBS (Cellgro) with 0.5% FBS (Gemini Bio-Products) and 0.1% NaN3). The cell pellet was resuspended and acquired on a FACSCalibur flow cytometer. The BD Biosciences BrdU Kit staining protocol was used. The data were analyzed using FlowJo software (Tree Star), whereby the Overton cumulative histogram subtraction method was used to assess the percent of positive cells.
Cytokine Production
Culture supernatants were tested for cytokine production by AssayGate (www.assaygate.com) using suspension protein arrays with bead-based array technology, as described previously (Paulo et al., 2011). Thirteen cytokines (Table 1) were determined using a custom multiplexed protein assay methodology established upon a Luminex Bead-based immunoassay platform. Multiple cytokines in a single aliquot of cell culture supernatant were determined quantitatively and simultaneously with a Bio-Plex 200 Bead Reader System. Microparticles were dyed with differing concentrations of two fluorophores to generate distinct bead sets. Each bead set was coated with a capture antibody specific for one cytokine. The captured cytokine was detected using a biotinylated detection antibody and streptavidin–phycoerythrin (S–PE). The bead analyzer was a dual laser, flow-based, sorting and detection platform. One laser was bead-specific and determined which cytokine was being detected. The other laser determined the magnitude of PE-derived signal, which was in direct proportion to the amount of cytokine bound.
Table 1. Cytokine production.
The cytokine protein concentrations of the samples were determined by a five-parameter logistic regression algorithm with analysis of the median fluorescence intensity readings of an eight-point protein standard curve. This regression provides a larger range of quantitation than standard linear regression analysis. Once a regression equation was derived, the fluorescence intensity values of the standards were treated as unknowns, and the concentration of each standard cytokine was calculated. A ratio of the calculated value to the expected value of this standard was then determined. A ratio between 70 and 130% for each of the standards indicated a good fit. If the fluorescence intensity values of the samples reached a plateau, or were outside the range of standard curves, a re-test with diluted samples was performed to ensure that the fluorescence intensity measurements of unknown samples fell inside the range of the standard curves. Precision was evaluated by the CV% in our assays. A CV% <10% indicates a good level of precision. Samples were tested in duplicate. Positive and negative controls on each bead plate allowed for assay quality assurance. The assays were sensitive to the first decimal in pg/mL. The LLD for IL-2 = 1.2 pg/mL = 0.08 pM, >10-fold more sensitive than the IL-2 ELISA.
Statistical Analysis
One-way ANOVA was performed in the analysis of the mean differences between the groups. A post Bonferroni comparison test on selected groups was used to assess the level of significance of the mean differences between the groups, represented by asterisks in the figures [* (p < 0.05); ** (p < 0.01); *** (p < 0.001); **** (p < 0.0001)]. Two-way ANOVA was performed in the analysis of the mean differences from ELISA assay. p values of <0.05 were considered statistically significant.
Results
The Efficiency of TAM-Induced il2 Deletion
The most sensitive and quantitative test available to determine the efficacy of IL-2 deletion is the detection of the IL-2 protein, rather than available semi-quantitative methods that detect genomic DNA or mRNA, in that the LLD by both IL-2 bioassay and ELISA is 1 pM (15 pg/mL). Also, we were most interested in deleting IL-2 activity for our planned experiments. Therefore, both Cre+ and Cre− mice were allowed to reach adult stature between 6 and 12 weeks of age, then treated with TAM for 5 days, followed by a 3-day rest, as originally described (Ruzankina et al., 2007). Subsequently, mice were sacrificed and splenocytes were polyclonally activated in vitro via anti-CD3 + anti-CD28 for 20–24 h, when culture supernatants from each individual mouse were harvested and tested via ELISA for immuno-reactive IL-2 protein. As shown in Figure 2, there was readily detectable IL-2 from both WT (141 ± 14 pM) and the Cre− mice (116 ± 9 pM; p > 0.05). By comparison, splenocytes from neither conventional IL-2(−/−) nor conditional IL-2(−/−) Cre+ mice yielded detectable IL-2 by this assay. Since the affinity (Kd) of the trimeric IL-2 receptor (IL-2R) for IL-2 = 10 pM, with a dose–response range between 1 and 100 pM, these results indicated that TAM treatment had rapidly and effectively created a marked state of IL-2 deficiency in the Cre+ IL-2 conditional IL-2(−/−) mice, whereas TAM treatment of Cre− mice was not detrimental to IL-2 gene expression.
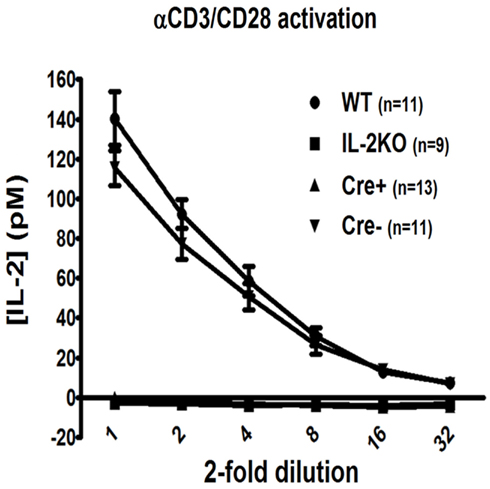
Figure 2. The efficiency of TAM-induced il2 deletion. The twofold dilution of [IL-2] (pM) by ELISA assay in WT (●; n = 11), conventional IL-2KO (◼; n = 13), conditional IL-2(−/−) Cre+ (▴; n = 13), and Cre− (▾; n = 9) mice (p < 0.0001). Anti-CD3/28-activated splenocytes were cultured in vitro for 20–24 h. The results are shown as Mean ± SEM (vertical brackets).
Lymphocyte Blastic Transformation
Lymphocyte blastic transformation and the associated switch from oxidative phosphorylation to aerobic glycolysis with the marked production of lactic acid are among the earliest cellular changes attributed to mitogen or antigen-stimulated lymphocytes (Nowell, 1960). Thus, in our first experiments it was of interest that the Forward Scatter histograms (Figure 3A) and Forward Scatter/Side Scatter dot plots (Figure 3B) from the flow cytometric analyses of splenocytes activated for 48 h with anti-CD3/28 revealed that CD4+ T cells from the WT, Cre−, and Cre+ mice had all undergone a marked increase in cell size and granularity, but cells from the conventional IL-2(−/−) mice had not. The mean percentage of CD4+ T cells from conventional IL-2(−/−) mice that underwent blastic transformation was significantly lower than WT, Cre−, and Cre+ (p < 0.05; Figure 3C). There were no significant differences in the mean percentages of increased CD4+ T cell sizes comparing WT, Cre−, and Cre+ mice (Figure 3C). Moreover, when pulse labeled with BrdU, the increase in the size of CD4+ T cells from WT, Cre−, and conditional Cre+ IL-2(−/−) mice was coupled with increased new DNA synthesis in contrast to the CD4+ T cells from conventional IL-2(−/−) mice (Figure 3D).
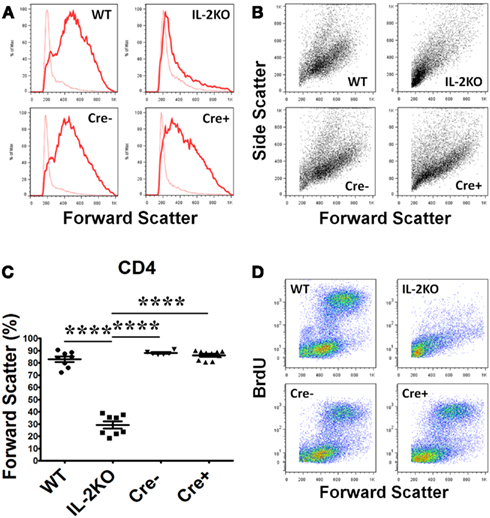
Figure 3. Lymphocyte blastic transformation in CD4 T cells. (A) Forward Scatter histograms and (B) Dot plots monitoring Side and Forward Scatter in CD4 T cells from WT (upper left), conventional IL-2KO (upper right), Cre− (lower left), and conditional IL-2(−/−) Cre+ (lower right) mice and (C) The difference in Forward Scatter by CD4 T cells from WT (●; n = 8), conventional IL-2KO (◼; n = 8), Cre− (▾; n = 6), and conditional IL-2(−/−) Cre+ ( ▴; n = 10) mice (p < 0.0001). (D) Dot plots monitoring BrdU and Forward Scatter in CD4 T cells from WT (upper left), conventional IL-2KO (upper right), Cre− (lower left), and conditional IL-2(−/−) Cre+ (lower right) mice. Anti-CD3/28-activated splenocytes were cultured for 48 h. Representative histograms and Side and Forward Scatter dot plots (B) were chosen from 1 of 6–10 independent experiments, while BrdU and Forward Scatter dot plots (C) were chosen from one of five to seven independent experiments. Dotted histogram lines represent non-activated cells. The results are shown as Mean ± SEM (vertical brackets). Asterisks represent the level of statistical significance.
Similar results were obtained with CD8+ T cells, although CD8+ T cells from the conventional IL-2(−/−) mice were somewhat larger and more granular than CD4+ T cells (Figures 4A,B). The mean percentage of blastic CD8+ T cells from conventional IL-2(−/−) mice was significantly lower than WT, Cre−, and Cre+ (p < 0.05; Figure 4C). By comparison, there were no significant differences in the mean percentages of blastic CD8+ T cells comparing WT, Cre−, and Cre+ mice (Figure 4C). As well, the increase in the size of CD8+ T cells from WT, Cre−, and conditional Cre+ IL-2(−/−) mice was coupled with increased new DNA synthesis in contrast to the CD8+ T cells from conventional IL-2(−/−) mice, although this was not as marked as the results with CD4+ T cells (compare Figure 4D with Figure 3D).
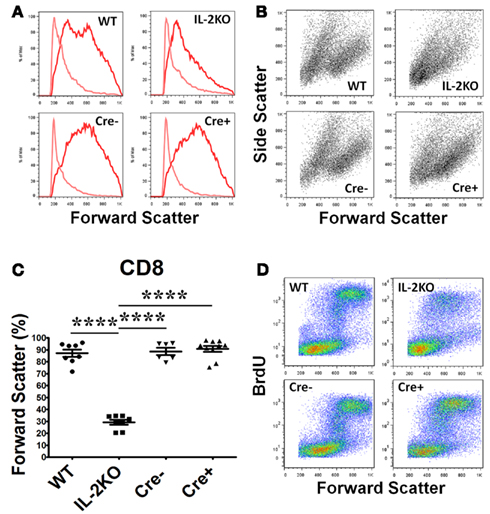
Figure 4. Lymphocyte blastic transformation in CD8 T cells. (A) Forward Scatter histograms and (B) Dot plots monitoring Side and Forward Scatter in CD8 T cells from WT (upper left), conventional IL-2KO (upper right), Cre− (lower left), and conditional IL-2(−/−) Cre+ (lower right) and (C) The difference in Forward Scatter by CD4 T cells from WT (●; n = 8), conventional IL-2KO (◼; n = 8), Cre− (▾; n = 6), and conditional IL-2(−/−) Cre+ (▴; n = 10) mice (p < 0.0001). (D) Dot plots monitoring BrdU and Forward Scatter in CD8 T cells from WT (upper left), conventional IL-2KO (upper right), Cre− (lower left), and conditional IL-2(−/−) Cre+ (lower right) mice. Anti-CD3/28-activated splenocytes were cultured for 48 h. Representative histograms and Side and Forward Scatter dot plots (B) were chosen from 1 of 6–10 independent experiments, while BrdU and Forward Scatter dot plots (C) were chosen from 1 of 5–7 independent experiments. Light color histogram lines represent non-activated cells. The results are shown as Mean ± SEM (vertical brackets). Asterisks represent the level of statistical significance.
Because of the divergence of Forward Scatter results from IL-2 deficient conventional IL-2(−/−) and IL-2 deficient conditional IL-2(−/−) Cre+ mice, lymphocyte blastic transformation cannot be attributed solely to IL-2.
Also, examination of culture media from splenocytes activated with anti-CD3/28 and cultured for 48 h yielded the results shown in Figure 5. The media from activated IL-2 sufficient WT cells was noticeably yellow, indicating a drop in pH, as was the media from the IL-2 sufficient Cre− cells. By comparison, the media from both activated IL-2 deficient conventional IL-2(−/−) and conditional Cre+ IL-2(−/−) cells was similar to the normal red color of the media of the control, non-activated cells, consistent with oxidative phosphorylation, rather than a switch to aerobic glycolysis.
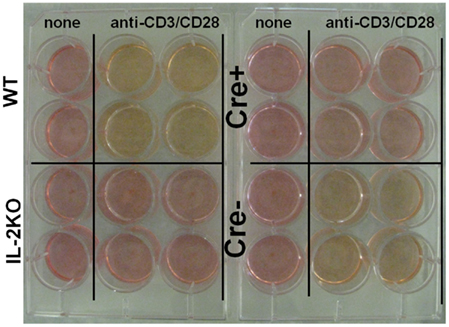
Figure 5. IL-2 is necessary for aerobic glycolysis. Tissue culture media color from WT (upper left), conventional IL-2KO (lower left), conditional IL-2(−/−) Cre+ (upper right), and Cre− (lower right) mice upon anti-CD3/28-activation for 48 h. The media color of the non-activated (control) splenocytes from different mouse strains is also shown. Representative picture was chosen from one of five to seven independent experiments.
Accordingly, these results indicated that even though T cells from IL-2 deficient conditional IL-2(−/−) Cre+ mice had undergone lymphoblastic transformation, they had not switched to aerobic glycolysis, at least not to the extent that cells from IL-2 sufficient WT and Cre− mice had.
Proliferation of Activated CD4+ T Cells
The incorporation of BrdU into newly synthesized DNA was monitored to assess the S-phase transition of T cells from the four strains of mice. Splenocytes were activated for 46 h with anti-CD3/28, then pulse labeled with BrdU for 2 h. Representative histogram plots of BrdU incorporation by CD4+ T cells are shown in Figure 6A, and the means ± SEM of the results from repeated experiments are shown in Figure 6B. There were no significant differences in the mean percentages of CD4+ T cells that incorporated BrdU comparing WT, Cre−, and Cre+ mice. However, the mean percentage of CD4+ T cells from conventional IL-2(−/−) mice that incorporated BrdU was significantly lower than CD4+ T cells from WT, Cre−, and Cre+ (p < 0.05). Similar results were obtained when CFSE dye dilution was monitored 48 h after activation with anti-CD3/28 as a measure of the extent of cell division. Representative histogram plots are shown in Figure 6C, and the means ± SEM of the results from repeated experiments are shown in Figure 6D. There were no significant differences in the mean percentages of CD4+ T cells that underwent dye dilution comparing WT, Cre−, and Cre+ mice. However, the mean percentage of CD4+ T cells from conventional IL-2(−/−) mice that diluted CFSE dye was significantly lower than WT, Cre−, and Cre+ (p < 0.05).
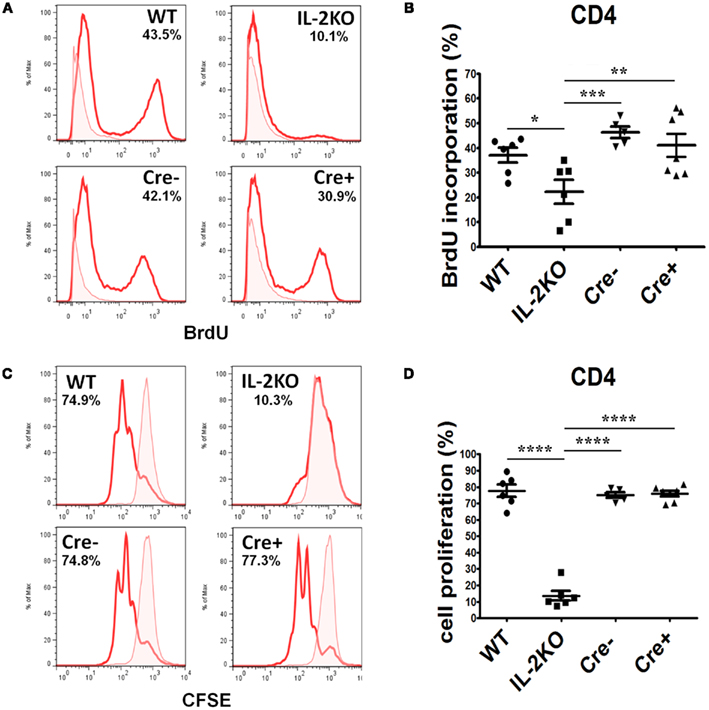
Figure 6. Proliferation of activated CD4 T cells. (A) BrdU incorporation in CD4 T cells from WT (upper left), conventional IL-2KO (upper right), Cre− (lower left), and conditional IL-2(−/−) Cre+ (lower right) mice. (B) The difference in BrdU incorporation by CD4 T cells from WT (●; n = 6), conventional IL-2KO (◼; n = 6), Cre− (▾; n = 5), and conditional IL-2(−/−) Cre+ (▴; n = 7) mice (p = 0.0041). (C) CD4 T cell proliferation monitored by the CFSE dilution from WT (upper left), conventional IL-2KO (upper right), Cre− (lower left), and conditional IL-2(−/−) Cre+ (lower right) mice. (D) The difference in CD4 T cell proliferation from WT (●; n = 6), conventional IL-2KO (◼; n = 6), Cre− (▾; n = 5), and conditional IL-2(−/−) Cre+ (▴; n = 7) mice (p < 0.0001). Anti-CD3/28-activated splenocytes were cultured for 48 h. Representative histograms were chosen from one of five to seven independent experiments. The percentages are also shown for each histogram. Shaded histograms represent non-activated cells. The results are shown as Mean ± SEM (vertical brackets). Asterisks represent the level of statistical significance.
Proliferation of Activated CD8+ T Cells
The incorporation of BrdU into newly synthesized DNA of CD8+ cells after 46 h of culture and a 2-h BrdU pulse yielded similar results. Representative histogram plots of BrdU incorporation are shown in Figure 7A, and the means ± SEM of the results from repeated experiments are shown in Figure 7B. There were no significant differences in the mean percentages of CD8+ T cells that incorporated BrdU comparing WT, Cre−, and Cre+ mice. However, the mean percentage of CD8+ T cells from conventional IL-2(−/−) mice that incorporated BrdU was significantly lower than WT, Cre−, and Cre+ (p < 0.05). Similar results were obtained when CFSE dye dilution was monitored 48 h after activation with anti-CD3/28 as a measure of the extent of cell division. Representative histogram plots are shown in Figure 7C, and the means ± SEM of the results from repeated experiments are shown in Figure 7D. There were no significant differences in the mean percentages of CD8+ T cells that underwent dye dilution comparing WT, Cre−, and Cre+ mice. However, the mean percentage of CD8+ T cells from conventional IL-2(−/−) mice that diluted CFSE dye was significantly lower than WT, Cre−, and Cre+ (p < 0.05).
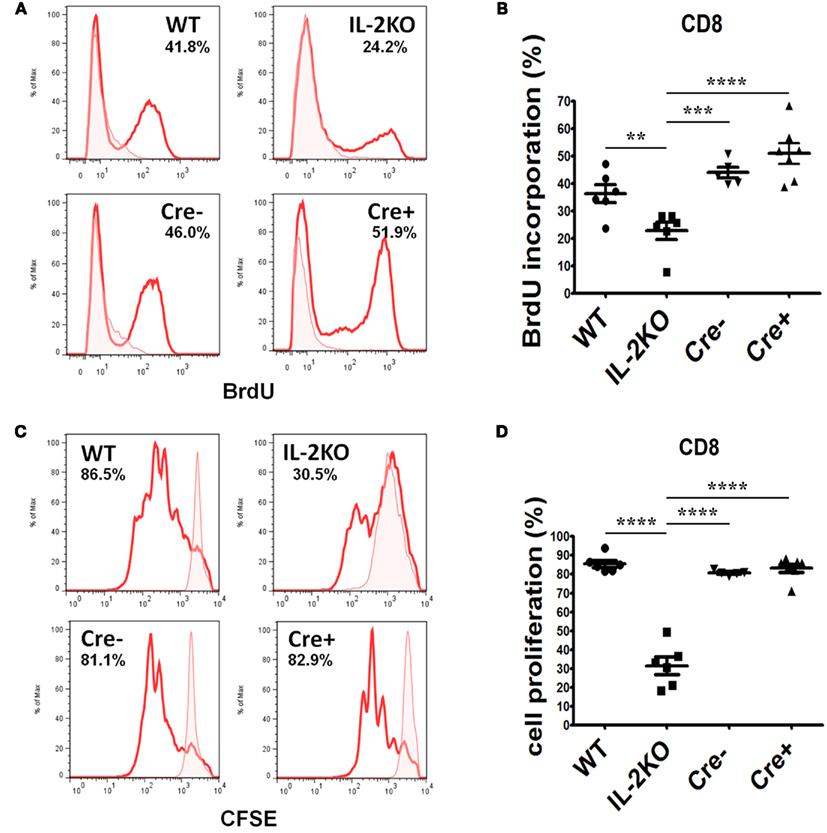
Figure 7. Proliferation of activated CD8 T cells. (A) BrdU incorporation in CD8 T cells from WT (upper left), conventional IL-2KO (upper right), Cre− (lower left), and conditional IL-2(−/−) Cre+ (lower right) mice. (B) The difference in BrdU incorporation by CD8 T cells from WT (●; n = 6), conventional IL-2KO (◼; n = 6), Cre− (▾; n = 5), and conditional IL-2(−/−) Cre+ (▴; n = 7) mice (p < 0.0001). (C) CD8 T cell proliferation monitored by the CFSE dilution from WT (upper left), conventional IL-2KO (upper right), Cre− (lower left), and conditional IL-2(−/−) Cre+ (lower right) mice. (D) The difference in CD8 T cells proliferation from WT (●; n = 6), conventional IL-2KO (◼; n = 6), Cre− (▾; n = 5), and conditional IL-2(−/−) Cre+ (▴; n = 7) mice (p < 0.0001). Anti-CD3/28-activated splenocytes were cultured for 48 h. Representative histograms were chosen from one of five to seven independent experiments. Shaded histograms represent non-activated cells. The percentages are also shown for each histogram. The results are shown as Mean ± SEM (vertical brackets). Asterisks represent the level of statistical significance.
Cytokine Production
In view of the proliferation of both CD4+ and CD8+ T cells from IL-2 deficient conditional IL-2(−/−) Cre+ mice, which was equivalent to T cells from both WT and Cre− mice, we next monitored the production of multiple cytokines via protein immunoarray. Splenocytes from each of the four mouse strains were activated via anti-CD3/28 and supernatants were harvested after 24 h. First, as shown in Table 1 and Figure 8, IL-2 production by WT splenocytes yielded IL-2 concentrations equivalent to those found by ELISA (mean 1496 ± 567 pg/mL = 97 ± 37 pM), which would saturate high affinity trimeric IL-2Rs. Also, IL-2 production by conventional IL-2(−/−) splenocytes was undetectable, as anticipated. Moreover, IL-2 production by IL-2 sufficient Cre− splenocytes was not significantly different than WT IL-2 production (p > 0.05). However, splenocytes from IL-2 deficient conditional IL-2(−/−) Cre+ mice produced just barely detectable IL-2 (mean 13.6 ± 3.9 pg/mL = 0.9 ± 0.2 pM; <1% of WT), in contrast to our IL-2 ELISA results, where IL-2 was undetectable.
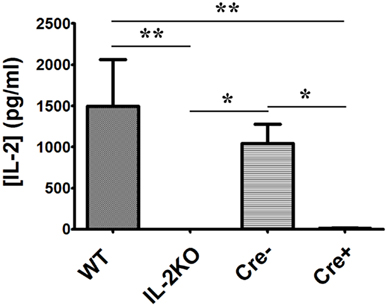
Figure 8. IL-2 cytokine production. The difference in [IL-2] (pg/ml) from WT, conventional IL-2KO, Cre−, and conditional IL-2(−/−) Cre+ mice upon anti-CD3/28-activation for 24 h (p = 0.0061). The Mean ± SEM (vertical brackets) results from 5 individual experiments are shown. Asterisks represent the level of statistical significance.
Examination of the production of pro-inflammatory cytokines (IL-1β, IL-6, and TNFα) yielded no differences among the four strains of mice (Table 1). Also, IL-12 concentrations were very low or absent in all strains. The IL-2 deficient conventional IL-2(−/−) cells produced IL-17 concentrations equivalent to the WT and Cre− IL-2 sufficient strains, but the IL-2 deficient conditional IL-2(−/−) Cre+ strain produced significantly lower IL-17 concentrations than WT (p < 0.05). These results are contrary to the dogma that IL-2 suppresses IL-17 production. By comparison, the WT, Cre−, and IL-2 deficient conditional IL-2(−/−) Cre+ strains all produced equivalent concentrations of IFNγ, but the IL-2 deficient conventional IL-2(−/−) strain produced significantly lower concentrations of IFNγ than WT, Cre−, and Cre+ (p < 0.05; Table 1).
Focusing on the other six γc-chain cytokines (Table 1), there were significant differences among the four strains of mice. First, both IL-7 and IL-15 were undetectable from all strains of mice, thereby excluding either of them as candidates that could promote in vitro proliferation. Splenocytes from WT mice produced readily detectable IL-4 (Figure 9A), IL-9 (Figure 9B), IL-13 (Figure 9C), and IL-21 (Figure 9D). By comparison to WT mice, splenocytes from IL-2 deficient conventional IL-2(−/−) mice produced very low concentrations of IL-4 and IL-13 (p < 0.05), but IL-9 and IL-21 production were not significantly different from that produced by WT cells (p > 0.05). Moreover, the IL-4 production from IL-2 deficient conventional IL-2(−/−) cells was significantly lower than from IL-2 deficient conditional IL-2(−/−) Cre+ cells (p < 0.05), while the IL-13, IL-9, and IL-21 production were not significantly different (p > 0.05).
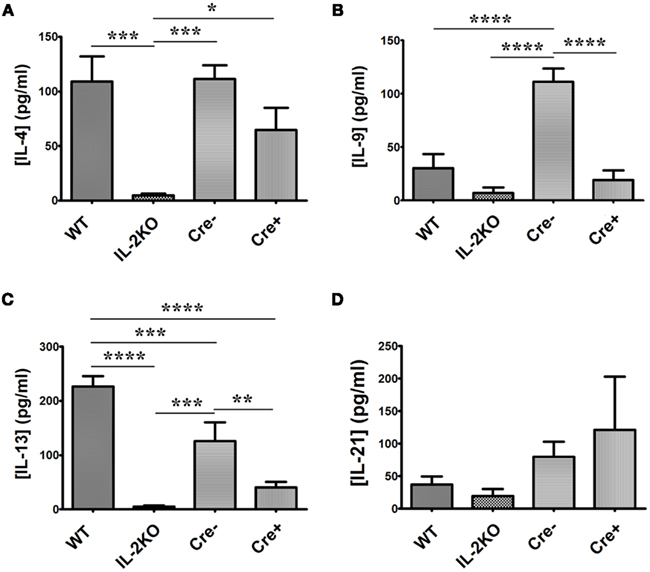
Figure 9. IL-4, IL-9, IL-13, and IL-21 cytokine production. The difference in (A) [IL-4] (pg/ml; p = 0.001), (B) [IL-9] (p < 0.0001), (C) [IL-13] (p < 0.0001), and (D) [IL-21] (p = 0.3717) from WT, conventional IL-2KO, Cre−, and conditional IL-2(−/−) Cre+ mice upon anti-CD3/28-activation for 24 h. The Mean ± SEM (vertical brackets) results from five individual experiments are shown. Asterisks represent the level of statistical significance.
The γc-chain cytokines produced by the IL-2 sufficient Cre− mice were not significantly different from those produced by cells from WT mice, except for IL-13 (p < 0.05), which was ∼ 50% of WT production, and IL-9, which was approximately twofold higher than WT production (p < 0.05).
Most noteworthy were the results from the IL-2 deficient conditional IL-2(−/−) Cre+ mice. It is apparent that splenocytes from these animals produced readily detectable IL-4, IL-9, IL-13, and IL-21, in contrast to the IL-2 deficient conventional IL-2(−/−) mice.
Discussion
Several of the results from these first experiments performed with IL-2 deficient conditional IL-2(−/−) mice were unanticipated and revealing. First, lymphocyte blastogenesis cannot be attributed to IL-2 alone, whereas the switch from oxidative phosphorylation to aerobic glycolysis in T cells is attributable to IL-2. Second, despite the almost complete deficiency of IL-2 production by cells from conditional IL-2(−/−) Cre+ mice, DNA replication, and cell division proceeded as well as that observed in cells from both IL-2 sufficient WT and Cre− mice. Therefore, we have proved our null hypothesis. Third, the complete absence of IL-2 in the prenatal and postnatal development of conventional IL-2(−/−) mice results in a deficiency in several γc-chain cytokines, notably IL-4, IL-9, IL-13, and IL-21, but not in several other cytokines, e.g., IL-1β, IL-6, and TNFα. Fourth, deficiencies in the capacity to produce the other γc-chain cytokines does not occur in acutely IL-2 deficient conditional IL-2(−/−) mice.
It is worthy of emphasis that absolute IL-2 deficiency did not result from TAM-induced IL-2 gene deletion, in that by the very sensitive Multiplex Protein Array method (LLD = 0.08 pM), a mean of 0.87 ± 0.25 pM (SEM) of IL-2 protein (n = 5) could be detected in the 20- to 24-h culture supernatants, whereas the conventional IL-2(−/−) cells did not yield detectable IL-2 protein. Given these low IL-2 concentrations detected after 24 h of culture, the question arises as to whether the results observed after 48 h of culture could be due to these low IL-2 concentrations. For example, if a low fraction of cells from conditional Cre+ IL-2(−/−) mice produce IL-2, could local autocrine or paracrine IL-2 supplied to neighboring cells result in equivalent results between WT and conditional Cre+ IL-2(−/−) mice? As detailed in the very first report of IL-2 receptor binding from both equilibrium and kinetic binding experiments (Robb et al., 1981), and then discussed thoroughly in reviews (Smith, 1988a,b, 1989), the IL-2/IL-2R interaction obeys the Law of Mass Action, and the equilibrium dissociation constant (Kd) for the high affinity trimeric IL-2R is 10 pM. Therefore, an IL-2 concentration <1 pM, would be expected to lead to <10% occupancy of the IL-2Rs expressed by an individual cell. Since IL-2 activity and the fraction of responding cells is dependent upon the affinity of the IL-2/IL-2R interaction, which dictates the IL-2 concentrations necessary to bind IL-2Rs, as well as the IL-2R density/cell, and the duration of the IL-2/IL-2R interaction (Cantrell and Smith, 1984), only those cells with the highest IL-2R densities would be expected to bind and respond to <1 pM IL-2, and thus the fraction of these cells within the total responding population would be correspondingly small. Thus, the response to IL-2 is linear, and at the single cell level the response is quantal and dependent upon the four variables mentioned (Smith, 2006, 2010). Consequently, as discussed below, <1 pM IL-2 produced during the first 24 h cannot account for the results obtained after 48 h of culture, in that the whole population of cells from conditional Cre+ IL-2(−/−) mice was equivalent to the populations observed for the WT and Cre− mice. Also, any IL-2 molecules non-specifically adsorbed to the cell surface (i.e., on non-receptor proteins) would be miniscule compared with the molecules present in the very low concentrations present (<1 pM). Moreover, any of these surface molecules would be incapable of signaling. Accordingly, alternative explanations are necessary to explain our results. In this regard, future experiments should necessarily focus on the fraction of cells expressing IL-2Rs, as well as the cell type. It is also evident that it is possible, and even probable, that a very small fraction of cells (<1% of WT) are responsible for the production of IL-2 by the Cre+ cells. By monitoring the IL-2 molecule at the single cell level, future experiments will determine the proportion and phenotype of IL-2 producing and responding cells. These approaches should be much more accurate as well as biologically significant than employing a surrogate fluorescent marker gene product, such as Yellow Fluorescent Protein.
Lymphocyte blastic transformation was first described in experiments with the mitogenic lectin phytohemagglutinin (PHA), which was found to activate and transform human lymphocytes into lymphoblasts, resembling leukemia cells (Nowell, 1960). Nowell remarked at the time that it was curious that the change in cellular morphology proceeded only after several days of culture and not immediately or soon after addition of PHA to the cultures. To account for the delay, he postulated that perhaps the cells released some soluble product into the media, which was actually responsible for the phenomenon, rather than the PHA per se. Five years later, two simultaneous reports described the first soluble mitogenic activity in leukocyte conditioned media, which they termed “Blastogenic Factor” (Gordon and MacLean, 1965; Kasakura and Lowenstein, 1965). Over the ensuing decade, numerous reports identified T cell mitogenic activities in leukocyte conditioned media. Once the IL-2 receptor (IL-2R; Robb et al., 1981) and the TCR complex (Meuer et al., 1983) were identified, and it was understood that activation of the TCR leads to the production of IL-2 and the expression of the IL-2R (Cantrell and Smith, 1984; Meuer et al., 1984), it was possible for the first time to approach the experimental question as to whether the TCR or the IL-2R was responsible for the marked morphological cellular changes of blastic transformation. Experiments performed with normal human lymphocytes yielded the clear-cut result that the IL-2/IL-2R interaction, but not the TCR, is responsible not only for lymphocyte blastic transformation, but also progression through the G1 phase of the cell cycle and the transition to DNA synthesis and replication (Stern and Smith, 1986).
More recent experiments by Cantrell’s group revealed that IL-2 and IL-15 are equivalent and potent mitogens for antigen-stimulated CD8+ T cells, but IL-2 stimulates blastogenesis whereas IL-15 does not (Cornish et al., 2006). Furthermore, they found that IL-2 promotes twice the rate of amino acid uptake, amino acid transporter expression and protein synthesis compared with IL-15. These experiments showed for the first time that blastogenesis is not a prerequisite for T cell cycle progression and DNA replication. Now, our experiments reveal that IL-2 deficient conditional IL-2(−/−) Cre+ cells undergo blastogenesis and proliferate just as well as IL-2 sufficient WT and Cre− cells, but do not appear to switch to aerobic glycolysis and produce large amounts of lactic acid. Therefore, these results indicate that this fundamental cellular metabolic switch to aerobic glycolysis (Vander Heiden et al., 2009; Finlay and Cantrell, 2011), which is usually associated with T cell proliferation, depends upon IL-2 and is not mediated by the TCR or the other γc-chain cytokines. It is also noteworthy that the very low IL-2 concentrations produced by conditional Cre+ IL-2(−/−) cells were not sufficient to cause a metabolic switch in the blastoid cells that proliferated. Obviously, these initial observations based upon media pH will now need follow-up with more detailed and sophisticated metabolic measurements.
Our results showing that DNA replication monitored by BrdU incorporation and cell division monitored by CFSE dye dilution were not significantly different when comparing the cell populations from IL-2 deficient conditional IL-2(−/−) and IL-2 sufficient WT and Cre− mice was unanticipated. However, these results contrasted with those obtained with cells from IL-2 deficient conventional IL-2(−/−) mice, which were obviously deficient in both DNA replication and cell division. In this regard, it is noteworthy that our results with IL-2 deficient conventional IL-2(−/−) cells are consistent with the deficient tritiated thymidine incorporation reported in the very first mitogen experiments conducted with cells from these animals (Schorle et al., 1991). Therefore, another cause of the proliferation by the conditional Cre+ IL-2(−/−) cells, besides IL-2, was sought to explain our results.
It was also unanticipated to find that IL-2 deficient conventional IL-2(−/−) cells failed to produce normal concentrations of other γc-chain cytokines, notably IL-4 and IL-13. This result, coupled with adequate production of these γc-chain cytokines by cells from the IL-2 deficient conditional IL-2(−/−) Cre+ mice, offers a reasonable explanation for the deficient proliferative responses in cells from the conventional IL-2(−/−) mice compared with the conditional IL-2(−/−) mice. This interpretation gains considerable weight in light of the complete lack of proliferative responses by anti-CD3/28 stimulated T cells from STAT5a/b(−/−) mice that express only ∼ 1% of STAT5 protein compared with WT mice, even when supplemented with IL-2 (Moriggl et al., 1999a,b). Together with our results, these data are consistent with the interpretation that neither “signal 1” (TCR) nor “signal 2” (CD28) can promote progression through the G1 phase of the cell cycle into the S-phase. Instead, a “signal 3” is needed, which is supplied via γc-chain cytokines that activate the phosphorylation of STAT5. In support of this interpretation, several reports have detailed that IL-2-signaled STAT5 activation of cyclin D gene expression is necessary for G1 progression and S-phase transition whereas signals emanating from the TCR and/or CD28 do not (Turner, 1993; Beadling et al., 1994, 1996; Martino et al., 2001; Moon et al., 2004). Therefore, the molecular contributions of the three signals to T cell activation and proliferation are now understood.
It is noteworthy that experiments using antibodies reactive with IL-2 is another approach that has been tried to explore the role of IL-2 in T cell responses both in vitro and in vivo. In this regard, it has not escaped our attention that cytokine-specific MoAbs should be useful to further examine the role of each cytokine in vitro. However, antibodies that neutralize IL-2 activity in vitro, such as DMS-1 (Smith et al., 1983) and S4B6 (Zurawski et al., 1986), have been found to actually stimulate IL-2 effects in vivo because of a protein carrier effect, which complicates interpretations as to the IL-2 role (Courtney et al., 1994; Boyman et al., 2006).
Accordingly, our newly created IL-2 deficient IL-2(−/−) mice offer a new tool to further dissect the role of IL-2 and the other γc-chain cytokines in the generation of adaptive T cell immune responses. In particular, whether IL-2 deficient conditional (−/−) Cre+ mice will be found to have defective primary vs. secondary immune responses, and whether they will lack T cell memory in response to a secondary antigenic challenge must await additional experimentation.
Conflict of Interest Statement
The authors declare that the research was conducted in the absence of any commercial or financial relationships that could be construed as a potential conflict of interest.
Acknowledgments
We thank Eric Brown for his generous supply of CRE-ERT2 mice and his instructions regarding TAM treatment. This work was funded by the Belfer Foundation and a gift from the Rubin Foundation, both in New York, NY, as well as grant UL1RR024996 from the Clinical and Translational Science Center at Weill Cornell Medical College.
References
Baker, P. E., Gillis, S., Ferm, M. M., and Smith, K. A. (1978). The effect of T cell growth factor on the generation of cytolytic T cells. J. Immunol. 121, 2168–2173.
Baker, P. E., Gillis, S., and Smith, K. A. (1979). Monoclonal cytolytic T-cell lines. J. Exp. Med. 149, 273–278.
Beadling, C., Guschin, D., Witthuhn, B., Ziemiecki, A., Ihle, J., Kerr, I., and Cantrell, D. (1994). Activation of JAK kinases and STAT proteins by interleukin-2 and interferon alpha, but not the T cell antigen receptor, in human T lymphocytes. EMBO J. 13, p5605–p5615.
Beadling, C., Ng, J., Babbage, J., and Cantrell, D. (1996). Interleukin-2 activation of STAT5 requires the convergent action of tyrosine kinases and a serine/threonine kinase pathway distinct from the Raf1/ERK2 MAP kinase pathway. EMBO J. 15, p1902–p1913.
Boyman, O., Kovar, M., Rubinstein, M., Surh, C., and Sprent, J. (2006). Selective stimulation of T cell subsets with antibody-cytokine immune complexes. Science 311, 1924–1927.
Cantrell, D. A., and Smith, K. A. (1984). The interleukin-2 T-cell system: a new cell growth model. Science 224, 1312–1316.
Cornish, G., Sinclair, L., and Cantrell, D. (2006). Differential regulation of T cell growth by IL-2 and IL-15. Blood 108, 600–608.
Courtney, L., Phelps, J., and Karavodin, L. (1994). An anti-IL-2 antibody increases serum halflife and improves anti-tumor efficacy of human recombinant IL-2. Immunopharmacology 28, 223–232.
Cousens, L. P., Orange, J. S., and Biron, C. A. (1995). Endogenous IL-2 contributes to T cell expansion and IFN-gamma production during lymphocytic choriomeningitis virus infection. J. Immunol. 155, 5690–5699.
Finlay, D., and Cantrell, D. (2011). Metabolism, migration and memory in cytotoxic T cells. Nat. Rev. Immunol. 11, 109–117.
Gordon, J., and MacLean, L. D. (1965). A lymphocyte-stimulating factor produced in vitro. Nature 208, 795–796.
Horak, I., Lohler, J., Ma, A., and Smith, K. (1995). Interleukin-2 deficient mice: a new model to study autoimmunity and self-tolerance. Immunol. Rev. 148, 35–44.
Kasakura, S., and Lowenstein, L. (1965). A factor stimulating DNA synthesis derived from the medium of leukocyte cultures. Nature 208, 794–795.
Klebb, G., Autenrieth, I. B., Haber, H., Gillert, E., Sadlack, B., Smith, K. A., and Horak, I. (1996). Interleukin-2 is indispensable for development of immunological self-tolerance. Clin. Immunol. Immunopathol. 81, 282–286.
Kundig, T. M., Schorle, H., Bachmann, M. F., Hengartner, H., Zinkernagel, R. M., and Horak, I. (1993). Immune responses in interleukin-2-deficient mice. Science 262, 1059–1061.
Leonard, W. J., Depper, J. M., Uchiyama, T., Smith, K. A., Waldmann, T. A., and Greene, W. C. (1982). A monoclonal antibody that appears to recognize the receptor for human T-cell growth factor; partial characterization of the receptor. Nature 300, 267–269.
Martino, A., Holmes, J. H. IV, Lord, J. D., Moon, J. J., and Nelson, B. H. (2001). Stat5 and Sp1 regulate transcription of the cyclin D2 gene in response to IL-2. J. Immunol. 166, 1723–1729.
Meuer, S. C., Fitzgerald, K. A., Hussey, R. E., Hodgdon, J. C., Schlossman, S., and Reinherz, E. L. (1983). Clonotypic structures involved in antigen-specific human T cell function. Relationship to the T3 molecular comlex. J. Exp. Med. 157, 705–719.
Meuer, S. C., Hussey, R. E., Cantrell, D. A., Hodgen, J. C., Schlossman, S. F., Smith, K. A., and Reinherz, E. L. (1984). Triggering the T3-Ti antigen-receptor complex results in clonal T cell proliferation through an interleukin 2-dependent autocrine pathway. Proc. Natl. Acad. Sci. U.S.A. 81, 1509–1513.
Moon, J., Rubio, E., Martino, A., Krumm, A., and Nelson, B. (2004). A permissive role for phophatidylinositol 3-kinase in the STAT5-mediated expression of cyclin D2 by the interleukin-2 receptor. J. Biol. Chem. 279, 5520–5527.
Moriggl, R., Sexl, V., Piekorz, R., Topham, D., and Ihle, J. (1999a). Stat5 activation is uniquely associated with cytokine signaling in peripheral T cells. Immunity 11, 225–230.
Moriggl, R., Topham, D. J., Teglund, S., Sexl, V., McKay, C., Wang, D., Hoffmeyer, A., Van Deursen, J., Sangster, M. Y., Bunting, K. D., Grosveld, G. C., and Ihle, J. N. (1999b). Stat5 is required for IL-2-induced cell cycle progression of peripheral T cells. Immunity 10, 249–259.
Nowell, P. C. (1960). Phytohemagglutinin: an initiator of mitosis in cultures of normal human leukocytes. Cancer Res. 20, 462–468.
Paulo, J. A., Lee, L. S., Wu, B., Banks, P. A., Steen, H., and Conwell, D. L. (2011). Cytokine profiling of pancreatic fluid using the ePFT collection method in tandem with a multiplexed microarray assay. J. Immunol. Methods 369, 98–107.
Robb, R. J., Munck, A., and Smith, K. A. (1981). T cell growth factor receptors: quantitation, specificity, and biological relevance. J. Exp. Med. 154, 1455–1474.
Ruzankina, Y., Pinzon-Guzman, C., Asare, A., Ong, T., Pontano, L., Cotsarelis, G., Zediak, V. P., Velez, M., Bhandoola, A., and Brown, E. J. (2007). Deletion of the developmentally essential gene ATR in adult mice leads to age-related phenotypes and stem cell loss. Cell Stem Cell 1, 113–126.
Sadlack, B., Merz, H., Schorle, H., Schimpl, A., Feller, A. C., and Horak, I. (1993). Ulcerative colitis-like disease in mice with a disrupted interleukin-2 gene. Cell 75, 253–261. [See comments].
Schorle, H., Holtschke, T., Hunig, T., Schimpl, A., and Horak, I. (1991). Development and function of T cells in mice rendered interleukin-2 deficient by gene targeting. Nature 352, 621–624.
Seder, R. A., Germain, R. N., Linsley, P. S., and Paul, W. E. (1994). CD28-mediated costimulation of interleukin 2 (IL-2) production plays a critical role in T cell priming for IL-4 and interferon gamma production. J. Exp. Med. 179, 299–304.
Smith, K. (2010). The Quantal Theory of Immunity: The Molecular Basis of Autoimmunity and Leukemia. Singapore: World Scientific Publishing Co. Pte. Ltd.
Smith, K. A., Favata, M. F., and Oroszlan, S. (1983). Production and characterization of monoclonal antibodies to human interleukin 2: strategy and tactics. J. Immunol. 131, 1808–1815.
Stern, J. B., and Smith, K. A. (1986). Interleukin-2 induction of T-cell G1 progression and c-myb expression. Science 233, 203–206.
Turner, J. (1993). IL2-dependent induction of G1 cyclins in primary T cells is not blocked by rapamycin or cyclosporine A. Int. Immunol. 10, 1199–1209.
Vander Heiden, M., Cantley, L., and Thompson, C. (2009). Understanding the Warburg effect: the metabolic requirements of cell proliferation. Science 324, 1029–1033.
Williams, M., Tyznik, A., and Bevan, M. (2006). Interleukin-2 signals during priming are required for secondary expansion of CD8+ memory T cells. Nature 441, 890–893.
Keywords: interleukin-2, lymphocyte blastic transformation, T cell proliferation
Citation: Popmihajlov Z, Xu D, Morgan H, Milligan Z and Smith KA (2012) Conditional IL-2 gene deletion: consequences for T cell proliferation. Front. Immun. 3:102. doi: 10.3389/fimmu.2012.00102
Received: 18 January 2012; Accepted: 15 April 2012;
Published online: 10 May 2012.
Edited by:
Barbara Fazekas De St Groth, Centenary Institute of Cancer Medicine and Cell Biology, AustraliaReviewed by:
Günther H. S. Richter, Technische Universität München, GermanyBarbara Fazekas De St Groth, Centenary Institute of Cancer Medicine and Cell Biology, Australia
Copyright: © 2012 Popmihajlov, Xu, Morgan, Milligan and Smith. This is an open-access article distributed under the terms of the Creative Commons Attribution Non Commercial License, which permits non-commercial use, distribution, and reproduction in other forums, provided the original authors and source are credited.
*Correspondence: Kendall A. Smith, Division of Immunology, Department of Medicine, Weill Medical College, Cornell University, 407 East 61st Street, New York, NY 10065, USA. e-mail:a2FzbWl0aEBtZWQuY29ybmVsbC5lZHU=
†Present address: Heather Morgan, University of Surrey, Guildford, Surrey, UK.; Zoie Milligan, University of Surrey, Guildford, Surrey, UK.
‡Heather Morgan and Zoie Milligan have contributed equally to this work.