

- 1 Elmezzi Graduate School of Molecular Medicine, The Feinstein Institute for Medical Research, Manhasset, NY, USA
- 2 Center for Oncology and Cell Biology, The Feinstein Institute for Medical Research, Manhasset, NY, USA
- 3 Departments of Medicine and Molecular Medicine, Hofstra North Shore-LIJ School of Medicine, Manhasset, NY, USA
Controversy over the frequency of human B1 cells in normal individuals has arisen as different labs have begun to employ non-uniform techniques to study this population. The phenotypic profile and relative paucity of circulating human B1 cells place constraints on methodology to identify and isolate this population. Multiple steps must be optimized to insure accurate enumeration and optimal purification. In the course of working with human B1 cells we have developed a successful strategy that provides consistent analysis of B1 cells for frequency determination and efficient isolation of B1 cells for functional studies. Here we discuss issues attendant to identifying human B1 cells and outline a carefully optimized approach that leads to uniform and reproducible data.
Introduction
B1 cells constitute a distinct B cell lineage with a unique set of characteristics that includes constitutive production of natural antibody that is protective against microbial pathogens and that assists in the disposition of cellular debris. This antibody is broadly reactive, autoreactive, and repertoire skewed (Holodick et al., 2009a; Yoshikawa et al., 2009; Zhong et al., 2009; Baumgarth, 2011). In addition, B1 cells efficiently present antigen and strongly stimulate T cells via CD80/86 (Zhong et al., 2007), but are also capable of immunosuppression due, at least in part, to production of IL-10 (O’Garra et al., 1992; Popi et al., 2008; Lee et al., 2009b). Some or all of these activities may relate to continual signaling that is experienced by B1 cells (Holodick et al., 2009b). In model systems the number and/or function of B1 cells have been connected to autoimmune disease, cardiovascular disease, and other dyscrasias (Murakami et al., 1995; Iizuka et al., 1998; Peterson et al., 2008; Kyaw et al., 2011) Thus, B1 cells are involved in maintaining microbial defense and immune homeostasis, and dysfunction of B1 cells is associated with systemic illness. This has led to intense interest in the physiological and clinical roles of B1 cells, which, however, have been difficult to evaluate because clear markers for the human B1 cell population have been lacking for many years. Early efforts to identify human B1 cells using CD5 expression combined with expression of a B cell specific antigen, as in the murine system, have not been revealing because CD5 is expressed on multiple human B cell populations including activated, pre-naïve, and transitional B cells (Freedman et al., 1989; Sims et al., 2005; Lee et al., 2009a; Griffin et al., 2011a).
To elucidate markers that would better identify human B1 cells, functional criteria were established based on murine studies and then human B cells that fulfill those criteria were sought. Thus, human B cells that spontaneously secrete immunoglobulin, evidence tonic intracellular signaling, and efficiently stimulate T cells were targeted. Ultimately, a previously unrecognized population of CD20+ B cells within the CD27+ compartment, that is distinguished from memory B cells by expression of CD43, was identified (Griffin et al., 2011a). Beyond the qualifying characteristics noted above, human B1 cells further parallel mouse B1 cells in generating anti-DNA and anti-phosphorylcholine (PC) specificities, and in expressing a skewed variable heavy chain (VH) repertoire (Silverman et al., 2000; Zhong et al., 2009; Griffin et al., 2011a). The discovery of a phenotypic “address” for human B1 cells that is found within the CD27+ population, formerly considered to represent memory B cells, has fueled interest in human B1 cells from two different angles: to isolate human B1 cells for physiological and pathological examination; and, to remove human B1 cells to improve study of CD27+CD43− true memory B cells. However, a number of issues complicate efforts to recognize human B1 cells. The absence of a reference standard, or standard protocol, for study of human B1 cells has led to controversy concerning the actual frequency of human B1 cells in normal individuals (Griffin et al., 2011b). Successful approaches to optimize work with human B1 cells are discussed below.
Materials and Methods
Donors and Samples
Adult peripheral blood samples were obtained by venipuncture of adult volunteers after obtaining informed consent in accordance with the Declaration of Helsinki. Additional samples in the form of leukopacks were obtained from the New York Blood Center on the day of donation. This study was approved by, and all samples were obtained in accordance with, the Institutional Review Board of the North Shore-LIJ Health System.
Blood Sample Processing
All blood samples were treated in a similar manner and processed promptly upon receipt, except where the experimental design dictated otherwise. Peripheral blood and leukopack samples were initially diluted with RPMI 1640 medium (Cellgro) 1:1. Mononuclear cells were then obtained by density gradient centrifugation using lymphocyte separation medium (Cellgro) at 1,500 × g for 20 min at room temperature with no brake. The separated mononuclear cells were recovered from the buffy coat interface and resuspended in RPMI 1640. Mononuclear cells were then washed once with RPMI 1640 medium and pelleted by centrifugation at 500 × g for 15 min at room temperature with the brake on. Cells were resuspended in RPMI 1640 supplemented only with 10% FCS after which cell number and viability were determined with an automated cell counter (Digital Bio ADAM) after propidium iodide staining. For assays requiring prolonged culture, cells were resuspended in RPMI 1640 containing 10% fetal calf serum plus 2 mM L-glutamine, 10 mM HEPES (pH 7.25), 100 U/ml penicillin and 100 μg/ml streptomycin (without 2-ME).
B Cell Enrichment
For some experiments B cells were enriched by CD19 positive selection using the EasySep Human CD19+ B cell magnetic bead selection kit (StemCell Technologies) according to the manufacturer’s instructions. For some experiments B cells were enriched by CD20 positive selection using the EasySep Human CD20+ B cell magnetic bead selection kit (StemCell Technologies).
Cell Sorting and Flow Cytometric Analysis
Cells were stained using a master mix of antibodies to maintain consistency among the samples. Cells for analysis and sorting were blocked with, and then stained in, dye-free RPMI 1640 supplemented with 10% FCS. For analysis, immunofluorescently stained cells suspended at 1 million/ml were examined at a flow rate of 1,000 cellular events per second or less on a BD Biosciences LSR-II and/or a Beckman-Coulter Gallios cytometer. Cells were vortexed briefly (1–2 s) directly before analysis. Doublet frequency was monitored during analysis in real time and stained cells were vortexed again if doublet frequency exceeded 2% or CD3+CD20+ events in the viable cell gate exceeded 1%. For sort purification, immunofluorescently stained cells (CD19 enriched B cells or PBMC) were suspended at a concentration below 10 million cells/ml in dye-free RPMI 1640/10% FCS supplemented with 2 mM EDTA and separated on an Influx instrument (BD Biosciences) at a flow rate not exceeding 5,000 cellular events per second unless otherwise noted, and a sheath core differential of 2 psi or less. Stained cells were periodically vortexed for 2 s and at times when flow rates dropped by greater than 20% or cells sedimented in sample tubes.
Cell Freezing, Thawing, and Fixing
Cells (100 million or less) were pelleted and gently resuspended in 1 ml freezing solution containing 90% FCS and 10% DMSO at room temperature. Cells were quickly transferred to 2 ml cryovials and cooled by placement of these vials in freezing containers (Mr Frosty) in a −80°C freezer for a minimum of 48 h before transfer to liquid nitrogen for prolonged storage at −160°C. Cells were thawed by warming frozen vials in a 37°C water bath until ice was no longer visible, after which 1 ml of pre-warmed RPMI 1640 without supplementation was added to the now thawed cells in the cryovial. Cells were gently mixed to avoid excessive shear forces and transferred drop wise into 9 ml pre-warmed RPMI 1640. Cells were then pelleted and washed once with RPMI 1640 supplemented with 10% FCS. When necessary, cells were fixed by suspending them in 1.6% paraformaldehyde for 15 min at room temperature and were then washed and resuspended in PBS.
Reagents
Fluorescently labeled mouse antibodies (anti-CD20-V450 cat#642274 clone L27 IgG1κ, anti-CD27-APC cat#337169 clone L128 IgG1κ, anti-CD43-FITC cat#555475 clone 1G10 IgG1κ, and anti-CD3-PE cat#555333 clone UCHT1 IgG1κ, V450-Isotype control cat#560373 clone MOPC-21 IgG1κ, APC-Isotype control cat#555751 clone MOPC-21 IgG1κ FITC-Isotype control cat#555748 clone MOPC-21 IgG1κ, and PE-Isotype control cat#340761 clone X40 isotype IgG1 κ), were obtained from BD Biosciences.
Results
Overview
B1 cells represent a small subset residing within a dominant B cell population, as a result of which the ability to distinguish B1 cells from other lymphocytes is dependent on key parameters including: the selection, quality, and efficiency of immunofluorescent staining; the sensitivity and specificity of fluorescence excitation and detection; the specific application and hierarchy of gating strategies; and, the competency of computerized algorithms for cytometric data interpretation. Moreover, the phenotypic nature of human B1 cells, encompassing expression of CD20, CD27, and CD43, imposes certain limitations on methodology to identify and isolate this population; in particular, CD27 and CD43 expression is shared by most peripheral blood T cells, whose numbers far outweigh the number of B cells, so that B (CD20+)-T (CD27+CD43+) doublets could be mistaken for B1 cells. These and other issues discussed below dictate the need for careful review of technical considerations to optimize identification and recovery. Recommended procedures are discussed below in more or less chronological order leading from initial blood sample to analyzed/sorted B1 cell preparation.
Initial Cell Handling
The most accessible B1 cell-containing human tissue is blood, and typical samples arrive either as newly drawn adult peripheral blood, as recently processed adult blood leukopacks, or as freshly obtained umbilical cord blood. Access to the first is measured in minutes, whereas access to the latter two samples is typically measured in hours. In general, the more immediate the sample, the better the B1 cell recovery. From each of the sources noted above peripheral blood mononuclear cells (PBMC) are obtained by density gradient centrifugation after dilution as described in “Materials and Methods.” Although heparin is typically used for anticoagulation of newly drawn peripheral blood, some samples, such as leukopacks and umbilical cord blood samples, may rely on citrate anticoagulation which can be reversed with calcium-containing buffers, such as Hank’s balanced salt solution. This may lead to clot formation interfering with subsequent steps. Thus, dilution of citrate-containing samples with medium or buffer containing no calcium (e.g., PBS) is preferred.
Tissue samples such as spleen, tonsil, or lymph node are likely to become available with typically longer delays than noted above, such that changes occurring due to loss of viability prior to acquisition may be an issue. Analysis of such specimens is likely to benefit from viability staining to eliminate dead and dying cells. Viability staining may also be appropriate with blood samples if/when deterioration is suspected; however, it should be noted that annexin V staining is not suitable for recognizing apoptotic B1 cells (Dillon et al., 2001).
Immunofluorescent Staining and B1 Cell Recognition
Optimization of staining parameters facilitates recognition of human B1 cells. Mature B cells typically express both CD19 and CD20. Of note, however, as B cells differentiate to become plasmablasts and plasma cells, CD20 is lost but CD19 remains, as CD38/CD138 is acquired (Jego, 2001). Thus, in terms of antibody selection for immunofluorescent staining of B cells, identification with anti-CD20 rather than anti-CD19 is preferred, in order to avoid those B cells that are committed to plasmacytic differentiation (Table 1).
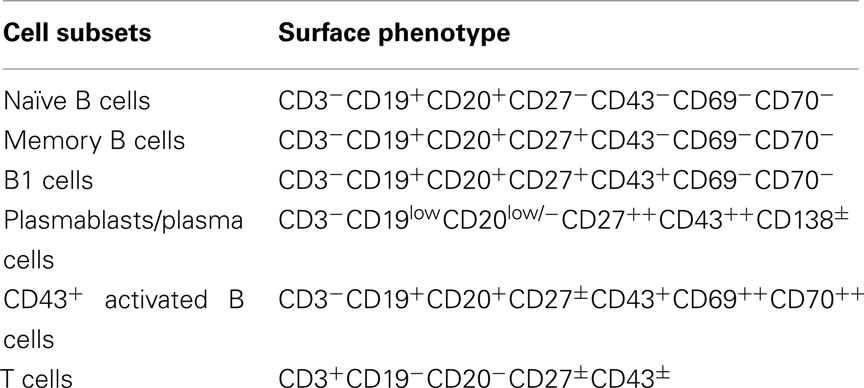
Table 1. Surface phenotype of major lymphocyte classes.
Because expression by T cells of both CD27 and CD43 could complicate analysis of B1 cells as a result of B:T doublet formation (see below), anti-CD3 is added to exclude T cells from consideration, as displayed in the typical gating strategy for B1 cell identification shown in Figure 1. Although rare CD20+ B cells that express CD3 have been reported to exist (Yokose et al., 2001; Wang et al., 2009; Perez-Andres et al., 2011), normal B1 cells do not express CD3 (Griffin et al., 2011b). The addition of CD3-negative gating also reduces concerns that positive staining for any marker results from high autofluorescence and/or non-specific binding and is thus artifactual.
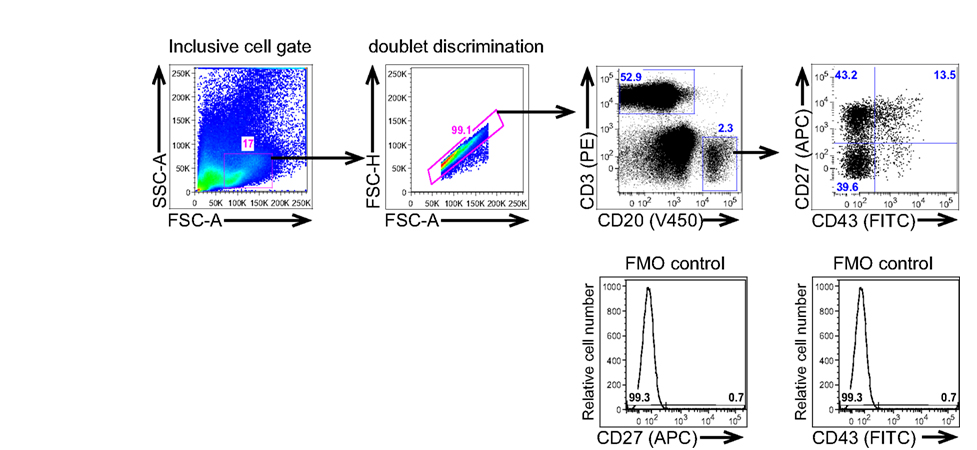
Figure 1. Human B1 cells are identified by immunofluorescent staining and analysis of peripheral blood mononuclear cells. Adult peripheral blood mononuclear cells PBMC) were immunofluorescently stained for CD20(V450), CD27(APC), CD43(FITC), and CD3(PE), and were then evaluated by flow cytometric analysis on a BD LSR-II. The gating strategy used to separate CD3−CD20+CD27−CD43− (naive B cells), CD3−CD20+CD27+CD43− (memory B cells), and CD3−CD20+CD27+CD43+ (B1 cells) for a typical adult blood sample is shown along with the FMO controls that were used to determine the gates for CD27 and CD43 positivity.
Among CD20+ B cells, B1 cells are recognized by expression of CD27 and CD43. These markers coincide in umbilical cord blood samples, as no memory B cells are present at birth, whereas in adult peripheral blood, CD43 separates B1 cells from the CD27+ B cell population which contains both B1 cells and true memory B cells (Griffin et al., 2011a). Notably, CD43 expression on B1 cells is lower than CD43 expression on T cells (or activated B2 cells). For this reason successful identification of B1 cells depends on the use of anti-CD43 antibody-fluorophore conjugates with high signal-to-noise ratios, such as FITC, PE, or APC, and suitably sensitive fluorophore detection (see below). The larger the gulf between positive and negative B cells, particularly with respect to CD43, the more readily B1 cells can be distinguished from other B cell types and the more reliably frequency values can be determined (Figures 2A and 3). The ability to more clearly demarcate CD43+ B1 cells facilitates further phenotypic-functional characterization of this population as we have done using CD11b (Griffin and Rothstein, 2011; Griffin et al., 2012).
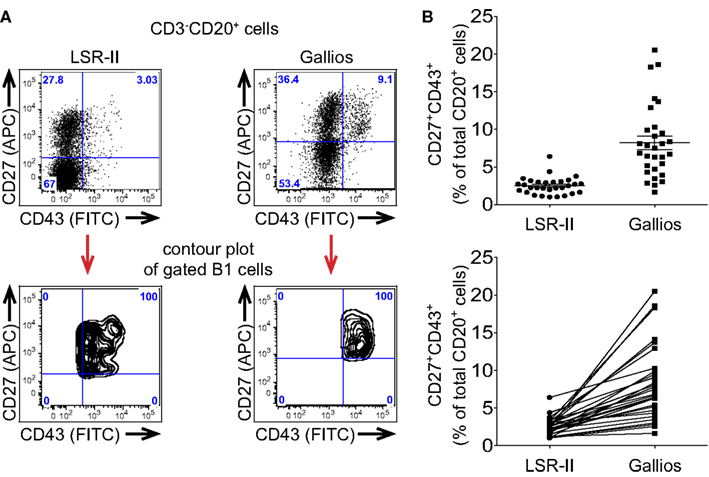
Figure 2. Different flow cytometers are more or less effective in distinguishing CD43+ B1 cells leading to different frequency determinations. (A,B) Adult peripheral blood mononuclear cells were immunofluorescently stained for CD20, CD27, CD43, and CD3, were fixed and were then evaluated by flow cytometric analysis. (A) Expression of CD27 and CD43 by the same CD3-CD20+ singlet gated cells is shown as a dot plot for 2 different flow cytometers. Mapping of CD3−CD20+CD27+CD43+ (B1) cells is shown as a contour plot for each of two different flow cytometers. (B) Frequency determinations for the same fixed CD3−CD20+CD27+CD43+ (B1) cells analyzed on a BD LSR-II flow cytometer and a Beckman-Coulter Gallios flow cytometer are shown in the top plot, along with lines indicating mean values and standard errors of the means (n = 30), while the same values for B1 cell frequencies are shown in the bottom plot along with connector lines identifying the same sample on each machine.
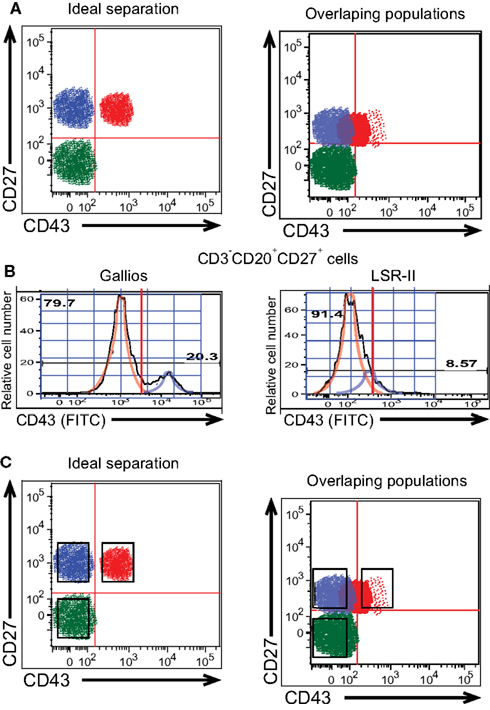
Figure 3. Gating to distinguish positively and negatively stained B cells is difficult when populations overlap. (A) Diagrammatic models of ideal separation vs overlapping detection of CD43+ and CD43− populations of CD27+ B cells are shown. (B) Adult peripheral blood mononuclear cells were immunofluorescently stained for CD20, CD27, CD43, and CD3, and were then evaluated by flow cytometric analysis. Expression of CD43 on CD3−CD20+CD27+ cells as detected by a BD LSR-II flow cytometer and a Beckman-Coulter Gallios flow cytometer on the same representative adult peripheral blood sample is displayed as a histogram along with idealized normal distribution curves. (C) Diagrammatic models of sorting gates applied to ideal separation vs overlapping detection of cell populations are shown.
The signal-to-noise ratio of antibody-fluorophore conjugates is only apparent following excitation and detection and thus instrument characteristics play a key role in determining the efficiency with which B1 cells are recognized. These features include laser intensity and stability; fiberoptic path length; filter number, bandwidth and efficiency; fluorescence detector sensitivity; and, coincident rejection rate; among others, all of which are beyond the scope of the present discussion. In aggregate, instrument variables alone can greatly affect recognition and enumeration of B1 cells. When the exact same immunofluorescently stained and fixed PBMC were evaluated on two different flow cytometers, CD43 expression by CD20+CD27+ B cells was more cleanly distinguished on one instrument (Gallios) than the other (LSR-II), as illustrated by contour display of the gated CD20+CD27+CD43+ B1 cells on the CD27 by CD43 plot (Figure 2A). This then produced a perceived difference in B1 cell frequency, which was erroneously low when CD43 separation was poor (Figure 2B) because of population overlap and gating issues resulting there from (see below).
Existing machines can be optimized for visualization of antigens expressed at low levels. Replacement of the standard bandpass filters by filters with broader ranges will result in collection of more emitted light. This will result in improved frequency determinations for human B1 cells on the same instrument, dependent on the degree of optimization for detection of poorly expressed markers such as CD43. Adjusting the photomultiplier (pmt) voltage to achieve the greatest separation between positive and negative populations rather than arbitrary placement of the negative population in the first decade should also be considered.
Gating and B1 Cell Enumeration
The ultimate arbiter of frequency for, and/or isolation of, any phenotypically identified population lies in the way in which gating structures and boundaries are applied to fluorescence images thereby defining the cells of interest. Where populations overlap, slight changes in the location of the cutoff between positive and negative cells will greatly influence measured frequencies. This is exemplified by CD43 staining, discussed above, and is illustrated conceptually in Figure 3A. Setting a line that distinguishes CD43+ from CD43− B cells that express CD27 is simple when the antibody, fluorophore, and instrument yield clear separation between B cells that do and do not express CD43. However, when low expression or low detection result in overlap between the contours of CD43-expressing and non-expressing B cells, gating placement becomes both more difficult and more critical to the numbers generated. Note that line setting to distinguish positive and negative staining is critical to enumerate members of a population, the goal of which is accurate determination of cell composition. In contrast, cell sorting for population isolation strives for maximum purity, so that collection gates typically omit a region in between markedly positive and clearly negative (Griffin et al., 2011b; Figure 3C).
A further illustration of CD43 discrimination at a single CD27 intensity is displayed in histogram plots of relative cell number vs CD43 expression for duplicate samples analyzed on the Gallios and LSR-II cytometers (Figure 3B). When machine (or staining) characteristics fail to provide a clear separation between positive and negative expression (see LSR-II), positive values (i.e., blue idealized tracing) blend with negative values (i.e., orange idealized tracing) such that any cutoff for CD43 positivity will, of necessity, include CD43 negative cells that don’t belong or omit CD43 positive cells that do belong, or both. In contrast, clear separation between positive and negative expression (see Gallios) markedly improves the ease, reproducibility, and validity with which a positive cutoff can be chosen.
Several methods have been advocated for delineating gate-setting that separates positive and negative staining values when clear separation is not achievable, with most focusing on generic approaches consisting of either no-staining controls, irrelevant-antibody-isotype-matched controls, and fluorescence-minus-one (FMO) controls (Perfetto et al., 2004; Maecker and Trotter, 2006). The choice and use of these controls can have a significant impact on determination of B1 cell frequencies. With respect to CD43+ B1 cells, no-stain controls often underestimate the cutoff between positive and negative populations, while use of either isotype-matched controls or FMO controls result in very similar cutoffs between positive and negative values (Perfetto et al., 2004). FMO works to control for fluorescence signals in the CD43 channel due to staining with other antibody-fluorophore conjugates; isotype control staining (that matches the CD43 isotype) works to control for non-specific and/or FcR binding. A typical protocol sets quadrant thresholds such that less than 1% of control events are positive for any single stain. It should be recognized that despite these aids, application of any linear distinction to overlapping distributions will in all likelihood lead to erroneous enumeration of the B1 cell population, as noted above. This general problem may be addressed computationally by determining for normal distributions the extent to which one contour/population extends within another using gaussian sums or non-linear least squares analysis. The highest level of accuracy for calculating this overlap may be through the use of models such as the Watson Pragmatic or the Dean-Jett-Fox, as has been done for calculation of cell cycle stage (Fox, 1980; Watson et al., 1987). However, the best solution to this problem lies in approaches that produce a clear gulf between those cells that express CD43 and those that lack it by virtue of optimized antibody, fluorophore and instrument choices (Figure 2A).
Avoiding Doublets While Still Including B1 Cells
Because T cells are much more abundant than B cells in the peripheral circulation, any stochastic tendency of B cells to adhere to another lymphocyte will likely involve a B:T combination. It is not clear however that all doublets result from purely stochastic processes so the actual rather than predicted types of doublets involving B cells may vary for different B cell subpopulations. Because most T cells express CD27 and CD43, any B:T doublet is likely to phenotype as CD20+ (contributed by the B cell constituent), and CD27+CD43+ (contributed by the T cell constituent; Figure 4). Thus, it is important to employ means to avoid and/or eliminate doublets in order to avoid enumeration of naive B:T doublets and memory B:T doublets as B1 cells resulting in artifactual inflation of B1 cell frequencies.
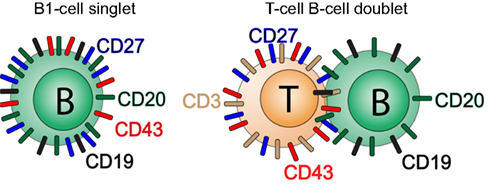
Figure 4. B:T doublets can masquerade as CD20+CD27+CD43+ B1 cells. A diagrammatic model for the phenotypic readout of B:T doublets is shown.
Modern flow cytometer software incorporates algorithms that make it possible to detect and reject doublets and coincident events, based on area vs height or pulse-width considerations, thereby eliminating events that fall outside typical parameters for the size and roundness of single cells. There are three reasons why this approach can be problematical. (1) Two cells may line up one behind the other with respect to the light path so that a doublet masquerades as having a normal area/height configuration and fails to be rejected, leading to inadvertent overcounting; (2) Rejection of large numbers of cells presented for analysis may entail omission of many cells of interest that are tied up in doublets, leading to inadvertent undercounting; and, (3) Doublet discrimination parameters used to separate normal spherical cell shapes and sizes from outliers are essentially arbitrary and cannot incorporate perfect sensitivity and specificity and thus may omit unusually large or irregularly shaped cells (Bauer, 1993; Wersto et al., 2001). For these reasons the best and most accurate approach is to avoid or reverse doublet formation before B1 cell analysis and/or isolation, rather than rely on after-the-fact doublet discrimination (Bauer, 1993). Several simple steps markedly reduce the number of doublets contained within interrogated samples. These include dilution of cell suspensions to less than 1 million cells/ml and brief vortexing of samples just prior to analysis. The relationship between these parameters and doublet frequencies is shown elsewhere (Griffin et al., 2011b). Notably, excessive vortexing itself can lead to doublet formation so no more than 1–2 s is recommended. In addition, cytometer run speeds of 1,000 cellular events per second or less reduce coincident events and help to insure that only single events are evaluated. Although doublet formation should be negligible with these precautions, CD3-negative gating will exclude any remaining B:T doublets.
Following CD3-negative gating all the CD20+CD27+CD43+ events should correspond to B1 cells as naïve and memory B cells are negative for CD43 expression and consequently would not fall into this gate. However, it is conceivable that memory B cells might form doublets with activated B cells or with myeloid/monocyte cells, in each case producing CD20+CD27+CD43+ events. Doublet discrimination can then be used as a supplementary means of excluding doublets that may have persisted through the preparatory steps discussed above. When employing pulse-gating methods for doublet or aggregate discrimination, gating should be based on clearly defined singlet vs doublet populations to avoid arbitrary exclusion of singlet cells with larger size and/or lower sphericality. Since most doublet discrimination relies on the relationship between size and either area or width a perfectly round cell will fall in the center of a histogram or contour visualization of singlet cells. There will be a certain width to the histogram or contour visualization of single cells based on the mathematical principle of probabilistic aggregation formation, whereby events of a given population cluster about a mean value with a slight degree of random variation that results in a bell shaped curve (Sharpless and Melamed, 1976; Wersto et al., 2001). In examining cells, a portion of which have a slightly larger and/or less round shape, there should be an expected skew to the right for the single cell histogram with a disproportionate number of B1 cells to the right of the mean (Figures 5A,B). Despite this skew, doublet cells should be visible as a distinct and separate population, especially when their number is increased by intentional gating on CD3+CD20+ events. This, then, can provide information regarding the proper placement of doublet discrimination gates (Figures 5A,B). Because B1 cells are in general larger and more irregular in shape than naïve B cells (Griffin and Rothstein, 2011; Griffin et al., 2011b) aggressive doublet discrimination as in gating that excludes the right skew of the contour is likely to disproportionately exclude B1 cells from consideration and lead to erroneously low frequency determinations.
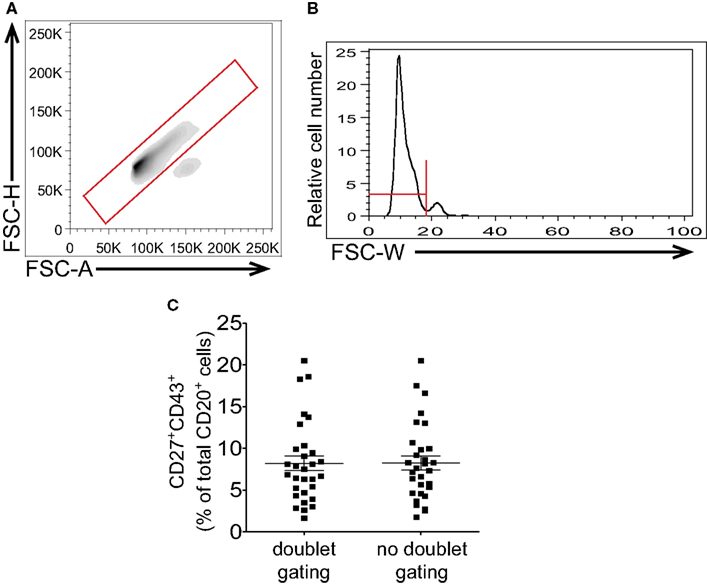
Figure 5. Gating to eliminate doublets should not impinge on large or irregularly shaped cells. Adult peripheral blood mononuclear cells were immunofluorescently stained for CD20, CD27, CD43, and CD3, and were then evaluated by flow cytometric analysis. Examples of doublet discrimination by FSC-H/FSC-A [LSR-II instrument (A)] and FSC-W [Gallios instrument (B)] are shown along with recommended gates. (C) Frequency determinations for CD3−CD20+CD27+CD43+ B1 cells resulting from doublet discrimination vs no doublet discrimination strategies after analysis on a Gallios flow cytometer are shown along with lines indicating mean values and standard errors of the means (n = 30).
The locations of singlet events and doublet events will be clearly indicated even without gating on CD3+CD20+ events if the interrogated sample contains a significant number of doublets. However, if samples are vortexed, and if CD3 exclusion is employed, few, if any, doublets should be detected, as a result of which B1 cell frequencies determined with and without doublet discrimination should vary little (Figure 5C). For consistency, we recommend following the gating strategy as outlined in Figure 1 which includes both doublet gating and CD3-negative gating.
Unfortunately there may be times when the situation is less than optimal and cell preparations are not presented for analysis as true single cell suspensions. In such circumstances doublet discrimination can be used to computationally eliminate doublets that will both improve the reliability of data analysis and provide important information regarding the quality of the sample being analyzed. Thus, any significant difference in B1 cell frequency noted with/without doublet discrimination, or the presence of a large number of detected CD3+CD20+ events, would suggest improvements are needed in initial sample preparation to counteract doublet formation and/or persistence.
The effectiveness of doublet avoidance can be measured in several different ways. Monitoring DNA content after staining with Hoechst 33342, enumeration of CD20+CD3+ events after anti-CD3 staining, and determination of cells falling outside doublet discrimination settings, can each provide information on the relative abundance of singlet events that were evaluated and/or sorted.
The goal of interrogating dilute cell suspensions at modest events per second, to avoid doublets, is not always possible during sort purification of infrequent cell populations. In this situation enrichment of B cells with anti-CD19-magnetic bead conjugates substantially diminishes apparent B:T doublet formation (and in this respect Stem Cell Technology conjugates appear to yield higher post-enrichment B1 cell frequencies than Miltenyi products). In addition, suspension of cells in 2 mM EDTA counteracts doublet formation.
Optimizing B1 Cell Identification, Recovery, and Study
The characteristics and behaviors of human B1 cells suggest additional means to enhance identification and recovery. Although most B1 cells fall within typical lymphocyte gating for size (FSC) and granularity (SSC), some do not. For this reason a larger than usual cell gate will include more B1 cells (Figure 1) At the same time, more non-B cells will be captured requiring additional care to select only B cells for evaluation.
As noted above, the rapidity with which blood samples are processed following acquisition, the better the identification and isolation of B1 cells. The detection and/or recovery of B1 cells is diminished by any postponement of sample processing, regardless of condition. Samples retained overnight as heparinized whole blood or as separated PMBC, at room temperature or at 4°C, lose B1 cells (Figure 6A) due at least in part to loss of detectable CD27 expression, so that CD20+CD27−CD43+ B cells are now found in substantial numbers. B1 cell frequencies are successfully preserved through either of two approaches for delayed analysis: (1) Freeze cells and thaw when ready to immunofluorescently stain, and then analyze or sort; or (2) Fix immunofluorescently stained cells for later analysis (Figure 6B). In particular, appropriate freezing and thawing procedures yield high post-thaw viability (Figure 6C) and undiminished B1 cell frequencies (Figure 6B). Despite using optimal techniques the frequency for human B1 cells is clearly lower when leukopack samples are compared to freshly drawn samples, which may be due either to the time delay in acquisition of leukopack samples, or to the nature of leukpack processing prior to acquisition, or both (Figure 6D).
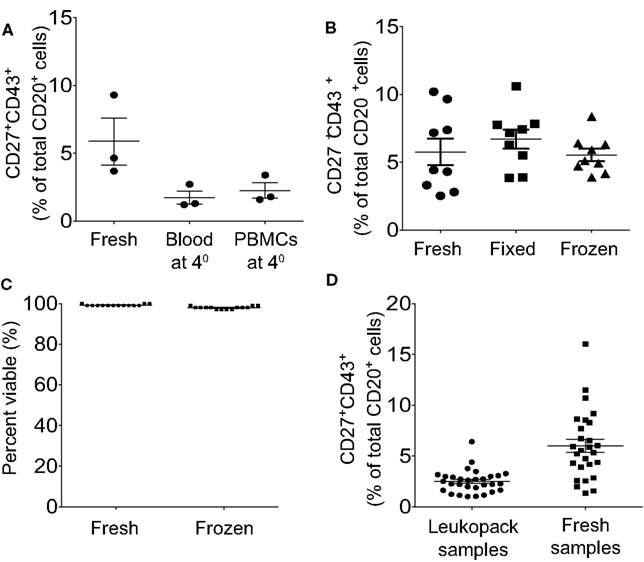
Figure 6. Peripheral blood samples should be analyzed immediately or frozen or fixed for later analysis, and within these parameters fresh samples are preferable to leukopack samples. (A) Adult peripheral blood samples were processed immediately and then stained and analyzed immediately (Fresh), stored as whole blood for 24 h at 4°C before being processed and then stained and analyzed (Blood at 4°), or processed immediately and stored as PBMC for 24 h at 4°C before being stained and analyzed (PBMC at 4°). Three independent determinations of identified CD3−CD20+CD27+CD43+ B1 cell frequencies are shown for the three different approaches, along with lines indicating mean values and standard errors of the means. (B) Adult peripheral blood samples were processed immediately to PBMC and were then immunofluorescently stained for CD20, CD27, CD43, and CD3 and immediately analyzed (Fresh); or the samples were processed immediately to PBMC, immunofluorescently stained for CD20, CD27, CD43, and CD3, and then fixed for analysis the next day (Fixed); or the samples were processed to PBMC, frozen for 48 h, thawed and then immunofluorescently stained for CD20, CD27, CD43, and CD3 and immediately analyzed (Frozen). Determinations of identified CD3−CD20+CD27+CD43+ B1 cell frequencies are shown for the three different approaches, along with lines indicating mean values and standard errors of the means (n = 9). (C) Adult peripheral blood samples were processed immediately to PBMC, which were then evaluated for viability after staining with PI, or were frozen and then thawed, after which post-thaw viability on total ungated cells was evaluated with PI staining using Digital Bio ADAM, as per Methods. Individual determinations of cell viability (percent) are shown along with lines indicating mean values (n = 14). (D) Cells obtained from leukopacks were processed immediately upon receipt, and blood obtained from healthy donors was processed immediately post-phlebotomy (Fresh samples), to obtain PBMC that were immunofluorescently stained for CD20, CD27, CD43, and CD3. Determinations of identified CD3−CD20+CD27+CD43+ B1 cell frequencies are shown for the two types of individual donors along with lines indicating mean values and standard errors of the means (n = 30 leukopack samples, n = 27 healthy donors).
Discussion
The peculiarities of human B1 cells – representing a small B cell population that shares surface antigens with memory B cells, T cells, and monocytes/macrophages – amplify any shortcomings in standard approaches to immunofluorescent staining and analysis. Failure to optimize protocols can easily lead to erroneous assignment and either undercounting or overcounting of B1 cell numbers, with similarly detrimental implications for functional studies of sort-purified B1 cell characteristics.
Because CD43 “carves out” B1 cells from among CD27+ B cells that have been characterized as memory B cells, it is now clear that much memory B cell work to date has been conducted on heterogeneous populations that included “true” memory B cells (CD27+CD43−) and B1 cells (CD27+CD43+). Some characteristics of memory B cells, such as efficient allogeneic T cell stimulation, appear to belong specifically to B1 cells (Griffin and Rothstein, 2011; Griffin et al., 2011a). Thus, it is critically important to properly identify B1 cells not only to seek out the role and function of B1 cells, but to properly evaluate the features of other B cell types in the absence of “contamination” by included but unrecognized B1 cells.
Human B1 cells do not express CD3, for which reason CD3 expression can be used to monitor the frequency with which B:T doublets have persisted and have become subject to analysis. Along the same lines, CD3 expression can be used as an exclusionary criterion to eliminate B:T doublets from consideration. However, it is important to emphasize our general bias against exclusionary criteria during identification of new lymphocyte populations lest B cells displaying unexpected surface antigens remain unrecognized. This principle is well illustrated by the phenotype of human B1 cells that includes determinants (e.g., CD27, CD43) better known as characteristics of other immune cell populations (Zhong et al., 2009; Griffin and Rothstein, 2011; Griffin et al., 2011a). With human B1 cells, CD3 represents the exception rather than the rule. Overall, we favor positive identification and an initial approach that eschews the use of exclusionary criteria to assist in identification of specific B cell populations.
The relative loss of CD27 staining when PBMC processing is delayed leads to a conundrum regarding gating strategy because the topographical representation of CD27 then bridges the line separating CD27+ and CD27− B cells. This forces a choice between including the entire CD43+ contour, encompassing portions that are formally (by FMO) CD27−, or including just that portion of the contour that is clearly CD27+. This, though, may be a choice that need not be made. At the present time it appears that no other B cells beyond B1 cells constitutively express CD43, although naïve and memory B cells do so after activation. However, CD43-expressing activated naïve and memory B cells express CD69 and CD70, whereas CD43− expressing B1 cells do not, as noted elsewhere (Griffin et al., 2011a). Thus, it may be that human B1 cells can be adequately identified simply as CD20+CD43+ along with CD70−, although this remains to be verified under all conditions.
In our work to date we have documented extremely wide variation in the frequencies of B1 cells in the peripheral circulation of normal volunteers. Whereas there is a general trend toward fewer B1 cells in older individuals, at every age the range of “normal” B1 cell frequencies may span less than 1% to greater than 9% of circulating B cells. Some of these values may represent biological or statistical outliers, perhaps seemingly “normal” individuals who harbor an illness that is not yet apparent. Alternatively, a large reservoir of B1 cells may exist somewhere in the body (e.g., the peritoneal cavity, as in mice) such that despite variations in circulating B1 cells, the total body number of B1 cells is similar from individual to individual and for a given individual from time to time. Beyond these considerations, it is always necessary to apply appropriate statistical analysis before drawing conclusions that associate high or low frequencies of B1 cells with any particular disease state or normal parameter to be sure that adequate numbers of samples have been examined.
Summary of key approaches and recommendations:
1) Process biological samples urgently upon removal from the individual; immediately freeze, or stain and fix cells, if processing delays are unavoidable.
2) Utilize high affinity, high specificity antibodies for CD43 coupled to fluorophores with high signal-to-noise ratios (e.g., FITC, PE, APC) and analyze on a flow cytometer with optimal filters and high sensitivity.
3) Apply FMO controls in multiparametric analysis to set population-defining gates in the absence of clear separation between populations. It is possible to use isotype controls in setting gates, if four or fewer fluorophores are employed (consistently apply the chosen approach across all samples in a given experiment).
4) Prepare samples at appropriate concentrations for analysis (1 million cells/ml or less) and agitate to prevent/reverse doublet formation. Use EDTA (2 mM) during sort purification.
Acquire samples at rates that do not increase coincident events, such as 1,000 cellular events/s. Use inclusive cell gating whereby all cells are included and do not focus on a preconceived gate for lymphocytes.
5) Employ CD3 exclusion in the gating hierarchy to avoid B:T cell doublets, but do not use additional negative gating until it is proven appropriate to do so with the same degree of rigor used to establish CD3 as a negative gating marker.
6) Rely on doublet discrimination sparingly, keeping in mind that although it can counteract poor sample preparation and inherent cell–cell attraction, its use is accompanied by substantial collateral effects.
Conflict of Interest Statement
The authors declare that the research was conducted in the absence of any commercial or financial relationships that could be construed as a potential conflict of interest.
Acknowledgments
The authors thank Dr. Nichol E. Holodick for critical review of the manuscript. This work was supported by grants from the National Institutes of Health, the Lupus Research Institute, and the Zucker Family Foundation.
References
Bauer, K. D. (1993). Quality control issues in DNA content flow cytometry. Ann. N. Y. Acad. Sci. 677, 59–77.
Baumgarth, N. (2011). The double life of a B-1 cell, self-reactivity selects for protective effector functions. Nat. Rev. Immunol. 11, 34–46.
Dillon, S. R., Constantinescu, A., and Schlissel, M. S. (2001). Annexin V binds to positively selected B cells. J. Immunol. 166, 58–71.
Fox, M. H. (1980). A model for the computer analysis of synchronous DNA distributions obtained by flow cytometry. Cytometry 1, 71–77.
Freedman, A. S., Freeman, G., Whitman, J., Segil, J., Daley, J., and Nadler, L. M. (1989). Studies of in vitro activated CD5+ B cells. Blood 73, 202–208.
Griffin, D. O., Holodick, N. E., and Rothstein, T. L. (2011a). Human B1 cells in umbilical cord and adult peripheral blood express the novel phenotype CD20+ CD27+ CD43+ CD70. J. Exp. Med. 208, 67–80.
Griffin, D. O., Holodick, N. E., and Rothstein, T. L. (2011b). Human B1 cells are CD3−, A reply to “A human equivalent of mouse B-1 cells?” and “The nature of circulating CD27+CD43+ B cells.” J. Exp. Med. 208, 2566–2569.
Griffin, D. O., Quach, T., Batliwalla, F., Andreopoulos, D., Holodick, N. E., and Rothstein, T. L. (2012). Human CD11b+ B1 cells are not monocytes, A reply to Gene profiling of CD11b+ and CD11b− B1 cell subsets reveals potential cell sorting artifacts. J. Exp. Med. 209, 434–436.
Griffin, D. O., and Rothstein, T. L. (2011). A small CD11b(+) human B1 cell subpopulation stimulates T cells and is expanded in lupus. J. Exp. Med. 208, 2591–2598.
Holodick, N. E., Repetny, K., Zhong, X., and Rothstein, T. L. (2009a). Adult BM generates CD5+ B1 cells containing abundant N-region additions. Eur. J. Immunol. 39, 2383–2394.
Holodick, N. E., Tumang, J. R., and Rothstein, T. L. (2009b). Continual signaling is responsible for constitutive ERK phosphorylation in B-1a cells. Mol. Immunol. 46, 3029–3036.
Iizuka, J., Katagiri, Y., Tada, N., Murakami, M., Ikeda, T., Sato, M., Hirokawa, K., Okada, S., Hatano, M., Tokuhisa, T., and Uede, T. (1998). Introduction of an osteopontin gene confers the increase in B1 cell population and the production of anti-DNA autoantibodies. Lab. Invest. 78, 1523–1533.
Jego, G. (2001). Interleukin-6 is a growth factor for nonmalignant human plasmablasts. Blood 97, 1817–1822.
Kyaw, T., Tay, C., Krishnamurthi, S., Kanellakis, P., Agrotis, A., Tipping, P., Bobik, A., and Toh, B. H. (2011). B1a B lymphocytes are atheroprotective by secreting natural IgM that increases IgM deposits and reduces necrotic cores in atherosclerotic lesions. Circ. Res. 109, 830–840.
Lee, J., Kuchen, S., Fischer, R., Chang, S., and Lipsky, P. E. (2009a). Identification and characterization of a human CD5+ pre-naive B cell population. J. Immunol. 182, 4116–4126.
Lee, J., Suh, J., and Choi, J. (2009b). B-1 cell-derived monoclonal antibodies and costimulatory molecules. J. Surg. Res. 154, 293–298.
Maecker, H. T., and Trotter, J. (2006). Flow cytometry controls, instrument setup, and the determination of positivity. Cytometry A 69, 1037–1042.
Murakami, M., Yoshioka, H., Shirai, T., Tsubata, T., and Honjo, T. (1995). Prevention of autoimmune symptoms in autoimmune-prone mice by elimination of B-1 cells. Int. Immunol. 7, 877–882.
O’Garra, A., Chang, R., Go, N., Hastings, R., Haughton, G., and Howard, M. (1992). Ly-1 B (B-1) cells are the main source of B cell-derived interleukin 10. Eur. J. Immunol. 22, 711–717.
Perez-Andres, M., Grosserichter-Wagener, C., Teodosio, C., van Dongen, J. J., Orfao, A., and van Zelm, M. C. (2011). The nature of circulating CD27+CD43+ B cells. J. Exp. Med. 208, 2565–2566; author reply 2566–2569.
Perfetto, S. P., Chattopadhyay, P. K., and Roederer, M. (2004). Seventeen-colour flow cytometry, unravelling the immune system. Nat. Rev. Immunol. 4, 648–655.
Peterson, L. K., Tsunoda, I., and Fujinami, R. S. (2008). Role of CD5+ B-1 cells in EAE pathogenesis. Autoimmunity 41, 353–362.
Popi, A. F., Godoy, L. C., Xander, P., Lopes, J. D., and Mariano, M. (2008). B-1 cells facilitate Paracoccidioides brasiliensis infection in mice via IL-10 secretion. Microbes Infect. 10, 817–824.
Sharpless, T. K., and Melamed, M. R. (1976). Estimation of cell size from pulse shape in flow cytofluorometry. J. Histochem. Cytochem. 24, 257–264.
Silverman, G. J., Shaw, P. X., Luo, L., Dwyer, D., Chang, M., Horkko, S., Palinski, W., Stall, A., and Witztum, J. L. (2000). Neo-self antigens and the expansion of B-1 cells, lessons from atherosclerosis-prone mice. Curr. Top. Microbiol. Immunol. 252, 189–200.
Sims, G. P., Ettinger, R., Shirota, Y., Yarboro, C. H., Illei, G. G., and Lipsky, P. E. (2005). Identification and characterization of circulating human transitional B cells. Blood 105, 4390–4398.
Wang, J., Chen, C., Lau, S., Raghavan, R. I., Rowsell, E. H., Said, J., Weiss, L. M., and Huang, Q. (2009). CD3-positive large B-cell lymphoma. Am. J. Surg. Pathol. 33, 505–512.
Watson, J. V., Chambers, S. H., and Smith, P. J. (1987). A pragmatic approach to the analysis of DNA histograms with a definable G1 peak. Cytometry 8, 1–8.
Wersto, R. P., Chrest, F. J., Leary, J. F., Morris, C., Stetler-Stevenson, M. A., and Gabrielson, E. (2001). Doublet discrimination in DNA cell-cycle analysis. Cytometry 46, 296–306.
Yokose, N., Ogata, K., Sugisaki, Y., Mori, S., Yamada, T., An, E., and Dan, K. (2001). CD20-positive T cell leukemia/lymphoma: case report and review of the literature. Ann. Hematol. 80, 372–375.
Yoshikawa, S., Kawano, Y., Minegishi, Y., and Karasuyama, H. (2009). The skewed heavy-chain repertoire in peritoneal B-1 cells is predetermined by the selection via pre-B cell receptor during B cell ontogeny in the fetal liver. Int. Immunol. 21, 43–52.
Zhong, X., Gao, W., Degauque, N., Bai, C., Lu, Y., Kenny, J., Oukka, M., Strom, T. B., and Rothstein, T. L. (2007). Reciprocal generation of Th1/Th17 and T(reg) cells by B1 and B2 B cells. Eur. J. Immunol. 37, 2400–2404.
Keywords: B cells, B1, flow cytometry, innate B cells, B1 cells
Citation: Griffin DO and Rothstein TL (2012) Human B1 cell frequency: isolation and analysis of human B1 cells. Front. Immun. 3:122. doi: 10.3389/fimmu.2012.00122
Received: 17 February 2012; Paper pending published: 04 April 2012;
Accepted: 28 April 2012; Published online: 25 May 2012.
Edited by:
Kenneth A Dorshkind, David Geffen School of Medicine at University of California at Los Angeles, USAReviewed by:
Encarnacion Montecino-Rodriguez, University of California Los Angeles, USAGay Crooks, University of California Los Angeles, USA
Copyright: © 2012 Griffin and Rothstein. This is an open-access article distributed under the terms of the Creative Commons Attribution Non Commercial License, which permits non-commercial use, distribution, and reproduction in other forums, provided the original authors and source are credited.
*Correspondence: Thomas L. Rothstein, The Feinstein Institute for Medical Research, 350 Community Drive, Manhasset, NY 11030 USA. e-mail:dHJAbnNocy5lZHU=