 L. J. Walker1,2
 E. Marrinan1
 M. Muenchhoff1
 J. Ferguson1 H. Kloverpris1,3,4
 H. Cheroutre5 E. Barnes1,6 P. Goulder1
 Paul Klenerman1,6*
- 1Peter Medawar Building for Pathogen Research, Nuffield Department of Medicine, University of Oxford, Oxford, UK
- 2Institute of Cellular Medicine, Newcastle University, Newcastle upon Tyne, UK
- 3KwaZulu-Natal Research Institute for Tuberculosis and HIV, K-RITH, Nelson R Mandela School of Medicine, UKZN, Durban, South Africa
- 4Department of International Health, Immunology and Microbiology, University of Copenhagen, Copenhagen, Denmark
- 5La Jolla Institute for Allergy and Immunology, San Diego, CA, USA
- 6National Institute for Health Research Oxford Biomedical Research Centre, Oxford, UK
The T cell co-receptor CD8αβ enhances T cell sensitivity to antigen, however studies indicate CD8αα has the converse effect and acts as a co-repressor. Using a combination of Thymic Leukemia (TL) antigen tetramer, which directly binds CD8αα, anti-CD161, and anti-Vα7.2 antibodies we have been able for the first time to clearly define CD8αα expression on human CD8 T cells subsets. In healthy controls CD8αα is most highly expressed by CD161 “bright” (CD161++) mucosal associated invariant T (MAIT) cells, with CD8αα expression highly restricted to the TCR Vα7.2+ cells of this subset. We also identified CD8αα-expressing populations within the CD161 “mid” (CD161+) and “negative” (CD161−) non-MAIT CD8 T cell subsets and show TL-tetramer binding to correlate with expression of CD8β at low levels in the context of maintained CD8α expression (CD8α+CD8βlow). In addition, we found CD161−CD8α+CD8βlow populations to be significantly expanded in the peripheral blood of HIV-1 and hepatitis B (mean of 47 and 40% of CD161− T cells respectively) infected individuals. Such CD8αα expressing T cells are an effector-memory population (CD45RA−, CCR7−, CD62L−) that express markers of activation and maturation (HLA-DR+, CD28−, CD27−, CD57+) and are functionally distinct, expressing greater levels of TNF-α and IFN-γ on stimulation and perforin at rest than their CD8α+CD8βhigh counterparts. Antigen-specific T cells in HLA-B∗4201+HIV-1 infected patients are found within both the CD161−CD8α+CD8βhigh and CD161−CD8α+CD8βlow populations. Overall we have clearly defined CD8αα expressing human T cell subsets using the TL-tetramer, and have demonstrated CD161−CD8α+CD8βlow populations, highly expanded in disease settings, to co-express CD8αβ and CD8αα. Co-expression of CD8αα on CD8αβ T cells may impact on their overall function in vivo and contribute to the distinctive phenotype of highly differentiated populations in HBV and HIV-1 infection.
Introduction
CD8α is a cell surface glycoprotein that can be expressed either as a disulfide-linked heterodimer together with CD8β or as a homodimer. In contrast to CD8αβ, CD8αα is never expressed on naïve T cells but readily induced on strongly activated T cells (1). In humans and mice, CD8αα can be expressed on double negative or CD4+ or CD8αβ+ CD3+ TCRαβ+ T cells whereas CD3+ TCRγδ+ T cells and NK cells express mostly CD8αα alone (2).
In mice, CD8αα-expressing populations are the predominant intraepithelial lymphocyte subset of the small bowel and either TCR γδ+ or αβ+ (3). CD8αα has also been identified as a marker of murine memory CD8αβ TCRαβ+ cells, with affinity induced expression in early T cell responses identifying a memory precursor population in both an LCMV (4) and Listeria model (1). In humans, we have recently shown single-positive (SP) CD8αα T cells (i.e., those expressing no detectable CD8β) to be exclusively derived post-thymically from a naïve CD161++CD8+ T cell pool with a predominant usage of the Vα7.2 TCR of Mucosal Associated Invariant T (MAIT) cells (5). In addition, CD8αα has recently been shown using the Thymic leukemia (TL) tetramer to be expressed on human CD8αβ+ effector-memory cells (1) and expansion of CD8α+CD8βlow cells has been described with age (6) and in patients with HIV-1 (7), SLE (8), and Wiskott–Aldrich syndrome (9). CD8α+CD8βlow populations have been previously described to be either CD28+ or CD28− (8) and similar expansions have been described in post-chemotherapy patients with Hodgkins disease as a highly differentiated CD57+ perforin+ subset (10). In view of our recent findings of SP CD8αα expression linked to CD161++ MAIT cells, there is a need to more definitively assess human CD8αα expression in diverse human T cell populations in both health and disease.
The CD8αβ co-receptor binds to the MHC class I molecule, stabilizing the interaction between the TCR and the cognate peptide-MHC-I complex (11), triggering T cell activation through intracellular interaction of the CD8α cytoplasmic tail with the Src-family protein kinases Lck and LAT and subsequent phosphorylation of the TCR-CD3 complex (12). CD8 T cells vary by several orders of magnitude in their sensitivity to peptide antigen bound to MHC-I (13, 14). This is determined on the T cell side by the TCR affinity for the peptide-MHC-I complex, the level of TCR expression, TCR valency, accessory/co-stimulatory molecule expression, and CD8 αβ co-receptor expression. CD8αβ co-receptor dependence varies inversely with affinity of the TCR (15–19) and very high-affinity T cells can be activated independent of CD8αβ binding (17). T cell sensitivity is an important factor in the immune control of viral infection (20) and may play a role in outcomes from HIV (21).
Although both CD8αβ and CD8αα bind soluble MHC-I with similar affinity in Biacore experiments (22) and it is the cytoplasmic domain of the CD8α chain which interacts with Lck/LAT, CD8αβ enhances T cell sensitivity to cognate antigen by 100-fold compared to cells only expressing CD8αα (23, 24). It has been suggested that this might be explained by the fact that CD8αα is excluded from lipid rafts. Further to this, data suggests that CD8αα may actively inhibit T cell activation, as co-expression on CD8αα T cells decreases sensitivity to their cognate antigen (25), although the mechanism for this is not known. In mice, induction of expression of CD8αα by high-affinity memory precursors is thought to prevent their activation-induced cell death and exhaustion of chronically activated effector cells as in chronic viral infection (4).
CD8αβ T cells undergo repeated rounds of cell division and differentiation, sequentially acquiring characteristic phenotypic and functional features of early, intermediate, and late differentiation (26, 27). Late-differentiated cells are described as effector-memory cells (CD45RA±, CCR7−) characterized by loss of expression of the co-stimulatory molecules CD28 and CD27 and up-regulation of the senescence marker CD57. They are also found to have altered functional characteristics, with reduced production of IL-2 (and associated proliferative capacity) and increased cytotoxicity and expression of inflammatory cytokines IFN-γ and TNF-α. HIV-1 infection is associated with the development of prematurely senescent immune system; massive activation of the whole CD8 T cell population is observed during acute infection (28) and a large population of CD28−CD27−CD57+ T cells is found within bulk CD8 T cells. In parallel to the negative implications in aged immune systems (with increased susceptibility to infectious diseases and cancer, reduced effectiveness of vaccinations, and increased autoimmunity) (29–32), there is a significant association between the size of the CD28−CD27−CD57+CD8+ T cell population and HIV-1 disease progression (33). A similar observation of a large CD28−CD8 T cell population has also been made in chronic hepatitis B (HBV) associated with higher viral load and liver inflammation (34). Previous descriptions of expanded CD8α+CD8βlow populations have independently described them to be CD28−(8) and CD57+ perforin+ subset (10), however there has been no definitive study to date to bring these observations together.
Thymic leukemia antigen is a non-classical MHC class I molecule in mice. X-ray crystallography of the TL structure has demonstrated that its antigen-binding groove is occluded and so does not play any role in antigen presentation (35); however a number of publications have demonstrated that it binds murine CD8αα with much higher affinity than CD8αβ (22, 36–38). No human homolog of TL has been identified to date; however murine TL does bind to human CD8αα molecules with high-affinity (1) and a TL-tetramer can be used to demonstrate expression of CD8αα at the cellular surface of antigen-experienced human CD8αβ T cells.
Here, using both co-CD8α/CD8β antibody staining to detect CD8αβ expression and a TL-tetramer to detect CD8αα expression we definitively describe human CD8αα expressing T cell subsets within both the CD161++ MAIT and CD161+/CD161-non-MAIT CD8+ T cell populations. In addition, we have shown CD161−CD8α+CD8βlow T cells to be a late-differentiated population that dominates in chronic infections such as those caused by HBV and HIV-1.
Materials and Methods
Study Subjects
Sixteen adult healthy controls (HC), 31 patients with chronic HBV, 23 patients with chronic HCV, and 10 patients with HIV-1 infection were enrolled in the study. All study subjects were recruited following informed consent and in agreement with the Oxfordshire Research Ethics Committee. Patient demographics are summarized in Table 1.
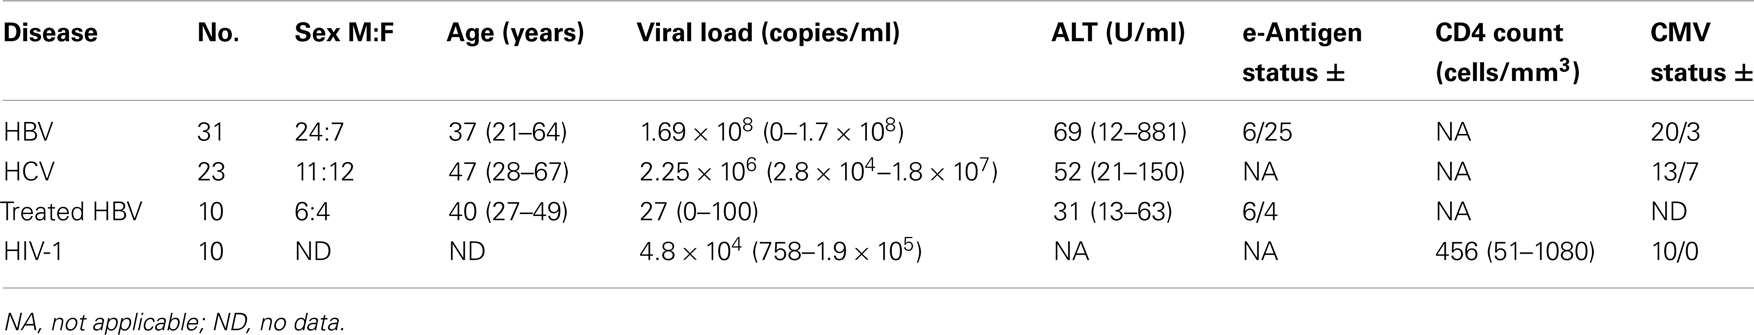
Table 1. Demographics table.
T Cell Recovery
Peripheral blood mononuclear cells (PBMCs) were isolated from EDTA peripheral blood samples by Ficoll-Histopaque density gradient centrifugation (Lymphoprep, Axis Shield). Samples not used for immediate analysis were then frozen in a mix of DMSO (25%), RPMI media (25%) (GibcoBRL), and fetal calf serum (50%) and stored in liquid nitrogen prior to subsequent analysis.
Antibodies
Anti-CD8α-PerCP, anti-CD3-AmCyan, anti-CD3-FITC, anti-CD8β-APC, anti-CD4-Alexa 700, anti-IFN-γ-Alexa 700, anti-TNF-α-PeCy7, anti-IL-2-FITC, anti-Ki67-FITC, anti-CD62L-PeCy7, anti-CD45RA-FITC and anti-CD62L-APC, anti-CCR7 PeCy7 (BD); Anti-CD3-Pacific orange and live/dead violet fixable cell stain (Invitrogen); anti-CB8β-PE and anti-CD161-PE (Beckman Coulter); anti-CD161-APC (Miltenyi).
Immunofluorescent Staining
Cryopreserved PBMCs were incubated with anti-surface antigen antibodies at 4°C for 20 min, washed in phosphate buffered saline (PBS) and fixed with 1% formaldehyde in PBS. Intracellular cytokine staining was performed on cryopreserved PBMCs in complete medium (RPMI 1640 containing 10% FCS, 1% streptomycin/penicillin, and l-Glutamine), stimulated with leukocyte activation cocktail (BD) and incubated (37°C, 5% CO2) or 4 h. Cells were washed in PBS and stained with antibodies against surface antigens and incubated at 4°C for 20 min. After fixation/permeabilization (FoxP3 staining kit, BD), cells were stained with antibodies against intracellular antigens, incubated at 4°C for 20 min and washed in 10% PermWash buffer (BD) in sterile de-ionized water.
HIV-1 Tetramer Synthesis and Staining
HLA-B∗42:01 heavy chain was expressed in Rosetta (DE3)pLys (Novagen), purified, and refolded around the peptide of interest in the presence of human β2M light chain. Unrefolded heavy chain and peptide were separated from refolded MHC:peptide monomer complexes using FPLC prior to tetramerization of monomers and conjugate ion to R-phycoerythrin (Extravidin PE, Sigma) to obtain PE labeled HLA-B∗42:01 tetramers.
Antigen-specific CD8 T cell responses were studied in HLA-B∗42:01+ HIV-1+ patients from the cohort described in Table 2. Streptavidin-PE conjugated B42:01 tetramers were incubated with thawed patient PBMCs at a concentration of 1 in 10 for 20 min at room temperature. Samples were then washed in PBS and stained with a panel of antibodies against surface antigens for 20 min at 4°C. Samples were then washed in PBS and fixed in 1% formaldehyde prior to FACS analysis.
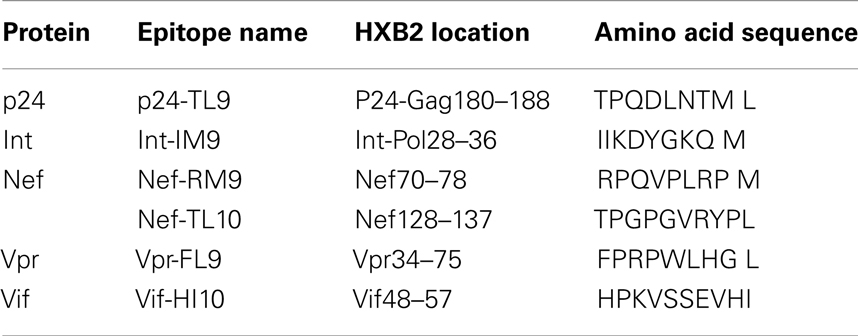
Table 2. HIV-1 derived epitopes presented by HLA-B*42:01 alleles.
TL-Tetramer Staining
Thymic leukemia monomers, produced as previously described (22) were tetramerized using streptavidin-PE (Molecular probes). PBMCs from both patients and HCs were pre-incubated for 15 min at 23°C with unlabeled anti-CD8α (2.5 μg/ml) (SK1; BD) or anti-CD8β (25 μg/ml) (2ST8.5H7; BD). After washing in PBS TL-tetramer (1:100) was incubated for 10 min at 23°C. PBMCs were then stained with a panel of antibodies (as above) to surface antigens for 20 min at 4°C and subsequently washed in PBS and fixed in 1% formaldehyde prior to FACS analysis.
CMV Immunoglobulin G ELISA
Qualitative ELISA was performed on cryopreserved patient serum samples using the Diamedix MCV IgG kit. 1:101 dilutions of serum where made using sample diluent. Hundred microliters of standards, controls, and prepared diluted patient samples were added to the antigen wells and incubated at 37°C for 60 min. Conjugate was then added to each sample and incubated for a further 60 min at 37°C. The wells were then washed and 100 μl of substrate solution added to each well and incubated for a further 20 min at 37°C. Hundred microliters of stop solution was then added and the wells read by a plate reader at 450 nm.
Flow Cytometry
All samples prepared for FACS analysis were acquired within 24 h of staining on an LSR II cytometer using FACS diva software (BD). Data was subsequently analyzed using FlowJo software (Tree star). Gating was defined using a “Full minus one” strategy.
Statistical Analysis
Statistical analysis was performed using GraphPad PRISM (GraphPad software) version 4. A p value of<0.05 was considered significant.
Results
Defining CD8β Expression Levels by CD161++, CD161+, and CD161− CD8α+ T Cell Subsets
We first addressed the distribution of CD8β staining in peripheral blood; since we have previously shown a substantial impact of CD161 expression on this, we analyzed the CD161++, CD161+, and CD161− T cell populations in parallel. T cells expressing CD8αα were identified using a dual staining strategy with anti-CD8α and anti-CD8β fluorochrome-labeled antibodies for FACS analysis. As shown in both HC blood and during HBV infection (Figure 1A), there is a broad range of CD8β expression by the CD3+CD4−CD8α+ population in peripheral blood in the context of a single peak of CD8α expression. Further to this, using anti-CD161 co-staining it is possible to identify three distinct populations of CD3+CD4−CD8α+ T cells. The SP CD8αα (CD8α+CD8βneg) population is exclusive to the CD161++ MAIT cell population as demonstrated previously (5) and in the HC shown (Figure 1B). The CD161++ population was noted to be significantly reduced in chronic HBV, as previously described (39, 40).
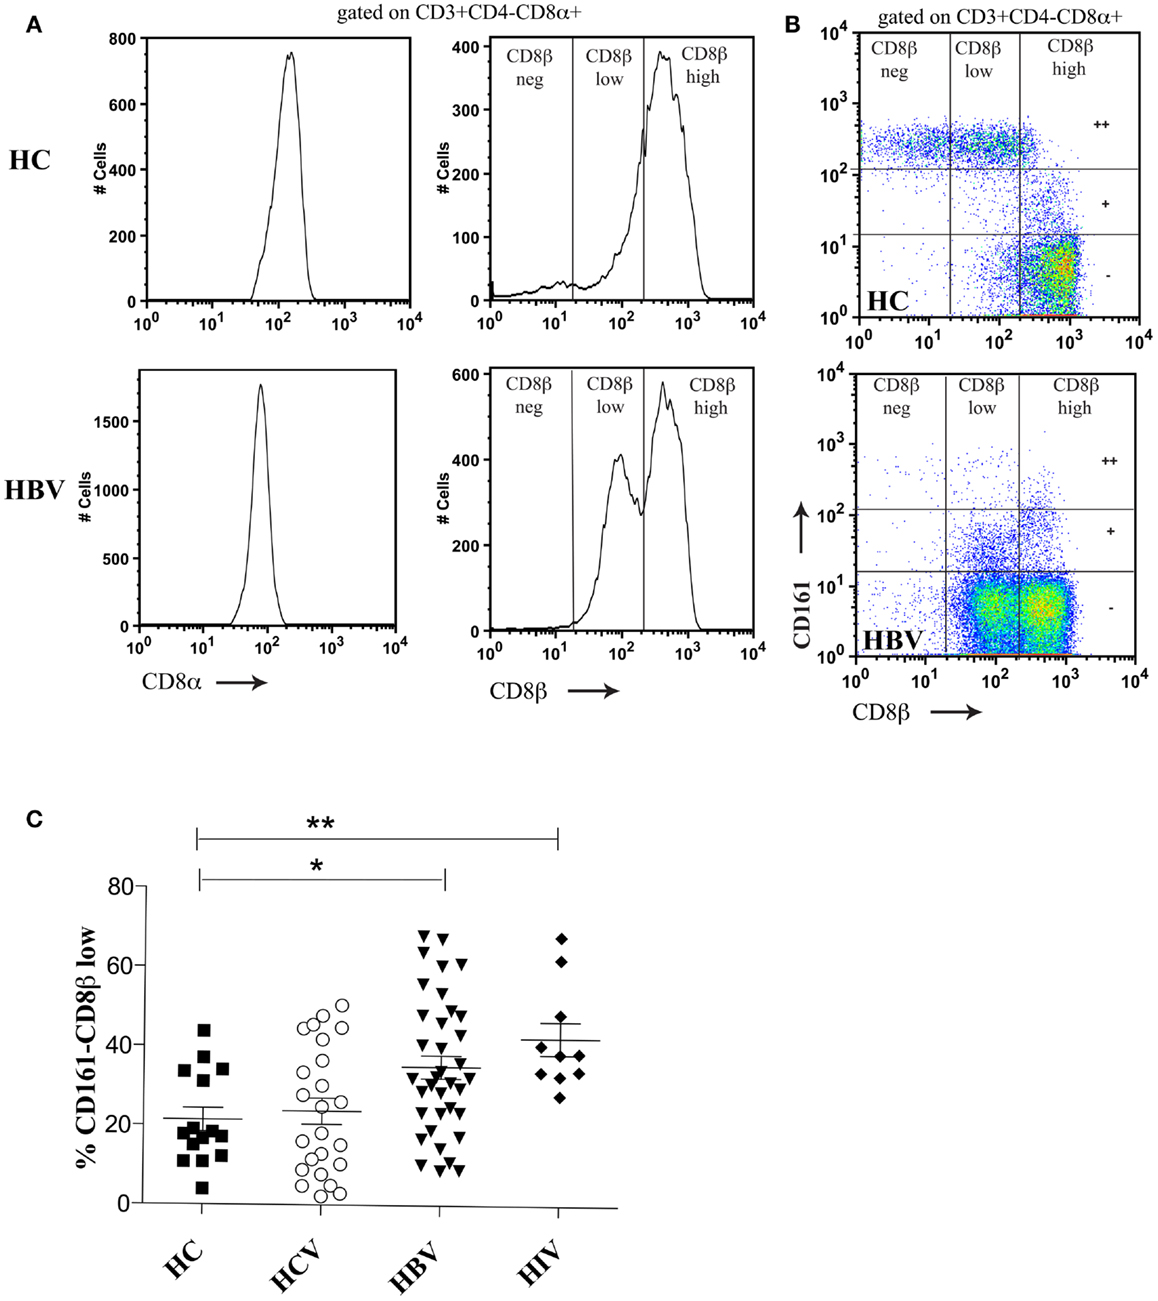
Figure 1. Distinct CD8β expression levels are demonstrated on CD161++, CD161+, and CD161−CD8α+ T cell subsets. (A) Co-staining of PBMCs with anti-CD8α and anti-CD8β antibodies identifies a range of CD8β expression by CD3+CD4−CD8α+ T cells in both a HC and patient with HBV. (B) Distinct CD8βhigh, CD8βlow, and CD8βneg populations are demonstrated based on the level of CD161 expression (marked on the vertical gates on FACS plots as++/±). Representative FACS plots of both HC (n = 16) and patients with chronic HBV (n = 31) shown. (C) The size of the CD161−CD8α+ CD8βlow T cell population as a percentage of the CD161−CD8α+ population is compared between HCs and patients with chronic HBV, HCV, and HIV-1 infections. (*p < 0.05, **p < 0.001, One-way ANOVAs).
Within the CD161+ and CD161− populations it was possible to identify two CD3+CD4−CD8α+ populations based on CD8β expression (CD8βhigh and CD8βlow). The CD161−CD8α+CD8βlow population was significantly expanded in patients with chronic HBV and HIV-1 compared to HCs (Figure 1C). Importantly, CD161−CD8α+CD8βlow T cells expressed an αβ and not a γδ TCR (data not shown). The clone of CD8β antibody used (2ST8.5H7) binds to an epitope on CD8β which requires expression of both the CD8α and CD8β chains. Co-staining with a separate CD8α antibody allows for identification of populations with maintained CD8α but reduced CD8αβ expression. By this indirect method, we conclude that the CD8α+CD8βlow population expresses a mixture of CD8αα and CD8αβ molecules on the cell surface due to relative levels in CD8α and CD8β expression.
We found no association between the proportion of CD161−CD8α+CD8βlow T cells and disease activity in either chronic HBV or HIV-1 infections (Figure 2). Additionally we did not find an association between the proportion of CD161−CD8α+CD8βlow T cells and CMV seropositivity, so we were able to exclude this as responsible for the differences in CD161−CD8α+CD8βlow populations observed in diseased vs. healthy cohorts (Figure 3).
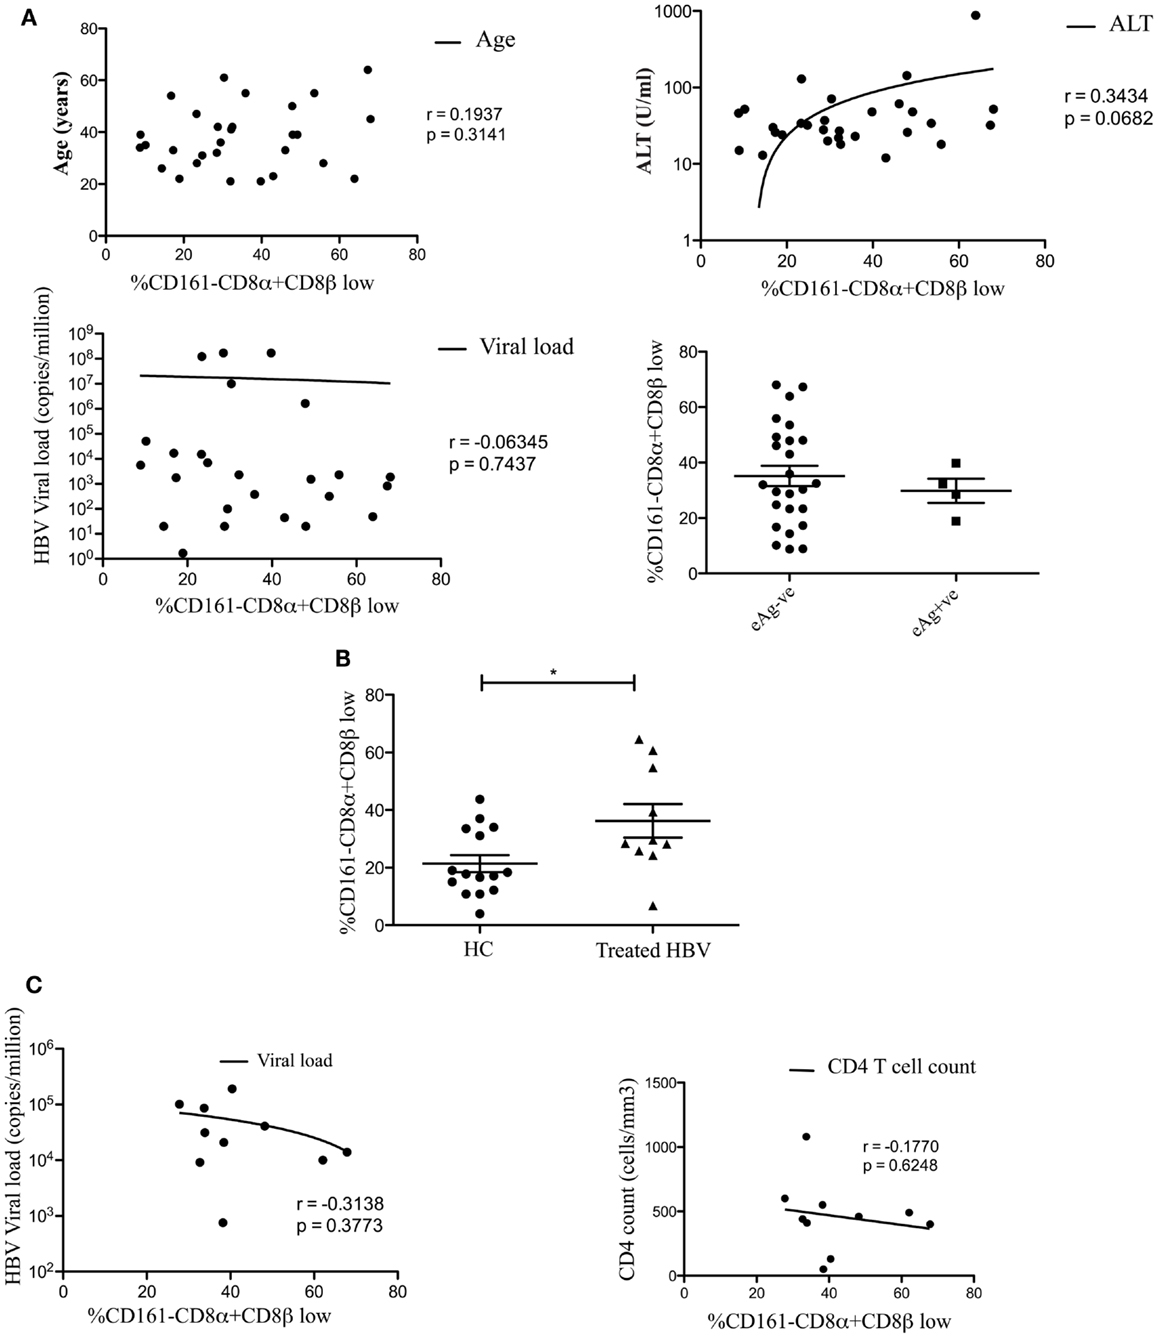
Figure 2. CD161−CD8α+CD8β− T cell populations develop independent of clinical status in chronic HBV and HIV-1 infections. (A) Analysis of the correlation between the size of the CD161−CD8α+CD8βlow T cell population and patient age/viral load (Pearson) and comparison of the size of the CD161−CD8α+CD8βlow population, as a proportion of the CD161−CD8α+ population, between patients e-antigen positive and e-antigen negative patients (Mann Whitney test) in chronic HBV infection. (B) Analysis of the % of CD161−CD8α+CD8βlow T cells as a proportion of the CD161−CD8α+ population in patients with treated with chronic HBV compared to HC (*p < 0.05, unpaired t test). (C) Correlative analysis between the size of the CD161−CD8α+CD8βlow T cell population as a proportion of the CD161−CD8α+ population and viral load/CD4 count in HIV-1 infection (Pearson).
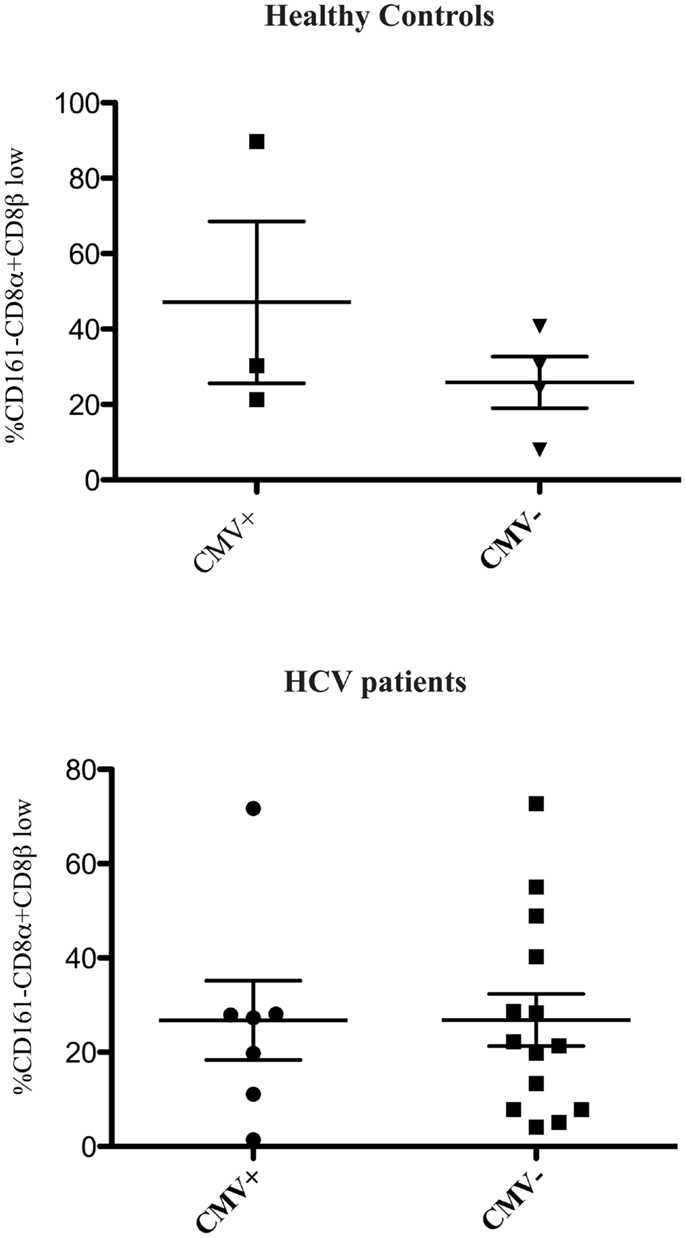
Figure 3. CD161−CD8α+CD8βlow population is not related to CMV status. Cumulative data comparing the % of CD161−CD8α+CD8β low cells as a proportion of CD161−CD8α+ T cells in healthy controls and patients with HCV based on CMV status (Mann Whitney test).
The CD161−CD8α+CD8βlow T Cell Population Expresses High Levels of CD8αα
To confirm that CD161−CD8α+CD8βlow T cells co-expressed CD8αα, we used a TL-tetramer which binds to both CD8αα and CD8αβ; this demonstrated, as previously, that following CD8αβ blockade using the anti-CD8β antibody clone 2ST8.5H7 and an anti-CD8α antibody as a negative control to completely block CD8αα binding, TL-tetramer staining is specific to the CD8αα population in humans (Figure 4A) (1). Previous experiments have validated this method to identify CD8αα and CD8αβ co-expressing cells using dual staining with a labeled CD8β antibody and TL-tetramer (22, 41).
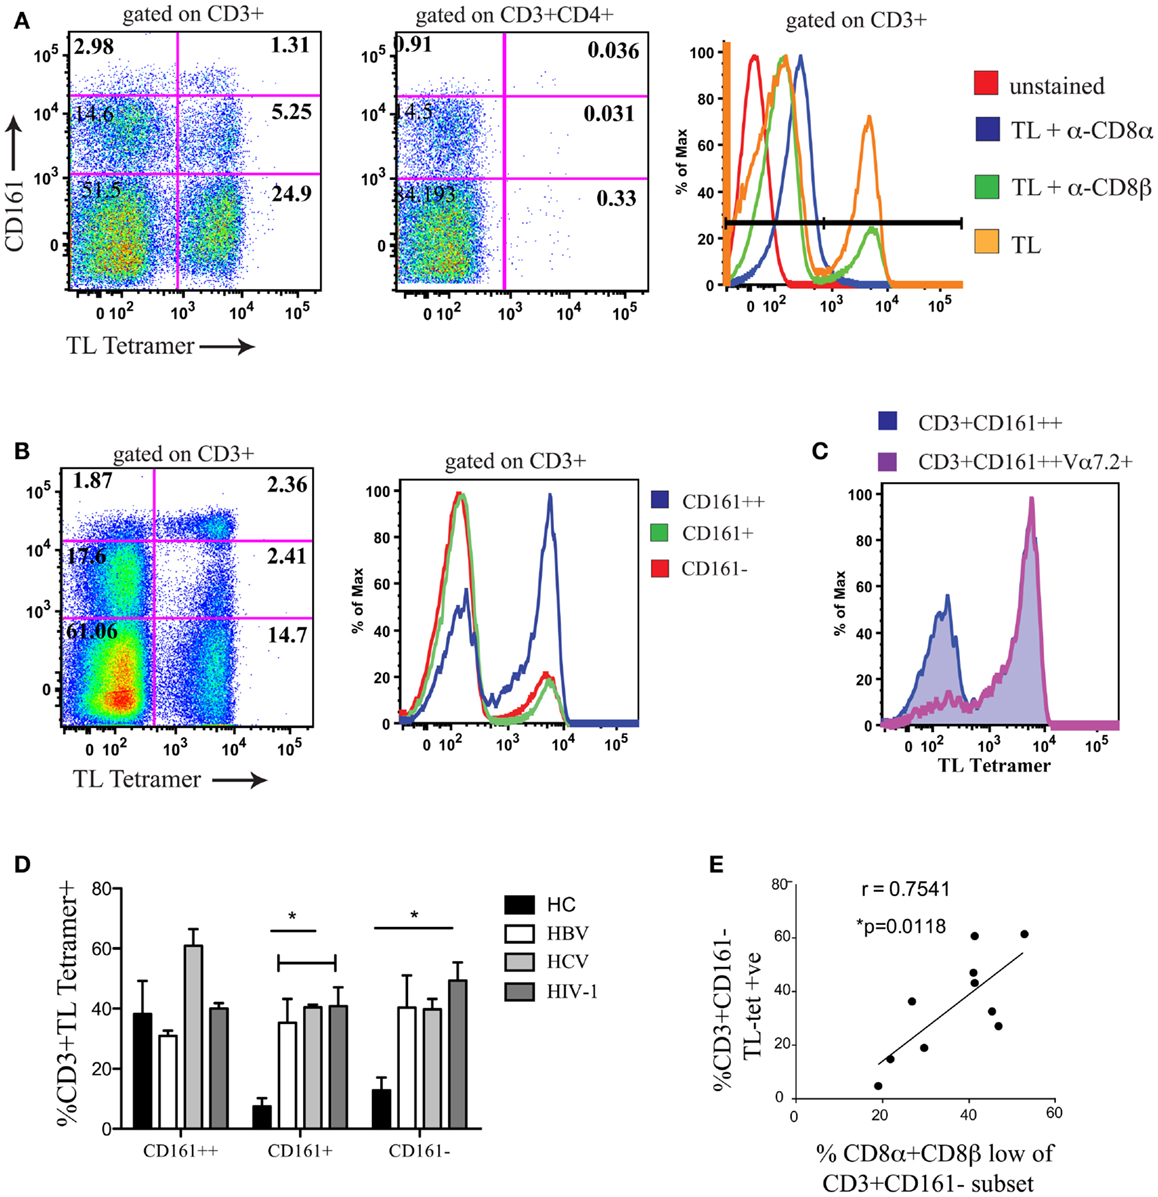
Figure 4. A positive correlation is observed between CD8αα expression and the size of the CD8α+CD8βlow population. (A) Representative FACS data showing TL-tetramer binding to CD3+ and CD3+CD4+ T cells of peripheral blood lymphocytes. CD8αβ binding by TL-tetramer is blocked by α-CD8β antibody clone 2ST8.5H7. Control samples shown on histogram on right (Negative controls: unstained and TL + α − CD8α; Positive control; TL). Data shown from a patient with chronic HBV. Data representative of 11 repeat experiments. (B) Representative FACS data using TL-tetramer staining to demonstrate CD8αα expression by CD3+CD161++/CD161+/CD161− T cells in HCs. Data representative of three repeat experiments. (C) Representative FACS data of TL-tetramer staining/CD8αα expression by CD3+CD161++ and CD3+CD161++Vα7.2+ T cell subsets in a HC. Data representative to three repeat experiments. (D) Comparison of TL-tetramer expression/CD8αα expression between CD161++/CD161+/CD161−T cell subsets in HCs and patients with chronic HBV, HCV, and HIV-1 infections. (*p < 0.05, One-way ANOVAs). (E) Correlative analysis between the proportion of CD3+CD161− TL-tetramer positive cells and the % of CD161−CD8βlow cells as a proportion of the CD161−CD8α+ population in patients with chronic HBV, HCV, and HIV-1 infections, r = 0.7541, p = 0.0118, Pearson.
We subsequently demonstrated, using the TL-tetramer, that in HC CD8αα is highly expressed on the CD161++ MAIT cell subset of PBMCs (Figure 4B). This is in keeping with our previous data using dual CD8α and β staining which found the SP CD8αα (CD8α+CD8βneg) population in humans to be restricted to this subset (5). In addition we observed that within the CD161++ CD8+ population, CD8αα was almost exclusively expressed by the Vα7.2+CD161++ T cells (Figure 4C).
Using the TL-tetramer, we further investigated CD8αα expression by the CD161−CD8α+CD8βlow population in patients with chronic viral infection. In comparison with HC, where CD8αα is expressed mainly by the CD161++ cells, in patients with chronic HBV, HCV, and HIV-1 we found a significant number of TL-tetramer positive cells among the CD161+ and CD161− non-MAIT CD8+ T cell populations (Figure 4D). Furthermore, we demonstrated a clear correlation between the proportion of CD161−CD8βlow T cells and the TL-tetramer+ T cells in these chronically infected patients (Figure 4E) indicating that the CD8α+CD8βlow population identifies a population of CD8αα-expressing CD8αβ T cells.
CD8αα-Expressing CD161−CD8α+CD8βlow T Cells are an Effector-Memory Population
We next characterized the phenotype of the CD161−CD8α+CD8βlow population. Using FACS analysis we were able to show that in comparison the CD161−CD8α+CD8βhigh population, CD161−CD8α+CD8βlow T cells were mostly CCR7− and CD62L− in the peripheral blood of both HC and patients with chronic HBV, HCV, and HIV-1 infections (Figures 5A,B). In HC and in chronic HBV infection there was significantly lower expression of CD45RA by CD161−CD8α+CD8βlow compared to CD161−CD8α+CD8βhigh T cells, but significance was not met in the same comparison in patients with chronic HCV and HIV-1 infections, indicating that they may have re-expressed CD45RA – a recognized phenomenon of late-differentiated cells (42).
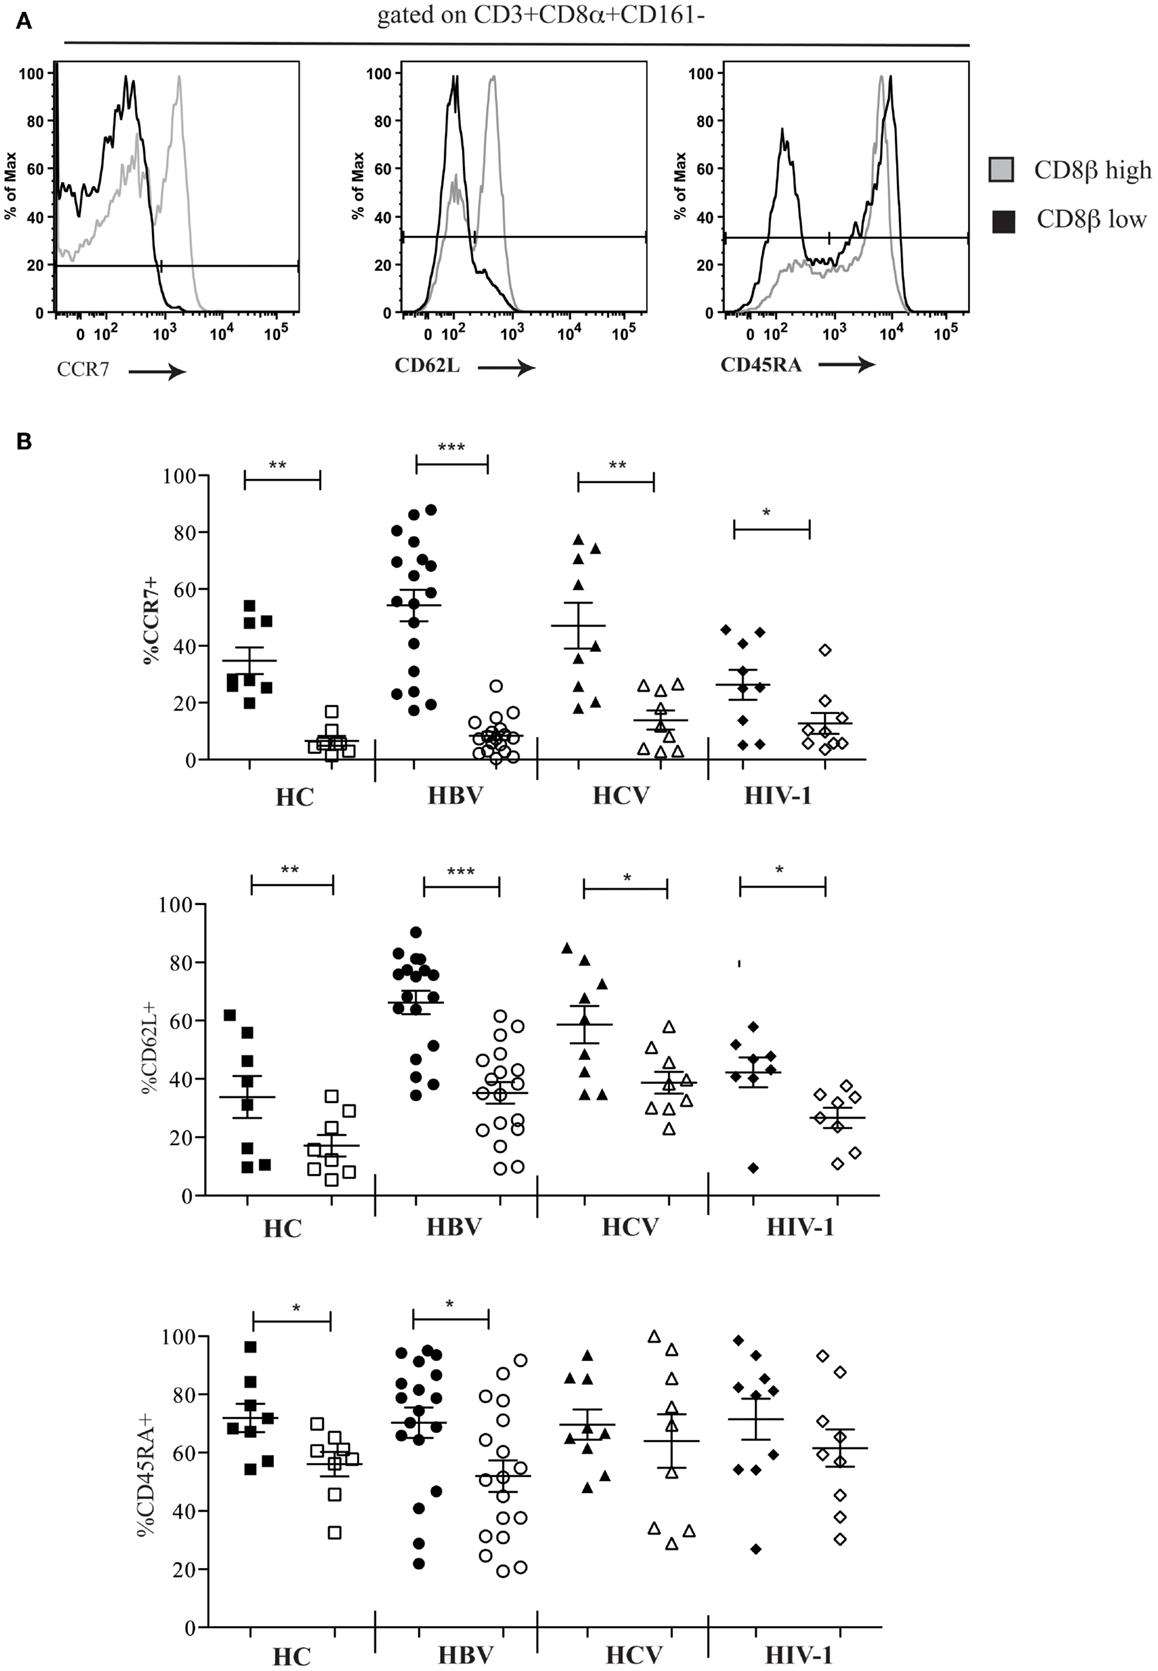
Figure 5. CD161−CD8α+ T cells are an effector-memory population. (A) Representative FACS data comparing CCR7, CD62L, and CD54RA expression by peripheral blood CD161−CD8α+CD8βlow and CD161−CD8α+CD8βhigh T cell populations as demonstrated here by a patient with chronic HBV infection. (B) Cumulative data comparing CCR7, CD62L, and CD54RA expression by peripheral blood CD161−CD8α+CD8βlow and CD161−CD8α+CD8βhigh T cell populations in HCs and patients with chronic HBV, HCV, and HIV-1 infections. CD161−CD8α+CD8βhigh T cell and CD161−CD8α+CD8βlow T cells represented on graphs by filled and unfilled shapes respectively. (*p < 0.05, **p < 0.001, ***p < 0.0001, Wilcoxon signed rank test).
CD8αα-Expressing CD161−CD8α+CD8βlow T Cells Express Markers of Late Differentiation and Activation
We investigated the differentiation state of the CD8αα-expressing, CD161−CD8α+CD8βlow peripheral blood T cell population and demonstrated significantly reduced expression of CD28, CD27, and increased CD57 in HC and patients with chronic HBV and HCV compared to the CD161−CD8α+CD8βhigh T cells. In HIV-1 infected patients, we saw a significant difference only in the expression of CD27 between the CD161−CD8α+CD8βlow and CD161−CD8α+CD8βhigh T cells (Figures 6A,B). Overall this may be explained by increased expression of CD57 and decreased expression of CD28 by both the CD161−CD8α+CD8βlow and the CD161−CD8α+CD8βhigh subsets. Consistent with this, CD57 expression was significantly higher in both subsets in HIV-1 patients compared to the HC (p < 0.05, one-way ANOVA).
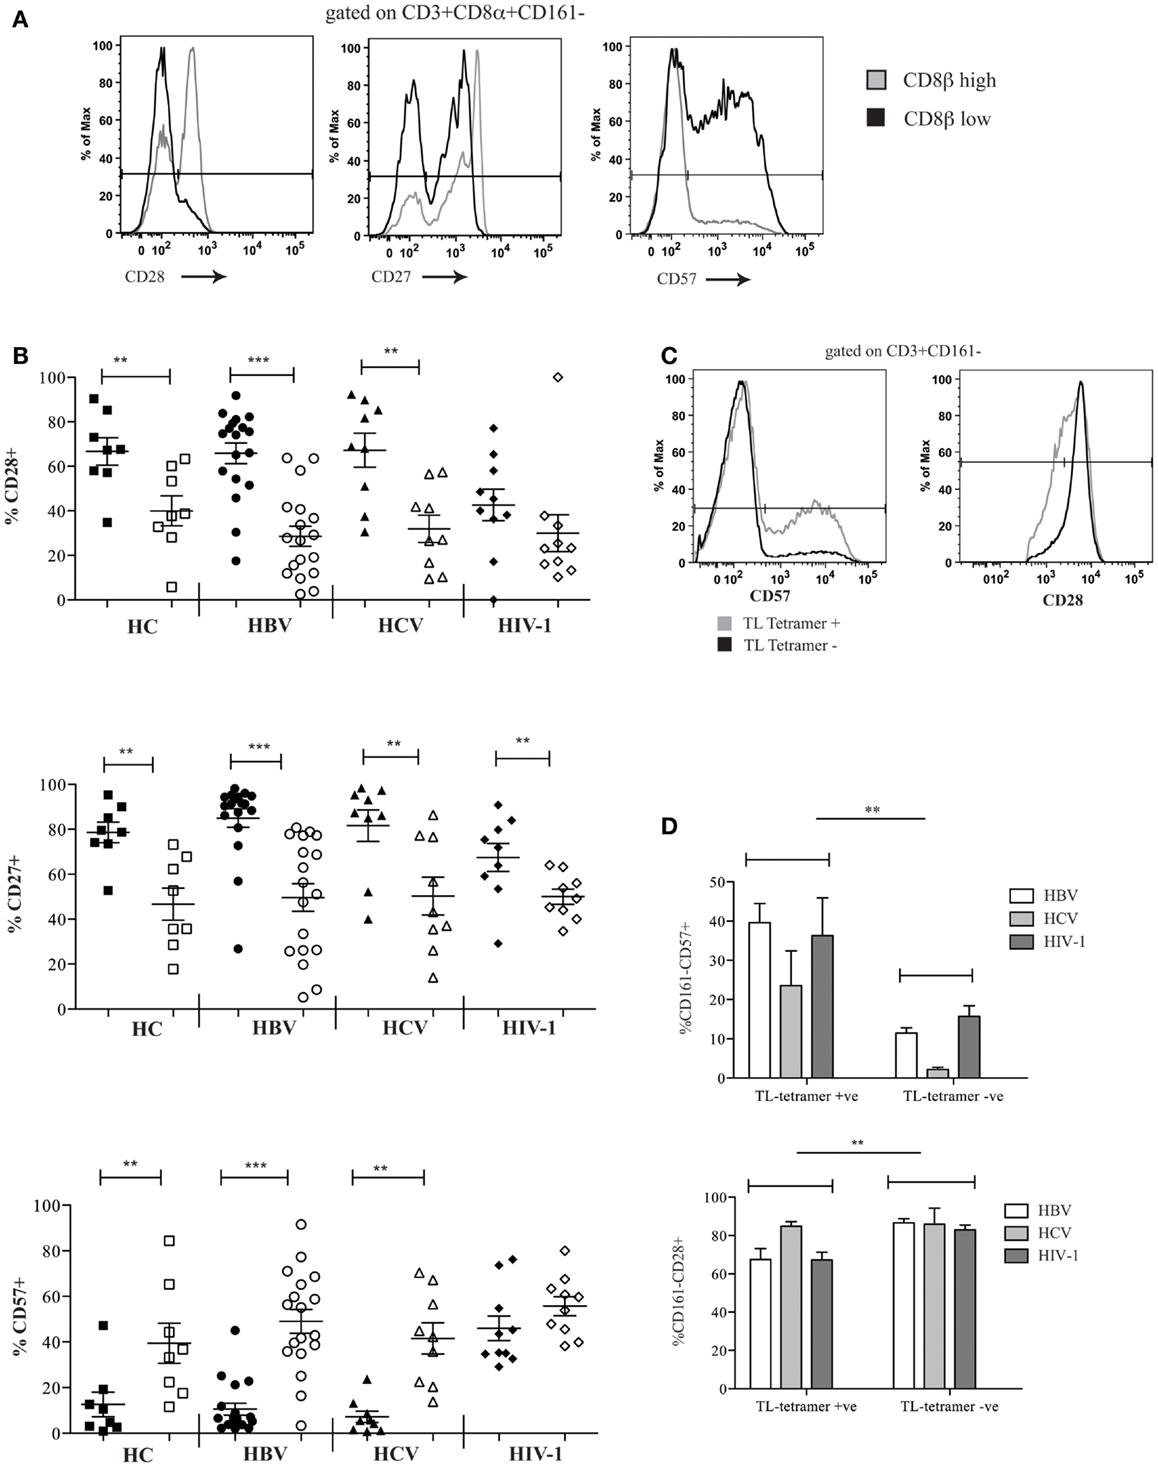
Figure 6. CD161−CD8α+CD8βlow T cells express markers of late differentiation. (A) Representative FACS data comparing CD28, CD27, and CD57 expression by peripheral blood CD161−CD8α+CD8βlow and CD161−CD8α+CD8βhigh T cell populations as demonstrated by a patient with chronic HBV infection. (B) Cumulative data comparing CD28, CD27, and CD57 expression by peripheral blood CD161−CD8α+CD8βlow and CD161−CD8α+CD8βhigh T cell populations in HCs and patients with chronic HBV, HCV, and HIV-1 infections. CD161−CD8α+CD8βhigh T cell and CD161−CD8α+CD8βlow T cells represented on graphs by filled and unfilled shapes respectively. (**p < 0.001, ***p < 0.0001, Wilcoxon signed rank test). (C) Representative FACS data comparing CD57 and CD28 expression between CD3+CD161− TL-tetramer+ and CD3−CD161− TL-tetramer – cells in a patient with chronic HBV. (D) Cumulative data comparing CD57 and CD28 expression between CD3+CD161− TL-tetramer+ and CD3+CD161− TL-tetramer – cells for patients with HBV, HCV, and HIV-1 infections (**p < 0.001, Wilcoxon signed rank test).
To confirm these findings with the TL-tetramer, we repeated the experiments using the staining protocols described above to identify CD8αα-expressing cells. These experiments showed that TL-tetramer+ cells in patients with chronic HBV and HIV-1 had significantly increased CD57 expression and decreased CD28 expression, in keeping with the observation that CD161−CD8α+CD8βlow T cells express high levels of CD8αα (Figures 6C,D).
To extend these findings, we addressed whether CD8αα-expressing T cells also showed other markers of activation or exhaustion. We studied a panel of activation markers (CD69, CD25, CD38, HLA-DR) and found the late activation marker HLA-DR to be significantly up regulated on the CD161−CD8α+CD8βlow T cell population compared to the CD161−CD8α+CD8βhigh T cell subset (Figures 7A,B). In HIV-1 infected patients the difference between the CD161−CD8α+CD8βlow and CD161−CD8α+CD8βhigh T cell populations appeared to be abolished due to up-regulation of HLA-DR on both subsets compared to the HC CD161−CD8α+CD8βhigh population (p < 0.0001, one-way ANOVA). We also found that overall there was increased expression of the exhaustion marker PD-1 by CD161−CD8+ T cells in patients with chronic HBV and HCV compared to HC (Figure 7C) and, importantly, consistently greater expression by the CD161−CD8α+CD8βlow compared to the CD161−CD8α+CD8βhigh T population in the patient groups studied (Figure 7D).
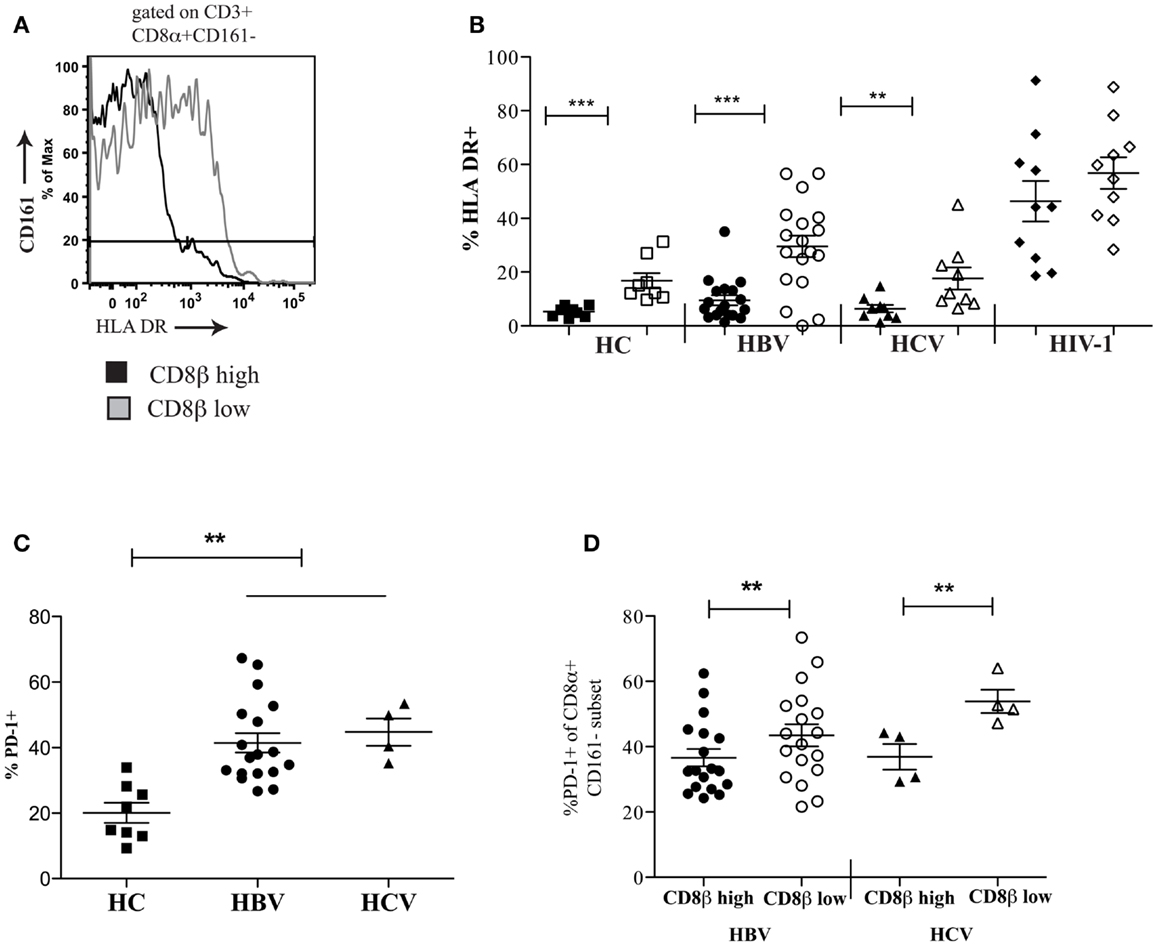
Figure 7. CD161−CD8α+CD8βlow T cells express markers of activation and exhaustion. (A) Representative FACS data comparing HLA-DR expression between peripheral blood CD161−CD8α+CD8βlow and CD161−CD8α+CD8βhigh T cell populations. (B) Cumulative data comparing HLA-DR expression between CD161−CD8α+CD8βlow and CD161−CD8α+CD8βhigh T cell populations in HCs and patients with chronic HBV and HCV. CD161−CD8α+CD8βhigh T cell and CD161−CD8α+CD8βlow T cells represented on graphs by filled and unfilled shapes respectively. (**p < 0.001, ***p < 0.0001, Wilcoxon signed rank test). (C) Comparison of PD-1 expression by CD8 T cells in patients with chronic HBV and HCV infections compared to HCs (**p < 0.001, One-way ANOVA). (D) Comparison of PD-1 expression by CD161−CD8α+CD8βlow and CD161−CD8α+CD8βhigh T cell populations in chronic HBV and HCV (**p < 0.001, Wilcoxon signed rank test).
CD8αα-Expressing CD161−CD8α+CD8βlow T Cells are Functionally Distinct from CD161−CD8α+CD8βhigh T Cells
We next compared the functionality of CD8αα-expressing CD161−CD8α+CD8βlow and CD161−CD8α+ CD8βhigh T cell subsets. By stimulating whole PBMCs from HC and patients with chronic HBV and HCV with PMA/Ionomycin we found that there were significant functional differences between these populations. The CD8αα-expressing CD161−CD8α+CD8βlow T cell population produced significantly greater amounts of IFN-γ and TNF-α compared to CD161−CD8α+CD8βhigh T cell population across HC and the patient groups studied, although no difference in IL-2 production between the two populations was identified (Figures 8A,B) (i.e., a greater number of cells were cytokine positive, it appears that on a per cell basis – based on MFI, there is no difference between the two populations). In addition, more CD161−CD8α+CD8βlow cells expressed perforin compared to their CD161−CD8α+CD8βhigh counterparts (Figures 8C,D). Overall these data indicate that CD8αα-expressing CD161−CD8α+CD8βlow cells have enhanced pro-inflammatory functionality and greater cytotoxicity compared to the CD161−CD8α+CD8βhigh population; this is in keeping with other published data on the functionality of CD28−CD27−CD57+ CD8+ T cells (43).
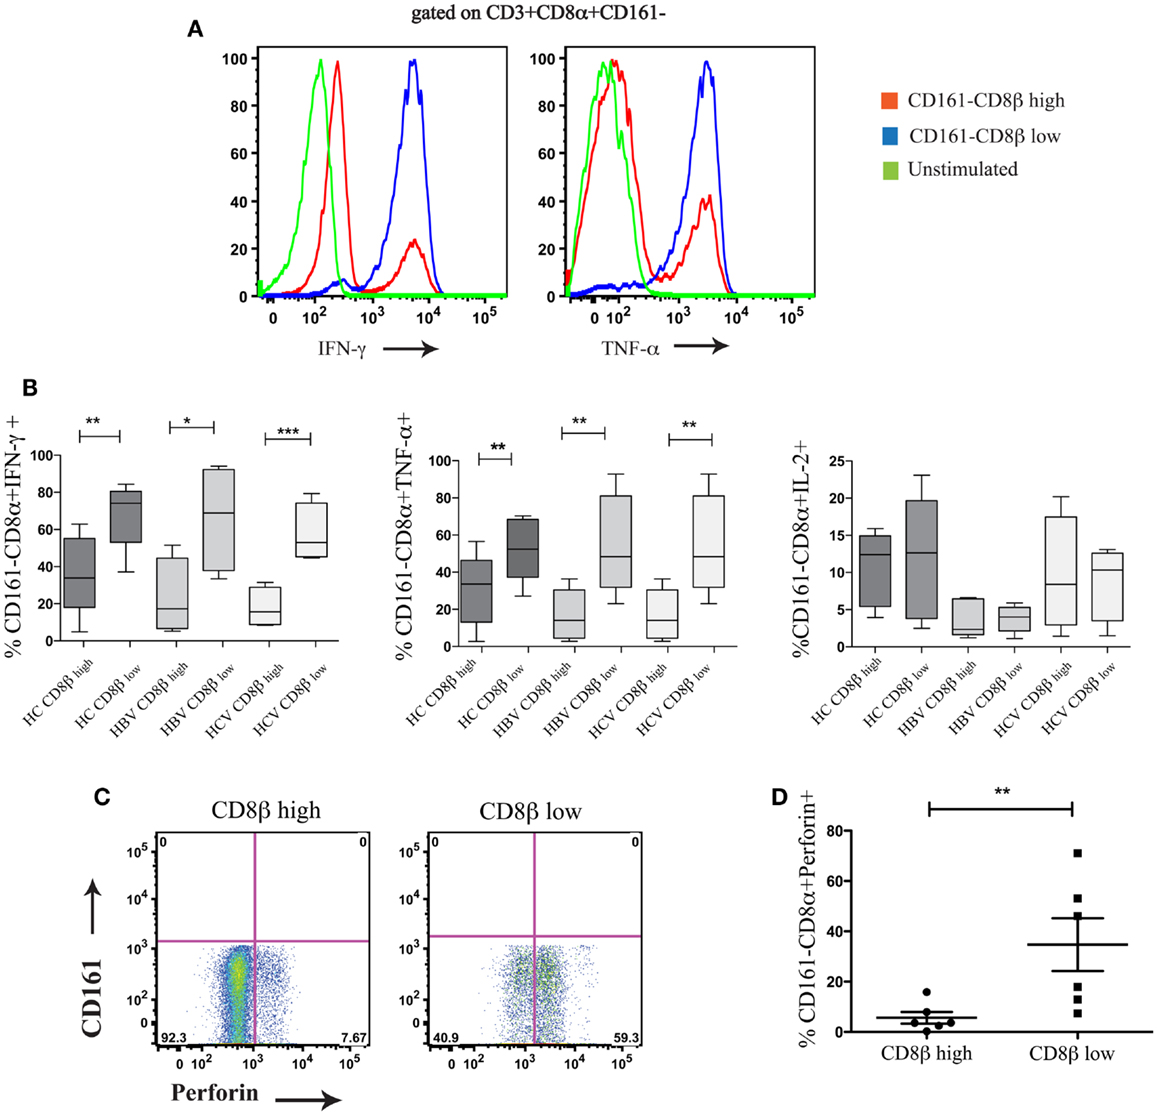
Figure 8. CD161−CD8α+CD8βlow T cells are functionally distinct from CD161−CD8α+CD8βhigh T cells. (A) Representative FACS data comparing IFN-γ and TNF-α production by CD161−CD8α+CD8βlow and CD161−CD8α+CD8βhigh T cell populations following stimulation with PMA and Ionomycin. (B) Cumulative data comparing percentages of IFN-γ, TNF-α, and IL-2 positive cells within the CD161−CD8α+CD8βlow and CD161−CD8α+CD8βhigh T cell populations in chronic HCV and HBV (**p < 0.001, ***p < 0.0001 paired t test). (C) Representative FACS plots comparing perforin expression between CD161−CD8α+CD8βlow and CD161−CD8α+CD8βhigh T cells. (D) Cumulative data comparing levels of perforin expression between CD161−CD8α+CD8βlow and CD161−CD8α+CD8βhigh T cells in HCs and patients with chronic HBV showing CD161−CD8α+ CD8βlow (**p < 0.001, ***p < 0.0001, Wilcoxon ranked test).
Antigen-Specific CD8+ T Cells in HIV-1 are Found within Both CD161−CD8α+CD8βhigh and CD8βlow Populations
Using cryopreserved PBMC samples from patients with HIV-1 carrying the HLA-B∗42:01 allele we investigated whether antigen-specific CD8 T cells were found within both the CD161−CD8α+CD8βhigh and CD161−CD8α+CD8βlow populations using HLA-B∗42:01-peptide tetramers (see Table 2 for details of epitopes). In studying the distribution of antigen-specific responses between the CD161−CD8α+CD8βhigh and CD161−CD8α+CD8βlow populations within an individual we were able to distinguish a variable distribution of the tetramer positive cells, despite an almost 50:50 split of the bulk CD8 population between the CD161−CD8α+CD8βlow and CD161−CD8α+CD8βhigh subsets (Figure 9A). Cumulative data from the antigen-specific populations within the five patients studied using a panel of HLA∗B42:01 tetramers (Table 2) demonstrated that overall there is no consistent bias toward either the CD161−CD8α+CD8βhigh or CD161−CD8α+CD8βlow populations (Figure 9B).
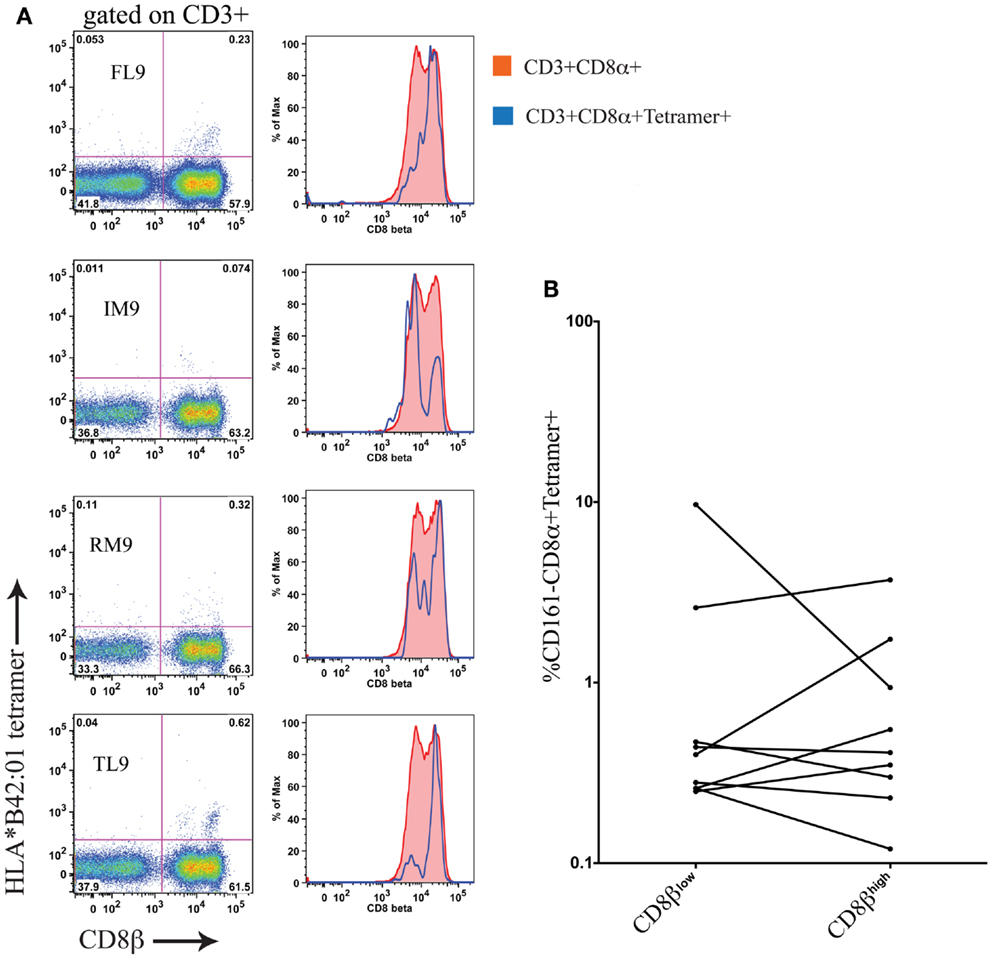
Figure 9. Antigen-specific CD8 T cells in HIV-1 are CD161−CD8α+CD8βhigh and CD161−CD8α+CD8βlow. (A) HLA-B*42:01 tetramer positive CD8 T cell responses in a individual patient with HIV-1 demonstrates antigen-specific T cells are found in both the CD161−CD8α+CD8βlow and CD161−CD8α+CD8βhigh populations of peripheral blood. (B) Cumulative data showing distribution of tetramer positive cells between CD161−CD8α+CD8βhigh and CD161−CD8α+CD8βlow T cells in patients. Data from five different patients with responses to epitopes p24-TL9, Int-IM9, Nef-RM9, and Vpr-FL9 are shown.
Discussion
We have clearly defined human CD8αα-expressing T cell populations using both anti-CD8α/anti-CD8β co-staining and a TL-tetramer within both MAIT and non-MAIT populations. The TL-tetramer used is clearly able to bind CD8αα on CD8β negative cells but can also detect CD8αα on cells expressing CD8β, as previously described (1, 22, 41). In this study, as previously, we blocked CD8β binding throughout to allow for specific detection of CD8αα staining on CD8βlow cells (1). Within the MAIT cell population, we have shown CD8αα expression to be most prominent on the Vα7.2 expressing cells of this subset. Further to this we have demonstrated CD8αα expression on both CD161+ and CD161− subsets. We have shown CD8αα-expressing CD161−CD8αβ (CD161−CD8α+CD8βlow) T cells are significantly increased in patients with chronic HBV and HIV-1 infections compared to HC and have brought together previous data to definitively demonstrate expression of CD8αα on such cells is associated with terminally differentiated effector-memory T cells (CCR7−CD62L−CD45RA−CD28−CD27−CD57+). Consistent with activation-induced expression of CD8αα, these T cells also express HLA-DR.
Although the CD161−CD8α+CD8βlow T cells are also present in HC, it is important to consider what might be driving the significant expansion of these cells in the context of chronic HBV and HIV-1 infections. In HIV infection, we found no association with the proportion of CD161−CD8α+CD8βlow T cells and viral load or CD4 count. Equally in HBV infection, there was no association with liver inflammation (as reflected by ALT), e-antigen status, or age of the patient. Thus the overall relationship between the populations and pathogenesis is not yet defined. There are two possible suggestions. Firstly, the expansion of the CD8αα-expressing T cells could be driven by inflammatory cytokines or disease activity. This may explain the very large magnitude of the effect, which is affecting a set of cells likely much greater than the size of the HBV- or HIV-specific CD8+ T cell population. The lack of clear association with disease status is not consistent with a direct causal impact, but might be consistent with widespread changes in T cell phenotype reported previously (28, 33). Alternatively, the expression of CD8αα might be linked to TCR-driven T cell maturation. This would explain the close links seen with expression of other phenotypic markers, and the known regulation previously determined in mouse models. Whereas CD8αβ TCR co-receptor is constitutively expressed on naïve T cells, CD8αα is transiently induced on strongly activated CD8αβ effector T cells (4) and its expression can be maintained on chronically activated memory CD8 T cells, driven by IL-15 (44, 45). Potentially therefore, a combination of antigen-specific and “off-target” effects could explain the findings in HBV and HIV seen here, although the differences between HCV and these diseases still requires further exploration.
Regardless of the underlying stimulus mediating up-regulation of CD8αα on T cells, what is its impact once expressed? In contrast to CD8αβ, CD8αα functions as a TCR repressor and co-expression of CD8αα on activated cells coincides with an increased threshold for activation (25, 46). Consequently, CD8αα expressed on chronically activated CD8+ T cells might prevent exhaustion of these cells or reduce the risk for excessive or aberrant cytolytic responses. Thus CD8αα may act like other “tuning” molecules to aid survival, in a manner analogous to expression of KIRs or other NK cell associated receptors on T cells (42). Indeed, previous phenotyping of CD8βlow cells would suggest this to be the case with increased expression of CD161, CD16, CD158α, and NKB1, although high CD161 expression on CD28+CD8βlow T cells likely describes the MAIT cell population (47) and emphasizes the need for this population to be considered when analyzing CD8αα-expressing T cells.
Similar accumulation of CD8αα-expressing CD27−CD28−CD57+CD8+ memory T cells would be predicted in the elderly and also in patients with autoimmune conditions (29–32). The consequences of this on T cell sensitivity requires further study and may reveal unique consequences, including marked “off-target” effects for these cells in controlling chronic infections such as HIV-1 and HBV.
Author Contributions
L. J. Walker, E. Marrinan, J. Ferguson, and M. Muenchhoff conducted the experiments. L. J. Walker and Paul Klenerman designed the study. H. Kloverpris, M. Muenchhoff, P. Goulder, E. Barnes, and H. Cheroutre provided samples and reagents used in the study. L. J. Walker and Paul Klenerman wrote the paper. H. Cheroutre read and provided comments on the paper.
Conflict of Interest Statement
The authors declare that the research was conducted in the absence of any commercial or financial relationships that could be construed as a potential conflict of interest.
Acknowledgments
We would like to thank Stuart Sims for help making the HLA∗B42:01 tetramers. We would also like to thank Jane Collier, Denise O’Donnell, and Anne Lissington for help with patient recruitment and collating clinical information. This research was supported by the Wellcome Trust (WT091663MA), the NIHR Biomedical research program (Oxford), the James Martin School for the twenty-first century (Oxford), and the NIAIS U19 Bio-defense program (NIHNIAID1U19AI082630–01).
References
1. Huang Y, Park Y, Wang-Zhu Y, Larange A, Arens R, Bernardo I, et al. Mucosal memory CD8+ T cells are selected in the periphery by an MHC class I molecule. Nat Immunol (2011) 12:1086–95. doi:10.1038/ni.2106
2. Moebius U, Kober G, Griscelli AL, Hercend T, Meuer SC. Expression of different CD8 isoforms on distinct human lymphocyte subpopulations. Eur J Immunol (1991) 21:1793–800. doi:10.1002/eji.1830210803
3. Cheroutre H, Lambolez F. Doubting the TCR coreceptor function of CD8alphaalpha. Immunity (2008) 28:149–59. doi:10.1016/j.immuni.2008.01.005
4. Madakamutil LT, Christen U, Lena CJ, Wang-Zhu Y, Attinger A, Sundarrajan M, et al. CD8alphaalpha-mediated survival and differentiation of CD8 memory T cell precursors. Science (2004) 304:590–3. doi:10.1126/science.1092316
5. Walker LJ, Kang Y-H, Smith MO, Tharmalingham H, Ramamurthy N, Fleming VM, et al. Human MAIT and CD8α+α cells develop from a pool of type-17 precommitted CD8+ T cells. Blood (2012) 119:422–33. doi:10.1182/blood-2011-05-353789
6. Konno A, Okada K, Mizuno K, Nishida M, Nagaoki S, Toma T, et al. CD8alpha alpha memory effector T cells descend directly from clonally expanded CD8alpha +beta high TCRalpha beta T cells in vivo. Blood (2002) 100:4090–7. doi:10.1182/blood-2002-04-1136
7. Schmitz JE, Forman MA, Lifton MA, Concepción O, Reimann KA, Crumpacker CS, et al. Expression of the CD8alpha beta-heterodimer on CD8(+) T lymphocytes in peripheral blood lymphocytes of human immunodeficiency virus- and human immunodeficiency virus+ individuals. Blood (1998) 92:198–206.
8. Werwitzke S, Tiede A, Jacobs R, Zielinska-Skowronek M, Buyny S, Schmidt RE, et al. CD8alpha+beta(low) effector T cells in systemic lupus erythematosus. Scand J Immunol (2008) 67:501–8. doi:10.1111/j.1365-3083.2008.02093.x
9. Kawabata K, Nagasawa M, Morio T, Okawa H, Yata J. Decreased alpha/beta heterodimer among CD8 molecules of peripheral blood T cells in Wiskott-Aldrich syndrome. Clin Immunol Immunopathol (1996) 81:129–35. doi:10.1006/clin.1996.0168
10. Watanabe N, De Rosa SC, Cmelak A, Hoppe R, Herzenberg LA, Roederer M. Long-term depletion of naive T cells in patients treated for Hodgkin’s disease. Blood (1997) 90:3662–72.
11. Wooldridge L, van den Berg HA, Glick M, Gostick E, Laugel B, Hutchinson SL, et al. Interaction between the CD8 coreceptor and major histocompatibility complex class I stabilizes T cell receptor-antigen complexes at the cell surface. J Biol Chem (2005) 280:27491–501. doi:10.1074/jbc.M500555200
12. Veillette A, Bookman MA, Horak EM, Bolen JB. The CD4 and CD8 T cell surface antigens are associated with the internal membrane tyrosine-protein kinase p56lck. Cell (1988) 55:301–8. doi:10.1016/0092-8674(88)90053-0
13. Alexander-Miller MA, Leggatt GR, Berzofsky JA. Selective expansion of high- or low-avidity cytotoxic T lymphocytes and efficacy for adoptive immunotherapy. Proc Natl Acad Sci U S A (1996) 93:4102–7. doi:10.1073/pnas.93.9.4102
14. Alexander-Miller MA. Differential expansion and survival of high and low avidity cytotoxic T cell populations during the immune response to a viral infection. Cell Immunol (2000) 201:58–62. doi:10.1006/cimm.1999.1632
15. Wooldridge L, Lissina A, Cole DK, van den Berg HA, Price DA, Sewell AK. Tricks with tetramers: how to get the most from multimeric peptide-MHC. Immunology (2009) 126:147–64. doi:10.1111/j.1365-2567.2008.02848.x
16. Laugel B, van den Berg HA, Gostick E, Cole DK, Wooldridge L, Boulter J, et al. Different T cell receptor affinity thresholds and CD8 coreceptor dependence govern cytotoxic T lymphocyte activation and tetramer binding properties. J Biol Chem (2007) 282:23799–810. doi:10.1074/jbc.M700976200
17. Kerry SE, Buslepp J, Cramer LA, Maile R, Hensley LL, Nielsen AI, et al. Interplay between TCR affinity and necessity of coreceptor ligation: high-affinity peptide-MHC/TCR interaction overcomes lack of CD8 engagement. J Immunol (2003) 171:4493–503.
18. Holler PD, Kranz DM. Quantitative analysis of the contribution of TCR/pepMHC affinity and CD8 to T cell activation. Immunity (2003) 18:255–64. doi:10.1016/S1074-7613(03)00019-0
19. Sedlik C, Dadaglio G, Saron MF, Deriaud E, Rojas M, Casal SI, et al. In vivo induction of a high-avidity, high-frequency cytotoxic T-lymphocyte response is associated with antiviral protective immunity. J Virol (2000) 74:5769–75. doi:10.1128/JVI.74.13.5769-5775.2000
20. Walker LJ, Sewell AK, Klenerman P. T cell sensitivity and the outcome of viral infection. Clin Exp Immunol (2010) 159:245–55. doi:10.1111/j.1365-2249.2009.04047.x
21. Iglesias MC, Almeida JR, Fastenackels S, van Bockel DJ, Hashimoto M, Venturi V, et al. Escape from highly effective public CD8+ T-cell clonotypes by HIV. Blood (2011) 118:2138–49. doi:10.1182/blood-2011-01-328781
22. Leishman AJ, Naidenko OV, Attinger A, Koning F, Lena CJ, Xiong Y, et al. T cell responses modulated through interaction between CD8alphaalpha and the nonclassical MHC class I molecule, TL. Science (2001) 294:1936–9. doi:10.1126/science.1063564
23. Renard V, Romero P, Vivier E, Malissen B, Luescher IF. CD8 beta increases CD8 coreceptor function and participation in TCR-ligand binding. J Exp Med (1996) 184:2439–44. doi:10.1084/jem.184.6.2439
24. Karaki S, Tanabe M, Nakauchi H, Takiguchi M. Beta-chain broadens range of CD8 recognition for MHC class I molecule. J Immunol (1992) 149:1613–8.
25. Cawthon AG, Alexander-Miller MA. Optimal colocalization of TCR and CD8 as a novel mechanism for the control of functional avidity. J Immunol (2002) 169:3492–8.
26. Appay V, Dunbar PR, Callan M, Klenerman P, Gillespie GMA, Papagno L, et al. Memory CD8+ T cells vary in differentiation phenotype in different persistent virus infections. Nat Med (2002) 8:379–85. doi:10.1038/nm0402-379
27. High KP, Akbar AN, Nikolich-Zugich J. Translational research in immune senescence: assessing the relevance of current models. Semin Immunol (2012) 24:373–82. doi:10.1016/j.smim.2012.04.007
28. Papagno L, Spina CA, Marchant A, Salio M, Rufer N, Little S, et al. Immune activation and CD8+ T-cell differentiation towards senescence in HIV-1 infection. PLoS Biol (2004) 2:e20. doi:10.1371/journal.pbio.0020020
29. Goodwin K, Viboud C, Simonsen L. Antibody response to influenza vaccination in the elderly: a quantitative review. Vaccine (2006) 24:1159–69. doi:10.1016/j.vaccine.2005.08.105
30. Hakim FT, Gress RE. Immunosenescence: deficits in adaptive immunity in the elderly. Tissue Antigens (2007) 70:179–89. doi:10.1111/j.1399-0039.2007.00891.x
31. Aspinall R, Del Giudice G, Effros RB, Grubeck-Loebenstein B, Sambhara S. Challenges for vaccination in the elderly. Immun Ageing (2007) 4:9. doi:10.1186/1742-4933-4-9
32. Lindstrom TM, Robinson WH. Rheumatoid arthritis: a role for immunosenescence? J Am Geriatr Soc (2010) 58:1565–75. doi:10.1111/j.1532-5415.2010.02965.x
33. Appay V, Almeida JR, Sauce D, Autran B, Papagno L. Accelerated immune senescence and HIV-1 infection. Exp Gerontol (2007) 42:432–7. doi:10.1016/j.exger.2006.12.003
34. Das A, Hoare M, Davies N, Lopes AR, Dunn C, Kennedy PTF, et al. Functional skewing of the global CD8 T cell population in chronic hepatitis B virus infection. J Exp Med (2008) 205:2111–24. doi:10.1084/jem.20072076
35. Liu Y, Xiong Y, Naidenko OV, Liu J-H, Zhang R, Joachimiak A, et al. The crystal structure of a TL/CD8alphaalpha complex at 2.1 A resolution: implications for modulation of T cell activation and memory. Immunity (2003) 18:205–15. doi:10.1016/S1074-7613(03)00027-X
36. Weber DA, Attinger A, Kemball CC, Wigal JL, Pohl J, Xiong Y, et al. Peptide-independent folding and CD8 alpha alpha binding by the nonclassical class I molecule, thymic leukemia antigen. J Immunol (2002) 169:5708–14.
37. Attinger A, Devine L, Wang-Zhu Y, Martin D, Wang J-H, Reinherz EL, et al. Molecular basis for the high affinity interaction between the thymic leukemia antigen and the CD8alphaalpha molecule. J Immunol (2005) 174:3501–7.
38. Devine L, Rogozinski L, Naidenko OV, Cheroutre H, Kavathas PB. The complementarity-determining region-like loops of CD8 alpha interact differently with beta 2-microglobulin of the class I molecules H-2Kb and thymic leukemia antigen, while similarly with their alpha 3 domains. J Immunol (2002) 168:3881–6.
39. Walker LJ, Smith M, Khan Y, Oo Y, Barnes E. 707 CD8AA T cells: a novel lineage enriched in the liver In chronic HCV J Hepatol (2010) 52(Suppl 1):S275. doi:10.1016/S0168-8278(10)60709-X
40. Billerbeck E, Kang Y-H, Walker L, Lockstone H, Grafmueller S, Fleming V, et al. Analysis of CD161 expression on human CD8+ T cells defines a distinct functional subset with tissue-homing properties. Proc Natl Acad Sci U S A (2010) 107:3006–11. doi:10.1073/pnas.0914839107
41. Gangadharan D, Lambolez F, Attinger A, Wang-Zhu Y, Sullivan BA, Cheroutre H. Identification of pre- and post-selection TCRalphabeta+ intraepithelial lymphocyte precursors in the thymus. Immunity (2006) 25:631–41. doi:10.1016/j.immuni.2006.08.018
42. Bowness P, Ridley A, Shaw J, Chan AT, Wong-Baeza I, Fleming M, et al. Th17 cells expressing KIR3DL2+ and responsive to HLA-B27 homodimers are increased in ankylosing spondylitis. J Immunol (2011) 186:2672–80. doi:10.4049/jimmunol.1002653
43. Dock JN, Effros RB. Role of CD8 T cell replicative senescence in human aging and in HIV-mediated immunosenescence. Aging Dis (2011) 2:382–97.
44. Terabe M, Tagaya Y, Zhu Q, Granger L, Roederer M, Waldmann TA, et al. IL-15 expands unconventional CD8alphaalphaNK1.1+ T cells but not Valpha14Jalpha18+ NKT cells. J Immunol (2008) 180:7276–86.
45. Ma LJ, Acero LF, Zal T, Schluns KS. Trans-presentation of IL-15 by intestinal epithelial cells drives development of CD8alphaalpha IELs. J Immunol (2009) 183:1044–54. doi:10.4049/jimmunol.0900420
46. McNicol A-M, Bendle G, Holler A, Matjeka T, Dalton E, Rettig L, et al. CD8alpha/alpha homodimers fail to function as co-receptor for a CD8-dependent TCR. Eur J Immunol (2007) 37:1634–41. doi:10.1002/eji.200636900
Keywords: CD8+ T cells, hepatitis B, hepatitis C, HIV-1, CD8α
Citation: Walker LJ, Marrinan E, Muenchhoff M, Ferguson J, Kloverpris H, Cheroutre H, Barnes E, Goulder P and Klenerman P (2013) CD8αα expression marks terminally differentiated human CD8+ T cells expanded in chronic viral infection. Front. Immunol. 4:223. doi: 10.3389/fimmu.2013.00223
Received: 21 May 2013; Accepted: 17 July 2013;
Published online: 06 August 2013.
Edited by:
Peter Katsikis, Drexel University, USAReviewed by:
Allan Zajac, University of Alabama at Birmingham, USAShahram Salek-Ardakani, University of Florida, USA
Copyright: © 2013 Walker, Marrinan, Muenchhoff, Ferguson, Kloverpris, Cheroutre, Barnes, Goulder and Klenerman. This is an open-access article distributed under the terms of the Creative Commons Attribution License (CC BY). The use, distribution or reproduction in other forums is permitted, provided the original author(s) or licensor are credited and that the original publication in this journal is cited, in accordance with accepted academic practice. No use, distribution or reproduction is permitted which does not comply with these terms.
*Correspondence: Paul Klenerman, Peter Medawar Building for Pathogen Research, University of Oxford, South Parks Road, OX1 3SY Oxford, UK e-mail:cGF1bC5rbGVuZXJtYW5AbWVkYXdhci5veC5hYy51aw==