 Christine Schmeitz1
 Esteban Abelardo Hernandez-Vargas1
 Ralf Fliegert2
 Andreas H. Guse2
 Michael Meyer-Hermann1,3*
- 1Department of Systems Immunology, Helmholtz Centre for Infection Research, Braunschweig, Germany
- 2The Calcium Signalling Group, Department of Biochemistry and Molecular Cell Biology, University Medical Center Hamburg-Eppendorf, Hamburg, Germany
- 3 Department of Life Sciences, Technische Universität Braunschweig, Braunschweig, Germany
Fate decision processes of T lymphocytes are crucial for health and disease. Whether a T lymphocyte is activated, divides, gets anergic, or initiates apoptosis depends on extracellular triggers and intracellular signaling. Free cytosolic calcium dynamics plays an important role in this context. The relative contributions of store-derived calcium entry and calcium entry from extracellular space to T lymphocyte activation are still a matter of debate. Here we develop a quantitative mathematical model of T lymphocyte calcium dynamics in order to establish a tool which allows to disentangle cause-effect relationships between ion fluxes and observed calcium time courses. The model is based on single transmembrane protein characteristics which have been determined in independent experiments. This reduces the number of unknown parameters in the model to a minimum and ensures the predictive power of the model. Simulation results are subsequently used for an analysis of whole cell calcium dynamics measured under various experimental conditions. The model accounts for a variety of these conditions, which supports the suitability of the modeling approach. The simulation results suggest a model in which calcium dynamics dominantly relies on the opening of channels in calcium stores while calcium entry through calcium-release activated channels (CRAC) is more associated with the maintenance of the T lymphocyte calcium levels and prevents the cell from calcium depletion. Our findings indicate that CRAC guarantees a long-term stable calcium level which is required for cell survival and sustained calcium enhancement.
1. Introduction
The dynamics of the free cytosolic calcium concentration upon stimulation of T lymphocytes (TCs) is crucial for TC activation and fate decision processes. While it is clear that calcium rises upon stimulation of the TC receptor (TCR), the calcium pattern associated with different fates of TCs has not been deciphered (1–4). However, it is likely that the calcium signal is correlated with the later fate of the activated TC, i.e., anergy, division, acquisition of the regulatory phenotype or apoptosis (3, 5, 6). Dysregulation in TC calcium signaling has been linked to inflammatory and autoimmune diseases as well as to allograft rejection (2). A relevant player in calcium dynamics is the calcium-release activated channel (CRAC) which is located in the plasma-membrane and activated by calcium depletion in the intracellular calcium stores like the endoplasmic reticulum (ER). As ion-gating transmembrane proteins in the plasma-membrane (PM) are possible targets of drug applications in the context of various clinical settings (2, 7, 8), insight into the specific calcium dynamics is essential for an efficient control of TC behavior.
The relative contribution of ER-derived calcium entry versus CRAC to the calcium signal following TC stimulation is a matter of ongoing debate (9–12). While a considerable number of scientists argue for CRAC being the major player of TC calcium dynamics (12, 13), others argue for a dominant role of calcium-induced calcium-release (CICR) (10, 14, 15) or for a dominant role of second messenger-induced calcium-release from ER (16, 17). All three contributions are required for a functional TC calcium signal, however, the sequence of the contributions might be essential. Second messenger-induced activity appears as a very early signal (18), which might act as triggering event for CICR and subsequent CRAC activation (2, 19–21). Quantitative analysis of the components of calcium signaling during TC activation is essential for the development of strategies for an efficient control of TC responses. A mathematical analysis of the calcium dynamics in a model including calcium stores and CRAC may shed light on the relation and relevance of both calcium sources (12, 22). This is the major motivation for the present work.
T lymphocytes are non-excitable cells in the sense that they do not exhibit bursts like pancreatic beta-cells, spikes like neurons, or comparable fast dynamics (23–25) even though single cell measurements detected calcium oscillations (10, 19, 26). The non-excitability of TCs might have prevented a larger interest of mathematical modelers in lymphocyte calcium dynamics. The few existing models (22, 27–29) mostly focused on modeling of CRAC-channel dynamics or a special part of the store-operated-calcium-entry signaling pathway (27) and its contribution to intracellular calcium dynamics. Also the dependence of ORAI1 assembly to a tetrameric CRAC on calcium oscillations was considered (28). In one approach a spatial resolution of CRAC currents and of the calcium dynamics in TCs was considered in the context of immunological synapse formation (22). Two different models for inositol 1,4,5-tris-phosphate-receptor (IP3R) activity were compared and it was shown that they differ in their impact on TC calcium dynamics (27), a result that will be used in the present model as well. The plasma-membrane calcium-ATPase (PMCA) was modeled in Jurkat TCs and a reversible modulation of PMCA activity was postulated (12), which is a further topic addressed in this investigation.
The aforementioned theoretical studies on TC calcium dynamics were all based on whole cell current models. In the context of excitable cells we have shown that it is possible to derive the whole cell currents from the single transmembrane properties (30). To achieve this goal, specific quantitative measurements of protein activation, inactivation, dependencies and conductance were used. The big advantage of this approach is that most parameters of the model are determined by independent experiments, which increases the predictive power of the model. The present paper applies this strategy to calcium dynamics of TCs. The model also includes the dynamics of transmembrane channel expression kinetics in order to represent CRAC recruitment upon calcium store depletion. The mathematical model was validated using dynamic calcium data measured under specific experimental conditions. The validated model allowed to reassess the relative role of store-derived and CRAC-mediated calcium entry on a quantitative basis. A new role of the CRAC-channel is postulated, which is associated with maintenance of TC calcium levels rather than TC activation.
2. Materials and Methods
The modeling framework is presented in this section. Three compartments, extracellular space (ES), cytosol, and ER are distinguished, each being represented by ordinary differential equations. The nucleus is only included as an object which reduces intracellular space (Section 2.4). The compartments are encased by the PM and the membrane of the ER. Both membranes contain transmembrane proteins (Figure 1), which allow for a flow of ions from one compartment to the other. The surface densities and the properties of these proteins in terms of conductance and control parameters determine the resting and activated states of the TC. While the protein properties are derived from measured single protein data, which are independent of the whole cell calcium experiments used for validation, the protein densities are in parts derived from steady state conditions (Section 2.9) and in parts determined by fitting to whole cell calcium dynamics (Section 2.10).
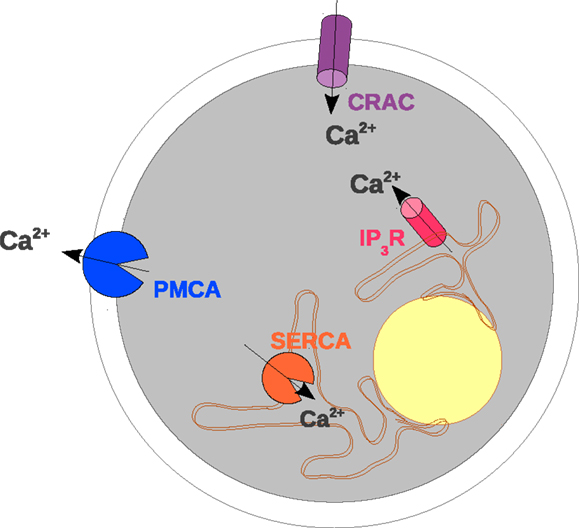
Figure 1. Scheme of the transmembrane proteins included in the mathematical model. The elements of a TC considered in the mathematical model are shown with particular emphasis on calcium-conducting transmembrane proteins. The outer border of the cell represents the PM. In the PM CRAC and PMCA are located which induce calcium influx and extrusion, respectively. The intracellular organelle around the nucleus (yellow) depicts the ER. The membrane of the ER contains IP3R and SERCA (sarco/endoplasmic reticulum calcium-ATPase) which control the exchange of calcium between the ER and the cytosol.
In the following, the equations for calcium dynamics, calcium-buffering, and for the second messenger d-myo-inositol-1,4,5-tris-phosphate (IP3) are introduced. The details of the compartment sizes and the surface between the compartments are explained in Section 2.4. Particular emphasis is put on the geometry of the Jurkat TC, the specific cell line, which is used in the subsequently described experiments. The single transmembrane protein characteristics will be described and the corresponding mathematical models introduced. Wherever possible we implemented data from experiments performed with Jurkat TCs. Finally, all model pieces are merged to the proposed model of TC calcium dynamics in Section 2.10. This includes the determination of the remaining unknown parameters.
2.1. Calcium Dynamics and Buffering
Two major players determine exchange of calcium through the PM (Figure 1): PMCAs actively transport calcium from the cytosol into ES (12, 31), while CRAC-channels allow for a passive electrochemical current of calcium ions into the cell (21, 32, 33). The density of active CRAC-channels ρCRAC in the PM is increased in dependence on ER calcium (CER) depletion (34). The free cytosolic calcium concentration (C) is further affected by modulations of the calcium flow between cytosol and ER (Figure 1). Sarco/endoplasmic reticulum calcium-ATPase (SERCA) transports calcium ions from the cytosol into the ER (10, 35) and by this maintains a chemical gradient of calcium from the ER to the cytosol. Conversely, calcium can passively leave the ER into the cytosol when IP3R channels open in dependence on calcium and the second messenger IP3 (1, 36, 37) associated with calcium-induced-calcium-release (CICR) (38). Furthermore other second messengers like cyclic ADP ribose (cADPR) (16) and nicotinic acid adenine dinucleotide phosphate (NAADP) (39) were found to influence calcium dynamics. Their effect is mediated by activation of the ryanodine receptor (RyR) which leads to calcium-release from intracellular stores (17, 40–43). In order to avoid an over-parametrization of whole cell calcium curves, which the present model focusses on, we restrict ourselves to the dynamics of IP3. The inclusion of cADPR and NAADP and their effect on RyR requires a more detailed data basis and should be addressed with a more complex model in the future.
2.1.1. Calcium in the cytosol
The four sources and sinks of free cytosolic calcium C are described as
where zCa = 2 is the valence of calcium ions, F the Faraday constant, ξ and ξERC geometrical surface to volume ratios for PM [equation (16)] and ER membrane [equation (17)], respectively. ρX is the surface density and IX the single transmembrane protein current, which are defined in the subsequent sections. By convention, positive ions that enter the cytosol are represented by negative electrical currents. BC represents the cytosolic calcium-buffer in the rapid buffer approximation
where b0 is the total buffer concentration, and Kb the calcium-buffer dissociation constant. The fraction of free calcium in the cytosol then reads
The main buffer within the cytosol is calmodulin (CaM) with 4 calcium binding sites per CaM. There is a diversity of measured CaM concentrations depending on cell type and organ (44–46). A realistic average value is 25 μM of CaM, corresponding to b0 = 100 μM of calcium binding sites. The dissociation constant Kb was determined by the required fraction of free calcium of fC ≈ 0.1% in non-excitable cells (47), leading to Kb = 0.1 μM.
2.1.2. Calcium in the ER
The dynamics of the calcium concentration in the ER CER is described by an equation analogous to equation (1)
with a different geometrical factor ξER [equation (18)], and a different calcium-buffer BC,ER defined by
The fraction of free calcium in the ER reads
The resting ER calcium level is CER,0 = 400 μM (2) which holds true for Jurkat TCs considered here (34).
In the ER calcium is buffered by calsequestrin, with three high and three low-affinity binding sites (48), and by calreticulin, with two distinct domains, one with high-affinity (K = 0.01 mM) but low capacity (0.6–1 mol Ca2+/mol protein), and one with low-affinity (K = 2 mM) but high capacity (18 mol Ca2+/mol protein) (49). As calreticulin binds more than 50% of the luminal ER calcium (50) only this buffer is considered here. In pancreatic acinar cells it was estimated that 20-times more calcium would be free in the ER compared to the cytosol (47), suggesting fC,ER ≈ 0.02. This is achieved by using bER,0 = 30 mM and KER,b = 0.1 mM, which corresponds to an intermediate dissociation constant of both calcium binding domains.
2.2. IP3 Dynamics
IP3 (P) is generated in a TCR- and calcium-dependent way described by
where βP is the production and γP the degradation rate. The Hill-function is defined as
where K is the concentration of X at which the Hill-function reaches its half value, and n the Hill-coefficient which determines the steepness of the Hill-function.
The degradation rate in equation (7) is determined by steady state conditions for IP3 in equation (35). The production rate is the tonic production rate and is modulated by increased calcium with the Hill-function in equation (7), leading to a positive feedback loop between calcium and IP3. βP is fitted as described in Section 2.10 and mainly influences the speed of the early calcium response after TC stimulation.
The production is further modified by the time-dependent input function T(t) representing the degree of TCR stimulation of the cell. T = 1 is assumed in the resting state.
The resting concentration of IP3 P0 is identified as critical parameter. It strongly determines the responsivity of the cell via activation of IP3R (see Section 2.6). It was fitted as described in Section 2.10.
2.3. Membrane and Reversal Potentials
The resting membrane potential is set to V = −60 mV (51–53). It is assumed that the membrane potential is not changed by the calcium currents (V = V0) and that the electrical current corresponding to calcium fluxes in or out of the cell is equilibrated by other ions.
Further it is assumed that VER,0 = V0 = −60 mV, thus, the ER and the cytosol are electrically equilibrated (54). ER calcium efflux may lead to small fluctuations (55) which are neglected. Thus, VER = V is assumed at all times.
In this approximation, the reversal potentials depend on the chemical gradient only. The Nernst-equation is used to calculate the reversal potential during dynamical changes of calcium concentrations:
where R = 8.315 J/(K mol) the Rydberg (molar) gas constant, T = 310 K, and F the Faraday constant.
For many channels, the real I-V-relationship is not linear as assumed for the currents IX in equations (23) and (28). Therefore, the reversal potential is corrected for the CRAC-channel by a shift ΔVC = 78 mV in order to achieve the correct linear extrapolation of the I-V-relation of CRAC-channels with a zero around [(34) Figure 1, (33) Figure 2]. This approximation is only valid for depolarization below V = 50 mV.
The reversal potential for ER calcium is treated in complete analogy to the cytosolic case which leads to a correction of ΔVC,ER. As the value is not known it is derived using the fitting routine in Section 2.10.
2.4. TC Geometry
Most measurements on TC calcium dynamics are performed in Jurkat TCs which are small but still larger than normal human blood derived TCs. In an approach based on ordinary differential equations the effect of an ion current onto the concentration of the ion in the cytosol or ER is not spatially resolved. While local calcium entry can induce transient high concentrations of calcium (22) the comparably small cytosolic volume of TCs justifies this approach for the description of whole cell calcium dynamics because local inhomogeneities will quickly equilibrate. In the model this is reflected as change of the average concentration. How an ion current changes the average calcium concentration depends on the geometry of the cell. In the dynamic equations for the ion concentrations the current IX through an individual ion-conducting protein X is multiplied by the surface density ρX. Thus the concentration change is derived from a current surface density. The latter has to be translated to the actual change in concentration by a surface to volume ratio, which is considered here.
Given a cell radius Rcell, the cell volume Vcell and cell surface Acell are known as well. However, the volume relevant to changes in concentration is not the cell volume Vcell but the cytosolic volume Vcyt which can be approximated as
using the volumes of ER and nucleus. This is important because the nucleus, with a radius of
is substantially reducing the resulting cytosolic volume. fR ≈ 0.8 is assumed for human TCs (56), and fR ≈ 0.25 for Jurkat TCs. The volume of the ER is expressed as a fraction of the total cell volume
with fV ≈ 0.1 (57). However, electron micrographs of TCs suggest that fV ≈ 0.01 (25) which is used here. Taking this together, the cytosolic volume becomes
The surface of the ER is also needed in order to translate the current surface densities calculated on the ER surface into concentration changes in cytosol and ER. While the TC itself is approximated as a sphere, the ER is absolutely non-spherical. The exact surface of the ER is difficult to be measured and accordingly approximated as
where is the surface of a spherical ER with volume [determined in equation (12)], and fA is the fold increase of the ER surface with respect to the surface of a spherical ER. fA = 30 was roughly estimated from the folding degree of the ER in electron micrographs of TCs (25). Note that only the product of fA with enters the model, such that both parameters are redundant and were only separated because of their physiological meaning.
The size of human blood TCs can be estimated starting from the capacity of Cm = 0.028 pF/μm2 (58, 59) and using the whole cell capacitance of Ccell = 2 pF [(60), p. 606]. Ccell = 1.7 pF was found in Fomina et al. (14). Using Ccell/Acell = Cm this yields a radius
and the resulting Rcell ≈ 2.4 μm corresponds to Acell = 72.4 μm2. The experiments described below were performed with Jurkat TCs and the same authors determined the cell volume to Vcell = 2 pl (12). This determines the values Rcell = 8 μm and Acell = 804.2 μm2 used in the present simulations.
Given the cell radius Rcell, the fractions fV and fR, as well as the factor fA, the surface to volume ratios required in equations (1) and (4) can be calculated by
with
2.5. CRAC-Channel
The open CRAC-channel current is determined by the electrochemical gradient
This approach closely follows the model of Martin et al. (22). The validity of the Ohm’s law approximation is only guaranteed within limited ranges of membrane potentials.
2.5.1. Single channel conductance
The single channel CRAC conductance was found to be extremely small in the order of (61).
2.5.2. CRAC recruitment
The density of active CRAC-channels, estimated by the steady state CRAC-channel current, is a dynamic function of the ER-calcium concentration [(34) Figure 1C] described by
where
with CCRAC = 169 μM and nCRAC = 4.2. To our knowledge, this is the first time that the surface density of active CRAC-channels in the PM is modeled as a dynamic quantity.
When estimating the same quantity from the degree of STIM1-redistribution, a rather similar relation is found with CCRAC = 187 μM and nCRAC = 3.8 [(34), Figure 2]. The uniformity of both curves supports the view that CRAC-channels are recruited and open in response to ER calcium depletion (34). It can be deduced from the similarity of both curves that the opening dynamics is substantially faster than the redistribution of STIM1. As no opening dynamics of the CRAC-channel is included in the model, the dynamics of the current itself and not of STIM1-redistribution is used.
2.5.3. CRAC density
In equation (25) are the upper and lower limits of possible active CRAC densities. The resting value ρCRAC,0 is not known from experiment and is determined by parameter fitting to calcium dynamics upon TCR stimulation (Section 2.10).
The density of CRAC-channels upon activation with PHA increased about 9-fold (33) which constraints . A 10-fold increase has been reported for the whole cell CRAC current in response to stepwise reduced CER [Figure 1C in Luik et al. (34)]. These findings translate into the condition
where was determined by parameter fitting within the experimental boundaries in Section 2.10. A value for is not known and is determined by the steady state condition equation (36).
2.5.4. CRAC time scales
The time scale of CRAC recruitment can be estimated from the rising time of calcium curves which provides an upper bound of τCRAC < 100 s for the activation time. It is likely that this time is associated with CRAC recruitment rather than with CRAC opening because opening time scales are typically much shorter. The time scale of CRAC recruitment is set to τCRAC = 5 s. Larger values could also be used as the fit was insensitive to τCRAC. Inactivation of CRAC-channels is difficult to be assessed (62). As the time scale of inactivation is in the order of 1000 s (14) and thus longer than the typical experimental durations used here, the present model ignores CRAC inactivation and assumes that the reduction of active CRAC-channels is a secondary effect of CER recovery.
2.6. IP3R in the ER
The ER releases its calcium content if activated by IP3 and cytosolic calcium (63, 64). The release of calcium from intracellular stores is based on the opening dynamics of RyR and IP3R in the membrane of the ER. TCs express both, RyR and IP3R and even different subtypes of them.
IP3Rs have binding sites for IP3 and calcium and exhibit complex forms of cooperativity (65). For the present purpose the heuristic description of IP3R activation and inhibition is sufficient. The characteristic feature of the IP3R conductance is a calcium-dependent log-bell-shaped opening probability curve (63) which has been measured for ER vesicles from canine cerebellum and further reviewed in Foskett et al. (38). The open probability curve was best fitted by the product of an activating and an inhibiting Hill-function, both with Hill-coefficient 2 (63).
2.6.1. Open probability
TCR signaling leads to the generation of IP3, the ligand of the IP3R, which modulates the open probability of IP3R and is described as the product of an activation term gIP3R and an inactivation term hIP3R. The properties of single channel openings were quantitatively determined in Xenopus laevis oocytes (37, 38) and we assume that the single channel properties are transferable to TCs. The measured dynamics are well described by the previously published Mak–McBride–Foskett model (37, 38).
The according parameters were obtained from a data fit (37) to be gIP3R,max = 0.81, CIP3R,act = 0.21 μM, nIP3R,act = 1.9, nIP3R,inh = 3.9, = 52 μM, nIP3R,C = 4, and the IP3-concentration of half-activation PIP3R,C = 0.050 μM.
The dependencies of the model equation (27) on calcium and IP3 are depicted in Figure 2 and correctly reproduce the measurements in Mak et al. (37) suggesting that the modulating effect of IP3 is mediated by IP3R inactivation (38). At low calcium this effect is hardly visible and IP3R activation remains unaffected by changes in IP3 for resting concentrations beyond 50 nM. The dynamic IP3 range is between 100 nM and 1 μM (see (66), Table 1), a regime of IP3 at which the IP3R-type1 exhibits saturation (27, 67). We do not aim at resolving whether the resting IP3 is lower in TCs or whether the IP3R characteristics are different in TCs, such that the DeYoung–Keizer model should be employed instead (27, 65). It is assumed that the resting concentration of IP3 is in the range of 5–10 nM which ensures that an increased IP3-concentration has an impact on the IP3R opening probability as depicted in Figure 2.
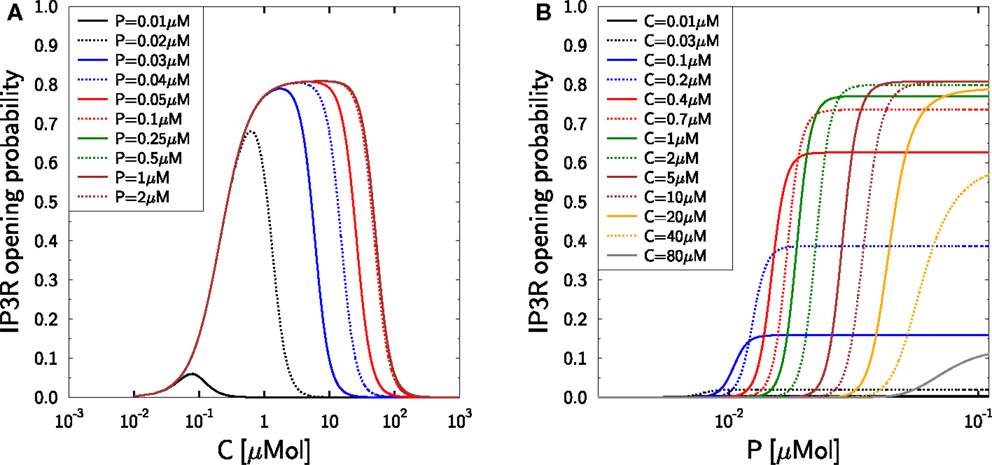
Figure 2. Activation and inactivation of IP3R in dependence on calcium and IP3. Reproduction of the experimental data (37) with the Mak–McBride–Foskett model equation (27). (A) IP3R opening probability gIP3R hIP3R in dependence on free cytosolic calcium C for different IP3-concentrations P. (B) The same IP3R opening probability in dependence on IP3-concentration P for different free cytosolic calcium concentrations C.
2.6.2. IP3R calcium current
The steady state activation function (Figure 2) can be used to define the calcium current through the IP3R which follows the electrochemical gradient between the cytosol and the ER
with . Note that the conductance differs between tissues (38). V − VER is the potential difference between ER and cytosol, and is the ER-reversal potential for calcium, calculated from the Nernst-equation equation (9). We assume an electrical equilibrated relation of cytosol and ER such that V = VER holds true.
2.6.3. (In)activation dynamics
The activation and inactivation factors g and h are treated dynamically and approach equation (27) in steady state, while the adaptation of CIP3R,inh in equation (27) is treated in quasi steady state:
2.6.4. Activation time
Activation time scales can be determined from Mak and Foskett (68), Figure 5, and are in the range of less than 5 and 20 ms for depolarizations to 20 and 40 mV. Two exponentials were needed to fit the opening frequency. Using rat hepatocytes the activation and inactivation time scales were found to depend on the IP3-levels (69): activation varied between 100 and 500 ms for 10 μM and 400 nM of IP3, respectively (see Figure 1 therein). The time delay reported in Marchant and Taylor (69) is consistent with the IP3-dependent time delay of channel opening of 1 s > τIP3R > 100 ms using basophilic leukemia cells from rats (70). As the model focusses on calcium dynamics on the scale of minutes, a constant τIP3R = 100 ms is assumed.
2.6.5. Inactivation time
Onset of inactivation happens in less than 2 min (68). A slow and a fast current were distinguished (69). The fast current inactivates on a time scale of 200–450 ms, the slow one between 1 and 6 s (see Figure 2 in the same publication). The authors attribute the fast time scale to inactivation of IP3R and the slow one to the depletion of the calcium content in the ER. Accordingly, only the fast time scales are relevant for the single IP3R, and θIP3R = 300 ms is assumed.
2.6.6. Calmodulin dependence
It was found that the calcium-release from ER is reduced for high concentrations of the calcium-buffer calmodulin (71). Such a dependence is neglected in the present model.
2.6.7. IP3R density
The IP3R density on Jurkat TCs is not known and is determined using steady state condition equation (34).
2.7. Plasma-Membrane Calcium-ATPase
Plasma-membrane calcium-ATPase is an ATP-driven calcium pump which extrudes calcium from the cell to the ES. It was characterized in TCs (12). In a first attempt the dependence on the ATP concentration is ignored and assumed to be large enough in order to make the pump work optimally. In this case the activity is mainly dependent on the calcium concentration in the cell. A suitable modeling approach is
with
The current is positive as it carries calcium out of the cell. The Hill-coefficient was determined to be nPMCA = 2 (72).
2.7.1. Turn-over rate
The turn-over rate of PMCA is approximately 30 Hz (73) which corresponds to an activity rate of ka = 0.03/ms which is also used in Sherman et al. (74). This turn-over rate can be translated into an electrical current by using that every pumping event corresponds to the flow of 2 electrical charges which yields C/s ≈ 10−17 A = 10−5 pA.
2.7.2. Calcium-dependent activation
Typical values for the half-activation calcium concentration are CPMCA = 0.1 μM (at 540 nM calmodulin, see e.g., (75), Figure 3). The isoforms 2a and 2b exhibit CPMCA2ab < 0.1 μM. The predominant isoform of PMCA in Jurkat TCs is 4b [(76), Figure 6B]. CPMCA4b ≈ 0.2 μM was found in Jurkat TCs [Figure 2 in Caride et al. (76)] and is used here.
2.7.3. Calmodulin-dependent activation
Note that the values of half-activation also depend on the calmodulin concentration (75– 77). For calmodulin concentrations above 1 μM (which is exclusively the case in all present simulations) full activation of all isoforms is ensured (75, 78). Hence, the dependence on calmodulin is weak in this regime and is neglected.
2.7.4. Delay of activation
Binding of calcium to PMCA is a comparably fast process with a rate constant >3 per second (79). However, the activity of PMCA is delayed in some isoforms including the isoform 4b (76) which is relevant for TCs. The rate constant of PMCA activation upon stimulation with 500 nM of free calcium was in the range of 0.02 per second (76), which leads to a delay of PMCA activation in the range of τPMCA = 50 s in equation (31). This delay was associated with a calmodulin and calcium-dependent activation (76). However, as the exact mechanism is not known this delay is modeled in equation (31) on a phenomenological basis.
2.7.5. PMCA density
For TCs no precise value of the protein density is known and the value is determined by the steady state condition equation (33).
2.8. Sarco/Endoplasmic Reticulum Calcium-ATPase
The calcium level in ER is kept high with the help of SERCA calcium pumps. The activity of SERCA is assumed to rapidly adapt to the present calcium concentration in the cytosol and can be described by a Hill-function.
In every turn-over cycle two calcium ions are transported per ATP (80). There are different subtypes of SERCA whose properties differ. In Jurkat TCs as well as in human tonsil lymphocytes the dominant isoform is SERCA2b (81).
2.8.1. Turn-over rate
The turn-over rates of most isoforms are in the range of k = 10 Hz (i.e., = αSERCA zCa ek = 6 ⋅ 10−6 pA). For SERCA2b k2b = 5 Hz was reported (82) which implies the value pA used in the model.
2.8.2. Calcium-dependent activation
For the SERCA isoforms 1, 2a, and 2b the half-activation CSERCA = 0.4 μM and the Hill-coefficient nSERCA = 2 are a good approximation [(82) Figure 4]. The half-activation of SERCA3 is around 1μM with the same Hill-coefficient (82). SERCA2b is an isoform active at relatively low calcium concentrations (82). Specifically, in Jurkat TCs as well as in human tonsil lymphocytes, the dominant isoform SERCA2b was characterized with nSERCA2b = 2.0 and CSERCA2b = 0.25 μM (81), which is used here.
2.8.3. SERCA density
Even though the expression of SERCA was shown to be modulated upon activation (83), the expression density of SERCA within ER is not known and is determined by parameter fitting in Section 2.10.
2.9. Steady State Determines Protein Densities
The resting state of the TC is determined by setting the dynamics in equations 1, 4, 7, and 24 to zero. Accordingly, the equations for C, CER, P, and ρCRAC, read:
where IX,0 denotes the currents with all quantities X in the resting configuration X0. The parameters of the model are summarized in Table 1.
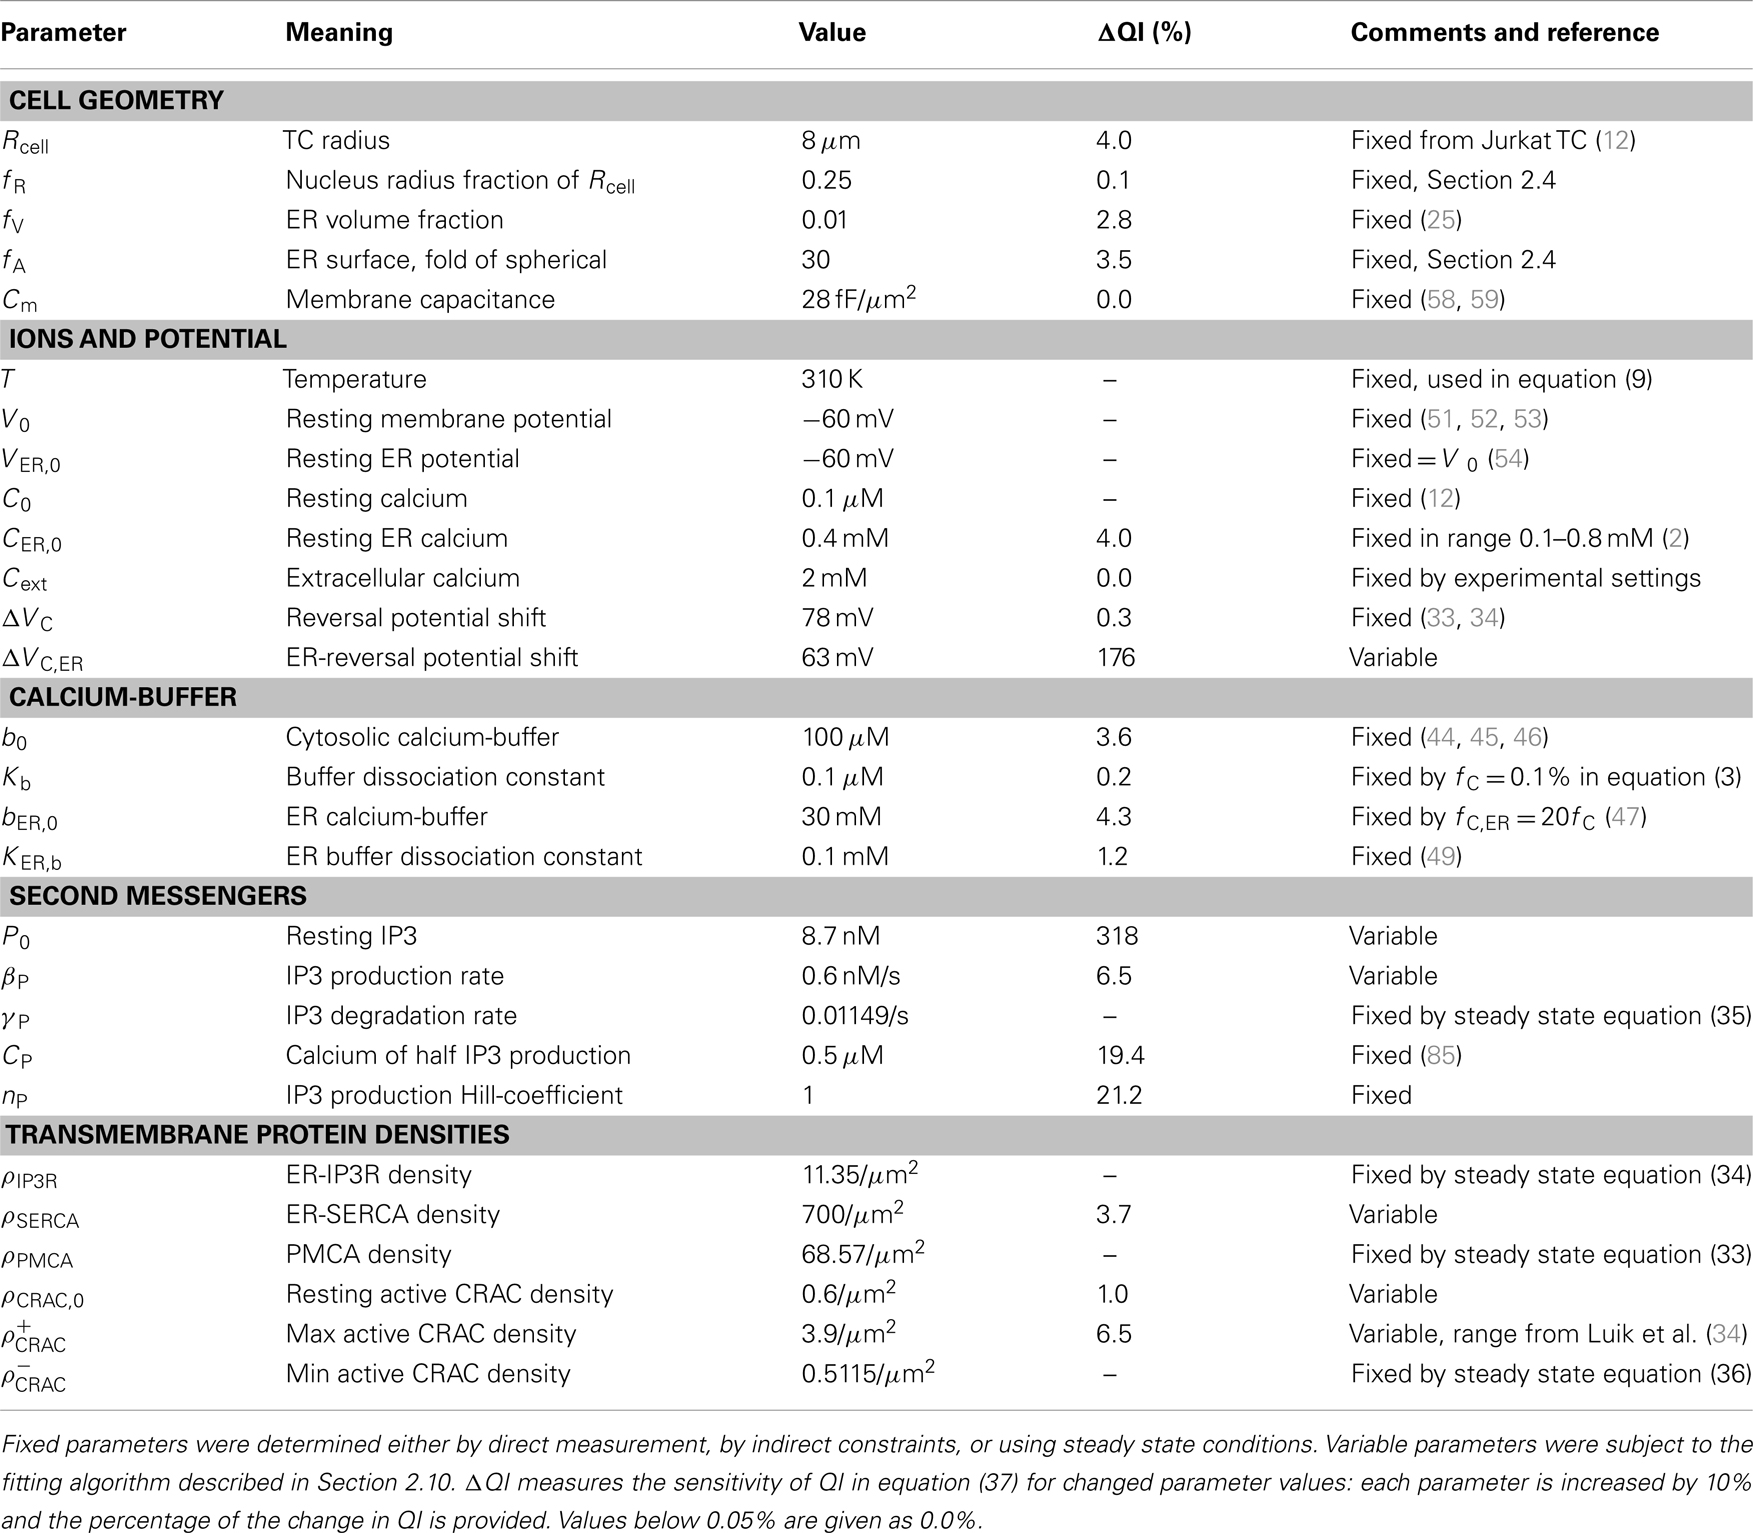
Table 1. List of parameters, values, and references.
2.10. Numerical Solution and Parameter Fitting
The model defined by the equations (1, 2, 4, 5, 7, 8, 16–25, 27–32) was implemented as C++-code and solved using a self-written 4th-order Runge–Kutta algorithm with adaptive stepsize control.
As not all parameters could be determined by steady state conditions or by experimental constraints, Figure 1A in Bautista et al. (12) was used to determine the remaining free parameters. We used a two-step fitting procedure: at first, the differential evolution algorithm defined in Storn and Price (84) was incorporated into the C++-code of the model on the basis of all parameters in Table 1 that were not determined by steady state conditions. The parameters were varied within hard-coded boundaries dictated by experimental constraints (when available). The quality of the fit to the calcium data in Bautista et al. (12) was measured as the mean square deviation
with Xi and Ei representing the simulation and experimental values, respectively. In a second step, the first approximative fit was subject to a sensitivity analysis in which each parameter was varied by 10% while monitoring the effect on QI. The three unknown protein densities ρSERCA, ρCRAC,0, and , two sensitive IP3 related parameters P0 and βP, as well as the very sensitive parameter ΔVC,ER were used for fine-tuning the initial parameter fit with the same differential evolution algorithm. These fit parameters are marked variable in Table 1. The final fit reached QI = 0.100197 with N = 22. The sensitivity analysis was repeated for the final fit and the impact of each parameter on QI in equation (37) is provided in Table 1.
All subsequently described simulations are started with the cell in steady state as defined by the hard-coded equations (33–36). Starting from these initial conditions, the respective stimulation protocols are applied as described in the results section.
3. Results
In the methods section single protein characteristics were summarized and specific mathematical models capturing their main properties were proposed or cited. The models for the single proteins were combined to a whole cell model and the unknown parameters were determined using steady state conditions or by data fitting as described in Section 2.10. In this section, we replicate specific experimental setups described in the literature in silico and analyze the calcium dynamics from the perspective of the model.
3.1. TCR Stimulation
The introduced TC-model is used to investigate the experiments of Bautista et al. (12) in Jurkat TCs. TC activation by stimulation of TCR induces an intracellular rise of second messengers like cADPR, NAADP, and IP3. In the present model this rise is collectively reflected in equation (7) for IP3. The IP3 signal activates IP3R and by this induces a calcium-release from the ER. The positive feedback loop of CICR leads to even more calcium-release from the ER, which in turn reduces the ER calcium concentration CER. CRAC is activated in a CER-dependent manner, as represented by equation (24). The rising cytosolic calcium is cleared by PMCA and the ER is refilled by SERCA, both being ATP-dependent processes.
Using 2 mM of external calcium a cell in resting state was activated with OKT3 via TCR [see Figure 1A in Bautista et al. (12)]. This induced a calcium peak to more than 1 μM within 50–100 s, which subsequently relaxed to a plateau level of ≈0.7 μM over the following 200 s. This behavior is well reproduced by the model (Figure 3A) and was used to determine the unknown parameters (Table 1). The peak height relies on both, on a proper activation of IP3R and CRAC. The choice of P0 turned out to be rather important in order to guarantee a proper activation of IP3R. The maximum activated CRAC density was essential for the height of the plateau. A value of fCRAC = 6.5 was found to correctly reproduce the plateau height as measured in Bautista et al. (12).
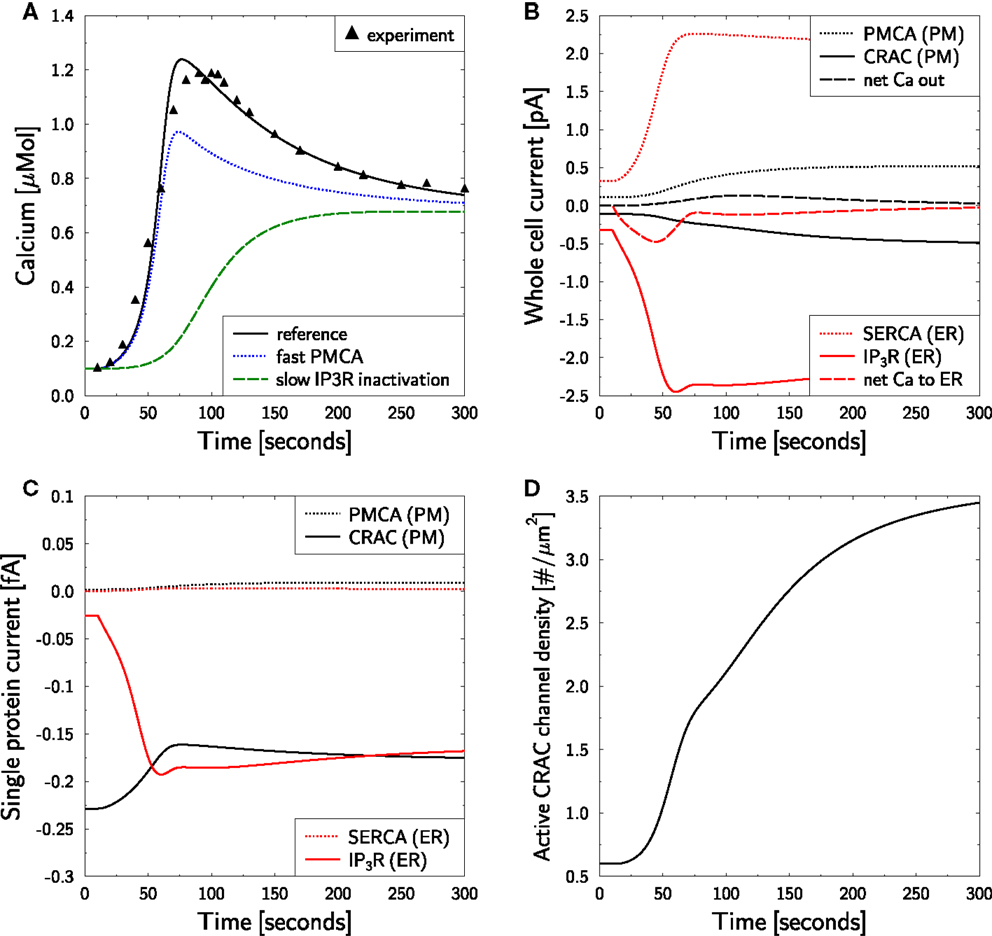
Figure 3. Calcium dynamics in response to TCR stimulation. Simulation of the experiment in Figure 1A in Bautista et al. (12). (A) The cell is in steady state until t = 10 s when stimulation is started by setting T(t) = 1.6 in equation (7). Stimulation is kept constant throughout the simulation. Reference is the simulation used as a basis for all other simulations in the paper and is compared to the experimental result [black triangles read off Figure 1A in Bautista et al. (12)]. For fast PMCA a value of 1 ms was used for τPMCA. For slow IP3R inactivation a value of 300 s was used for θIP3R. (B) Whole cell currents show an initial release of calcium from the ER which is followed by a CRAC inward current. Negative currents are calcium currents into the cytosol. (C) Single transmembrane protein currents. (D) Dynamic response of active CRAC-channel density.
Bautista et al. reported that the delay of PMCA activation is responsible for the calcium overshoot (12). Accordingly, we investigated whether this conclusion is supported by the model. For that purpose we reduced τPMCA from 50 s (76) to 1 millisecond in the otherwise unaltered simulation. This modification does not touch the steady state configuration, such that all other parameters remained unchanged. The model still generated an overshoot of calcium, however, with a reduced amplitude (Figure 3A, blue dotted line). The height of the plateau as well as the relaxation time from peak to plateau remained unchanged. Thus, the simulation supports an influence of the PMCA delay onto the overshoot, but it turned out to not be essential for its existence.
This surprising result led to the question whether a different delay in the model could explain the calcium overshoot. All delays were tested and the only delay with impact on the overshoot was IP3R inactivation, i.e., the parameter θIP3R (Figure 3A, green dashed line). In conclusion, the model suggests that intrinsic properties of the IP3R and not the delay of PMCA activation are responsible for the calcium overshoot upon TCR stimulation.
Next, the model is used for an analysis of the currents which are associated with the different phases of the calcium dynamics (Figure 3B). The IP3-current (red full line) is clearly the largest and also persists beyond the overshoot of calcium due to SERCA activity (red dotted line). The calcium peak induces a PMCA current (black dotted line) that drives the calcium out of the cell (black dashed line). Thus, the CRAC current (black full line), induced by the loss of calcium in the ER, does not even induce a net flow of calcium into the cell (black dashed line) but just prevents the cell from running out of calcium. This model result suggests that the role of CRAC is the stabilization of the cell rather than its activation, which is mostly mediated by calcium from the ER.
The single protein currents (Figure 3C) show that in the model IP3R currents react much more dynamic than CRAC currents. The increased cytosolic calcium even reduces the CRAC currents on the single channel level. However, the reduced ER calcium level induces a strong increase in the active CRAC-channel density (Figure 3D). Thus, the increased whole cell CRAC current seen in Figure 3B is not a result of single channel responses but of a changed channel density.
3.2. TCR Stimulation with Zero External Calcium
Zero external calcium experiments aim at suppressing CRAC currents in order to investigate ER calcium currents in response to TCR stimulation. TCR stimulation of Jurkat TCs hold at zero external calcium results in an intracellular calcium peak after 50–100 s with reduced amplitude in comparison to stimulation with normal external calcium [Figure 2A in Bautista et al. (12)]. The increased calcium is cleared below baseline level within 100–200 s.
In the model, the Nernst-equation prohibits the use of zero external calcium conditions. At very low calcium concentrations the Nernst-equation loses its validity and the reversal potential diverges. Therefore, external calcium is set to the concentration at which the CRAC current vanishes in resting state:
This mimicks the suppression of CRAC currents as intended in the experiment. The in silico result is shown in Figure 4. The CRAC current vanishes at resting state (Figure 4B, black full line). This is approximately true during the whole experiment, such that the method for mimicking the zero external calcium experiment appears appropriate.
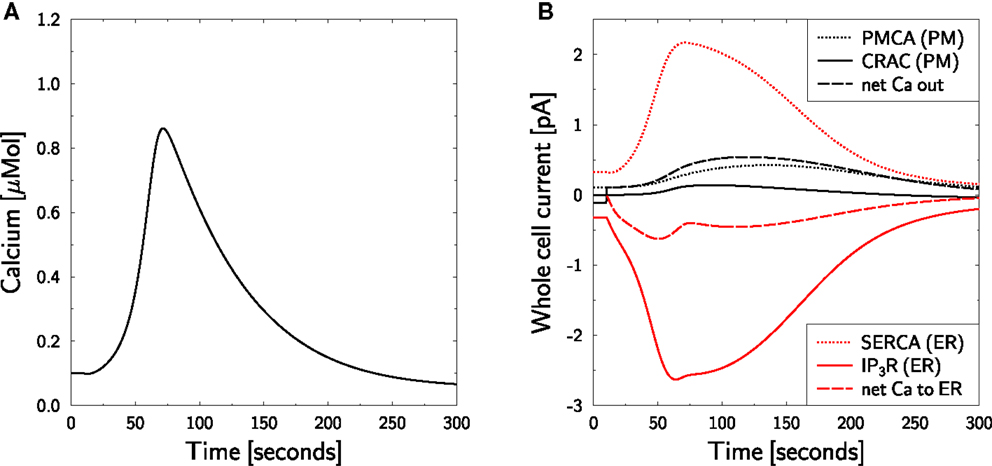
Figure 4. Calcium dynamics in response to TCR stimulation at zero external calcium. Simulation of the experiment in Figure 2A in Bautista et al. (12). (A) The cell is in steady state until t = 10 s, when stimulation is started by setting T(t) = 1.6 in equation (7) and external calcium is set to equation (38). Stimulation and external calcium are kept constant throughout the simulation. (B) Whole cell currents show the almost complete inhibition of CRAC currents. The calcium peak (left) is generated by ER calcium only. Negative currents are calcium currents into the cytosol.
The calcium peak (Figure 4A) is lower than the one found in Figure 3 which is qualitatively consistent with the experimental result (12). Furthermore, the time scales of calcium rise and clearance are perfectly matched between simulation and experiment. Even the overshoot of clearance below the baseline calcium level is fully reproduced. However, quantitatively, the peak is higher in theory than in experiment. As the in silico peak is exclusively generated by the ER, one might hypothesize that the ER is too big or its calcium content is too high. As these parameters were already chosen comparably low (Table 1), it is more likely that the lack of external calcium influences the stimulation of the cell. The peak size can be reduced to the measured amplitude by reducing the stimulation T from 1.6 to 1.25 (not shown).
3.3. Block of SERCA at Zero External Calcium
Thapsigargin (TG) is frequently used to block SERCA activity as it prevents calcium uptake by the ER and leads to a continuous reduction of ER calcium. As low ER calcium recruits and activates CRAC-channels, this would lead to a strong influx of extracellular calcium. In order to prevent this according ER depletion and CRAC activation experiments are performed in zero calcium medium. This strategy was used in Jurkat TCs to generate a cell state in which the ER is mostly void of calcium and CRAC-channels are recruited and activated to a maximum (12, 13, 25, 86). It was reported that this procedure leads to a transient calcium peak of about 0.5 μM after more than 100 s which is slowly cleared and reaches calcium levels below the resting level [Figure 1A in Quintana et al. (86)].
Having established a strategy [equation (38)] for mimicking a medium with zero calcium, a SERCA block is performed in silico by setting ISERCA = 0 at t = 10 s. No TCR stimulation was applied. The measured dynamics are well reproduced without any further parameter fitting (Figure 5A, black full line). Furthermore, the intended depletion of ER is achieved (Figure 5A, red dashed line): a continuous reduction of ER calcium is observed. Note that also IP3 exhibits some dynamics (Figure 5A, blue dotted line) which further accelerates ER calcium loss by activation of IP3R. As expected, the reduced ER calcium leads to the recruitment of active CRAC-channels (Figure 5B).
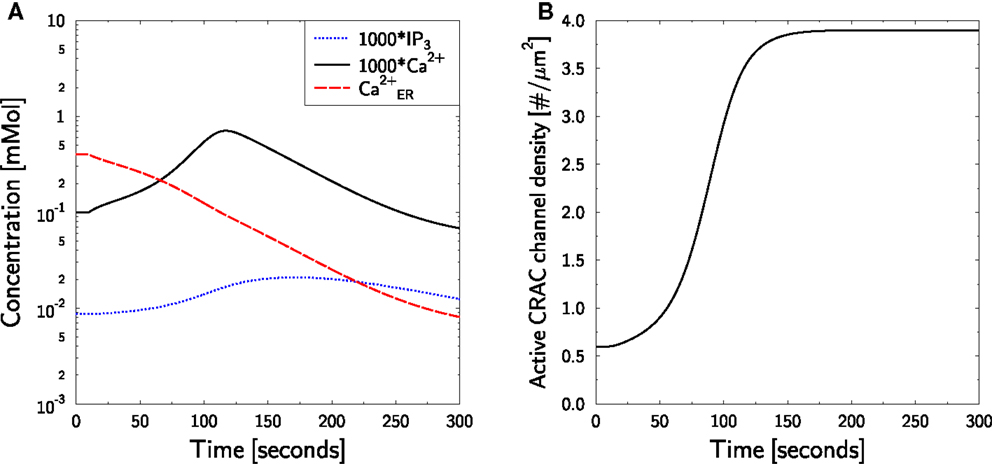
Figure 5. Calcium dynamics in response to TG SERCA block at zero external calcium. Simulation of the experiment in Figure 1A in Bautista et al. (86). (A) The cell is in steady state until t = 10 s, when SERCA block is applied and external calcium is set to equation (38). Block and external calcium are kept constant throughout the simulation. P (blue dotted line), C (black full line), and CER (red dashed line) are shown. Note the factor 1000 applied to P and C. (B) The time course of active CRAC density ρCRAC.
3.4. Block of PMCA in a TG Treated TC
As the TG-mediated SERCA block works in silico (Figure 5), the role of PMCA in the clearance of cytosolic calcium is investigated. Following Figure 6 in Bautista et al. (12) TG was applied in a zero calcium medium as in Figure 5. Then a pulse of 2 mM external calcium was applied for 50 s. This induces a steep rise in calcium which is also steeply cleared again. Together with Lanthan (La3+), a PMCA, and CRAC inhibitor (2), the clearance of such a calcium peak was substantially slower (12). A block of PMCA alone by carboxyeosin led to an only weakly modified clearance time, without a return to baseline levels within 300 s.
The same protocol is applied in the model (Figure 6). As before, ER calcium is depleted (Figure 6A, red dashed line) and the active CRAC density is increased correspondingly (as in Figure 5B). The initial free cytosolic calcium peak (Figure 6A, black full line) is the same as in Figure 5A. Upon increasing external calcium to 2 mM for 50 s at t = 300 s, a strong CRAC current is induced (Figure 6B, black full line), which steeply increases cytosolic calcium (Figure 6A, black full line). This calcium is also quickly cleared upon return to the mimicked zero calcium medium. Calcium clearance is dominated by the PMCA current (Figure 6B, black dotted line). However, in the model a small CRAC current is observed supporting extrusion of calcium out of the cell in the case of zero external calcium concentration. Upon permanent block of PMCA and repetition of the transient stimulation by external calcium, it is this backward CRAC current that clears calcium from the cytosol. The time course of the clearance is slower than without PMCA block and the calcium baseline is not reached after 350 s (Figure 6B, black full line). This is a similar behavior as in the corresponding experiment with carboxyeosin [Figure 6D in Bautista et al. (12)]. However, it is not known whether the real CRAC allows for such inverse current under zero calcium conditions. The return of calcium to the baseline might also be supported by uptake of calcium by other organelles like mitochondria, which is not covered by the present model.
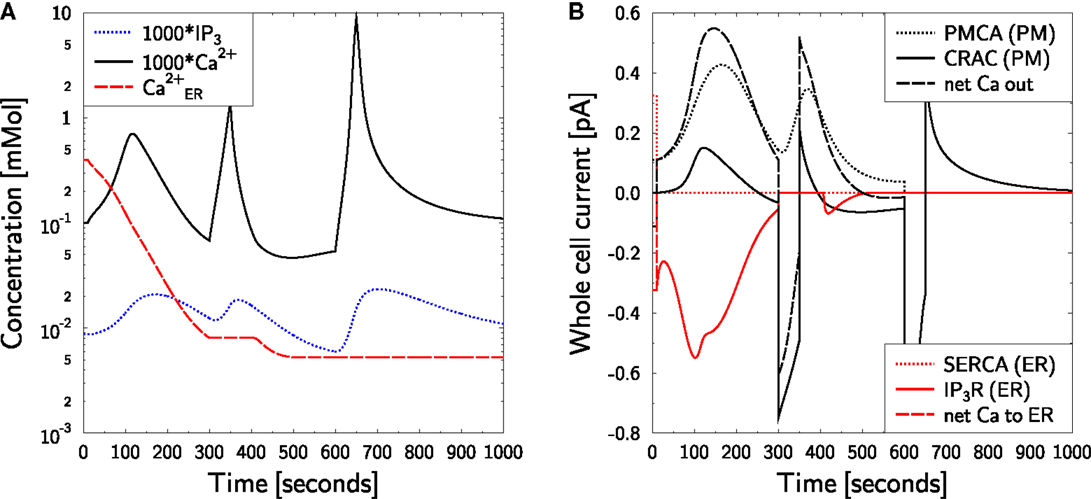
Figure 6. Calcium dynamics in response to SERCA and PMCA block at zero external calcium. Simulation of the experiment in Figures 6C,D of Bautista et al. (12). (A) The cell is in steady state until t = 10 s, when SERCA block is applied and external calcium is set to equation (38). At t = 300 s 2 mM external calcium are applied for 50 s followed by a switch back to equation (38). The procedure is repeated at t = 600 s. In addition, IPMCA is set to zero for the remaining simulation time. SERCA block is kept throughout the simulation. P (blue dotted line), C (black full line), and CER (red dashed line) are shown. Note the factor 1000 applied to P and C. (B) The CRAC density was increased during the first 300 s by ER calcium depletion with TG at zero external calcium [(A) red dashed line]. The whole cell currents show a sudden CRAC current (black full line) upon restoration of external calcium to 2 mM, which is cleared by PMCA activity (black dotted line) after return to zero external calcium. When PMCA is blocked in addition (at t = 600 s), the calcium clearance is slower (black full line). Negative currents are calcium currents into the cytosol.
In the case of PMCA- and CRAC-block with La3+ a rather slow calcium clearance is observed in experiments which apply the same stimulation protocol [Figure 6C in Bautista et al. (12)]. In silico no clearance is observed at all. SERCA is blocked and positive IIP3R-currents are not allowed in the model, such that an uptake of calcium into the ER is excluded. A full block of PMCA and CRAC also excludes any expulsion of calcium out of the cell. Thus, the model suggests that the slow clearance of cytosolic calcium is either due to incomplete block of PMCA or to leakage currents.
3.5. Block of PMCA in an Untreated TC
The model suggests that the role of CRAC for TC activation is mainly the maintenance of the integrity of the TCs during stimulation in the sense that it prevents the activated TC from running out of calcium. If we block PMCA in silico at the time of TCR stimulation (protocol as in Figure 3) in an otherwise untreated TC, the TC would be prevented of losing calcium. According to our interpretation of the role of CRAC we would expect that CRAC activity is strongly reduced in comparison to Figure 3.
T lymphocytes receptor stimulation of PMCA-blocked TCs is predicted to induce a strong increase of cytosolic calcium (Figure 7, full black line). Thereby, the steady state CRAC current is not increased (as in Figure 3B, full black line) but reduced (not shown). However, the CRAC current is not reduced to zero such that the total block of PMCA infers a persistent net influx of calcium into the cell and, thus, to a persistent increase of cytosolic calcium. This would ultimately destroy a real TC. As SERCA activity is normal in this in silico experiment, calcium in the ER is only transiently reduced (not shown), leading to a transient and weak increase in the CRAC density (Figure 7, dotted red line). The amplitude is less than twofold instead of sixfold in Figure 3D.
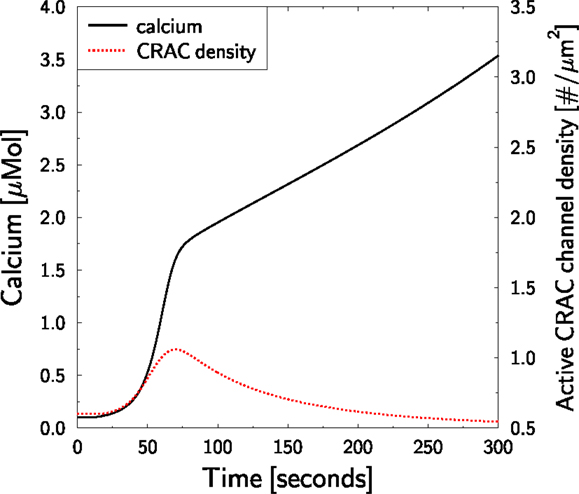
Figure 7. Block of PMCA in untreated TCs. The TCR stimulation protocol in Figure 3 is repeated. At the time of stimulation (t = 10 s), PMCA activity is blocked preventing calcium efflux from the cell. Cytosolic calcium (full black line, left axis) and the response of the CRAC density (dotted red line, right axis) are shown. The axis for the CRAC density was scaled as in Figure 3D for better comparison.
This result supports the interpretation of the role of CRAC-channels in silico and may be tested in experiment. It further shows, that the calcium level in the ER may be used as an indicator for the overall calcium status of TCs.
4. Discussion
Within the presented investigation whole cell calcium dynamics were derived from models of single transmembrane ion-conducting proteins. The model successfully described a number of experimental settings and captured important characteristics of calcium dynamics upon TCR stimulation. In particular, the role of store-derived calcium-release versus CRAC activation was well represented. We conclude, that we have generated a modeling framework suitable for the quantitative analysis of calcium dynamics of TCs.
The value of using measured single transmembrane protein characteristics is twofold: at first, it substantially reduces the number of free parameters in an otherwise very complex model. All measured single protein properties were just implemented and not altered in the fine-tuning of the model. The reduced number of free parameters increases the predictive power of the model. Secondly, it can be considered as a multi-scale approach which links single proteins to whole cell behavior. This allows the analysis of the dynamics on the single protein level and its implications onto the cellular properties. The drawback of this approach is that not all parameters could be derived from TCs such that we had to assume that single transmembrane properties are universal, which is a correct assumption in many cases (30). Within this framework, cell-specific properties are controlled by the protein densities and the cell-specific properties, both determining the activity range of the respective proteins. However, the predictive power of the model would benefit from corresponding TC related data.
The model of Jurkat TC calcium dynamics as supported by the mathematical model starts from a TCR-derived increase in second messengers like IP3. This ultimately activates IP3R currents and induces an initial calcium current from the ER into the cytosol which triggers CICR. However, calcium uptake via SERCA activity equilibrates the calcium loss in the ER, which leads to a zero net flux on long-term – despite ongoing TCR stimulation. The ER calcium loss, according to the model, was the major contribution to the free cytosolic calcium peak. However, as PMCA activity leads to an overall loss of calcium in the cell, a compensation mechanism is required for a sustained elevation of free cytosolic calcium. The model suggests that the CRAC activity essentially contributes to this compensation mechanism. The initiation of CRAC currents by the depletion of ER calcium levels is in line with this interpretation. The model predicts, that a standard stimulation of TCs together with a block of PMCA activity would lead to a strong calcium rise together with a minor and transient increase of the CRAC density and on long-term to a reduced CRAC current (see Figure 7). This prediction may be tested in experiment in order to validate this interpretation of the role of CRAC-channels.
The emerging hypothesis that the role of CRAC is the stabilization of the TC calcium level, needs to be further strengthened by more detailed modeling work. In particular, early events after stimulation like NAADP generation (87) and subsequent RyR calcium currents from the ER are essential for the early calcium rise (11, 18) and will have to be included in the mathematical model for a proper time-resolved coverage of calcium dynamics. The need for additional mechanisms is also underpinned by the strong sensitivity of the model behavior to changes in the IP3 resting concentration P0 (Table 1). In the present simulation the long-term calcium plateau height mostly relies on the maximum possible CRAC activation by store-operated calcium depletion. For the long-lasting calcium rise, cADPR was proven relevant (16, 40) and has to be considered in the context of the present hypothesis on the role of CRAC. Also the transferability to human blood derived TCs, which exhibit a different geometry, has to be assessed.
As the PMCA block experiment at zero external calcium has shown, it might be important to include leakage currents into the model. However, it should be noted that the postulated role of delayed PMCA activity for the calcium overshoot after TCR stimulation (12) could only partially be confirmed by the mathematical model. With fast activation of PMCA, an overshoot was still observed in our model, and the overshoot could only be suppressed by lack of IP3R inactivation. It should be noted that this result might rely on the Mak–McBride–Foskett model (37), which was used for IP3R dynamics and which exhibits inactivation at rather low IP3. The result might differ if the TC calcium dynamics would be based on the DeYoung–Keizer model for IP3R activity (65).
The proposed model has limitations in its range of applicability. For example, the usage of the Nernst-equation for the chemical gradient and Ohm’s law for the current-voltage relationship of ion-conducting pores is justified only in narrow limits. Experiments with zero external calcium drive the model to the very limits of this range of applicability which was circumvented here using a phenomenological approximation. The model may be reformulated in terms of the Fokker-Planck-equation in order to describe ion transport through the pores in more detail. Furthermore, it is known that calcium entrance points lead to spatially inhomogeneous calcium dynamics (22) which are not covered by the present space-averaged model. The value of the present approach lies in the surprising result that quantitative characteristics of single transmembrane proteins are sufficient to determine the cell behavior in the framework of an ordinary-differential-equation based model. The model has proven its predictive power, as it was fitted to data of one experiment in Figure 3 and could be used to predict and explain further data of calcium dynamics generated under other experimental conditions in Figures 4 and 6. It is planned to elaborate the potential and the limits of the model predictions by application to further experimental settings.
Conflict of Interest Statement
The authors declare that the research was conducted in the absence of any commercial or financial relationships that could be construed as a potential conflict of interest.
Acknowledgments
We thank Dr. Harald Kempf for revising the manuscript. Christine Schmeitz was supported by the Helmholtz International Graduate School for Infection Research. This study was partially supported by the Deutsche Forschungsgemeinschaft (grants GU 360/13-1 and GU 360/15-1 to Andreas H. Guse). Esteban Vargas and Michael Meyer-Hermann were supported by the BMBF within the GerontoSys initiative. Michael Meyer-Hermann was supported by HFSP.
References
1. Parekh A, Putney J. Store-operated calcium channels. Physiol Rev (2005) 85:757–810. doi:10.1152/physrev.00057.2003
2. Feske S. Calcium signalling in lymphocyte activation and disease. Nat Rev Immunol (2007) 7:690–702. doi:10.1038/nri2152
3. Arrol H, Church L, Bacon P, Young S. Intracellular calcium signalling patterns reflect the differentiation status of human T cells. Clin Exp Immunol (2008) 153:86–95. doi:10.1111/j.1365-2249.2008.03677.x
4. Feske S. ORAI1 and STIM1 deficiency in human and mice: roles of store-operated Ca2+ entry in the immune system and beyond. Immunol Rev (2009) 231:189–209. doi:10.1111/j.1600-065X.2009.00818.x
5. Oh-hora M, Rao A. Calcium signaling in lymphocytes. Curr Opin Immunol (2008) 20:250–8. doi:10.1016/j.coi.2008.04.004
6. Quintana A, Pasche M, Junker C, Al-Ansary D, Rieger H, Kummerow C, et al. Calcium microdomains at the immunological synapse: how ORAI channels, mitochondria and calcium pumps generate local calcium signals for efficient T-cell activation. EMBO J (2011) 30:3895–912. doi:10.1038/emboj.2011.289
7. McCarl C-A, Khalil S, Ma J, Oh-hora M, Yamashita M, Jens Roether J, et al. Store-operated Ca2+ entry through ORAI1 is critical for T cell-mediated autoimmunity and allograft rejection. J Immunol (2010) 185:5845–58. doi:10.4049/jimmunol.1001796
8. Jin S, Chin J, Kitson C, Woods J, Majmudar R, Carvajal V, et al. Natural regulatory T cells are resistant to calcium release-activated calcium (CRAC/ORAI) channel inhibition. Int Immunol (2013) 25:1–10. doi:10.1093/intimm/dxt013
9. Putney J. A model for receptor-regulated calcium entry. Cell Calcium (1986) 7:1–12. doi:10.1016/0143-4160(86)90026-6
10. Dolmetsch R, Lewis R. Signaling between intracellular Ca2+ stores and depletion-activated Ca2+ channels generates [Ca2+]i oscillations in T lymphocytes. J Gen Physiol (1994) 103:365–88. doi:10.1085/jgp.103.3.365
11. Guse AH, Tsygankov AY, Weber K, Mayr GW. Transient tyrosine phosphorylation of human ryanodine receptor upon T cell stimulation. J Biol Chem (2001) 276:34722–7. doi:10.1074/jbc.M100715200
12. Bautista D, Hoth M, Lewis R. Enhancement of calcium signalling dynamics and stability by delayed modulation of the plasma-membrane calcium-ATPase in human T cells. J Physiol (2002) 541:877–94. doi:10.1113/jphysiol.2001.016154
13. Bautista D, Lewis R. Modulation of plasma membrane calcium-ATPase activity by local calcium microdomains near CRAC channels in human T cells. J Physiol (2004) 556:805–17. doi:10.1113/jphysiol.2003.060004
14. Fomina A, Fanger C, Kozak A, Cahalan M. Single channel properties and regulated expression of Ca2+ release-activated Ca2+ (CRAC) channels in human T cells. J Cell Biol (2000) 150:1435–44. doi:10.1083/jcb.150.6.1435
15. Dadsetan S, Zakharova L, Molinski T, Fomina A. Store-operated Ca2+ influx causes Ca2+ release from the intracellular Ca2+ channels that is required for T cell activation. J Biol Chem (2008) 283:12512–9. doi:10.1074/jbc.M709330200
16. Guse AH, da Silva CP, Berg I, Skapenko AL, Weber K, Heyer P, et al. Regulation of calcium signalling in T lymphocytes by the second messenger cyclic ADP-ribose. Nature (1999) 398:70–3. doi:10.1038/18024
17. Guse A. Linking NAADP to ion channel activity: a unifying hypothesis. Sci Signal (2012) 5. doi:10.1126/scisignal.2002890
18. Gasser A, Bruhn S, Guse A. Second messenger function of nicotinic acid adenine dinucleotide phosphate revealed by an improved enzymatic cycling assay. J Biol Chem (2006) 281:16906–13. doi:10.1074/jbc.M601347200
19. Lewis R. Calcium oscillations in T-cells: mechanisms and consequences for gene expression. Biochem Soc Trans (2003) 31:925–9. doi:10.1042/BST0310925
20. Wu M, Buchanan J, Luik R, Lewis R. Ca2+ store depletion causes STIM1 to accumulate in ER regions closely associated with the plasma membrane. J Cell Biol (2006) 174:803–13. doi:10.1083/jcb.200604014
21. Parekh A. Store-operated CRAC channels: function in health and disease. Nat Rev Drug Discovery (2010) 9:399–410. doi:10.1038/nrd3136
22. Martin G, Yun Y, Conforti L. Modulation of T cell activation by localized K+ accumulation at the immunological synapse: a mathematical model. J Theor Biol (2012) 300:173–82. doi:10.1016/j.jtbi.2012.01.018
23. Lewis R, Cahalan M. Mitogen-induced oscillations of cytosolic Ca2+ and transmembrane Ca2+ current in human leukemic T cells. Cell Regul (1989) 1:99–112.
24. Hoth M, Penner R. Depletion of intracellular calcium stores activates a calcium current in mast cells. Nature (1992) 355:353–6. doi:10.1038/355353a0
25. Bergling S, Dolmetsch R, Lewis R, Keizer J. A fluorometric method for estimating the calcium content of internal stores. Cell Calcium (1998) 23:251–9. doi:10.1016/S0143-4160(98)90123-3
26. Hess S, Oortgiesen M, Cahalan M. Calcium oscillations in human T and natural killer cells depend upon membrane potential and calcium influx. J Immunol (1993) 150:2620–33.
27. Kowalewski J, Uhlen P, Kitano H, Brismar H. Modeling the impact of store-operated Ca2+ entry on intracellular Ca2+ oscillations. Math Biosci (2006) 204:232–49. doi:10.1016/j.mbs.2006.03.001
28. Chen X, Li C, Wang P, Li M, Wang W. Dynamic simulation of the effect of calcium-release activated calcium channel on cytoplasmic Ca2+ oscillation. Biophys Chem (2008) 136:87–95. doi:10.1016/j.bpc.2008.04.010
29. Liu W, Tang F, Chen J. Designing dynamical output feedback controllers for store-operated Ca2+ entry. Math Biosci (2010) 228:110–8. doi:10.1016/j.mbs.2010.08.013
30. Meyer-Hermann M. The electrophysiology of the beta-cell based on single transmembrane protein characteristics. Biophys J (2007) 93:2952–68. doi:10.1529/biophysj.107.106096
31. Zylinska L, Soszynski M. Plasma membrane Ca2+-ATPase in excitable and nonexcitable cells. Acta Biochim Pol (2000) 47:529–39.
32. Kozak A, Kerschbaum H, Cahalan M. Distinct properties of CRAC and MIC channels in RBL cells. J Gen Physiol (2002) 120:221–35.
33. Prakriya M, Lewis R. Separation and characterization of currents through store-operated CRAC channels and Mg2+-inhibited cation. J Gen Physiol (2002) 119:487–507. doi:10.1085/jgp.20028551
34. Luik R, Wang B, Prakriya M, Wu M, Lewis R. Oligomerization of STIM1 couples ER calcium depletion to CRAC channel activation. Nature (2008) 454:538–42. doi:10.1038/nature07065
35. Wuytack F, Papp B, Verboomen H, Raeymaekers L, Dode L, Bobe R, et al. A sarco/endoplasmic reticulum Ca(2+)-ATPase 3-type Ca2+ pump is expressed in platelets, in lymphoid cells, and in mast cells. J Biol Chem (1994) 14:1410–6.
36. Meyer T, Holowka D, Stryer L. Highly cooperative opening of calcium channels by inositol 1,4,5-trisphosphate. Science (1988) 240:653–6. doi:10.1126/science.2452482
37. Mak D-OD, McBride S, Foskett JK. Inositol 1,4,5-tris-phosphate activation of inositol tris-phosphate receptor Ca2+ channel by ligand tuning of Ca2+ inhibition. Proc Natl Acad Sci U S A (1998) 95:15821–5. doi:10.1073/pnas.95.26.15821
38. Foskett K, White C, Cheung K-H, Mak D-OD. Inositol trisphosphate receptor Ca2+ release channels. Physiol Rev (2007) 87:593–658. doi:10.1152/physrev.00035.2006
39. Guse AH. Second messenger signaling: multiple receptors for NAADP. Curr Biol (2009) 19:521–3. doi:10.1016/j.cub.2009.05.045
40. Schwarzmann N, Kunerth S, Weber K, Mayr G, Guse A. Knock-down of the type 3 ryanodine receptor impairs sustained Ca2+ signaling via the T cell receptor/CD3 complex. J Biol Chem (2002) 277:50636–42. doi:10.1074/jbc.M209061200
41. Hohenegger M, Suko J, Gscheidlinger R, Drobny H, Zidar A. Nicotinic acid-adenine dinucleotide phosphate activates the skeletal muscle ryanodine receptor. Biochem J (2002) 367:423–31. doi:10.1042/BJ20020584
42. Kunerth S, MF L, Schwarzmann N, Gu X, Huang L, Yang Z, et al. Amplification and propagation of pacemaker Ca2+ signals by cyclic ADP-ribose and the type 3 ryanodine receptor in T cells. J Cell Sci (2004) 117:2141–9. doi:10.1242/jcs.01063
43. Dammermann W, Guse A. Functional ryanodine receptor expression is required for NAADP-mediated local Ca2+ signaling in T-lymphocytes. J Biol Chem (2005) 280:21394–9. doi:10.1074/jbc.M413085200
44. Persechini A, Cronk B. The relationship between the free concentrations of Ca2+ and Ca2+-calmodulin in intact cells. J Biol Chem (1999) 274:6827–30. doi:10.1074/jbc.274.11.6827
45. Tansey M, Luby-Phelps K, Kamm K, Stull J. Ca(2+)-dependent phosphorylation of myosin light chain kinase decreases the Ca2+ sensitivity of light chain phosphorylation within smooth muscle cells. J Biol Chem (1994) 269:9912–20.
46. Kakiuchi S, Yasuda S, Yamazaki R, Teshima Y, Kanda K, Kakiuchi R, et al. Quantitative determinations of calmodulin in the supernatant and particulate fractions of mammalian tissues. J Biochem (1982) 92:1041–8.
47. Mogami H, Gardner J, Gerasimenko O, Camello P, Petersen O, Tepikin A. Calcium binding capacity of the cytosol and endoplasmic reticulum of mouse pancreatic acinar cells. J Physiol (1999) 15:463–7. doi:10.1111/j.1469-7793.1999.0463p.x
48. Sanchez E, Lewis K, Danna B, Kang C. High-capacity Ca2+ binding of human skeletal calsequestrin. J Biol Chem (2012) 287:11592–601. doi:10.1074/jbc.M111.335075
49. Baksh S, Michalak M. Expression of calreticulin in Escherichia coli and identification of its Ca2+ binding domains. J Biol Chem (1991) 266:21458–65.
50. Vandekaetsbeek I, Vangheluw P, Raeymaekers L, Wuytack F. The Ca2+ pumps of the endoplasmic reticulum and Golgi apparatus. Cold Spring Harbor Perspect Biol (2011) 3.
51. Ishida Y. Lack of voltage sensitive potassium channels and generation of membrane potential by sodium potassium ATPase in murine T lymphocytes. J Immunol (1993) 151:610–20.
52. Verheugen J, Vijverberg H, Oortgiesen M, Cahalan M. Voltage-gated and Ca(2+)-activated K+ channels in intact human T lymphocytes. Noninvasive measurements of membrane currents, membrane potential, and intracellular calcium. J Gen Physiol (1995) 105:765–94. doi:10.1085/jgp.105.6.765
53. Launay P, Cheng H, Srivatsan S, Penner R, Fleig A, Kinet J-P. TRPM4 regulates calcium oscillations after T cell activation. Science (2004) 306:1374–7. doi:10.1126/science.1098845
54. Taylor C, Dale P. Intracellular Ca2+ channels – a growing community. Mol Cell Endocrinol (2012) 353:21–8. doi:10.1016/j.mce.2011.08.028
55. Mahrl M, Schuster S, Brumen M, Heinrich R. Modelling the interrelations between calcium oscillations and ER membrane potential oscillations. Biophys Chem (1997) 1622:221–39.
56. Kono M, Takagi Y, Kawauchi S, Wada A, Mirikawa T, Funakoshi K. Non-activated T and B lymphocytes become morphologically distinguishable after detergent treatment. Cytometry A (2013) 83A:396–402. doi:10.1002/cyto.a.22262
57. Alberts B, Bray D, Lewis J, Raff M, Roberts K, Walter P. The Molecular Biology of the Cell. 3rd ed. New York: Garland (1994).
58. Gentet LJ, Stuart GJ, Clements JD. Direct measurement of specific membrane capacitance in neurons. Biophys J (2000) 79:314–20. doi:10.1016/S0006-3495(00)76293-X
59. Goepel S, Zhang Q, Eliasson L, Ma X, Galvanovskis J, Kanno T, et al. Capacitance measurements of exocytosis in mouse pancreatic alpha-, beta- and delta-cells within intact islets of Langerhans. J Physiol (2004) 556:711–26. doi:10.1113/jphysiol.2003.059675
60. Grissmer S, Nguyen A, Cahalan M. Calcium-activated potassium channels in resting and activated human T lymphocytes. J Gen Physiol (1993) 102:601–30. doi:10.1085/jgp.102.4.601
61. Zweifach A, Lewis R. Mitogen-regulated Ca2+ current of T lymphocytes is activated by depletion of intracellular Ca2+ stores. Proc Natl Acad Sci U S A (1993) 90:6295–9. doi:10.1073/pnas.90.13.6295
62. Zweifach A, Lewis R. Slow calcium-dependent inactivation of depletion-activated calcium current. J Biol Chem (1995) 270:14445–51. doi:10.1074/jbc.270.24.14445
63. Bezprozvanny Y, Watras J, Ehrlich BE. Bell-shaped calcium-response curves of Ins(1,4,5)P3- and calcium-gated channels from endoplasmic reticulum of cerebellum. Nature (1991) 351:751–4. doi:10.1038/351751a0
64. Taylor CW, Tovey SC. IP(3) receptors: toward understanding their activation. Cold Spring Harb Perspect Biol (2010) 2:a004010. doi:10.1101/cshperspect.a004010
65. De Young GW, Keizer J. A single-pool ionositol 1,4,5-trisphosphate-receptor-based model for agonist-stimulated oscillations in Ca2+ concentration. Proc Natl Acad Sci U S A (1992) 89:9895–9. doi:10.1073/pnas.89.20.9895
66. Guse AH, Roth E, Emmrich F. D-myo-inositol 1,3,4,5-tetrakisphosphate releases Ca2+ from crude microsomes and enriched vesicular plasma membranes, but not from intracellular stores of permeabilized T-lymphocytes and monocytes. Biochem J (1992) 288:489–95.
67. Sneyd J, Falcke M. Models of the inositol trisphosphate receptor. Prog Biophys Mol Biol (2005) 89:207–45. doi:10.1016/j.pbiomolbio.2004.11.001
68. Mak D-OD, Foskett JK. Single-channel kinetics, inactivation, and spatial distribution of inositol trisphosphate (IP3) receptors in xenopus oocyte nucleus. J Gen Physiol (1997) 109:571–87. doi:10.1085/jgp.109.5.571
69. Marchant JS, Taylor CW. Rapid activation and partial inactivation of inositol trisphophate receptors by inositol trisphophate. Biochemistry (1998) 37:11524–33. doi:10.1021/bi980808k
70. Meyer T, Wensel T, Stryer L. Kinetics of calcium channel opening by inositol 1,4,5-trisphosphate. Biochemistry (1990) 29:32–7. doi:10.1021/bi00453a004
71. Missiaen L, Parys JB, Weidema AF, Sipma H, Vanlingen S, De Smet P, et al. The bell-shaped Ca2+ dependence of the inositol 1,4,5-trisphosphate-induced Ca2+ release is modulated by Ca2+/calmodulin. J Biol Chem (1999) 274:13748–51. doi:10.1074/jbc.274.20.13748
72. Caride AJ, Penheiter AR, Filoteo AG, Bajzer Z, Enyedi A, Penniston JT. The plasma membrane calcium pump displays memory of past calcium spikes. Differences between isoforms 2b and 4b. J Biol Chem (2001) 276:39797–804.
73. Juhaszova M, Church P, Blaustein MP, Stanley EF. Location of calcium transporters at presynaptic terminals. Eur J Neurosci (2000) 12:839–46. doi:10.1046/j.1460-9568.2000.00974.x
74. Sherman A, Rinzel J, Keizer J. Emergence of organized bursting in clusters of pancreatic beta-cells by channel sharing. Biophys J (1988) 54:411–25. doi:10.1016/S0006-3495(88)82975-8
75. Elwess NL, Filoteo AG, Enyedi A, Penniston JT. Plasma membrane Ca2+ pump isoforms 2a and 2b are unusually responsive to calmodulin and Ca2+. J Biol Chem (1997) 272:17981–6. doi:10.1074/jbc.272.29.17981
76. Caride AJ, Filoteo AG, Penheiter AR, Paszty K, Enyedi A, Penniston JT. Delayed activation of the plasma membrand calcium pump by a sudden increase in Ca2+: fast pumps reside in fast cells. Cell Calcium (2001) 30:49–57. doi:10.1054/ceca.2001.0212
77. Cox JA, Comte M, Stein EA. Activation of human erythrocyte Ca2+-dependent Mg2+-activated ATPase by calmodulin and calcium: quantitative analysis. Proc Natl Acad Sci U S A (1982) 79:4265–9. doi:10.1073/pnas.79.14.4265
78. Graupner M, Erler F, Meyer-Hermann M. A theory of plasma membrane calcium pump stimulation and activity. J Biol Phys (2005) 31:183–206. doi:10.1007/s10867-005-4472-2
79. Forge V, Mintz E, Guillain F. Ca2+ binding to sarcoplasmic reticulum ATPase revisited. II. equilibrium and kinetic evidence for a two-route mechanism. J Biol Chem (1993) 268:10961–8.
80. Wolosker H, Engelender S, Meis LD. Reaction mechanism of the sarcoplasmic reticulum Ca2+-ATPase. Adv Mol Cell Biol (1998) 23A:1–31.
81. Chandrasekera P, Kargacin M, Deans J, Lytton J. Determination of apparent calcium affinity for endogenously expressed human sarco(endo)plasmic reticulum calcium-ATPase isoform SERCA3. Am J Physiol Cell Physiol (2009) 296:C1105–14. doi:10.1152/ajpcell.00650.2008
82. Lytton J, Westlin M, Burk SE, Shull GE, MacLennan DH. Functional comparisons between isoforms of the sarcoplasmic or endoplasmic reticulum family of calcium pumps. J Biol Chem (1992) 267:14483–9.
83. Launay S, Bobe R, Lacabaratz-Porret C, Bredoux R, Kovàcs T, Enouf J, et al. Modulation of endoplasmic reticulum calcium pump expression during T lymphocyte activation. J Biol Chem (1997) 272:10746–50. doi:10.1074/jbc.272.16.10746
84. Storn R, Price K. Differential evolution – a simple and efficient heuristic for global optimization over continuous spaces. J Glob Opt (1997) 11:341–59. doi:10.1023/A:1008202821328
85. Fridlyand LE, Tamarina N, Philipson LH. Modeling of Ca2+ flux in pancreatic beta-cells: role of the plasma membrane and intracellular stores. Am J Phyisol Endocrinol Metab (2003) 285:E138–54.
86. Quintana A, Schwarz E, Schwindling C, Lipp P, Kaestner L, Hoth M. Sustained activity of calcium release-activated calcium channels requires translocation of mitochondria to the plasma membrane. J Biol Chem (2006) 281:40302–9. doi:10.1074/jbc.M607896200
Keywords: T lymphocytes, calcium dynamics, mathematical model, CRAC, endoplasmic reticulum
Citation: Schmeitz C, Hernandez-Vargas EA, Fliegert R, Guse AH and Meyer-Hermann M (2013) A mathematical model of T lymphocyte calcium dynamics derived from single transmembrane protein properties. Front. Immunol. 4:277. doi: 10.3389/fimmu.2013.00277
Received: 30 June 2013; Accepted: 29 August 2013;
Published online: 18 September 2013.
Edited by:
Gergely Toldi, Semmelweis University, HungaryReviewed by:
Pål Olof Westermark, Charité-Universitätsmedizin Berlin, GermanyAmbrus Kaposi, University of Nottingham, UK
Copyright: © 2013 Schmeitz, Hernandez-Vargas, Fliegert, Guse and Meyer-Hermann. This is an open-access article distributed under the terms of the Creative Commons Attribution License (CC BY). The use, distribution or reproduction in other forums is permitted, provided the original author(s) or licensor are credited and that the original publication in this journal is cited, in accordance with accepted academic practice. No use, distribution or reproduction is permitted which does not comply with these terms.
*Correspondence: Michael Meyer-Hermann, Department of Systems Immunology, Helmholtz Centre for Infection Research, Inhoffenstr.7, 38124 Braunschweig, Germany e-mail:bW1oQHRoZW9yZXRpY2FsLWJpb2xvZ3kuZGU=